Article

Columnar-to-Equiaxed Transition on Laser Powder Bed Fusion Ultra-Precision Additive Manufacturing Accuracy and Surface Roughness for Solidified 316L Micro-Lattice Structure

1
School of Mechanical Engineering, Shandong University, Jinan 250061, China
2
State Key Laboratory of Advanced Equipment and Technology for Metal Forming, Shandong University, Jinan 250061, China
3
Key Laboratory of High Efficiency and Clean Mechanical Manufacture of Ministry of Education, Jinan 250061, China
4
Key National Demonstration Center for Experimental Mechanical Engineering Education, Jinan 250061, China
5
School of Mechanical, Electrical & Information Engineering, Shandong University, Weihai 264209, China
*
Author to whom correspondence should be addressed.
Metals 2025, 15(3), 267; https://doi.org/10.3390/met15030267
Submission received: 6 February 2025 / Revised: 26 February 2025 / Accepted: 26 February 2025 / Published: 28 February 2025
(This article belongs to the Special Issue Advances in Laser Processing of Metals and Alloys)

Abstract

:
The improvement of PBF manufacturing accuracy has been an urgent problem to solve. The columnar-to-equiaxed transition of rapid solidification during laser powder bed fusion (L-PBF) has been reported, while its influence on the accuracy and surface roughness of fabricated 316L micro-lattice structures remains to be studied. This study presents a novel fully coupled finite volume method for cellular automata (CA), integrated with response surface methodology (RSM), which is applied to investigate the columnar-to-equiaxed transition influence on the accuracy and surface roughness of ultra-precision additive manufactured 316L lattice structure by L-PBF. It is proven that the higher overlap is identified as the optimal strategy for improving both surface quality and dimensional accuracy. Both the CA model prediction and the experimental results reveal that the effect of latent heat releases from the grain refinement on the adhesion of the surrounding powder is an increment of the surface roughness, while the decrement of the surface quality and accuracy. The overlap strategy is promoted to be the most suitable measure to achieve both high surface quality and manufacturing accuracy. The surface roughness Ra (SP) can rapidly decrease by 68.6%, and the mean diameters decrease by 18.7% under the overlap strategy.

1. Introduction

Due to the inherent process limitations of laser powder bed fusion (L-PBF), lattice structure specimens after one-pass fabrication are subject to surface integrity-related defects, i.e., surface features that are uneven or irregular and deviate from the desired contours of the designed CAD model. The four main contributing factors to surface integrity-related defects are step effect, partially melted powder, puckering effect, and surface cracking [1,2,3,4]. These defects result in higher surface roughness and lower quality and accuracy compared to conventional machining processes (e.g., machining), which in turn affects the mechanical properties of the lattice structure.
The behavior of the melt pool and deposition angles is essential in defining the surface integrity and dimensional accuracy of L-PBF parts. Depending on the orientation of the printing process, the surface of L-PBF parts can be classified as horizontal, top-facing, vertical, and bottom-facing surfaces [5]. During the L-PBF process, the interaction of the laser and powder bed draws raw particles towards the melt pool owing to surface tension, causing the phenomenon of powders adhering on the surface. Melt pools rapidly solidify after laser scanning, leaving the surface with irregular sintering tracks. This unevenness is usually explained by the temperature gradient mechanism, which takes into consideration the characteristics of the top layer undergoing processing as well as the solidified layers underneath [6]. The laser beam heats the top layer rapidly, along with its limited thermal conductivity, resulting in a steep temperature gradient between the melted and solidified regions. Because the melt pool’s expansion is constrained by the surrounding material, the top layer bends away from the laser beam [7].
Solidified metals are composed of grains generated during solidification through various phase transformations, such as primary phase freezing of melts, eutectic coagulation, and encapsulated crystalline changes during cooling [8]. After nucleation, these grains grow in two ways: preferentially along the direction normal to the liquid-phase isotherm (referred to as columnar grain), or suspended in the supercooled liquid (referred to as equiaxed grain). Liu et al. [9] reported that L-PBF fabricated parts show a distinct columnar grain organization (CG) parallel to the forming direction as compared to the equiaxed grain organization (FG) of forged parts. In solidified structures, columnar grain development frequently ends with the formation of an equiaxed zone or band of equiaxed grains, after which columnar-pattern growth resumes. The mechanism seen above is known as the columnar-to-equiaxed transition (CET) [10,11,12]. Although it may also be seen in the eutectic grain structures of impure binary alloys or multi-component alloys, experimental observations and simulations of the transition have typically been limited to the grain structures of primary solid solution grains when examining the CET [12]. These solid solution grains always develop with non-faceted dendritic or cellular interfaces in alloys. When columnar grains freeze, they preferentially align their long axis with a certain crystallographic direction [10]. Nevertheless, equiaxed dendritic grains are arbitrarily oriented. Wang et al. [13] reported that the formation of columnar crystals in L-PBF-ed 316L parts is related to the epitaxial growth mechanism of the grains and the maximum temperature gradient.
Additive manufacturing is a rapid solidification process of alloys. Gu et al. [14] used a phase-field model to demonstrate the switch from solute diffusion-controlled growth to thermal diffusion-controlled growth during rapid solidification front of alloys in additive manufacturing. In the case of large subcooling and high growth rate, a switch between solute diffusion-controlled and thermal diffusion-controlled solidification growth may occur [15]. The switch of the control mechanism manifests itself as a change in the microstructural pattern. The solidification front is fully controlled by thermal diffusion as the solidification rate ultimately equals the heat source’s rate of movement.
The cellular automaton (CA) is a common discrete dynamical system simulation method that can be used to model the preferential growth of cells and dendrites [16]. The volume of finite (VOF) method is an interface tracking method built on a Eulerian grid that can be used to solve the governing equations of heat-flow-solute interactions in multi-physics field transport processes [17]. This indicates that the control volume in the finite volume approach is also the cell in the meta-cellular automaton [18]. Additionally, it is possible to describe the solute transfer between the melt pool body and the inter-dendritic (intercellular) regions.
As we all know, the behavior of melt pools significantly affects the final geometry of the part compared to the designed dimensions, while the geometry also notably affects the thermal history of the parts and the generation of columnar grains [19]. To investigate the scientific explanations for this phenomenon, this study suggests a “two-way” completely coupled cellular automata-finite volume novel method to model the L-PBF process’s solute transport, fluid flow, heat transfer, and microstructural development. The finite volume technique is used to solve the governing equations for thermal-fluid-solute interactions in the multiple physical field transport process, whereas the cellular automaton describes the preferred growth of cells and dendrites. Since the solute concentration, flow velocity, temperature, and microstructure are all directly related on the same set of computational grids, the cells in a cellular automaton are also regarded as the control volumes in the infinite volume technique. This enables the solute to transfer between the bulk melt pool and the intercellular regions. Therefore, the suggested model framework may be used to represent the “two-way coupling” between thermal-fluid coupling fields and dendrite growth at the melt pool scale. The response surface method (RSM) is employed to verify the reliability of the model. Based on the combination of simulated results and experimental results, the process optimization strategy is proposed to reduce the surface roughness and manufacturing errors.

2. Modeling Methods and Experiments

2.1. Modeling of Rapid Solidification

A Gaussian distribution was adopted to model nucleation in the melt pool [20]. Each nucleus’ critical undercooling is determined at random based on the average nucleation supercooling of the alloy and its corresponding standard deviation [21]:
d n l d ( Δ T ) = n max 2 π Δ T σ exp 1 2 Δ T Δ T a v e Δ T σ 2
where nmax denotes the maximum grain density, Δ T σ equals the standard deviation of the nucleation undercooling, and Δ T a v e equals the average value of the nucleation undercooling.
In the meta-cellular automata model, three states are defined: liquid, solid, and interfacial solid. The first two phase transitions occur exclusively within the control volume of the interfacial solid. Each time step’s change in the solid volume fraction is determined using the interfacial equilibrium condition [15].
α m f s t = α m Δ f s Δ t = α m f s f s 0 Δ t = α m f l c l c l c l ( 1 k ) 1 Δ t             solidification α m f l c l c l c l c s 1 Δ t                               melting
where k is the solute partition coefficient, the superscript * denotes when the condition of interfacial equilibrium occurs, and the subscript 0 indicates the value of the variable differenced forward by the preceding time step. With the growth of the dendrites, the liquid-phase solute concentration in the interfacial cell increases, and when it is higher than the interfacial equilibrium concentration, it is discharged into the surrounding liquid phase. In addition, when the solid-phase ratio of the interfacial cell reaches 1, the interfacial cell transforms into a solid cell, while the residual liquid-phase solutes are discharged into the liquid phase of the neighboring cell. The partitioning of solute emissions depends on the difference in liquid phase concentration between the neighboring and interfacial cells.
On the other hand, solute elements that are displaced from the solidification front during solute distribution serve as additional solute sources, which then transfer to the melt pool. Taking these effects into account, the solute transport equations in both liquid and solidified metals are formulated as follows.
α m ρ m C l t + ( α m ρ m u C l ) = ( D l α m ρ m C l ) + α m ρ m C l ( 1 k v ) / f l f s t   solidfication α m ρ m ( C l C s ) / f l f s t             melting
α m ρ m f s C s t = ( D s α m ρ m f s C s ) + α m ρ m k C l f s t   solidfication α m ρ m C s f s t             melting
where D represents the solute diffusion coefficient, the subscript l denotes the liquid phase, and s denotes solid phase. The melting process is equivalent to the solidification process in reverse.
The volume control equations are formulated as follows.
α m t + ( α m u ) = 0
P r e c o i l = 0.54 P 0 exp L V M ( T T V ) R T T V α m
Φ = α m Φ m + α gas Φ gas
where ρ represents the density, t denotes time, α is the volume fraction of the fluid phase, u represents the flow rate, and Φ indicates a physical property within every control volume, with the subscripts m and gas referring to metals and gases.
The control equations were formulated as follows.
ρ u t + ( ρ u u ) = p + σ κ α + ( 1 f s ) F b + F d a m p + P r e c o i l
σ ( T ) = σ 0 + σ T T
F b = ρ m α m g β T ( T T ref ) + β C ( C C 0 )
F d a m p = ρ m α m μ 5 S 2 f S 2 ( 1 f S ) 3 u
P r e c o i l = 0.54 P 0 exp L V M ( T T V ) R T T V α m
where u represents dynamic viscosity, p represents pressure, σ denotes surface tension coefficient, and κ denotes the curvature of the gas/metal interface, which is determined by the gradient of the solid phase rate along the solid–liquid interface normal phase [22,23]; Fb indicates thermal-solute buoyancy, fs denotes solid volume fraction, T represents temperature, g represents gravitational acceleration, βC denotes solute expansion coefficient, βT denotes thermal expansion coefficient, Tref represents reference temperature, C0 denotes initial solute concentration, C denotes solute concentration, S denotes the solid–liquid interfacial area per volume, Lv indicates the latent heat of vaporization, P0 denotes ambient pressure, M represents the molecular mass of metal vapor, R represents the universal gas constant, and Tv represents boiling temperature. Fdamp, is calculated using the Kozeny–Carmen equation. The recoil vapor pressure Precoil is also treated as a body force at the gas/metal interface; nevertheless, neither the mass transfer between the liquid metal and the metal vapor nor the vaporized metal phase is taken into consideration.
The L-PBF process uses the enthalpy equation to explain heat transport, which is within four source terms: qlaser, qvap, qlatent, and qrad [24,25,26,27].
ρ u h t + ( ρ u h ) = ( λ T ) + q laser + q v a p + q latent + q rad
q laser = f laser ξ P π r 0 2 exp f ( a + v t a 0 ) 2 + ( r r 0 ) 2 r 0 2 α m 2 ρ c p ¯ ρ m c p m + ρ g c p g
q vap = 0.82 L v M 2 π M R T P 0 exp L v M ( T T v ) R T T v α m 2 ρ c p ¯ ρ m c p m + ρ g c p g
q latent = ρ m α m L d f s d t
q rad = σ s ε ( T 4 T 4 ) α m 2 ρ c p ¯ ρ m c p m + ρ g c p g
where h represents enthalpy, flaser denotes laser power distribution index, λ represents thermal conductivity, P denotes laser power intensity, ξ denotes absorption coefficient, cp represents specific heat, r0 denotes the radius of the laser spot, L represents the latent heat of fusion, v represents laser scanning speed, σs represents the Stefan–Boltzmann constant, ε represents the emissivity of metal. The coordinates (a, r) describe the relative position of the laser spot’s center, while (a0, r0) indicates the initial position of the laser spot.

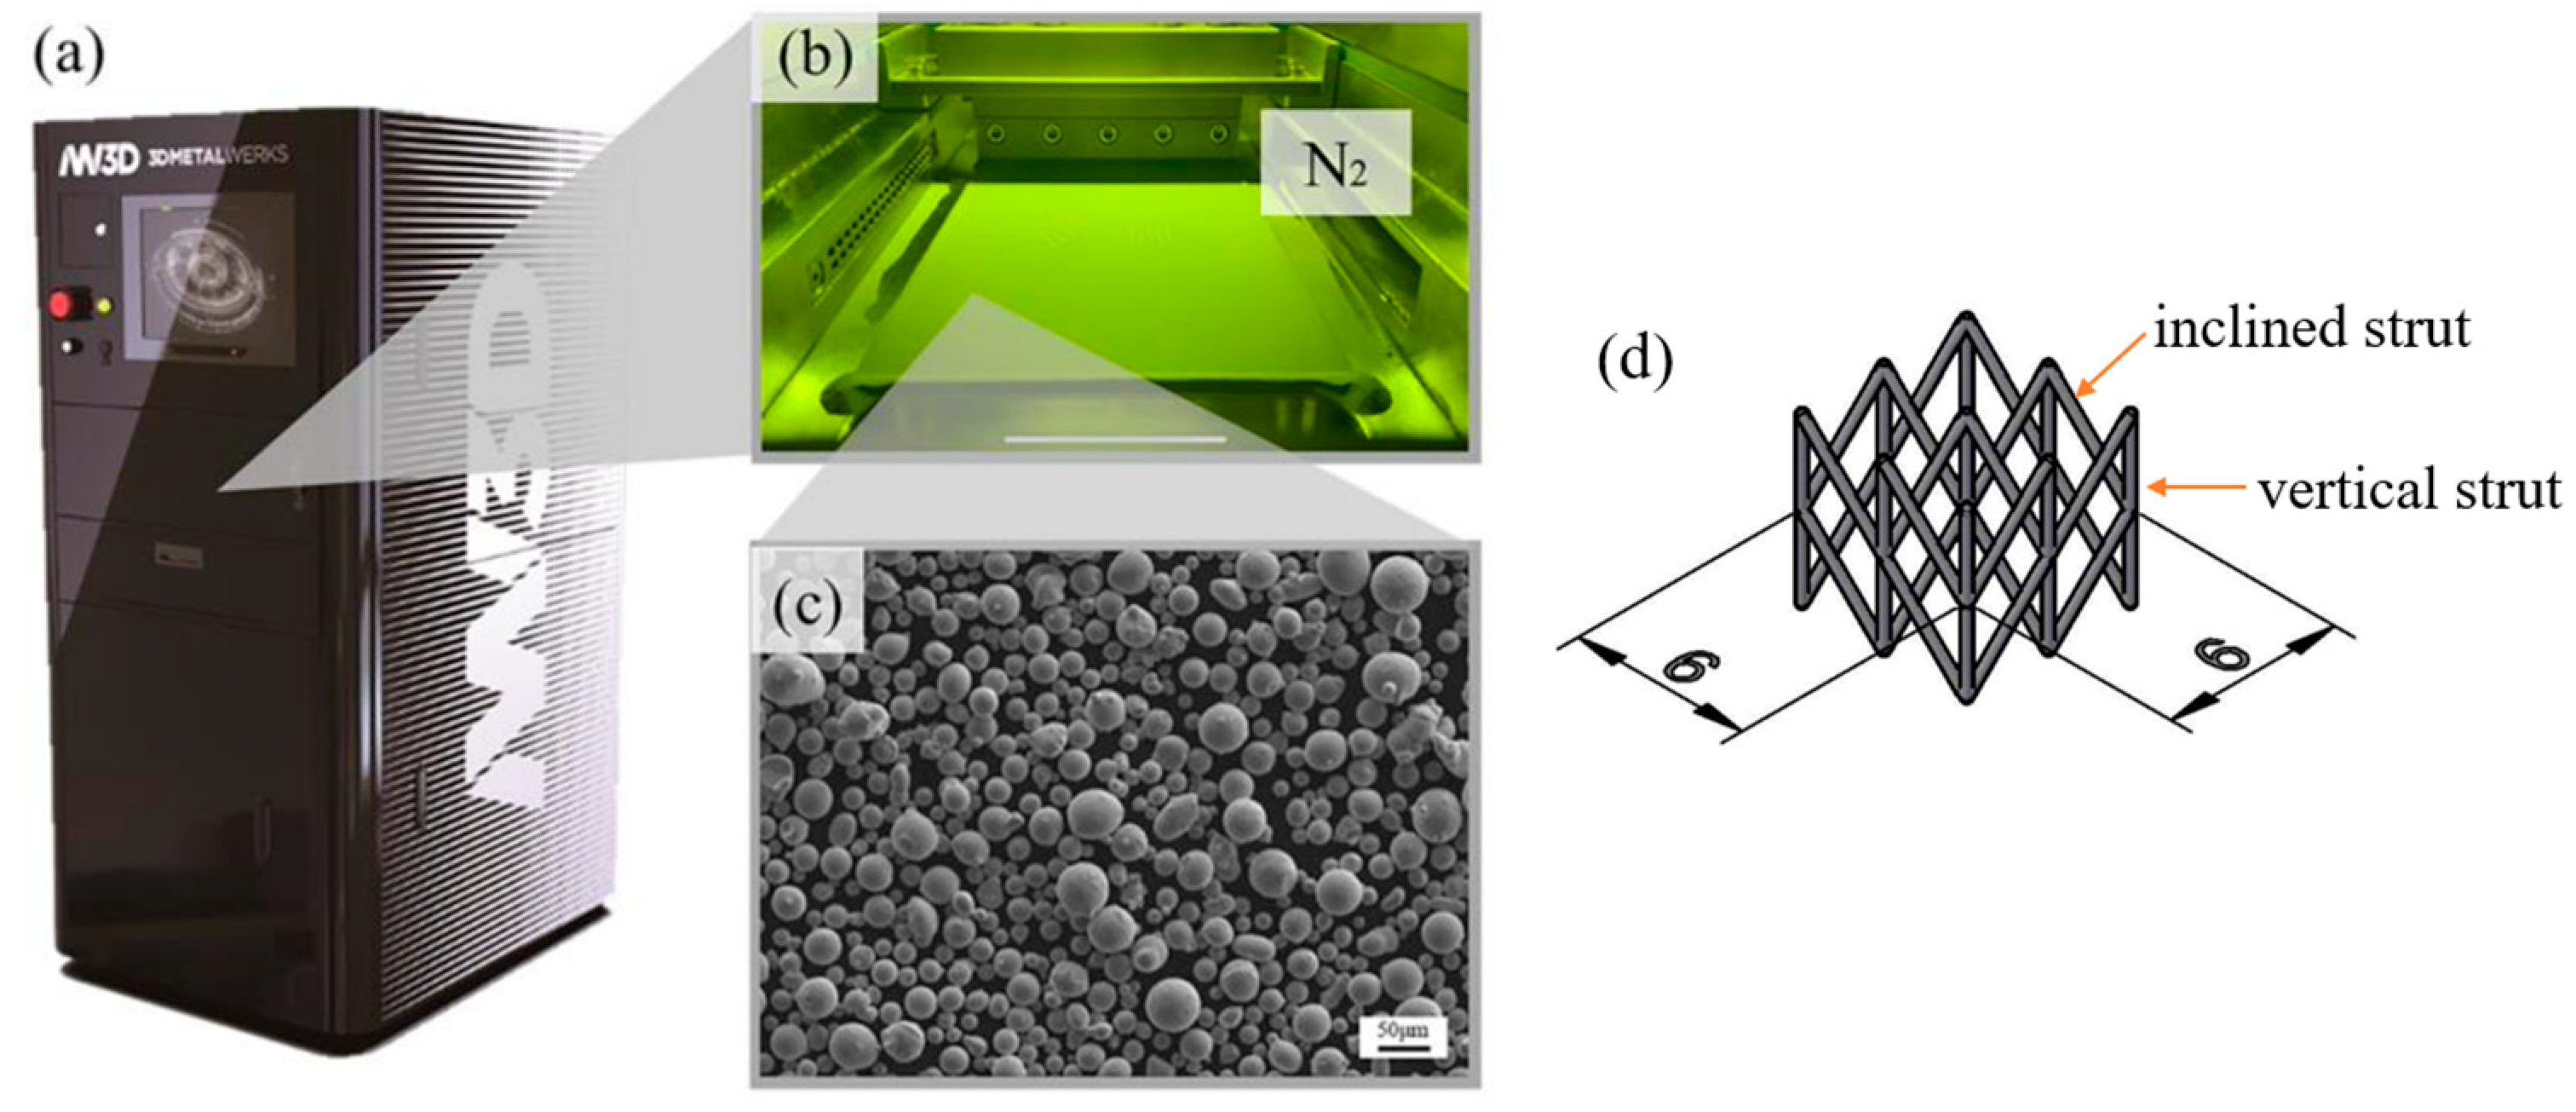
2.2. Material and Experimental Procedures

SS316L lattice specimens (6 mm in length, width, and height, with a targeted strut diameter of 300 μm) are shown in Figure 1d and were manufactured by LPBF additive manufacturing equipment WXL-120E (Sinuowei Automated Science and Technology Co., Ltd., Xiamen, China) (Figure 1a). The forming chamber is filled with nitrogen gas (Figure 1b) to prevent oxidation during the forming process, and the oxygen volume fraction is kept below 0.10%. Gas-atomized 316L stainless steel powder, which is supplied by KotaiLong Alloy Co. (Chengdu, China), has an average particle size of 31.45 μm and ranges in size from 20.67 μm to 52.46 μm. (Figure 1c) is used for the L-PBF specimens’ manufacturing. The chemical composition of the powders is shown in Table 1.
A continuous wave selective laser melting system, depicted in Figure 2, was utilized for the tests. The device has a continuous wave IPG fiber laser with a focus spot size of 50 μm, a wavelength of 1070 nm, and a maximum laser power of 500 W. The layer thickness was set to 30 μm. Owing to equipment constraints, scanning will be completed by filling after contouring. As shown in Table 2, the laser power used for the manufacturing of SS316L lattice specimens is 80–400 W at a scanning speed of 200–1000 mm/s and an overlap of 0–0.08 mm.
To explore the influence of actual controllable parameters on the roughness of different surfaces of the above-mentioned model and the actual size, the response surface method was used to explore the influence of laser power, scanning speed, and scanning overlap on the above-mentioned problems, and linear energy density E (Equation (18)) and linear power focusing F (Equation (19)) were introduced as evaluation indicators affecting the response change law.
E = P v
F = P d
The model described in the response surface modeling section was calibrated using the central composite design. The data analysis was optimized using Stat-Ease Inc. (Minneapolis, MN, USA) Design-Expert software 13.

3. Results and Discussions

3.1. CET Transition Conditions During Melt Solidification of 316L Powder

The L-PBF-ed lattice specimen is demonstrated as Figure 2. Due to the low linear energy density of #9, the powders were only surface sintered without a subsequent adhesion molding process to form a melt pool and then solidify into shape.
The laser parameters applied during L-PBF had a substantial effect on the specimens’ morphology and surface roughness. The surface roughness and 3D height topography of the vertical direction, incline direction, and top direction of L-PBF specimens are shown in Figure 3a–c, respectively. The corresponding measurement directions are indicated in Figure 3e, where the vertical direction and incline directions correspond to the front (or left) view of the vertical strut and inclined strut, respectively. The confocal laser scanning microscope (Keyence VK-X250, Keyence, Osaka, Japan) and VK-X250 Analysis Application were used to measure 3D topography, and measurement results are recorded in Table 3 for subsequent response surface analyses.
Subsequently, SEM images of 14 specimens were taken to observe the surface quality, and a sharp decrease in the number of adherent powders was found in most of the workpieces in the upper half of the struts tilted at an angle of 45 degrees (top view). Figure 3d shows SEM images taken by the JEOL JSM-7800F Field Emission Scanning Electron Microscope (JEOL Ltd., Tokyo, Japan) at a magnification of 100×.
The solidification rate (R) and temperature gradient (G) at the solid–liquid interface determine the modes of solidification and grain refinement [22], and the ability of fresh grains to become equiaxed, which has a close relationship with the CET, is assessed using the morphological factor (G/R). The microstructural evolution of the cellular automata simulations of the single-layer laser melted part is presented in Figure 4. The presence of dendritic growth and varying solidification rates causes a significant variation in the growth type. The growth mechanisms of dendrites vary with time, indicating that the grains grow at the solid–liquid interface at first, then follow the scanning direction, and grow perpendicular to the solid–liquid interface. The heat flow is largely radial, heading toward the melt-pool border. The growth front moves radially from the melt-pool boundary to the melt-pool center because the growth direction is antiparallel to the heat flow because of the large thermal gradient [14]. Both the solidification rate (R) and morphology factor are highest at the top and the tail end of the molten pool, where the temperature gradient (G) is the lowest. As the melting process proceeds, the solidification rate (R) decreases much more than the temperature gradient (G) changes, which leads to an increase in G/R, which is detrimental to the CET transition, and the columnar dendrites continue to grow.
Many studies have observed that columnar grains are a characteristic feature of 316L steel. Nevertheless, the microstructure of a part might vary considerably depending on the process parameters [28,29,30]. The formation of the columnar grain in additive manufacturing is primarily influenced by two key phenomena: epitaxial solidification and the competition between grain growth [31]. Epitaxy is a type of solidification process in which atoms from the melted substance are deposited onto the lattice sites of the partially melted base part [32]. During this process, the structural and crystallographic orientations of the base material’s grains are transferred to the crystals that form at the solid–liquid boundary.
To better analyze the effect of solute diffusion on the CET phenomenon, EBSD analysis was performed on the single-track and overlap zones, and the microstructural characteristics of different specimens were contrasted. Compared to specimen 7, which has the smallest actual size among the 14 groups of specimens, specimen 8 has twice the laser power, and, despite being on the large side of the actual size, the roughness of the upper half-surface of the incline struts is 1/3 that of specimen 7. After resin cold inlay, mechanical grinding and polishing after cutting small pieces, and vibration polishing to release internal residual stresses, specimen 8 was put into the JEOL JSM-7800F Field Emission Scanning Electron Microscope for EBSD analysis using HKL Channel 5 2019 V5.12 software. Figure 5 depicts the inverse pole figure and pole figure of the longitudinal slice of specimen 8 following EBSD analysis. The inverse pole figure clearly shows that the melt pool’s margins, where heat dissipation is quickest along the development direction, are dominated by CG in the center, whereas FG is dominated by FG at the melt pool edges. The weaving is particularly noticeable along the direction of {100}, as seen in the pole figure. The greatest texture indices are 4.82 and 2.62, indicating that the weaving has deteriorated following the interlayer remelting procedure.
Solidification theory explains that the grain structure forms based on the direction of heat flow and the solidification rate of the metal. Temperature variations and material characteristics affect the rate of solidification.
During solidification, a grain’s preferred growth direction in relation to the temperature gradient determines how easily or slowly it grows. In cubic impure metals or alloys, the desired growth direction is {100} [33], which has the fastest growth rate for body-centered cubic and face-centered cubic grains [34]. Grain orientations that are well aligned with the thermal gradient grow faster than those that are misaligned by a certain angle to the direction of heat flow, according to solidification theory.
The selection process is vividly depicted in a single track of AM. At each local point, grain growth preferentially occurs perpendicular to the liquidus isotherm. As a result, columnar grains grow perpendicular to the melt pool boundary towards the center of the melt pool, and grains in the inclined struts grow along the laser scanning direction. This has been shown both experimentally and numerically [35,36], and perfectly explains the partially melted powder sticking distribution in terms of heat dissipation from grain growth.

3.2. Influence of Laser Parameters on Lattice Structure Fabrication Accuracy

The MANOVA (Multivariate ANOVA) for the model, which includes three dependent variables: vertical mean diameter, incline mean diameter, and incline top roughness, is shown in Table 4, Table 5 and Table 6.
The closer the F-value ratio is to 1, the less likely it is that the response output is significantly impacted by every factor [37]. In Table 4, Table 5 and Table 6, the F-values are 26.52, 31.02, and 36.40, respectively, which indicates that the model for the responses to the three factors is significant. The model’s terms significantly impact the response output when the p-value is less than 0.05. The p-values for the model are 0.0032, 0.0008, and 0.0065, respectively, which shows that the model is significant as well.
The final equation of the model for the vertical mean diameter is presented in Equation (23) as follows:
vertical   mean   diameter = 2043.36373 4.99976 x p 4.11546 x v 5948.34479 x d + 0.013675 x p x v + 25.69531 x p x d + 0.002949 x v 2 0.015878 x p x v x d + 1.55351 × 10 6 x p 2 x v 0.00001 x p x v 2
where xp represents laser power, xv represents scan speed, and xd represents overlap.
The final equation of the model for the incline top roughness is presented in Equation (21) as follows:
incline   top   roughness = 10.64719 + 0.080519 x p 0.017210 x v + 1067.81156 x d + 0.000381 x p x v 9.28492 x p x d + 0.000281 x p x v x d 1.08687 × 10 6 x p 2 x v + 0.017084 x p 2 x d
And the final equation of the model for the incline mean diameter is presented in Equation (22) as follows:
incline   mean   diameter = 250.79913 2.74351 x p 1.79991 x v 10279.70784 x d + 0.002971 x p x v + 76.82566 x p x d + 0.001756 x v 2 9777.76289 x d 2 + 0.000012 x p 2 x v 0.145220 x p 2 x d 6.41650 × 10 6 x p x v 2
Figure 6 depicts the random distribution of the normal probability plot for vertical mean diameter, incline top surface, and incline mean diameter. The normal probability plot helps check the statistical assumptions used in data analysis. This figure compares the data to a normal distribution. It is used in conjunction with the standardized residuals in this regression model to determine if the error component is regularly distributed [38]. All three responses’ normal plots are almost linear, suggesting a high fit between the model and the experimental data and normally distributed residuals.
Figure 7 shows the comparative analysis between the predicted and actual values of vertical mean diameter, incline top roughness, and incline mean diameter, respectively. Every point was dispersed across the regression prediction equation, showing that the projected values’ error was negligible. This validated the suggested model’s accuracy.
The plots above deduce that the model is adequate for describing manufacturing accuracy since the statistical model has a strong connection with the experimental data. The vertical mean diameter response is represented by a 2D contour plot in Figure 8. Consequently, the stationary point has the optimal vertical mean diameter. The variations in vertical mean diameter value are more sensitive to laser power than the other two factors.
The 3D surfaces for vertical mean diameter are shown in Figure 9. As shown on the 3D surface, vertical mean diameter decreases with decreasing laser power, which affects it independently of the other two factors. Nevertheless, the effect of overlap on the vertical mean diameter is more linear than that of scan speed. Vertical mean diameter decreases with increasing overlap. Based on the above law, the most effective way to reduce the vertical mean diameter is to reduce the laser power while increasing the overlap.
With the priority of ensuring that the minimum vertical mean diameter prediction is obtained, it is observed that the optimized parameter set is equally significant in predicting the mean diameter of the inclined struts and the top surface roughness of the inclined struts. In the interaction of laser power and scanning speed, smaller values of linear energy density E = P v have a positive effect on improving the actual fabrication size enlargement, whereas too low a linear energy density affects the normal melting of the powder and the formation of the melt pool, which reduces the formability of the lattice structure; whereas larger values of linear energy density have a positive effect on improving the top surface roughness of incline struts. Under the interaction of laser power and scanning overlap, the input laser power should be reduced as much as possible under the premise of using high scanning overlap.
Figure 10 and Figure 11 show the 2D contour plot and 3D surface plots for incline top roughness, respectively. Incline top roughness decreases with increasing laser power and overlap, while with decreasing scan speed. The reason for this situation is that as the laser power and overlap increase, the interlayer powder remelting increases, which helps to reduce the surface roughness of the upper surface.
The same law is obtained for both parameter groups of the model: the larger the value of linear energy density E = P v , the smaller the incline top roughness, which requires increasing the input laser power while reducing the scanning speed; the larger the value of linear power focus F = P d , the smaller the incline top roughness, which requires increasing the input laser power and overlap.
Figure 12 and Figure 13 show the 2D contour graphs and 3D surface graphs for incline mean diameter, respectively. These two sets of graphs and plots show results that are consistent with the pattern of influence of the three factors on the vertical mean diameter, which means that reducing laser power and promoting the overlap strategy are helpful in reducing the actual diameter of the struts to be closer to the model diameter. Contrarily, laser power needs to be increased moderately to reduce the surface roughness.
To determine the ideal condition taking into account all replies, the desirability function is utilized, as indicated in Equation (23).
D = d 1 r 1 × d 2 r 2 × d 3 r 3 1 Σ r i = i = 1 n d i r i 1 Σ r i
where D is the desirability value, di represents the desirability function for each response, n is the number of responses, and ri denotes the importance of the corresponding factor. The desirability value varies from 0 to 1, with a number closer to 1 indicating more desirability. If any answer deviates from the intended objectives or boundaries, the entire desirability function becomes 0.
Figure 14 displays the desirability graphs for each element. The optimal cutting conditions with a combined desirability value of 0.743 were P = 377.157 w, v = 200 mm/s, and d = 0.08 mm. Figure 15 shows the solution for the input factor and response variables.
From the results of the RSM experiments, it can be concluded that to obtain a higher quality surface, it is necessary to increase the input laser energy density, but this will also inevitably increase the manufacturing error. In response to this, an aggressive overlap strategy, i.e., increasing the melt pool edge overlap, is required for interpolation.

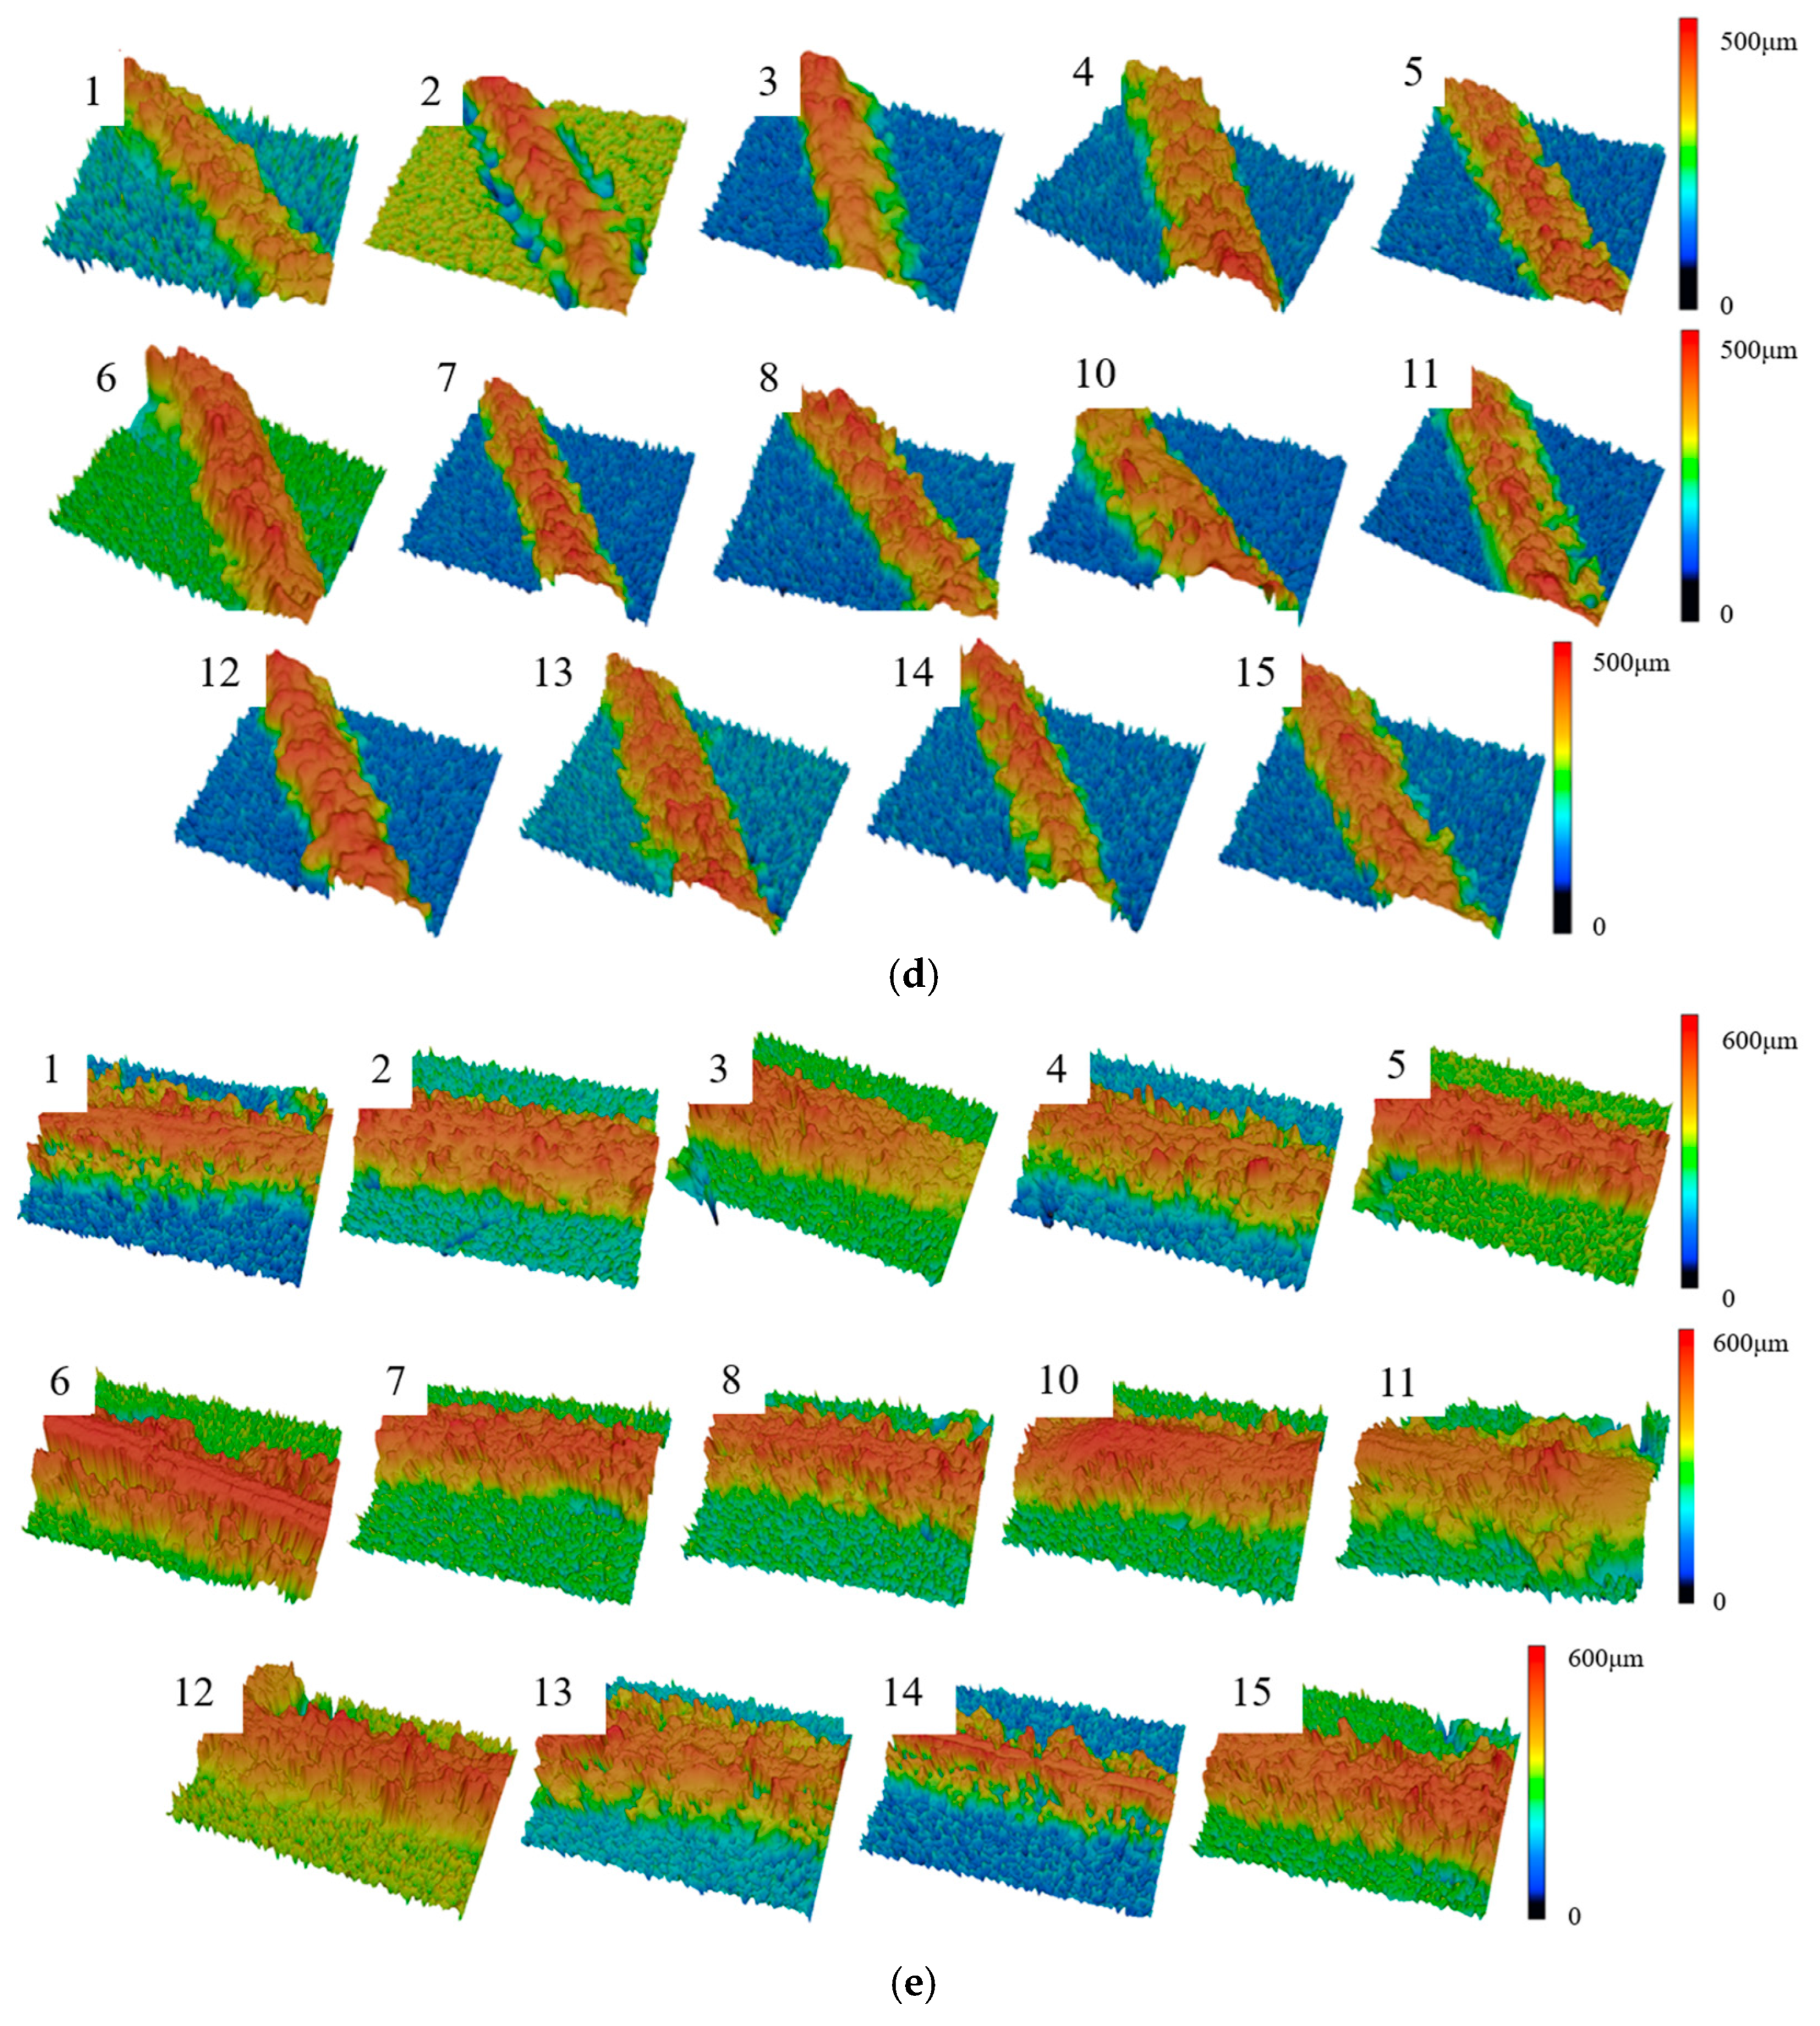
3.3. Microgranular Histograms of Experimental Specimen Under Overlap Variation

When increasing the laser power and decreasing the scanning speed to increase the melt pool width to reduce the surface roughness has a large impact on the forming dimensions, the use of a more optimized overlap strategy seems to be the preferred option. Increasing the melt pool overlap by spot compensation is the more commonly used strategy. Figure 16 shows the pole figure and inverse pole figure of specimens 13–15, which show that with the increase of overlap (13 is the smallest and 14 is the largest), the top surface roughness decreases by 68.6% from 14.53 μm to 4.26 μm, and the actual fabricated size is obviously reduced by 18.7%. The key is that the grain weave orientation tends to be more towards the direction of {100}, and the maximal texture index is also gradually increased, which indicates the obvious improvement of the interlayer remelting. And it can be observed that the splashing of the melt pool and the gravity of the powder itself lead to heterogeneous nucleation in the region at the edge of the melt pool in the constitutionally undercooled zone at low energy density input, which hinders the growth of the columnar grain.
Furthermore, this study focuses on the novel method under experimental settings rather than a specific manufacturing situation, which might be suitable for various alloys within the range of options for industrial conditions, such as Ti6Al4V, Inconel 718, AlSi10Mg, etc. However, due to the circumstances and the factors that are considered limited due to industrial relevance, the overlap strategy should be subject to special study in the real industrial process.

4. Conclusions

In this study, a novel fully coupled finite volume method for cellular automata combining response surface methods to investigate the influence of columnar-to-equiaxed transition during rapid solidification of selective laser melting on the accuracy and surface roughness of L-PBF fabricated 316L lattice structure. The main conclusions of this study may be stated as follows:
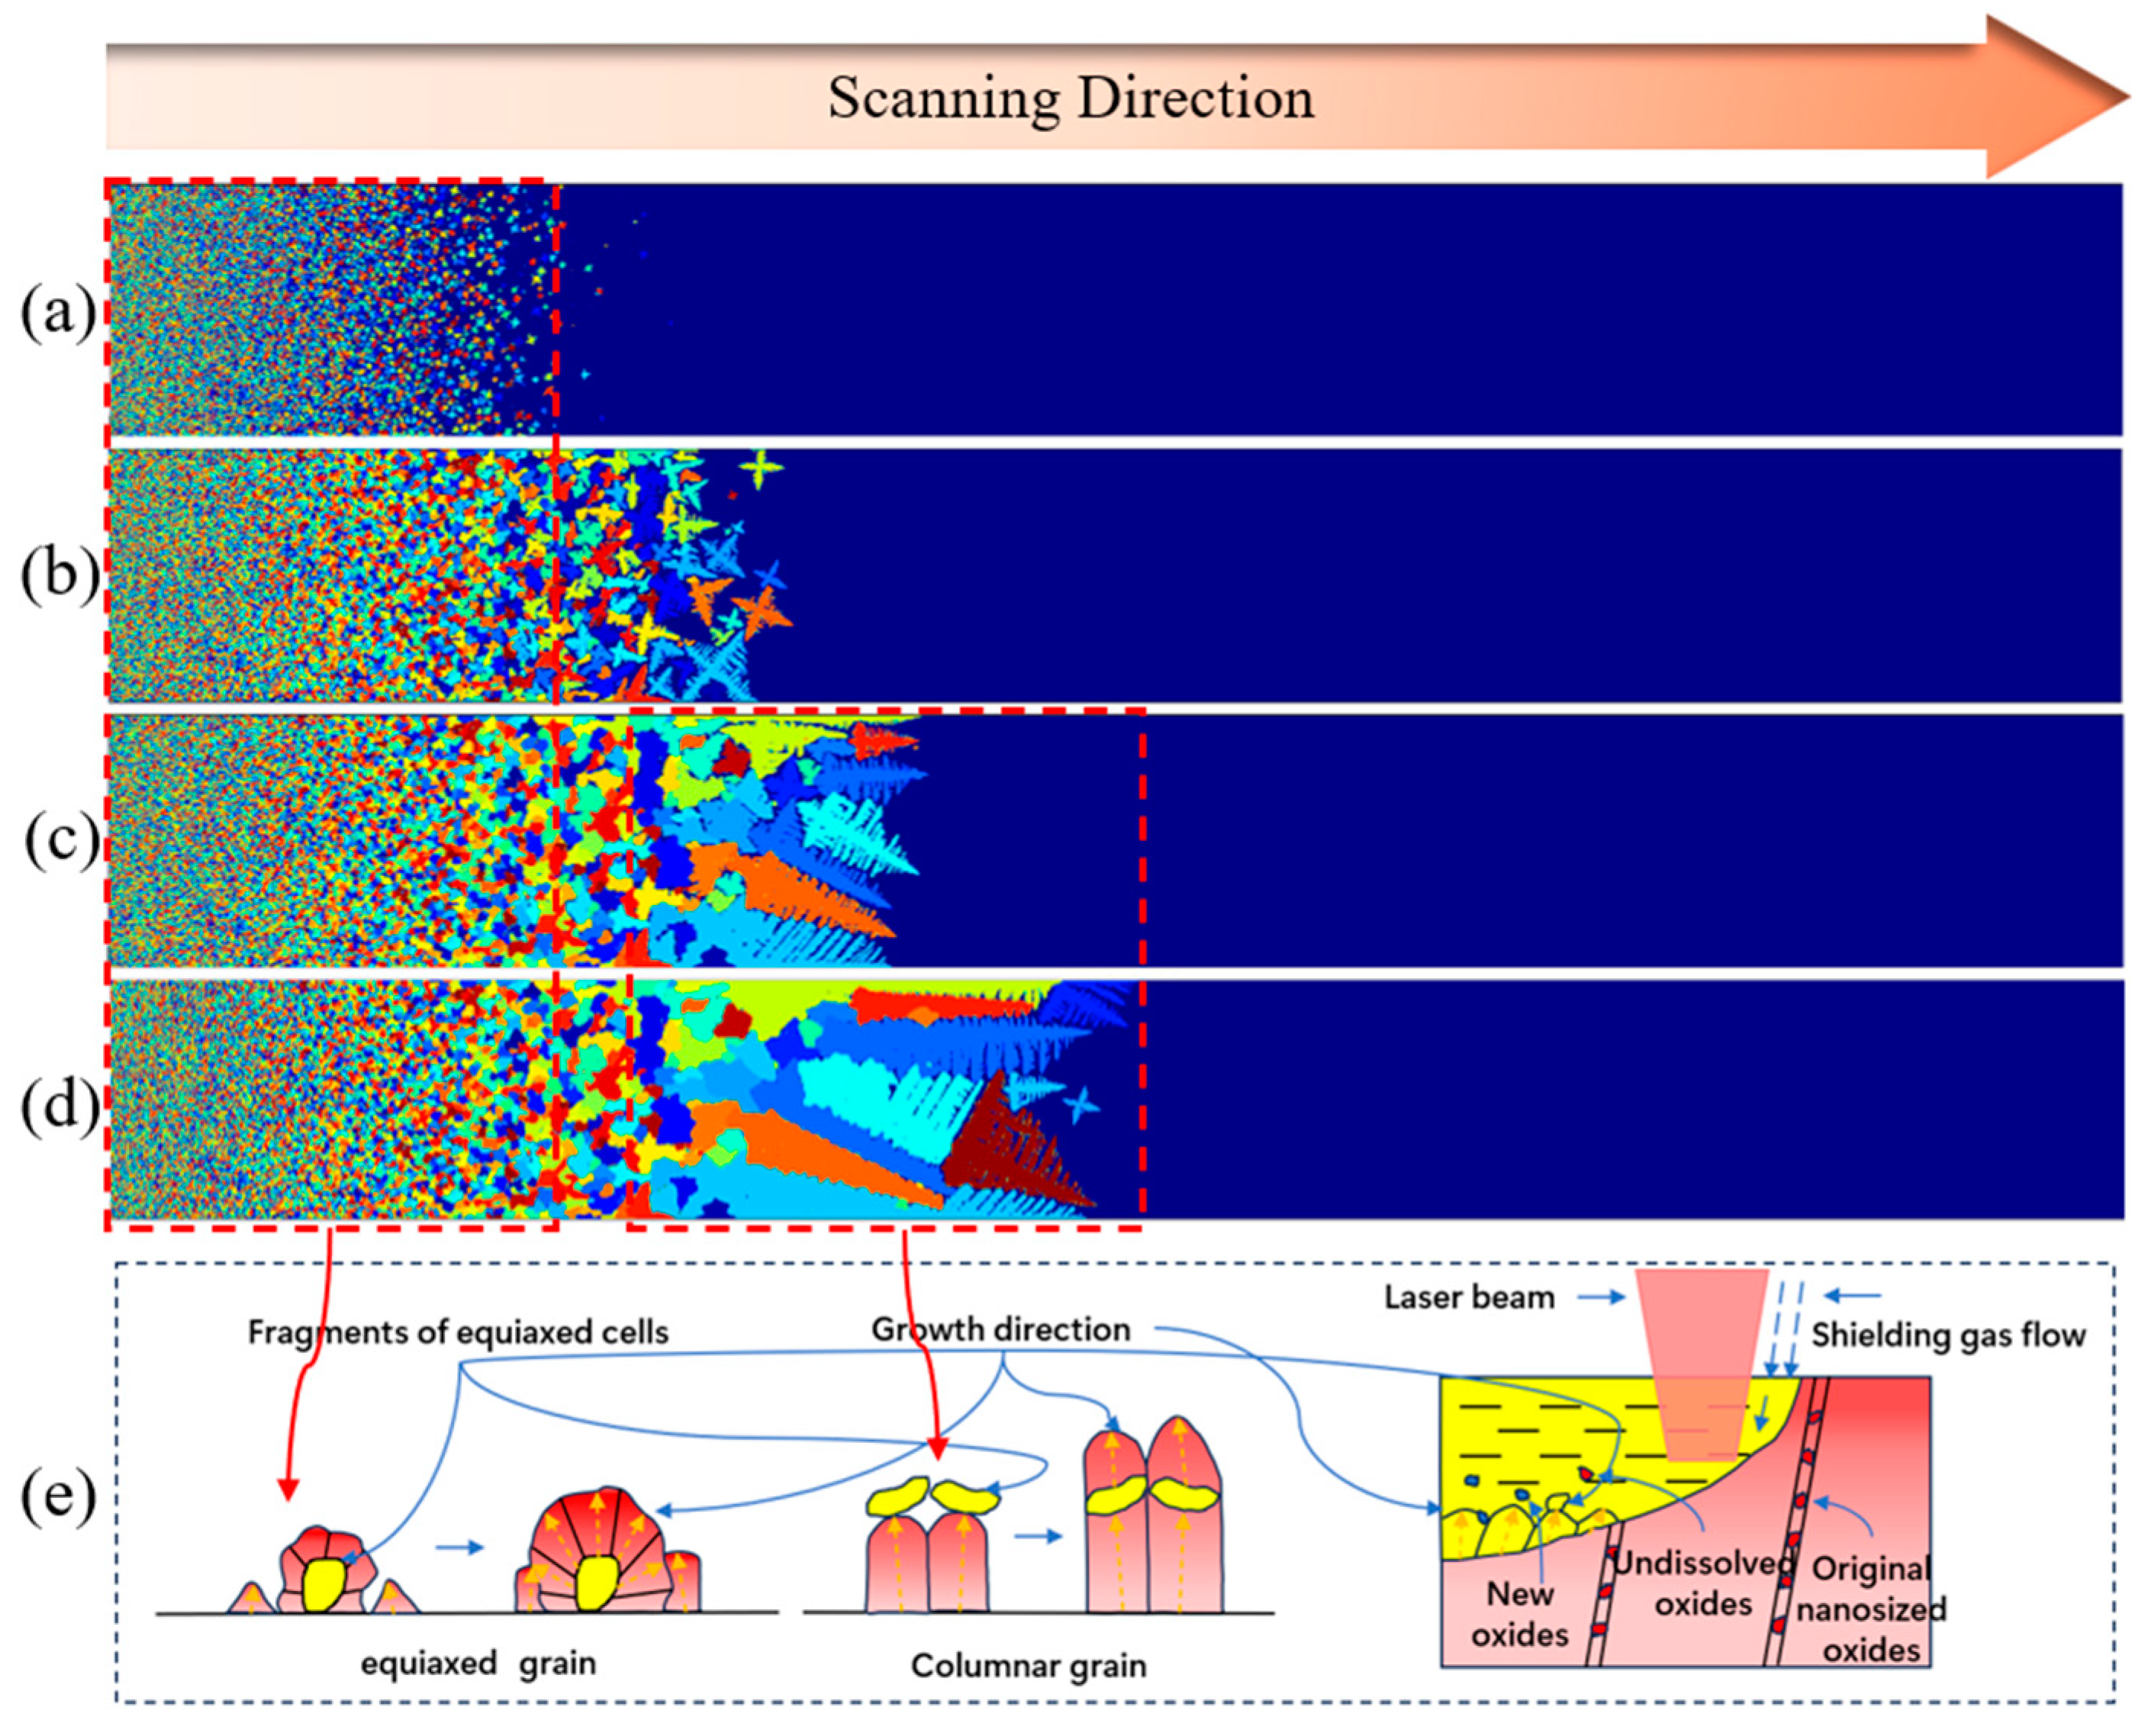
  • In additive manufacturing (AM), where grain growth in a single track shows a consistent pattern: columnar grains grow perpendicular to the melt pool boundary towards the center, while grains in inclined regions grow along the laser movement direction. This pattern has been supported by both experimental and numerical studies and provides a comprehensive explanation for the distribution of partially melted powder in AM, as it correlates with heat dissipation from grain growth. The combination of gravity and splashing causes part of the incompletely melted powder to come to the lower and middle parts of the fabrication layer, resulting in a lower solidification rate in the lower and middle parts of the layer, coupled with a sharp decrease in the energy density at the forming edges, which is conducive to the heterogeneous nucleation of the constitutionally undercooled zone and limits the growth of columnar grains. The formation of equiaxed grains is accompanied by the diffusion of heat along the dendrite axis, that is, a large amount of latent heat release, which will cause more adhesion of the surrounding unmolten powder, thus increasing the surface roughness of the component, reducing the surface quality of the component, and manufacturing accuracy.
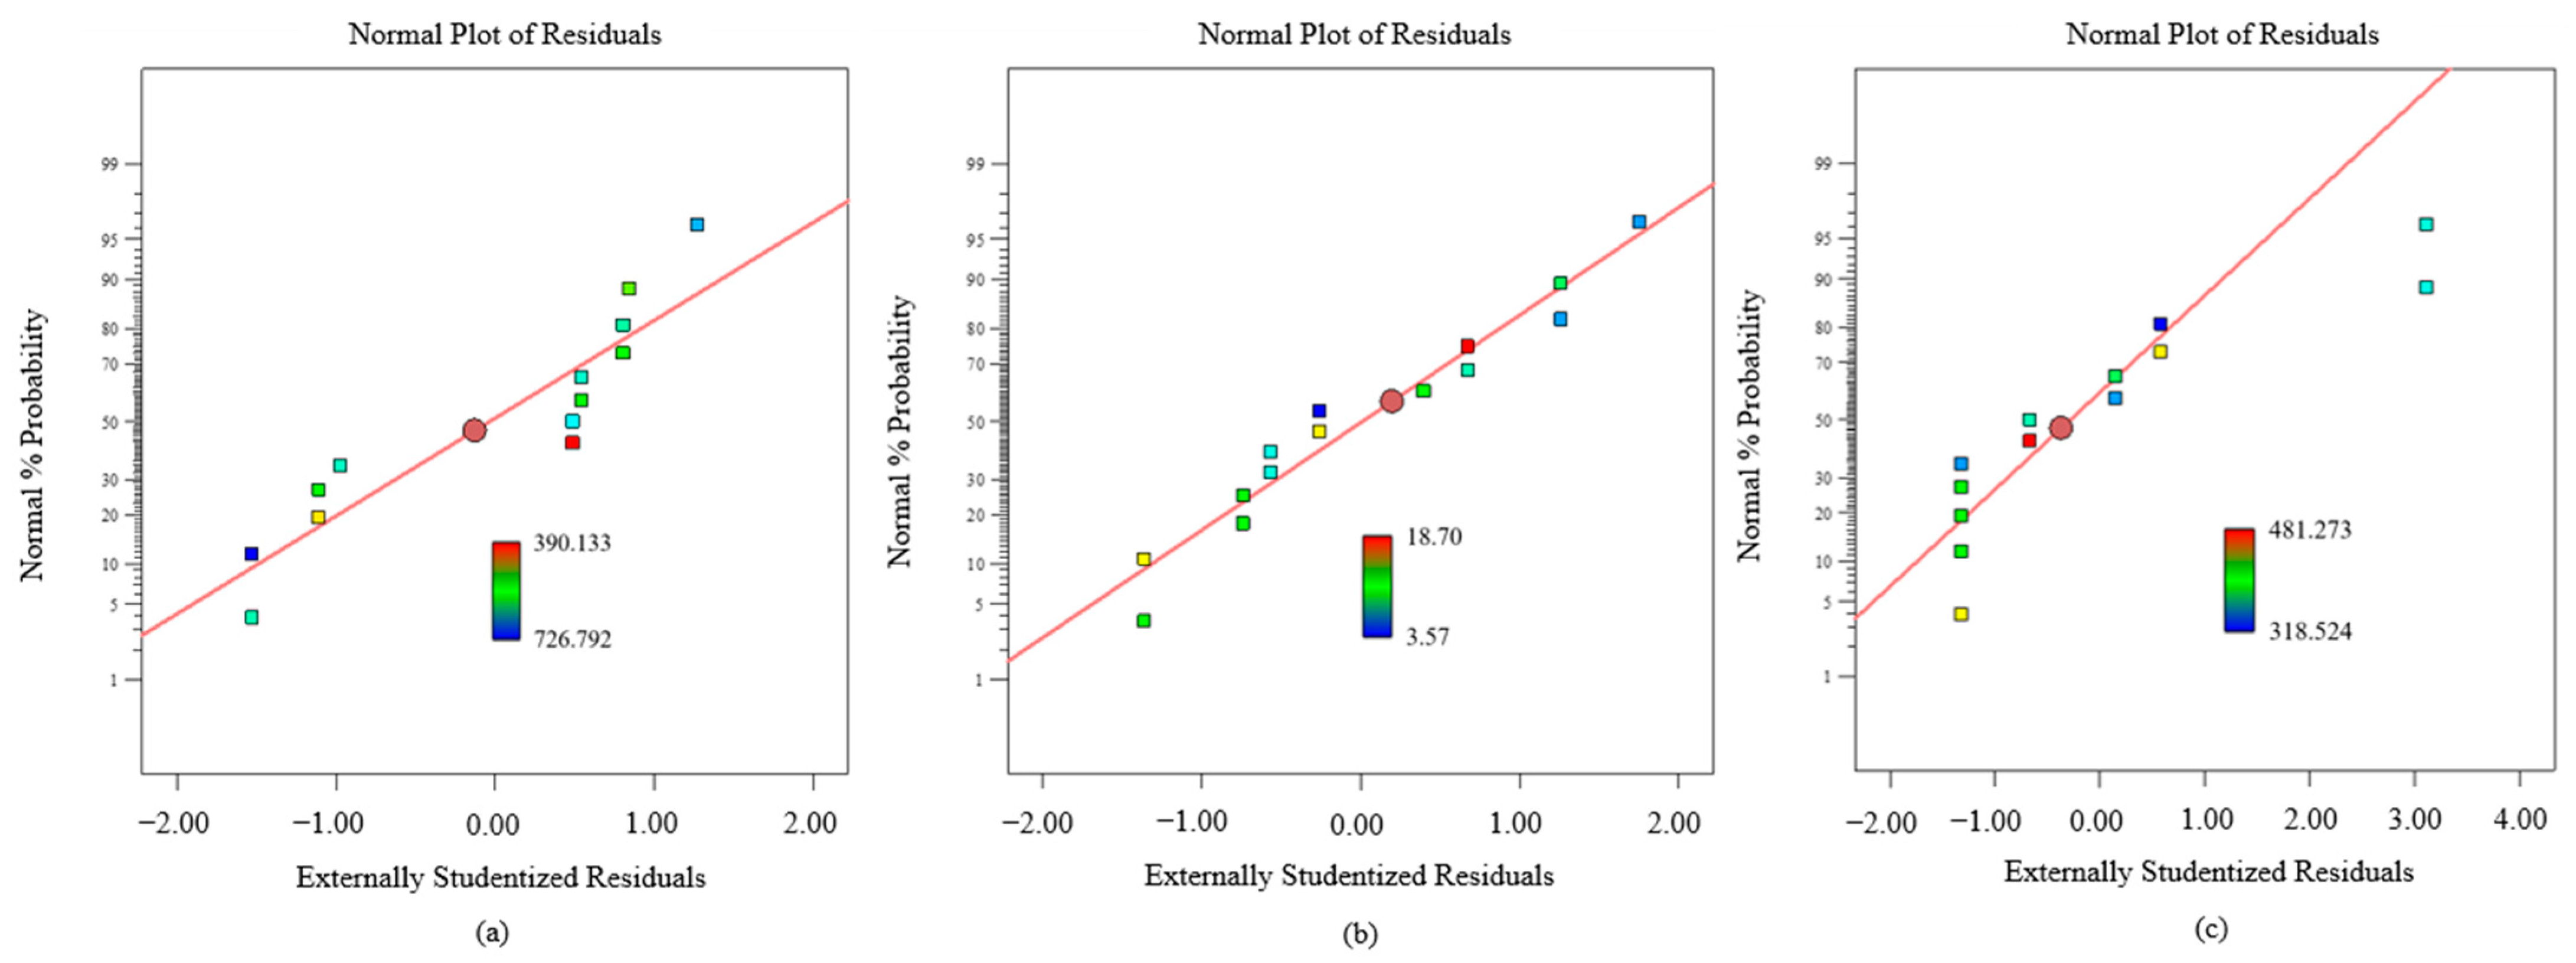
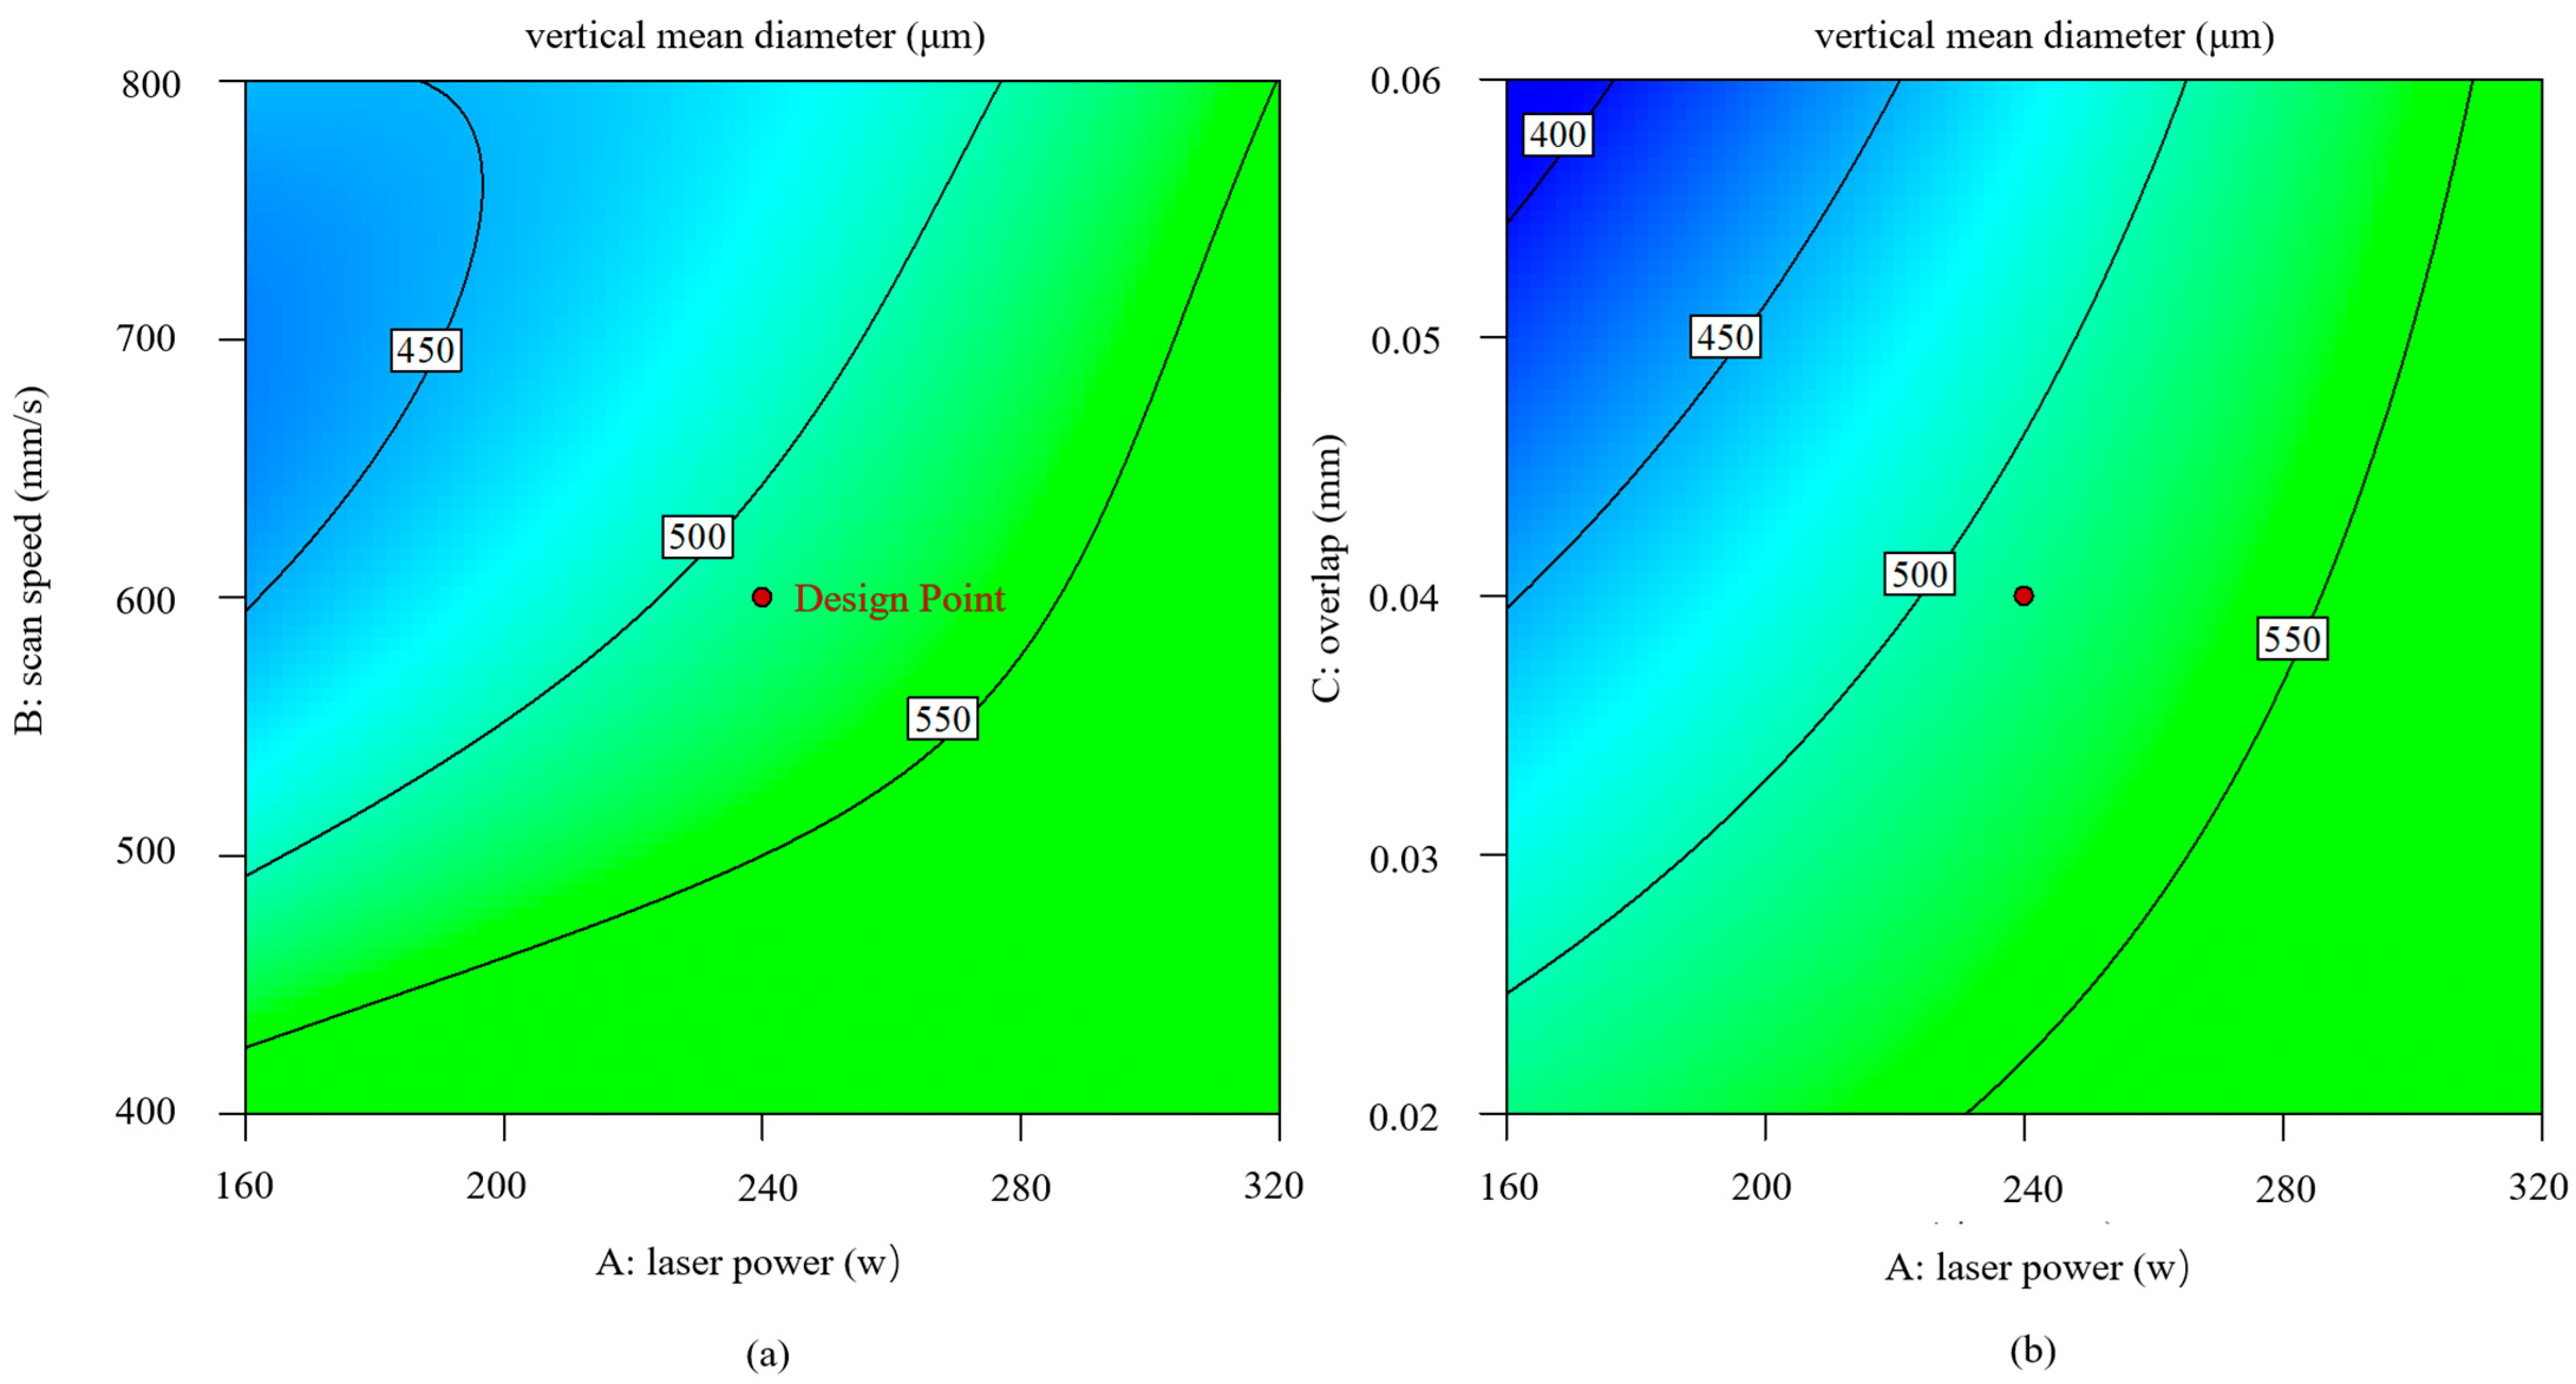
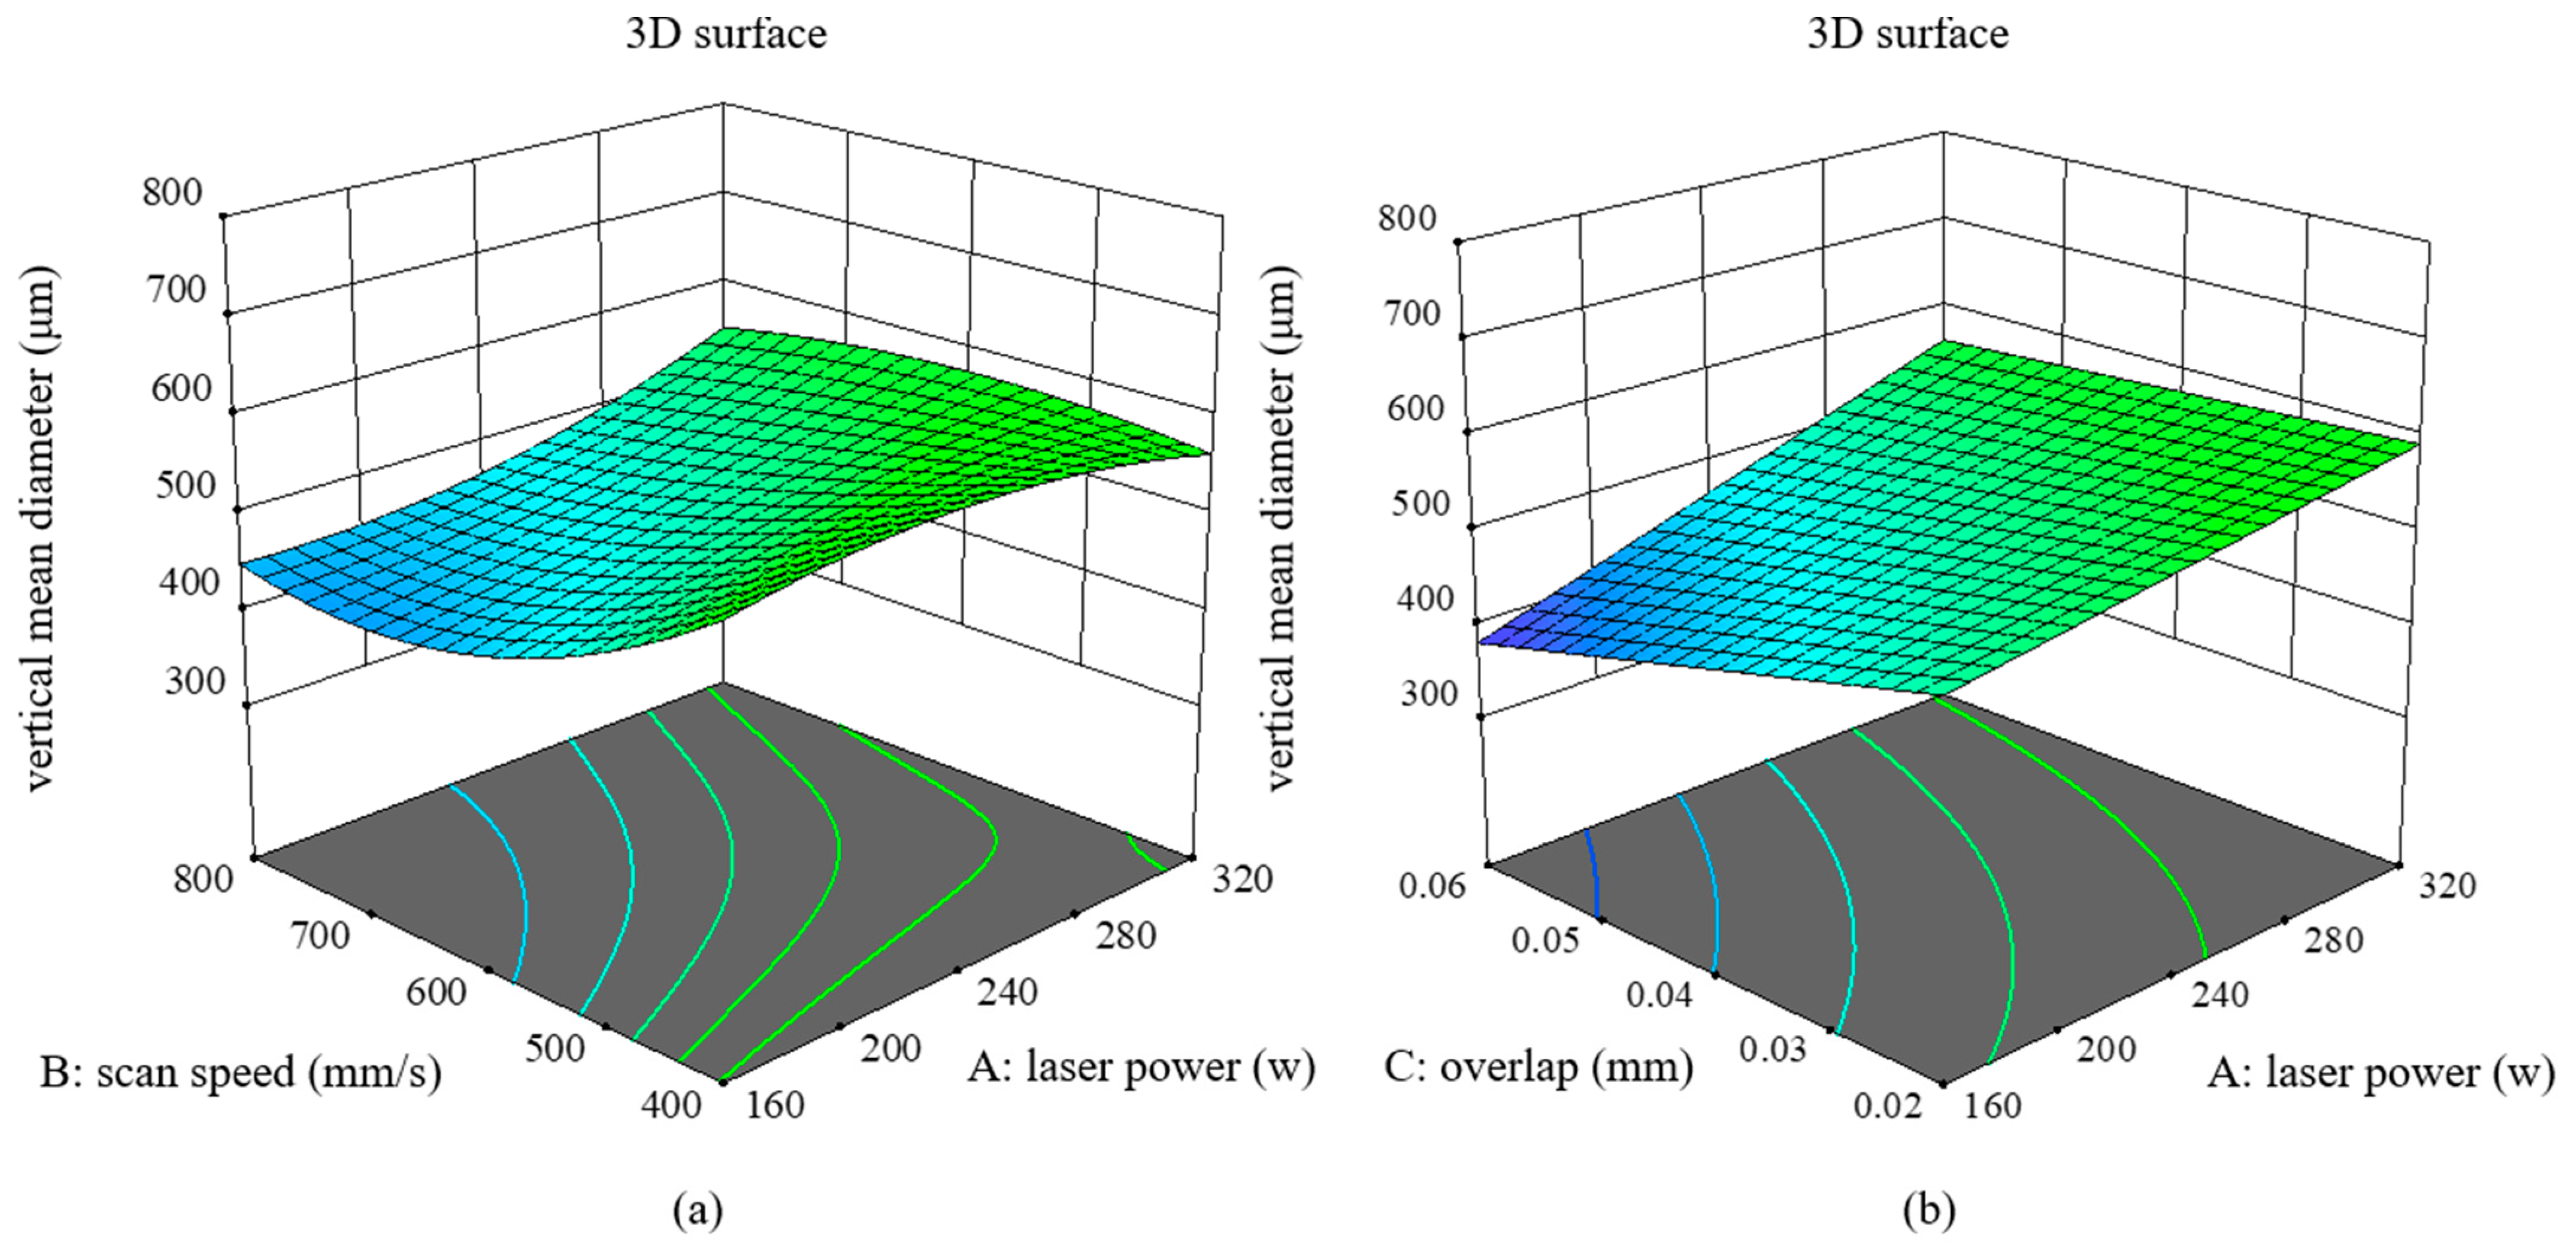
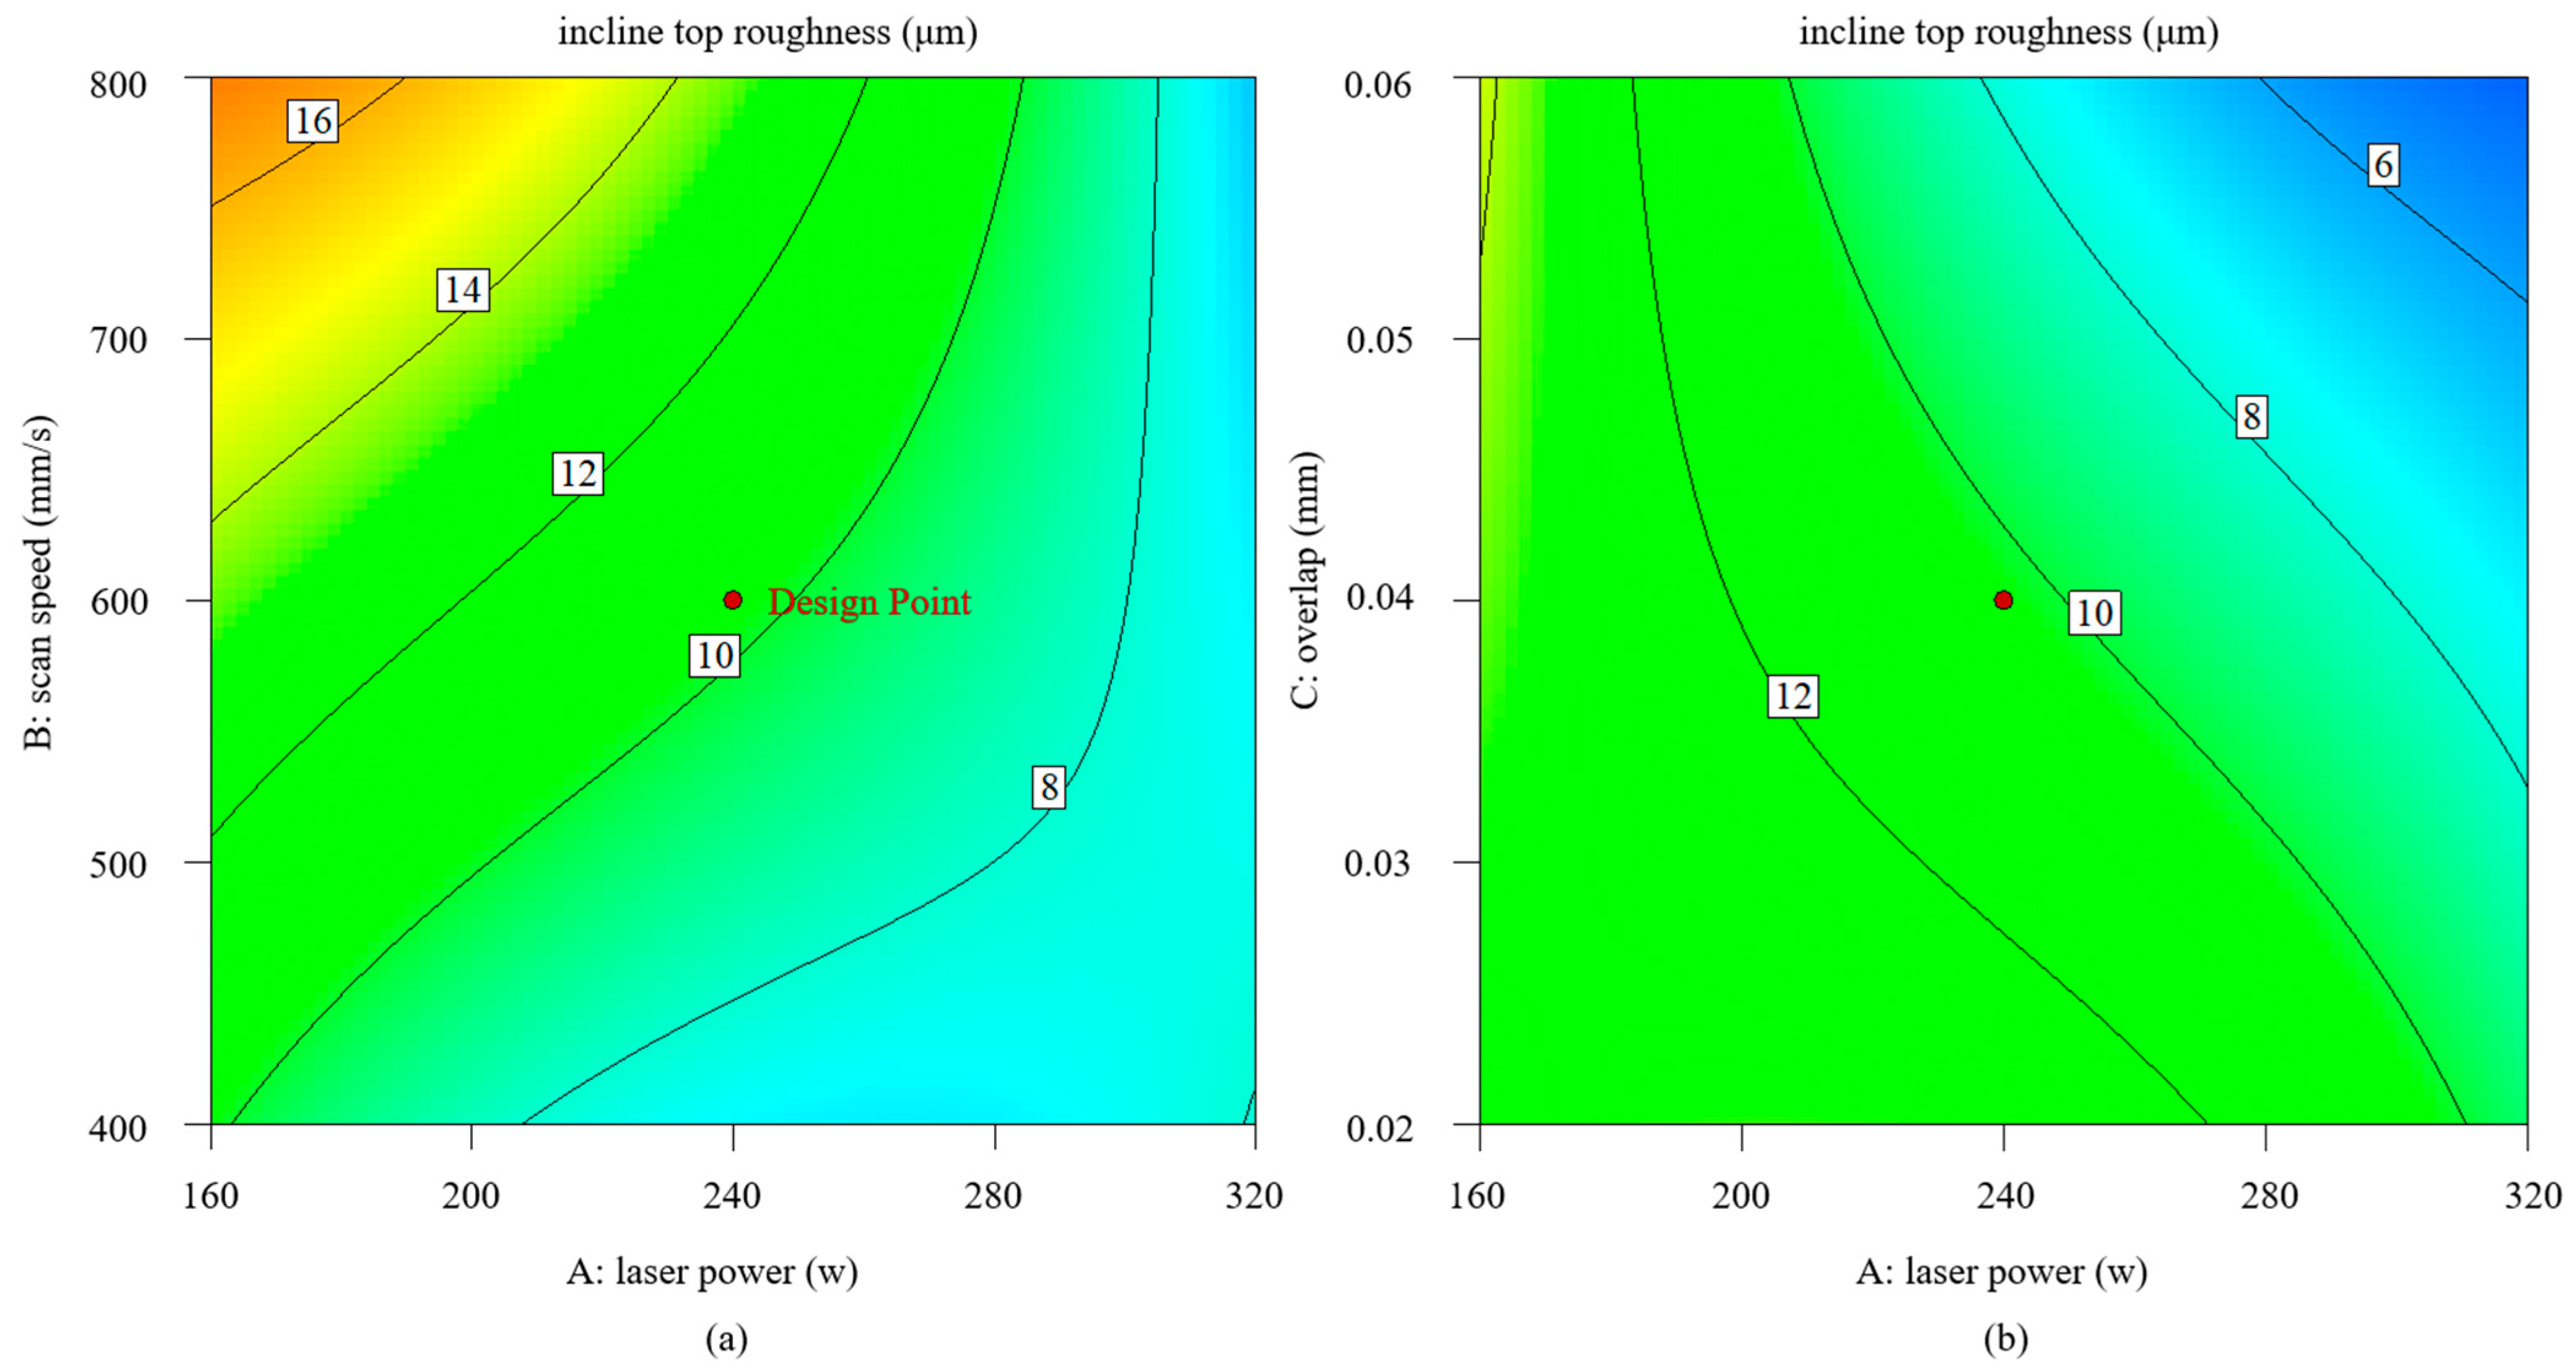
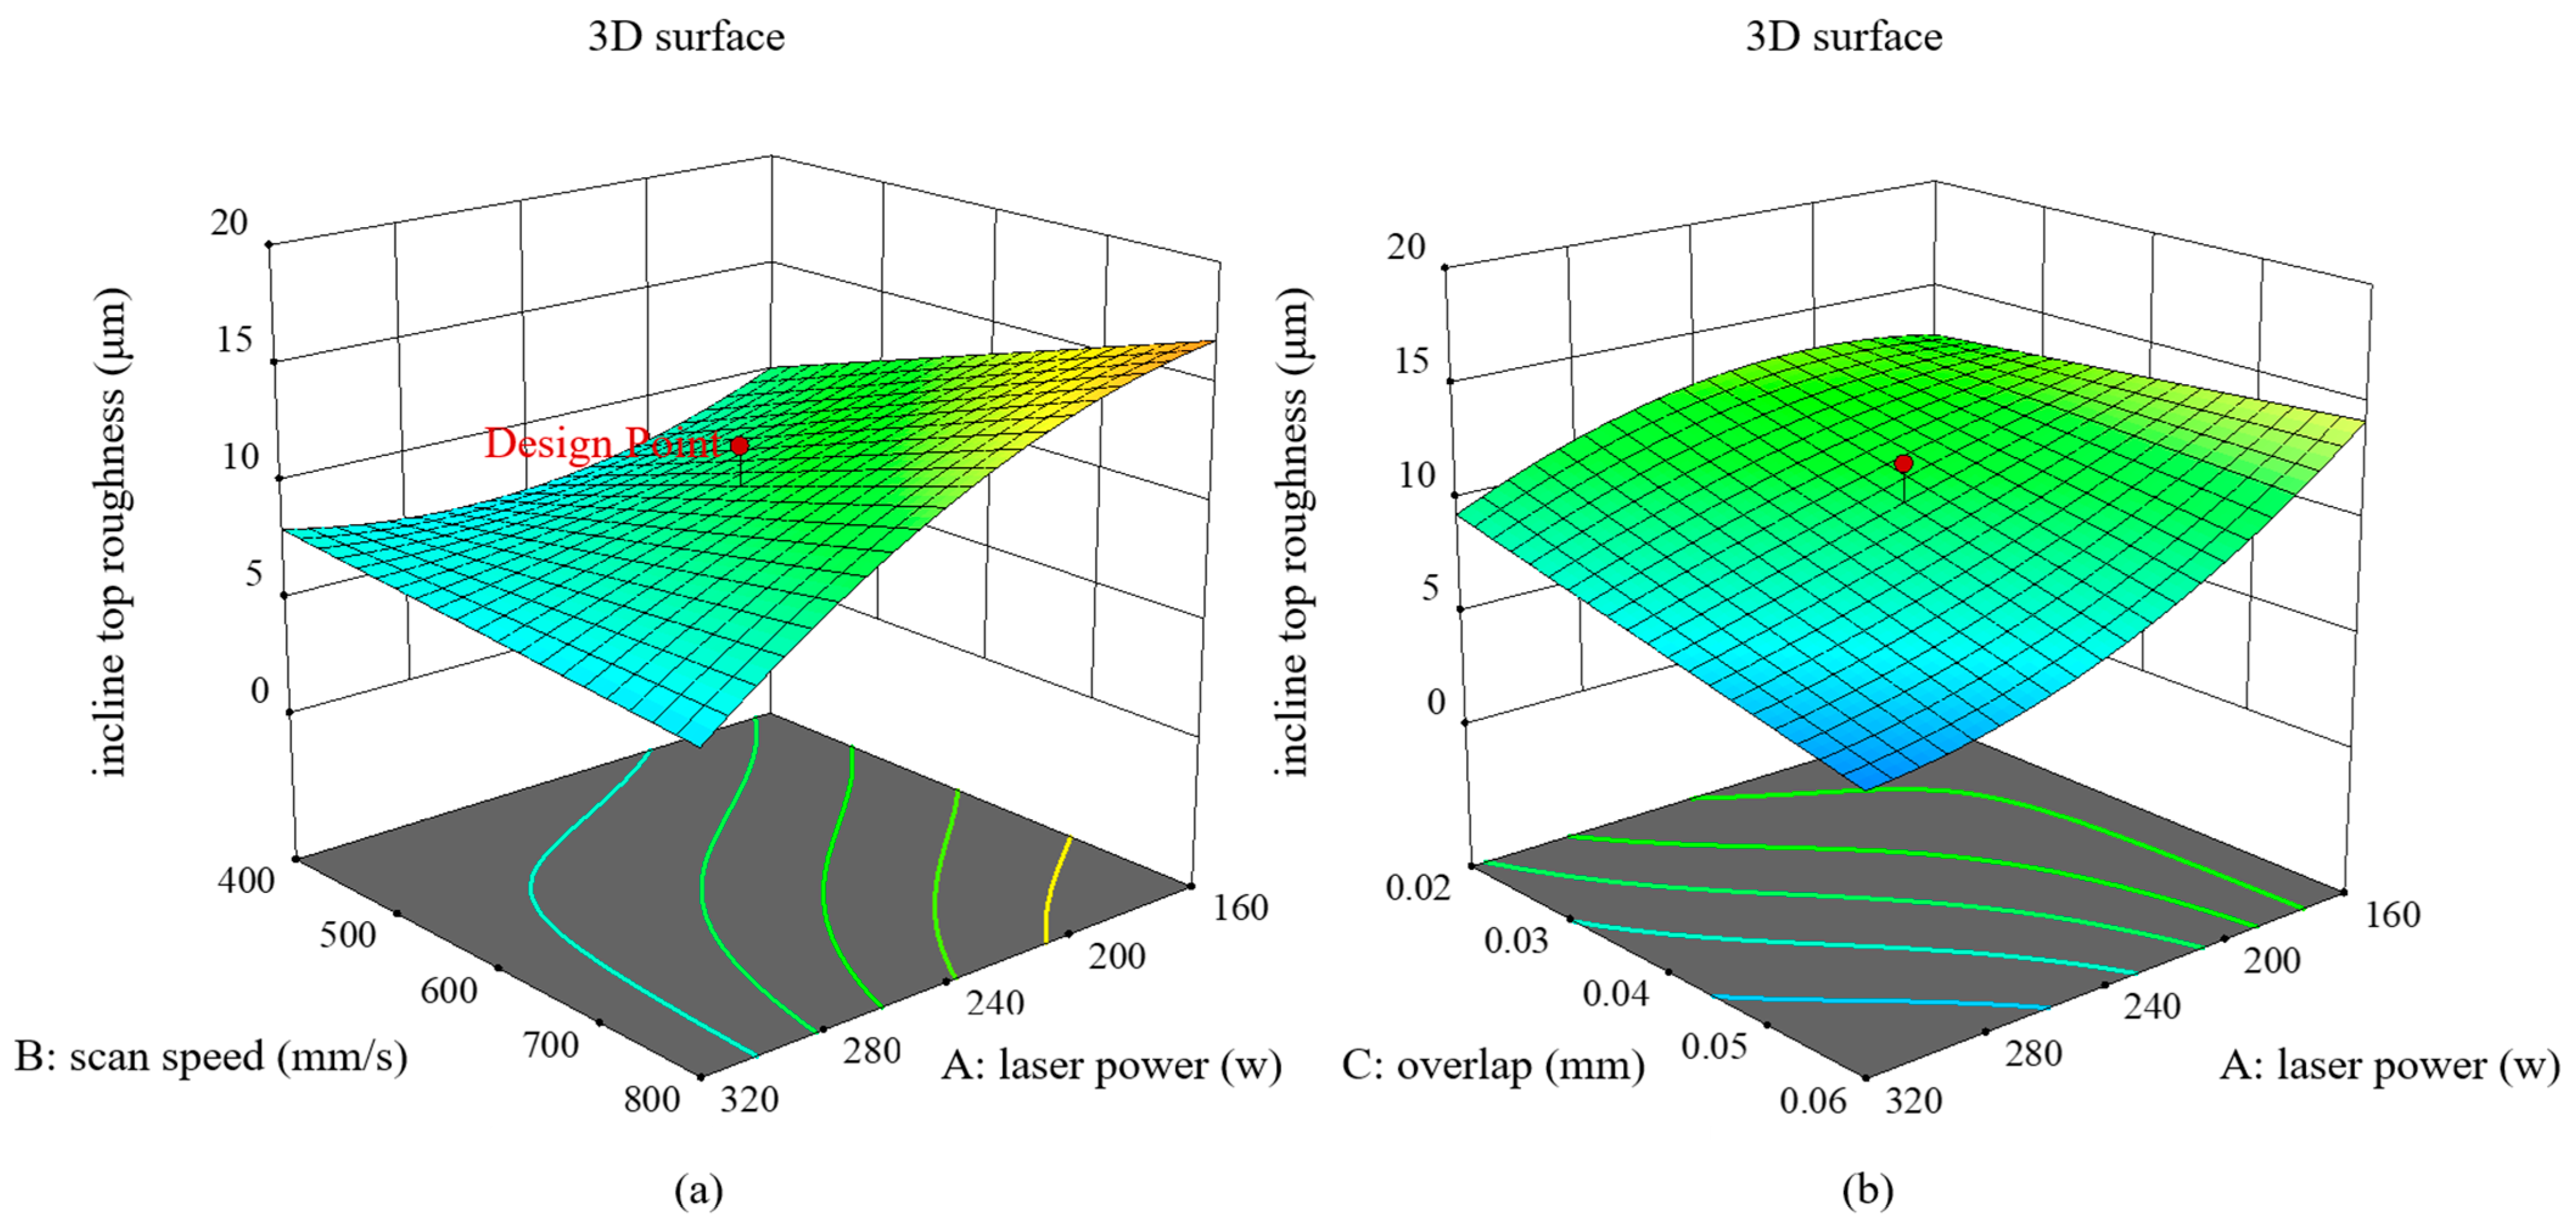
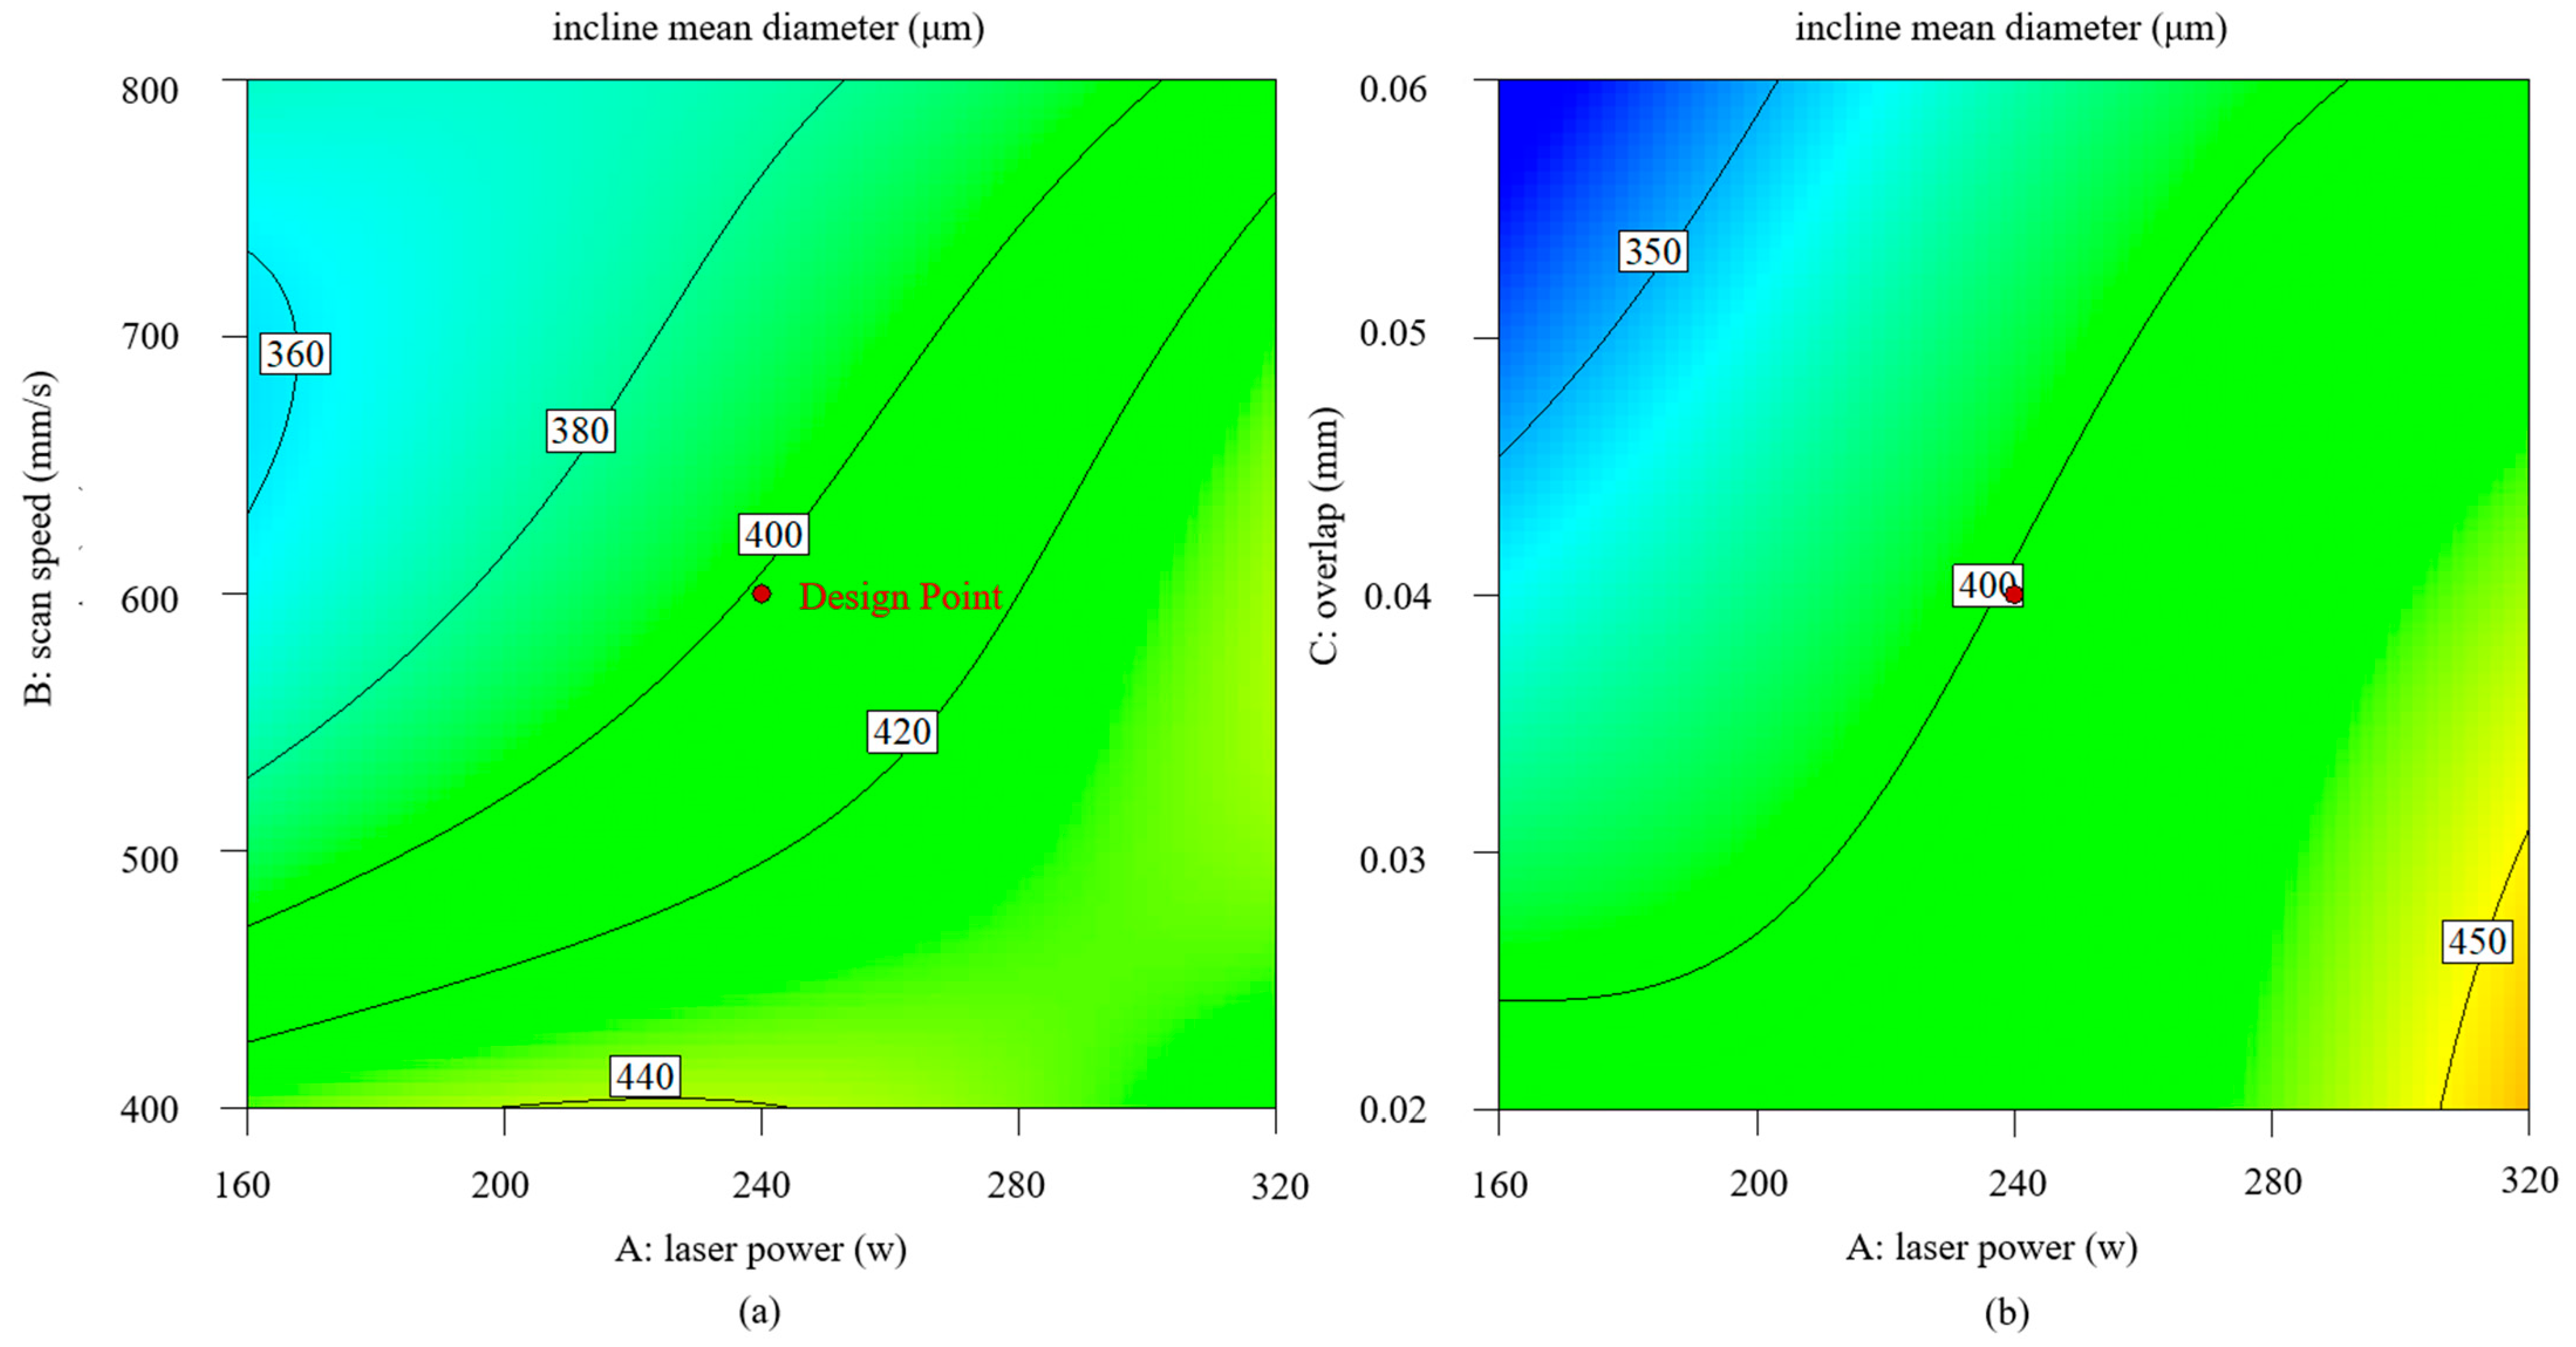
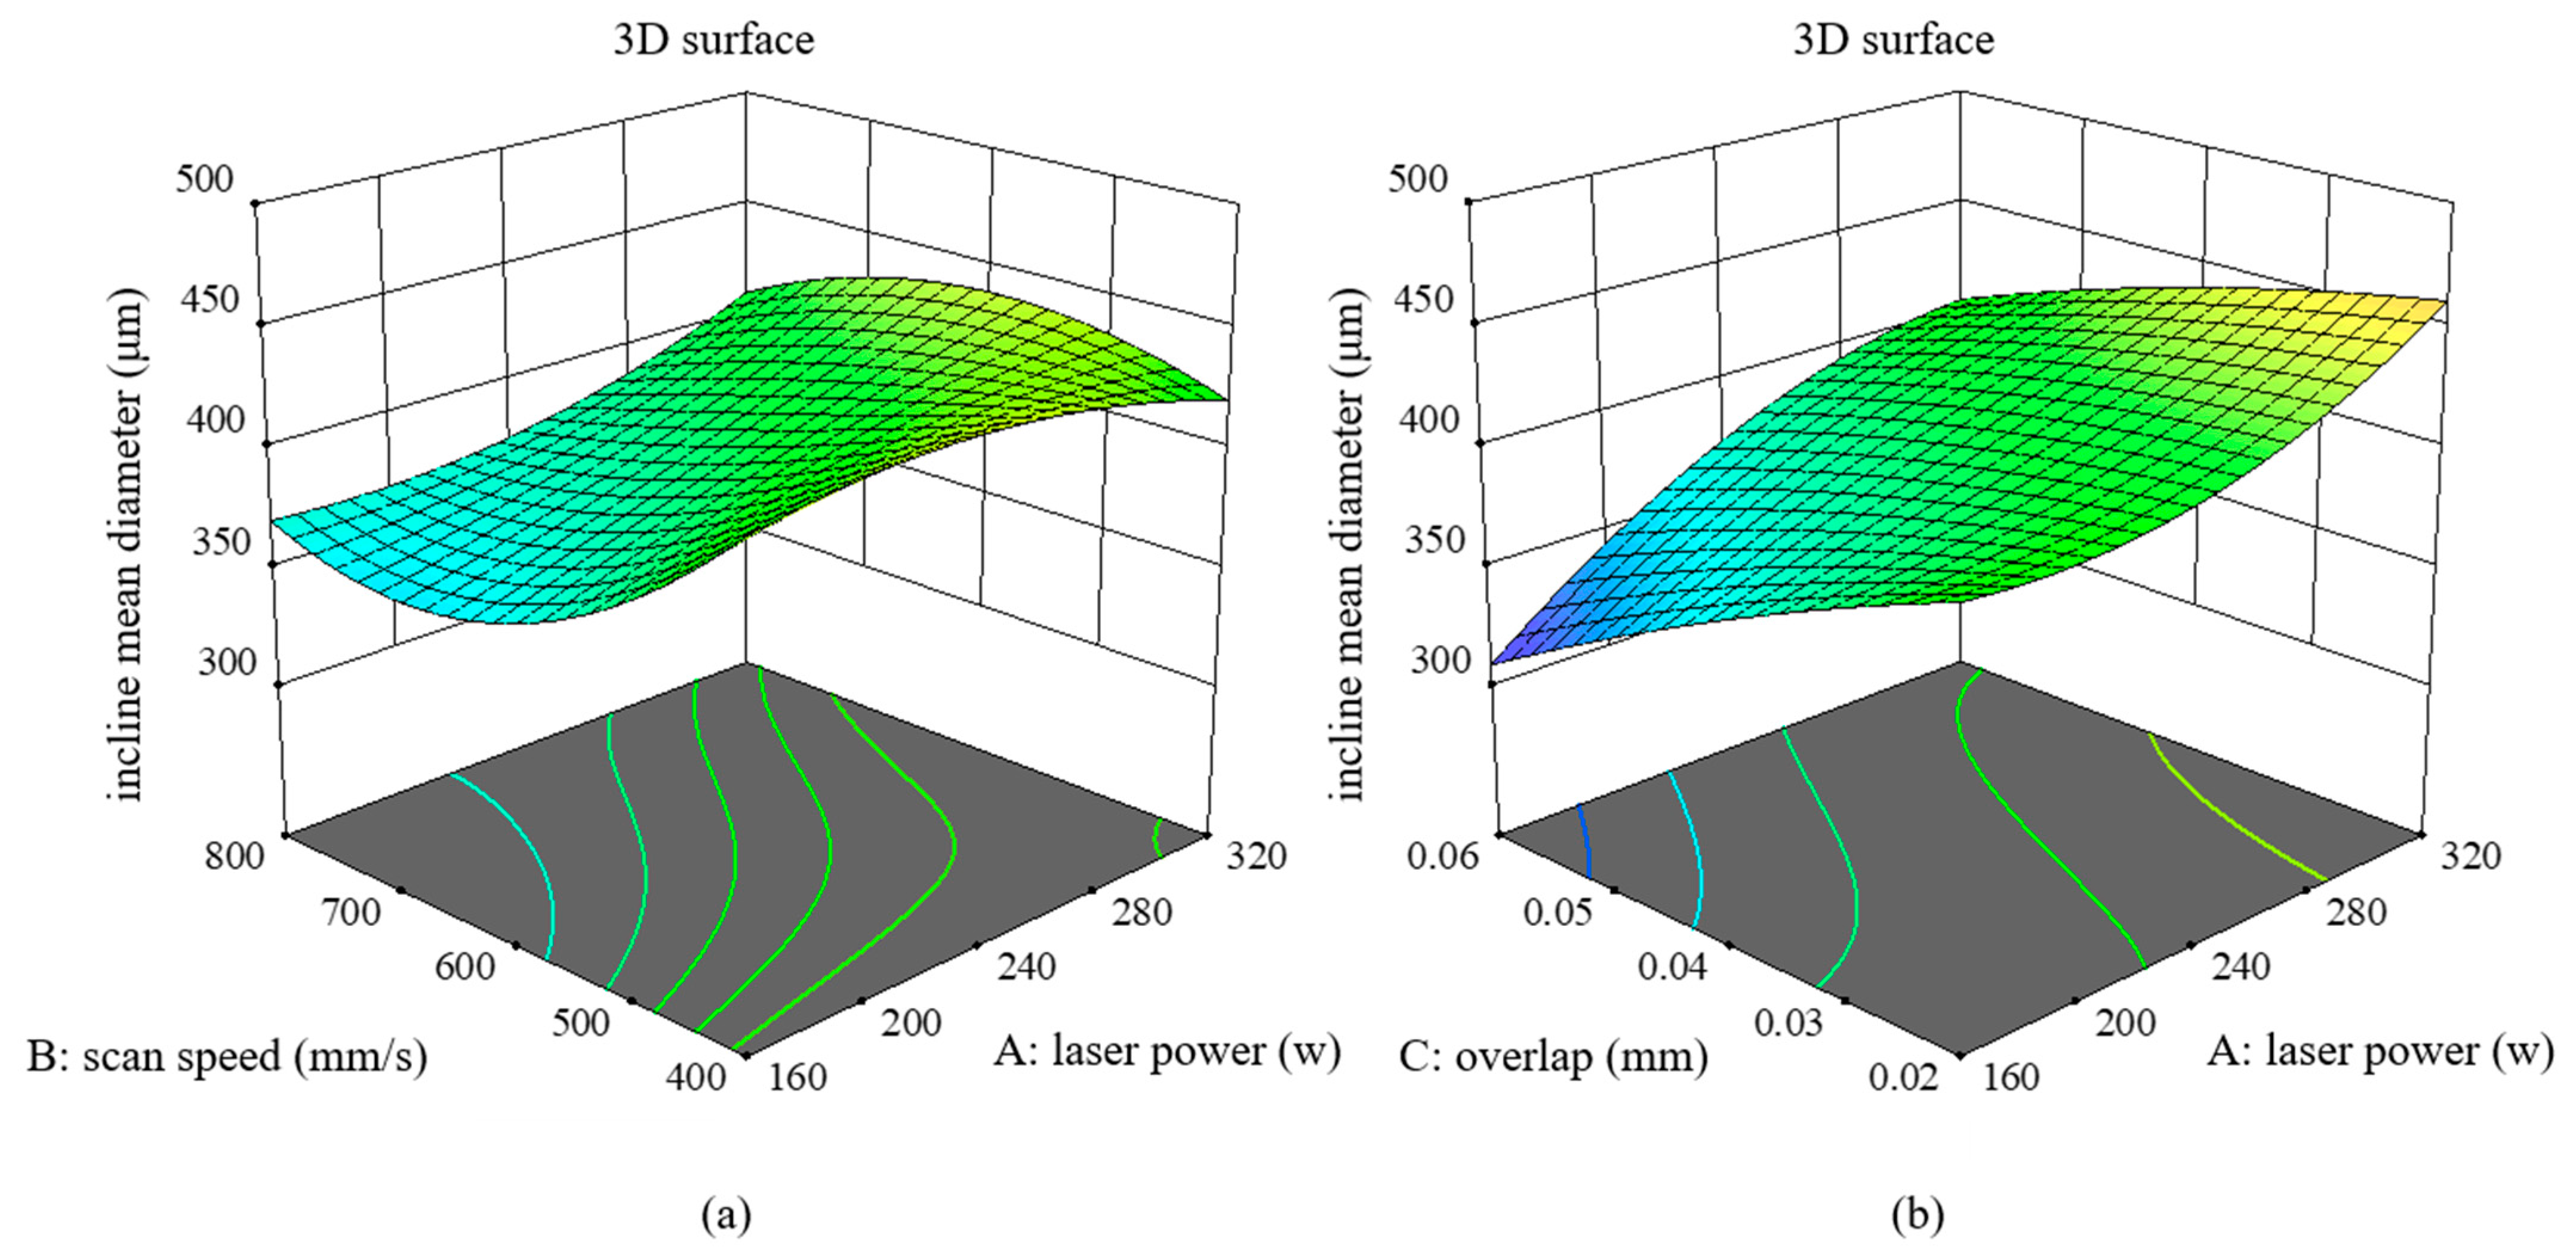
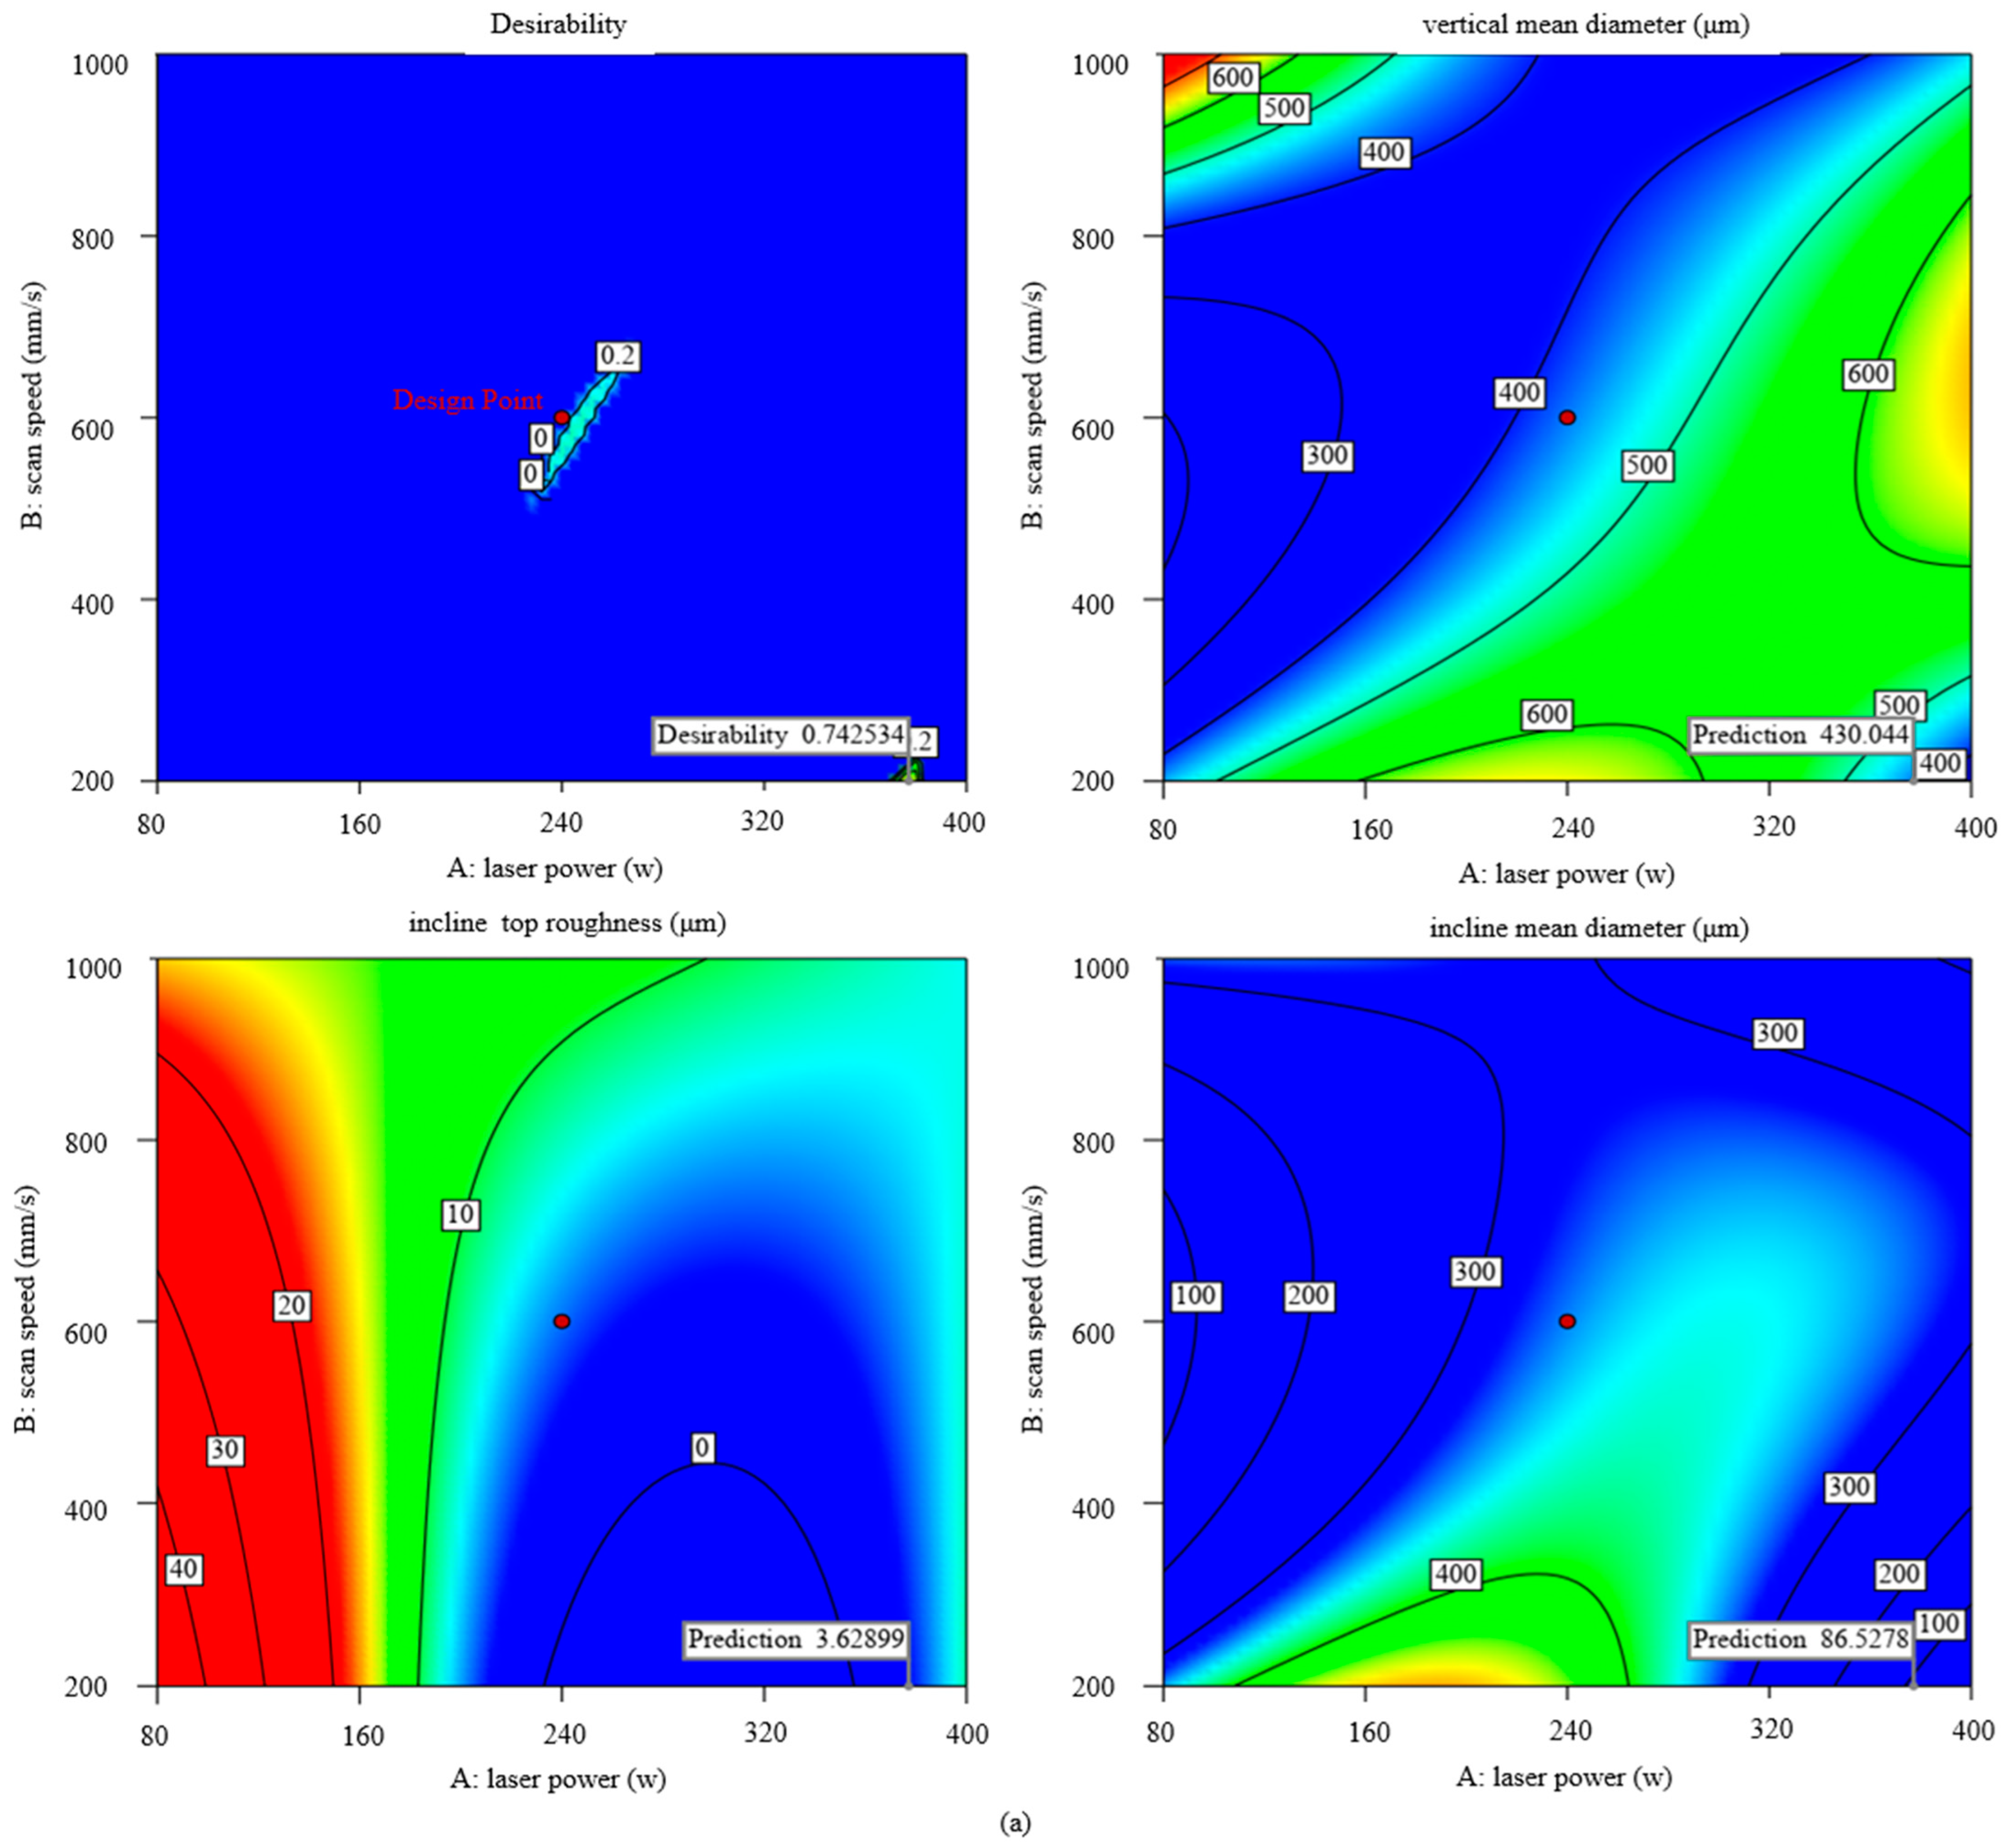
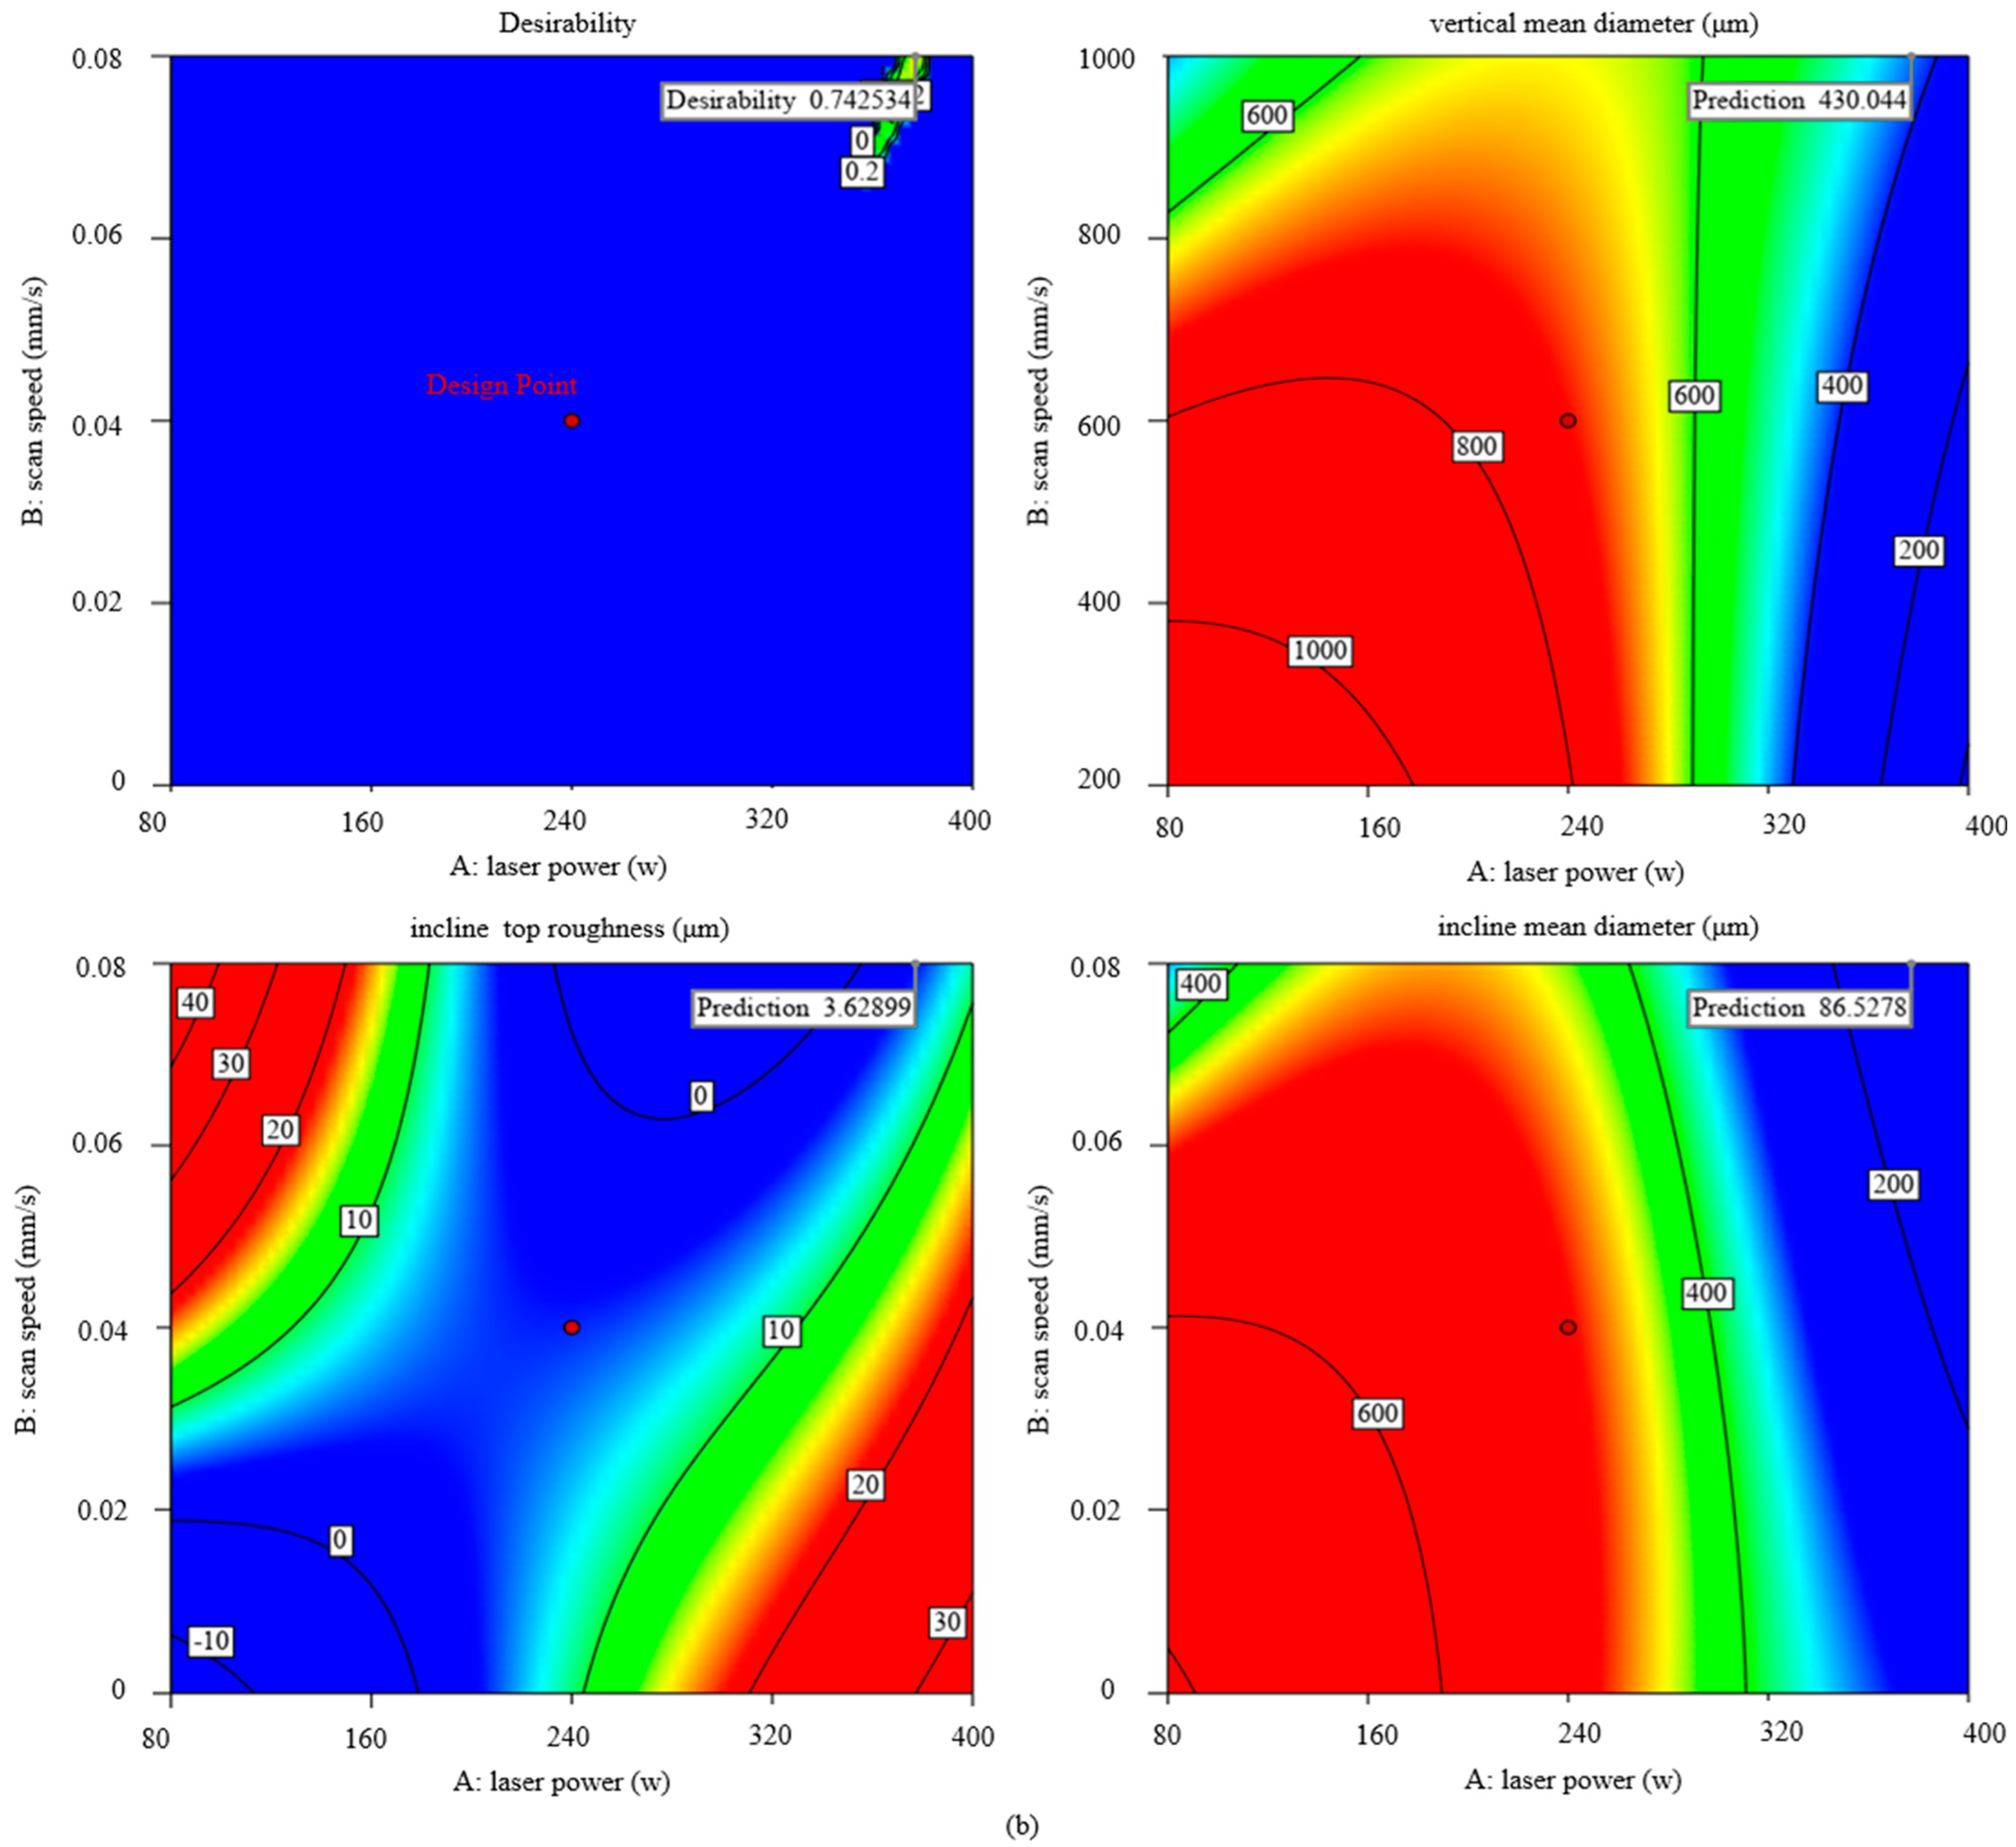
  • Response surface analysis results have illustrated that the laser parameters produce significant effects on three responses: vertical mean diameter, incline top roughness, and incline mean diameter. Linear energy density E = P v and linear energy focusing F = Pd have a quantitative effect on each of these three responses: The increase of E is conducive to the reduction of surface roughness but is not conducive to the reduction of manufacturing errors; the increase of F can be beneficial to the simultaneous optimization of the two, so from a comprehensive point of view, the choice of a larger overlap is the best manufacturing optimization strategy.
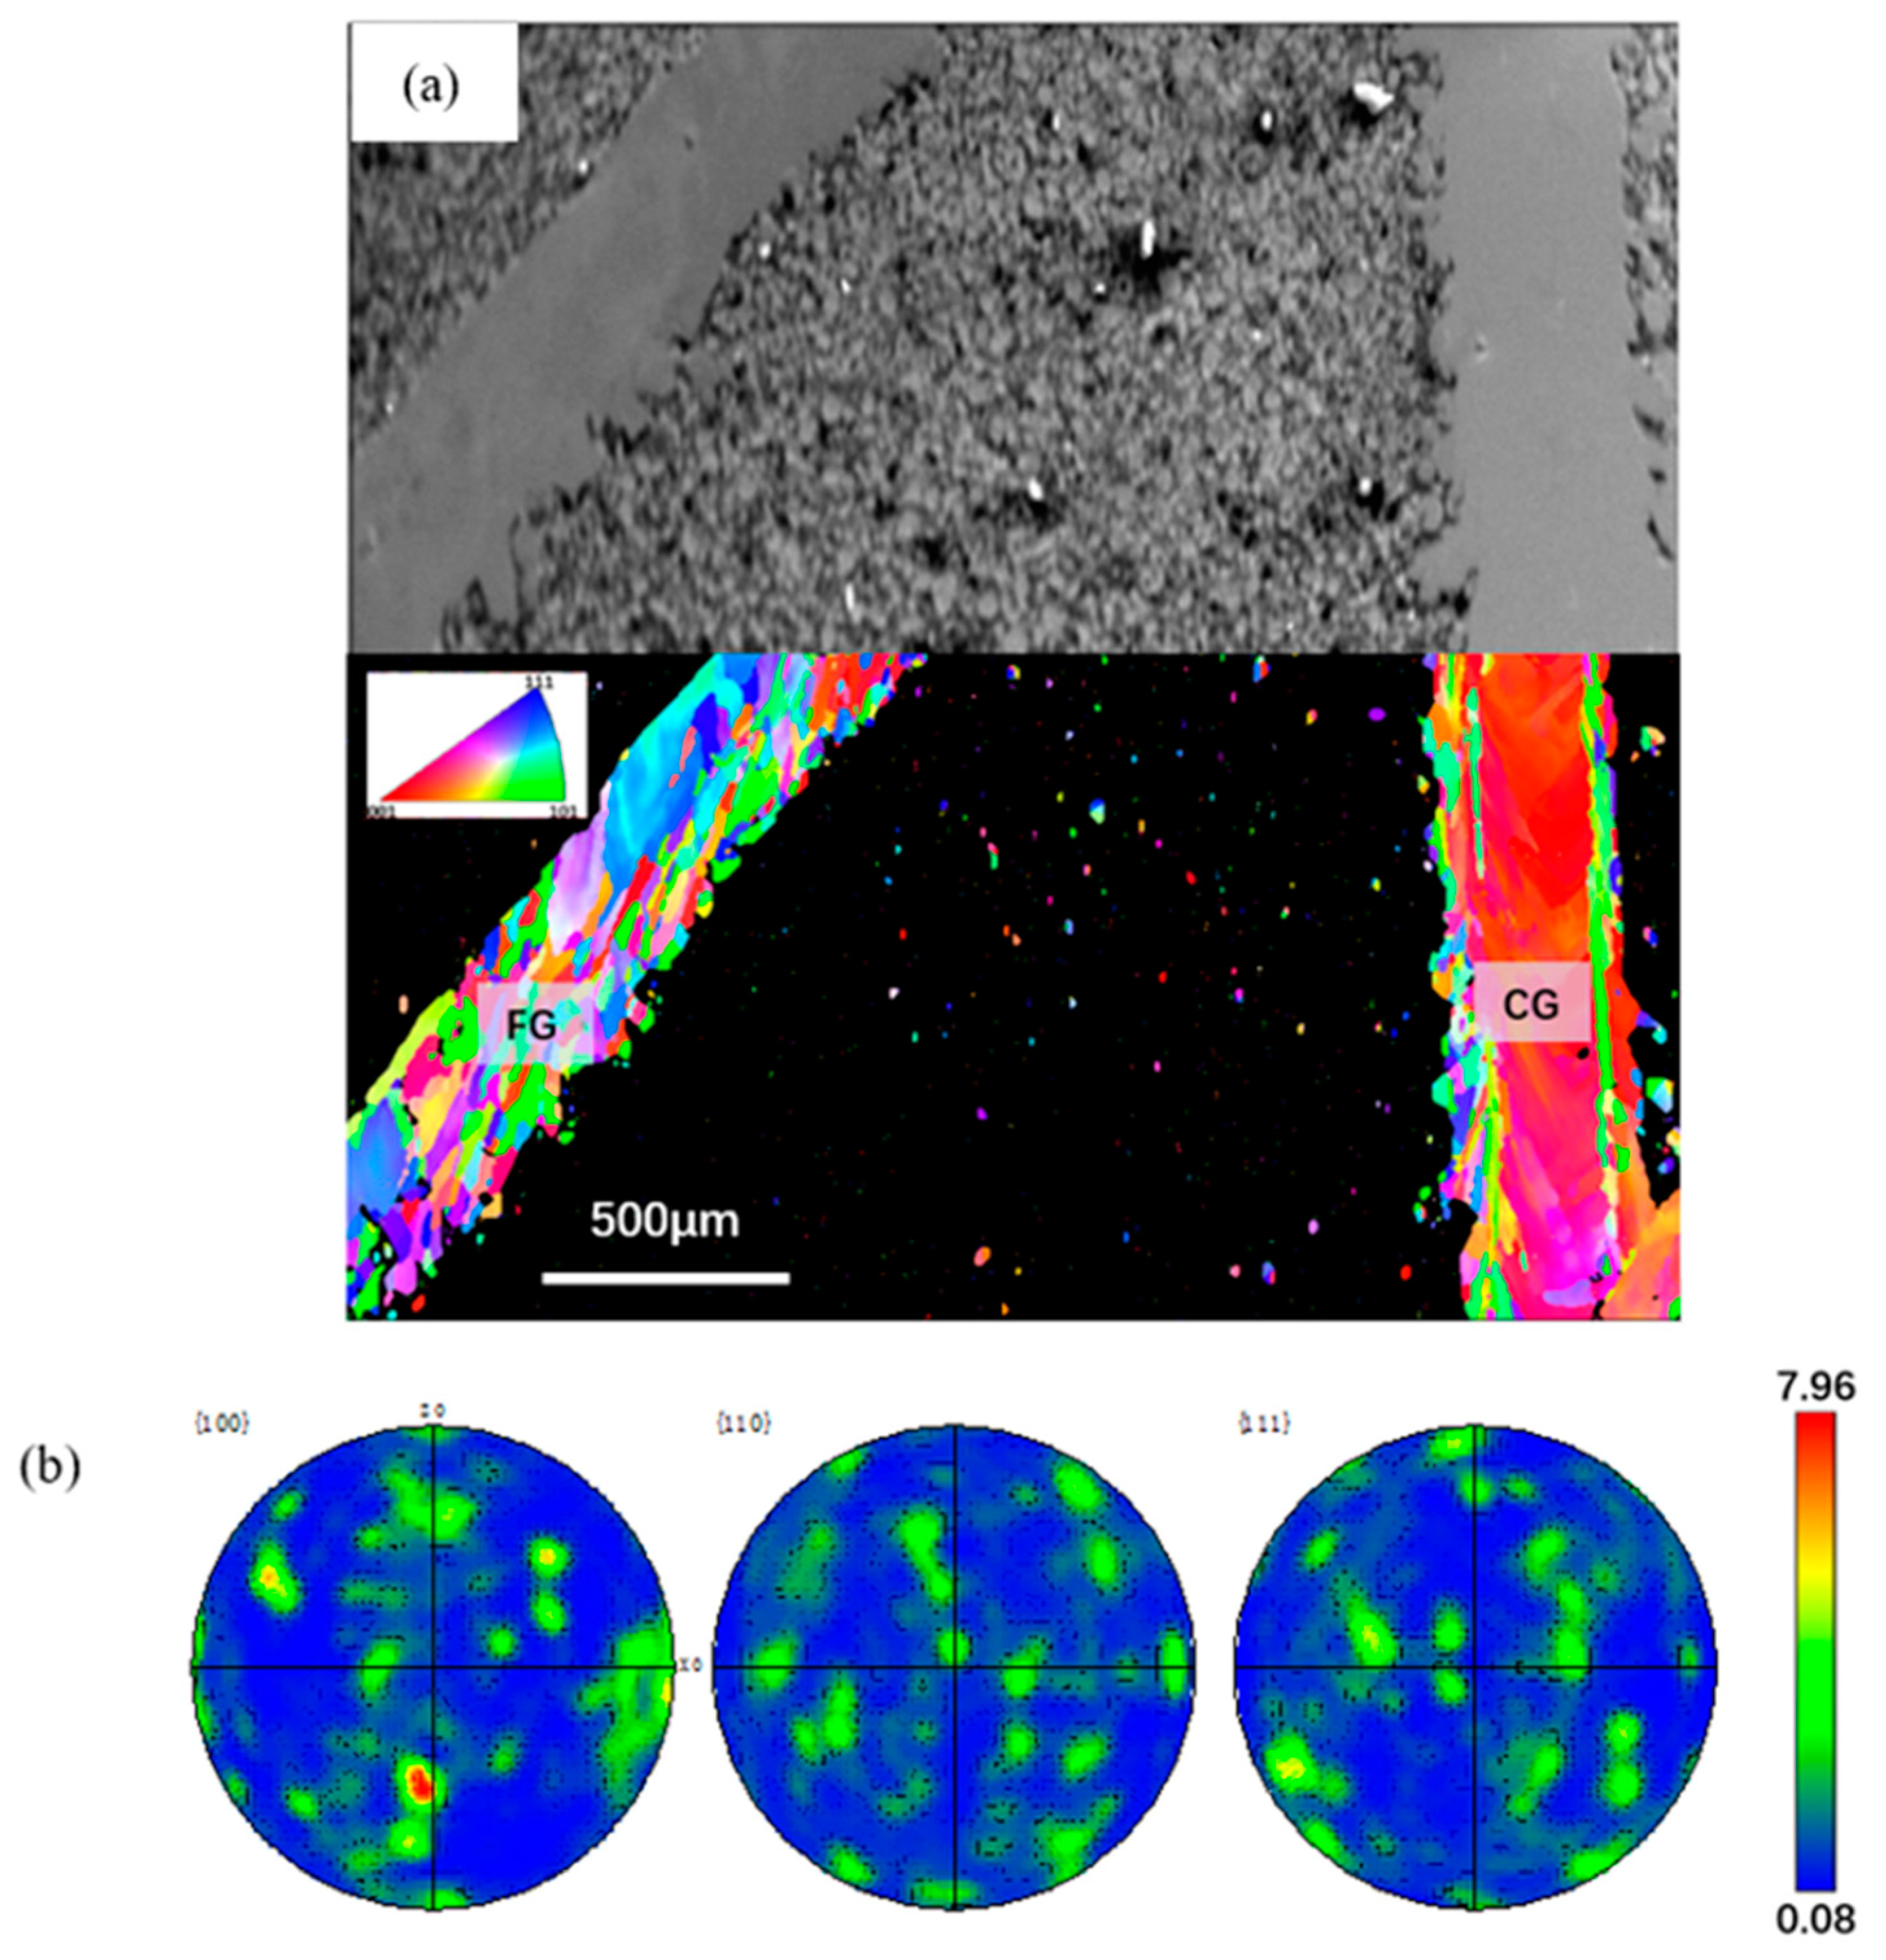
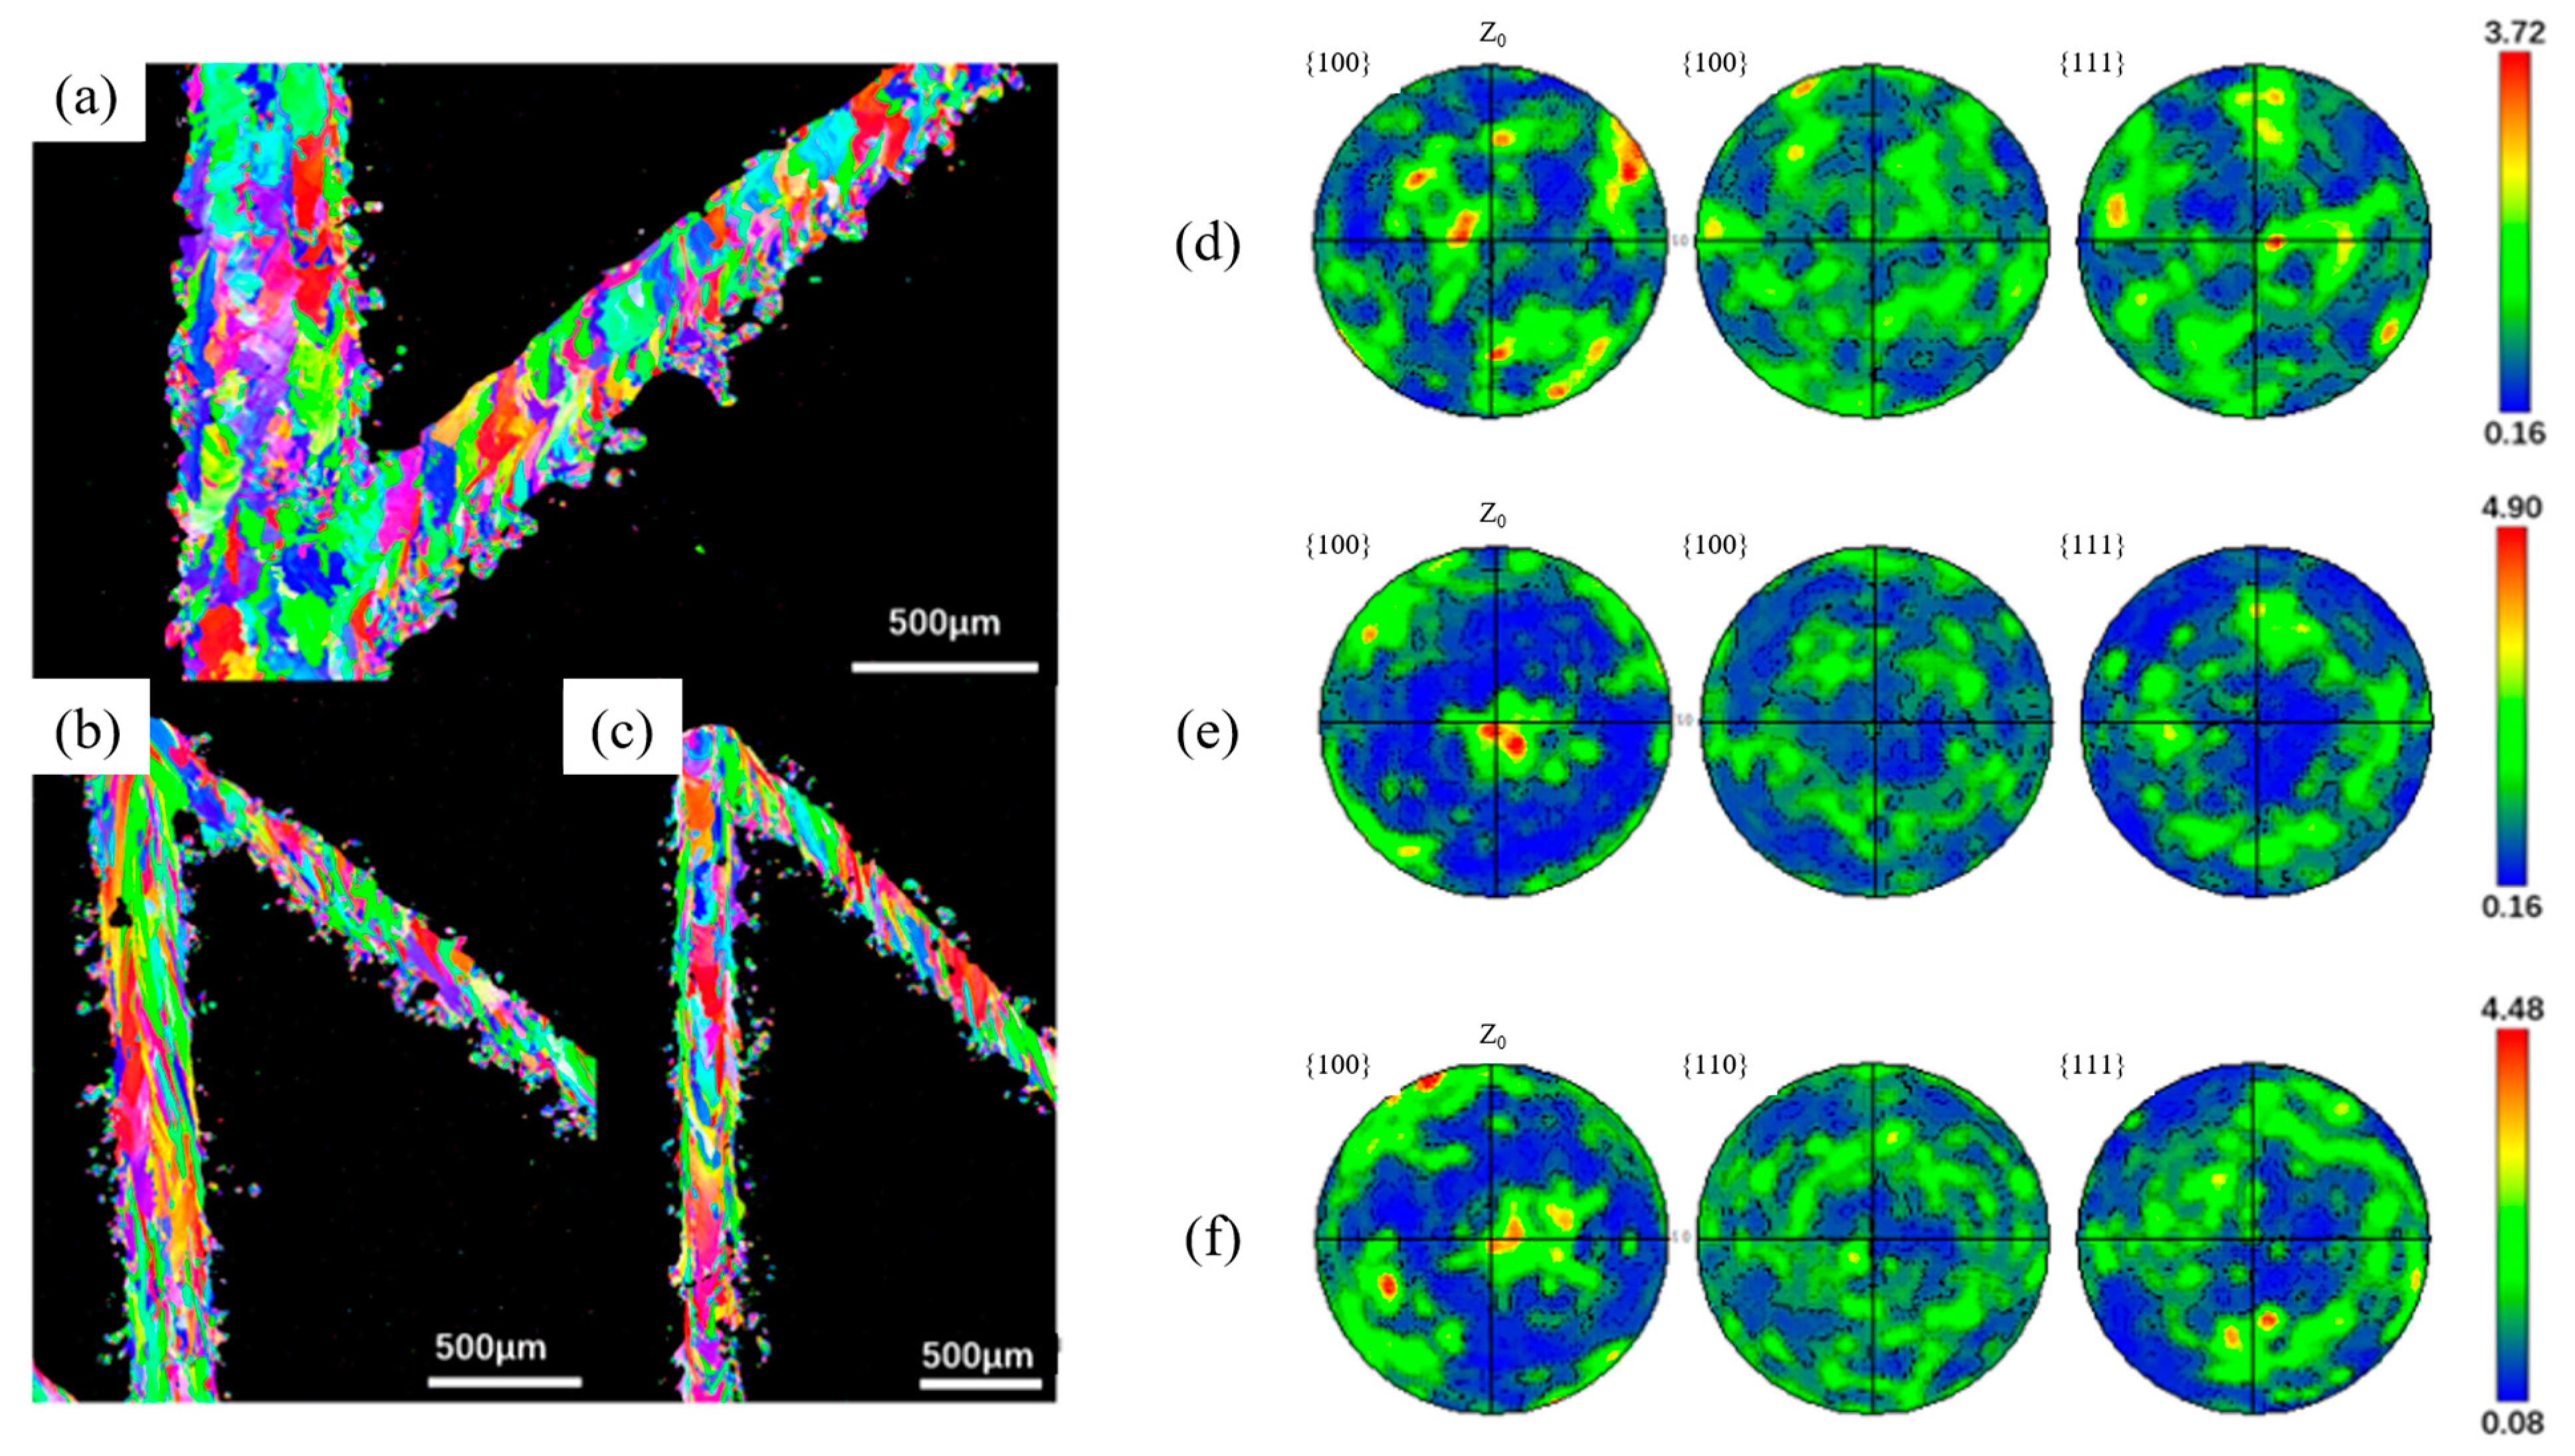
  • The surface morphology with the overlap strategy presents a significant scale effect. The surface roughness Ra (SP) rapidly decreases by 68.6% from 14.53 μm to 4.26 μm, accompanied by the evident improvement in surface fluctuation. The mean diameters decrease by 18.7%. It is observed that the maximal texture index is steadily raised, and the grain weave orientation tends to be more in the direction of {100}, both of which show a clear improvement in interlayer remelting. Furthermore, for low energy density input, it is evident that the splashing of the melt pool and the powder’s own gravity cause heterogeneous nucleation at the area near the melt pool’s border in the constitutionally undercooled zone, which prevents the columnar grain from growing.

Author Contributions

Conceptualization, C.L., Z.L., X.L., J.Z., Y.C. and B.W.; data curation, C.L. and X.L.; formal analysis, C.L. and X.L.; funding acquisition, Z.L.; investigation, C.L.; methodology, C.L., Z.L., X.L., J.Z., Y.C. and B.W.; project administration, Z.L.; resources, C.L., Z.L. and X.L.; software, C.L. and X.L.; supervision, Z.L., X.L., J.Z., Y.C. and B.W.; validation, C.L., Z.L. and X.L.; visualization, C.L., Z.L., X.L., J.Z., Y.C. and B.W.; writing—original draft, C.L.; writing—review and editing, C.L., Z.L., X.L., J.Z., Y.C. and B.W. All authors have read and agreed to the published version of the manuscript.

Funding

This research was funded by the National Natural Science Foundation of China (92360311, 52275444, and 52175420). This work was also supported by grants from Shandong Province Key Research and Development Plan (2023JMRH0307).

Data Availability Statement

The original contributions presented in the study are included in the article, further inquiries can be directed to the corresponding author.

Conflicts of Interest

The authors declare no conflict of interest.

References

  1. Balachandramurthi, A.R.; Moverare, J.; Dixit, N.; Pederson, R. Influence of defects and as-built surface roughness on fatigue properties of additively manufactured Alloy 718. Mater. Sci. Eng. A 2018, 735, 463–474. [Google Scholar] [CrossRef]
  2. Li, R.; Liu, J.; Shi, Y.; Wang, L.; Jiang, W. Balling behavior of stainless steel and nickel powder during selective laser melting process. Int. J. Adv. Manuf. Technol. 2012, 59, 1025–1035. [Google Scholar] [CrossRef]
  3. Beaucamp, A.T.; Namba, Y.; Charlton, P.; Jain, S.; Graziano, A.A. Finishing of additively manufactured titanium alloy by shape adaptive grinding (SAG). Surf. Topogr. Metrol. Prop. 2015, 3, 024001. [Google Scholar] [CrossRef]
  4. Tang, Y. A Multiscale and Multifunctional Design Method for Mesoscale Lattice Structures Fabricated by Additive Manufacturing Processes; McGill University: Montréal, QC, Canada, 2018. [Google Scholar]
  5. Urlea, V.; Brailovski, V. Electropolishing and electropolishing-related allowances for powder bed selectively laser-melted Ti-6Al-4V alloy components. J. Mater. Process. Technol. 2017, 242, 1–11. [Google Scholar] [CrossRef]
  6. Shen, M.; Fang, F. Advances in polishing of internal structures on parts made by laser-based powder bed fusion. Front. Mech. Eng. 2023, 18, 8. [Google Scholar] [CrossRef]
  7. Kruth, J.P.; Froyen, L.; Van Vaerenbergh, J.; Mercelis, P.; Rombouts, M.; Lauwers, B. Selective laser melting of iron-based powder. J. Mater. Process. Technol. 2004, 149, 616–622. [Google Scholar] [CrossRef]
  8. Spittle, J.A. Columnar to equiaxed grain transition in as solidified alloys. Int. Mater. Rev. 2006, 51, 247–269. [Google Scholar] [CrossRef]
  9. Lin, K.; Qiao, J.; Gu, D.; Wang, H.; Shi, B.; Zhang, W.; Shan, J.; Xu, Y.; Tian, L. Active Screen Plasma Nitriding of Laser Powder Bed Fusion Processed 316L Stainless Steel for the Application of Fuel Cell Bipolar Plates. Virtual Phys. Prototyp. 2023, 18, e2225490. [Google Scholar] [CrossRef]
  10. Spittle, J.A.; Brown, S.G.R. Numerical modelling of permeability variation with composition in aluminium alloy systems and its relationship to hot tearing susceptibility. Mater. Sci. Technol. 2005, 21, 1071–1077. [Google Scholar] [CrossRef]
  11. Liu, X.W.; Yao, J.Q.; Ma, X.N.; Wang, Y.S.; Gao, N.; Shi, Y.; Fan, Z.T.; Du, H. Columnar-to-equiaxed transition and grain refinement by solute interaction effects. Mater. Charact. 2023, 205, 113288. [Google Scholar] [CrossRef]
  12. Li, H.; Huang, Y.; Jiang, S.; Lu, Y.; Gao, X.; Lu, X.; Ning, Z.; Sun, J. Columnar to equiaxed transition in additively manufactured CoCrFeMnNi high entropy alloy. Mater. Des. 2021, 197, 109262. [Google Scholar] [CrossRef]
  13. Wang, Y.; Yu, C.; Xing, L.; Li, K.; Chen, J.; Liu, W.; Ma, J.; Shen, Z. Grain structure and texture of the SLM single track. J. Mater. Process. Technol. 2020, 281, 116591. [Google Scholar] [CrossRef]
  14. Gu, Y.; Yuan, J.; Chen, L. Switching of control mechanisms during the rapid solidification of a melt pool. Phys. Rev. Mater. 2023, 7, 103401. [Google Scholar] [CrossRef]
  15. Ren, N.; Li, J.; Zhang, R.; Panwisawas, C.; Xia, M.; Dong, H.; Li, J. Solute trapping and non-equilibrium microstructure during rapid solidification of additive manufacturing. Nat. Commun. 2023, 14, 7990. [Google Scholar] [CrossRef]
  16. Ben Youssef, B. Cellular Automata-Based Modeling of Three Dimensional Multicellular Tissue Growth. In Emerging Trends in Applications and Infrastructures for Computational Biology, Bioinformatics, and Systems Biology: Systems and Applications; Elsevier Inc.: Amsterdam, The Netherlands, 2016; pp. 287–303. [Google Scholar]
  17. Jaafar, M.A.; Rousse, D.R.; Gibout, S.; Bédécarrats, J.P. A review of dendritic growth during solidification: Mathematical modeling and numerical simulations. Renew. Sustain. Energy Rev. 2017, 74, 1064–1079. [Google Scholar] [CrossRef]
  18. Quasthoff, U. Nested cellular automata: Continuous aspects of discrete systems. In Fractals in Physics; Elsevier: Amsterdam, The Netherlands, 1986; pp. 465–468. [Google Scholar]
  19. Zeneli, M.; Nikolopoulos, A.; Karellas, S.; Nikolopoulos, N. Numerical methods for solid-liquid phase-change problems. In Ultra-High Temperature Thermal Energy Storage, Transfer and Conversion; Woodhead Publishing: Cambridge, UK, 2021; pp. 165–199. [Google Scholar]
  20. Dong, H.B.; Lee, P.D. Simulation of the columnar-to-equiaxed transition in directionally solidified Al–Cu alloys. Acta Mater. 2005, 53, 659–668. [Google Scholar] [CrossRef]
  21. Thevoz, P.; Desbiolles, J.L.; Rappaz, M. Modeling of equiaxed microstructure formation in casting. Metall. Trans. A 1989, 20, 311–322. [Google Scholar] [CrossRef]
  22. Beltran-Sanchez, L.; Stefanescu, D.M. A quantitative dendrite growth model and analysis of stability concepts. Metall. Mater. Trans. A 2004, 35, 2471–2485. [Google Scholar] [CrossRef]
  23. Kurz, W.; Giovanola, B.; Trivedi, R. Theory of microstructural development during rapid solidification. Acta Metall. 1986, 34, 823–830. [Google Scholar] [CrossRef]
  24. Roehling, T.T.; Wu, S.S.; Khairallah, S.A.; Roehling, J.D.; Soezeri, S.S.; Crumb, M.F.; Matthews, M.J. Modulating laser intensity profile ellipticity for microstructural control during metal additive manufacturing. Acta Mater. 2017, 128, 197–206. [Google Scholar] [CrossRef]
  25. Tang, C.; Tan, J.L.; Wong, C.H. A numerical investigation on the physical mechanisms of single track defects in selective laser melting. Int. J. Heat Mass Transf. 2018, 126, 957–968. [Google Scholar] [CrossRef]
  26. Cho, J.-H.; Farson, D.F.; Milewski, J.O.; Hollis, K.J. Weld pool flows during initial stages of keyhole formation in laser welding. J. Phys. D Appl. Phys. 2009, 42, 175502. [Google Scholar] [CrossRef]
  27. Panwisawas, C.; Qiu, C.; Anderson, M.J.; Sovani, Y.; Turner, R.P.; Attallah, M.M.; Brooks, J.W.; Basoalto, H.C. Mesoscale modelling of selective laser melting: Thermal fluid dynamics and microstructural evolution. Comput. Mater. Sci. 2017, 126, 479–490. [Google Scholar] [CrossRef]
  28. Andreau, O.; Koutiri, I.; Peyre, P.; Penot, J.D.; Saintier, N.; Pessard, E.; De Terris, T.; Dupuy, C.; Baudin, T. Texture control of 316L parts by modulation of the melt pool morphology in selective laser melting. J. Mater. Process. Technol. 2019, 264, 21–31. [Google Scholar] [CrossRef]
  29. Montero-Sistiaga, M.L.; Godino-Martinez, M.; Boschmans, K.; Kruth, J.P.; Van Humbeeck, J.; Vanmeensel, K. Microstructure evolution of 316L produced by HP-SLM (high power selective laser melting). Addit. Manuf. 2018, 23, 402–410. [Google Scholar] [CrossRef]
  30. Nagarajan, B.; Hu, Z.; Gao, S.; Song, X.; Huang, R.; Seita, M.; Wei, J. Effect of in-situ laser remelting on the microstructure of SS316L fabricated by micro selective laser melting. In Advanced Surface Enhancement: Proceedings of the 1st International Conference on Advanced Surface Enhancement (INCASE 2019)—Research Towards Industrialisation, Singapore, 10–12 September 2019; Springer: Singapore, 2020; pp. 330–336. [Google Scholar]
  31. Rappaz, M.; Gandin, C.-A. Probabilistic modelling of microstructure formation in solidification processes. Acta Metall. Et Mater. 1993, 41, 345–360. [Google Scholar] [CrossRef]
  32. Zinovieva, O.; Zinoviev, A.; Romanova, V.; Balokhonov, R. Three-dimensional analysis of grain structure and texture of additively manufactured 316L austenitic stainless steel. Addit. Manuf. 2020, 36, 101521. [Google Scholar] [CrossRef]
  33. William, T.A. Preferred growth direction of metals. JoM 1957, 9, 847–855. [Google Scholar]
  34. Chattopadhyay, C.; Sangal, S.; Mondal, K. A relook at the preferred growth direction of the solid–liquid interface during solidification of pure metals. Acta Mater. 2010, 58, 5342–5353. [Google Scholar] [CrossRef]
  35. Yadroitsev, I.; Krakhmalev, P.; Yadroitsava, I.; Johansson, S.; Smurov, I. Energy input effect on morphology and microstructure of selective laser melting single track from metallic powder. J. Mater. Process. Technol. 2013, 213, 606–613. [Google Scholar] [CrossRef]
  36. Li, X.; Tan, W. Numerical investigation of effects of nucleation mechanisms on grain structure in metal additive manufacturing. Comput. Mater. Sci. 2018, 153, 159–169. [Google Scholar] [CrossRef]
  37. Olorundaisi, E.; Jamiru, T.; Adegbola, T.A.; Ogunbiyi, O.F. Modeling and optimization of operating parameters using RSM for mechanical behaviour of dual phase steels. Mater. Res. Express 2019, 6, 105628. [Google Scholar] [CrossRef]
  38. Fatemi, S.A.; Ashany, J.Z.; Aghchai, A.J.; Abolghasemi, A. Experimental investigation of process parameters on layer thickness and density in direct metal laser sintering: A response surface methodology approach. Virtual Phys. Prototyp. 2017, 12, 133–140. [Google Scholar] [CrossRef]
Figure 1. (a) The outlook of additive manufacturing equipment WXL-120E; (b) The forming chamber of WXL-120E; (c) Micro-morphology of 316L stainless steel powder; (d) The CAD design of the lattice structure.
Metals 15 00267 g001
Figure 2. L-PBF fabricated lattice specimens (#9 missing).
Metals 15 00267 g002
Figure 3. (a) Schematics of three directions; (b) SEM image taken at 100× magnification showing the top-view surface morphology of the 45° inclined struts of specimen #1–#15 (#9 missing); The surface roughness and 3D height topography in the (c) vertical direction, (d) incline direction, and (e) top direction of specimens.
Metals 15 00267 g003aMetals 15 00267 g003bMetals 15 00267 g003c
Figure 4. Microstructural evolution of the cellular automata simulations of the single-layer laser melted part, which demonstrate the dendrite growth at (a) 0.01 s, (b) 0.1 s, (c) 0.2 s, and (d) 0.6 s; (e) Illustration of microstructural evolution and solidification during the manufacturing process.
Metals 15 00267 g004
Figure 5. (a) Inverse pole figure (IPF) maps showing the cross-sectional microstructural features of #8 manufacturing specimens; (b) pole figure (PF) maps corresponding to (a).
Metals 15 00267 g005
Figure 6. Normal probability plot of (a) vertical mean diameter, (b) incline top roughness, and (c) incline mean diameter.
Metals 15 00267 g006
Figure 7. The predicted value against the actual experimental data for (a) vertical mean diameter, (b) incline top roughness, and (c) incline mean diameter.
Metals 15 00267 g007
Figure 8. Contour graph showing vertical mean diameter (μm). (a) Under the combined effect of variable A and B, (b) Under the combined effect of variable A and C.
Metals 15 00267 g008
Figure 9. The surface plot for vertical mean diameter (μm). (a) Under the combined effect of variable A and B, (b) Under the combined effect of variable A and C.
Metals 15 00267 g009
Figure 10. Contour graph showing incline top roughness (μm). (a) Under the combined effect of variable A and B, (b) Under the combined effect of variable A and C.
Metals 15 00267 g010
Figure 11. The surface plot for incline top roughness (μm). (a) Under the combined effect of variable A and B, (b) Under the combined effect of variable A and C.
Metals 15 00267 g011
Figure 12. Contour graph showing incline mean diameter (μm). (a) Under the combined effect of variable A and B, (b) Under the combined effect of variable A and C.
Metals 15 00267 g012
Figure 13. The surface plot for incline mean diameter (μm). (a) Under the combined effect of variable A and B, (b) Under the combined effect of variable A and C.
Metals 15 00267 g013
Figure 14. Desirability contour graphs for each factor with terms: (a) laser power and scan speed; (b) laser power and overlap. The combined desirability value is 0.743.
Metals 15 00267 g014aMetals 15 00267 g014b
Figure 15. Optimization solution and validation for input factor and response variables with a desirability of 0.743. Under the optimal parameter set of laser power 377.157 W, scan speed 200 mm/s, and overlap 0.08 mm, it is predicted that the best actual manufacturing size and roughness will be achieved.
Metals 15 00267 g015
Figure 16. (ac) Inverse pole figure (IPF) maps showing the cross-sectional microstructural features of #13, #15, and #14 manufacturing specimens, respectively; (df) pole figure (PF) maps corresponding to (ac), respectively.
Metals 15 00267 g016
Table 1. Chemical composition of SS316L powders.
ElementNiCrMoSiMnCOSPFe
Wt. (%)12.317.522.260.771.660.0140.06540.0030.011Bal.
Table 2. RSM-CCD experimental design.
No.Laser Power (w)Scan Speed (mm/s)Overlap (mm)
11604000.02
23204000.02
31608000.02
43208000.02
51604000.06
63204000.06
71608000.06
83208000.06
9806000.04
104006000.04
112402000.04
1224010000.04
132406000
142406000.08
152406000.04
Table 3. Measurement results recorded for ANOVA analyses.
StdRunFactor 1
A: Laser Power
w
Factor 2
B: Scan Speed
mm/s
Factor 3
C: Overlap
mm
Response 1
Vertical Mean Diameter
μm
Response 4
Incline Top Roughness
μm
Response 5
Incline Mean Diameter
μm
1151604000.02650.5327.22481.273
293204000.02545.90811.91450.583
3111608000.02504.09118.70416.173
4123208000.02596.1276.92427.798
571604000.06490.57313.63378.508
6103204000.06574.7384.26383.623
711608000.06390.13315.39318.524
853208000.06500.3385.93385.483
96806000.04
10134006000.04642.1624.50476.158
1142402000.04726.7923.57491.503
12224010000.04472.43815.96363.628
1332406000610.07714.53416.173
1482406000.08449.6534.26338.519
15142406000.04493.82812.04392.458
Table 4. MANOVA for vertical mean diameter.
SourceSum of SquaresdfMean SquareF-Valuep-ValueSignificant or Not
Model1.071 × 105911,903.5626.520.0032Significant
A-laser power14,498.50114,498.5032.300.0047
B-scan speed32,347.94132,347.9472.060.0011
C-overlap27,367.54127,367.5460.970.00115
Residual1795.554448.89
Cor Total1.089 × 10513
Table 5. MANOVA for incline top roughness.
SourceSum of SquaresdfMean SquareF-Valuep-ValueSignificant or Not
Model345.99843.2531.020.0008Significant
A-laser power115.281115.2882.690.0003
B-scan speed76.73176.7355.040.0007
C-overlap52.75152.7537.840.0017
Residual6.9751.39
Cor Total352.9613
Table 6. MANOVA for incline mean diameter.
SourceSum of SquaresdfMean SquareF-Valuep-ValueSignificant or Not
Model36,039.01103603.9036.400.0065Significant
A-laser power3916.3513916.3539.550.0081
B-scan speed8175.9418175.9482.570.0028
C-overlap3015.1213015.1230.450.0117
Residual297.05399.02
Cor Total36,336.0613
Disclaimer/Publisher’s Note: The statements, opinions and data contained in all publications are solely those of the individual author(s) and contributor(s) and not of MDPI and/or the editor(s). MDPI and/or the editor(s) disclaim responsibility for any injury to people or property resulting from any ideas, methods, instructions or products referred to in the content.

