Article

Arc Erosion Properties of the Ag-Cr2AlC Contact Material

1
School of Material and Chemical Engineering, Bengbu University, Bengbu 233030, China
2
Engineering Technology Research Center of Silicon-Based Materials, Bengbu 233030, China
3
School of Chemistry and Materials Engineering, Huainan Normal University, Huainan 232001, China
*
Authors to whom correspondence should be addressed.
Metals 2025, 15(3), 293; https://doi.org/10.3390/met15030293
Submission received: 3 February 2025 / Revised: 5 March 2025 / Accepted: 6 March 2025 / Published: 7 March 2025

Abstract

:
This study investigates the arc performance of Ag-Cr2AlC composite materials. Spark plasma sintering method was employed to prepare the Ag-Cr2AlC composite material. A self-made arc erosion device was utilized to erode the material with different times of arc. The surface of the material was categorized into three distinct areas: the eroded center area, the eroded edge area, and the heat-affected area. After one time of arc erosion, the material exhibits a relatively flat surface with a small erosion area. However, after one hundred arc erosions, the eroded area has significantly increased, accompanied by numerous splashes, protrusions, and pores. The action of the arc leads to the decomposition and oxidation of the Ag-Cr2AlC composite material, resulting in the formation of Ag2O, Al2O3, and Cr2O3 on the surface. During the process of 100 arc erosions, the breakdown current value remains relatively stable, ranging from 20 to 35 A. From the first to the 70th arc erosion, the breakdown strength consistently varies between 3 × 10⁶ V/m and 6 × 10⁶ V/m. Subsequently, there is an observed enhancement in breakdown strength, leading to the appearance of ageing. These findings establish a theoretical foundation for the application of silver-based electrical contact materials.

1. Introduction

Electric contact materials are crucial components in various electrical devices, particularly in switches, relays, and connectors, where they facilitate the flow of electrical current. The high temperature generated by the arc can melt the contact, damage the insulation material, and potentially ignite the entire electrical equipment [1,2]. The presence of the arc prolongs the time required to open the switch of electrical appliances and exacerbates the consequences of short-circuit failures within the power system [3]. The generation and maintenance of arcs involves a series of complex processes that span multiple disciplines, including physics, chemistry, electrical engineering, thermodynamics, and mechanics. Therefore, it is essential to evaluate the damage to the electric contact material caused by the arc in advance [4].
Common electric contact materials primarily consist of silver-based compounds. Silver is recognized as the most conductive metal, possessing low contact resistance and excellent antioxidant properties [5]. Consequently, silver is extensively utilized in electrical contact components that require high precision and reliability, such as high-precision relays and small switches [6]. Although silver-based electrical contact materials are widely utilized in electrical engineering, several limitations persist. Firstly, there is insufficient resistance to arc erosion; under conditions of high current or frequent switching operations, these materials are vulnerable to arc erosion, which results in surface roughness, increased contact resistance, and ultimately compromises the reliability and lifespan of the equipment. Secondly, the anti-wear performance is limited; over prolonged use, electrical contact materials experience mechanical wear, leading to a reduction in contact area and an increase in contact resistance, thereby adversely affecting equipment performance. Lastly, poor high-temperature stability is a concern; in elevated temperature environments, silver-based materials are susceptible to oxidation and softening, which result in a decline in material performance. To mitigate the disadvantages associated with sterling silver, small amounts of other metallic elements are often incorporated into the silver, resulting in various alloys such as AgCu alloy, AgNi alloy, AgW alloy, and Ag-based composite materials [7,8,9,10,11]. MAX phases are a class of nanolaminated ternary ceramics characterized by the general chemical formula Mn+1AXn, where M represents an early transition metal (e.g., Ti, V, Cr), A denotes an A-group element (e.g., Al, Si), X signifies carbon or nitrogen, and n typically takes on values of 1, 2, or 3. These materials exhibit a distinctive combination of metallic and ceramic properties, including high hardness, good electrical and thermal conductivity, excellent thermal shock resistance, and machinability. Such characteristics render MAX phases promising candidates for applications in high-temperature structural materials, electrode materials, and components for nuclear reactors [12,13]. Therefore, Ag-MAX composite materials are expected to be used in the field of brush and electric contact [14,15,16,17].
Considering the limitations of silver-based electrical contact materials and the advantages of MAX-phase materials, conducting an in-depth study of Ag-Cr2AlC electrical contact materials holds significant theoretical and practical importance. The Ag-Cr2AlC composite material was prepared by spark plasma sintering (SPS). The material was eroded with one and 100 times of arc erosions to explore the impact of arc number on the performance of the Ag-Cr2AlC composite material, including its erosion area, breakdown strength, morphologies and compositions. The findings of this research aim to expand the applications of Ag-based contact materials.

2. Experimental Procedures

2.1. Sample Preparation

Ag powder (purity > 99.9%, 200 mesh, Beijing Nonferrous Metals Research Institute, Beijing, China) and Cr2AlC powder (purity > 98%, 200 mesh, Laizhou Kai Kai Ceramic Materials Company Ltd., Laizhou, China) were mechanically mixed for two hours using a mixer, with a Cr2AlC volume fraction of 20%. The mixed powder was then placed into a spark plasma sintering furnace (SPS-3T-3-MIN, Shanghai Chenhua Science Technology Corp., Ltd., Shanghai, China), where it was heated to 700 °C at an elevated rate of 100 °C/min and held at that temperature for 30 min. Following this, the samples were cooled in the furnace before being removed for grinding and polishing. The Archimedes’ method was employed to determine the material densities. A microhardness tester (YZHV-IZP, Shanghai Aolong Xingdi Testing Instrument Co., Ltd., Shanghai, China) was employed to assess the hardness of Ag-Cr2AlC composites. The microhardness was evaluated by applying a positive quadrangular conical diamond indenter, with an angle of 136° between the top two opposite faces, onto the surface of the material under test. A specific test force was applied, maintained for a designated duration, and subsequently released to measure the diagonal length of the resulting indentation. The load utilized for this assessment was 100 g. The microhardness of the Ag-Cr2AlC composites was calculated in accordance with Equation (1) following the release of the load after a 30 s hold.
HV = 0.1891 F d 2
where HV is the microhardness, F is the test force (N), and d is the mean value of the diagonal length of the indentation (mm). Compositional analyses of the sintered bulk materials were carried out using X-ray diffractometer (XRD, SmartLabSE, Tokyo, Japan). The distribution of Ag and Cr2AlC materials was assessed using optical microscopy (LIOO M110T, Beijing Jinghao Yongcheng Trading Co., Beijing, China). Additionally, a thermal field emission scanning electron microscope (TFE-SEM, ZEISS Gemini 500, Carl Zeiss AG, Oberkochen, Germany), equipped with energy dispersive X-ray spectroscopy (EDS, Oxford Aztec UltimMax100, Oxford Instruments, London, UK), was employed to analyze and document the morphology and composition of the Ag-Cr2AlC composites.

2.2. Arc Erosion Test

Using a self-made arc erosion device, the loading voltage of the two electrodes was set to 7 kV. Here, Ag-Cr2AlC composite was used as the cathode and W-rod with tip as the anode, and the voltage of the two electrodes was set to be 7 kV, and subsequently the cathode and anode were allowed to move slowly relative to each other. Under the influence of a strongly nonuniform field, electron avalanche and positive streamer were generated, causing the originally insulated air to conduct and ultimately leading to an electric arc. This arc resulted in erosion damage to the cathode. Arc erosion experiments were carried out 1 and 100 times to compare the effect of number of discharges on the arc erosion properties of Ag-Cr2AlC composites. The composition and morphology of the surface after arc erosion were analyzed. Additionally, a digital oscilloscope (GA1102CAL) was utilized to record the breakdown current and arc life for 1 and 100 cycles, after which the breakdown strength was calculated.
The surface appearance analysis following arc erosion was conducted using a thermal field emission scanning electron microscope (TFE-SEM, ZEISS Gemini 500, Carl Zeiss AG, Oberkochen, Germany), which is equipped with energy dispersive X-ray spectroscopy (EDS, Oxford Aztec Ul-timMax100, Oxford Instruments, London, UK) and three-dimensional laser scanning morphology (3D LSCM, Keyence VK-X250, Osaca, Japan). Composition analysis employed a combination of EDS and Raman spectra (Lab RAM-HR, HORIBA, Kyoto, Japan), which was used to detect the type of bonding over the wavenumber range of 100 to 1200 cm−1. The Raman spectra were excited with a Nd: YAG laser, with an incident power of 4 mW.

3. Results and Discussion

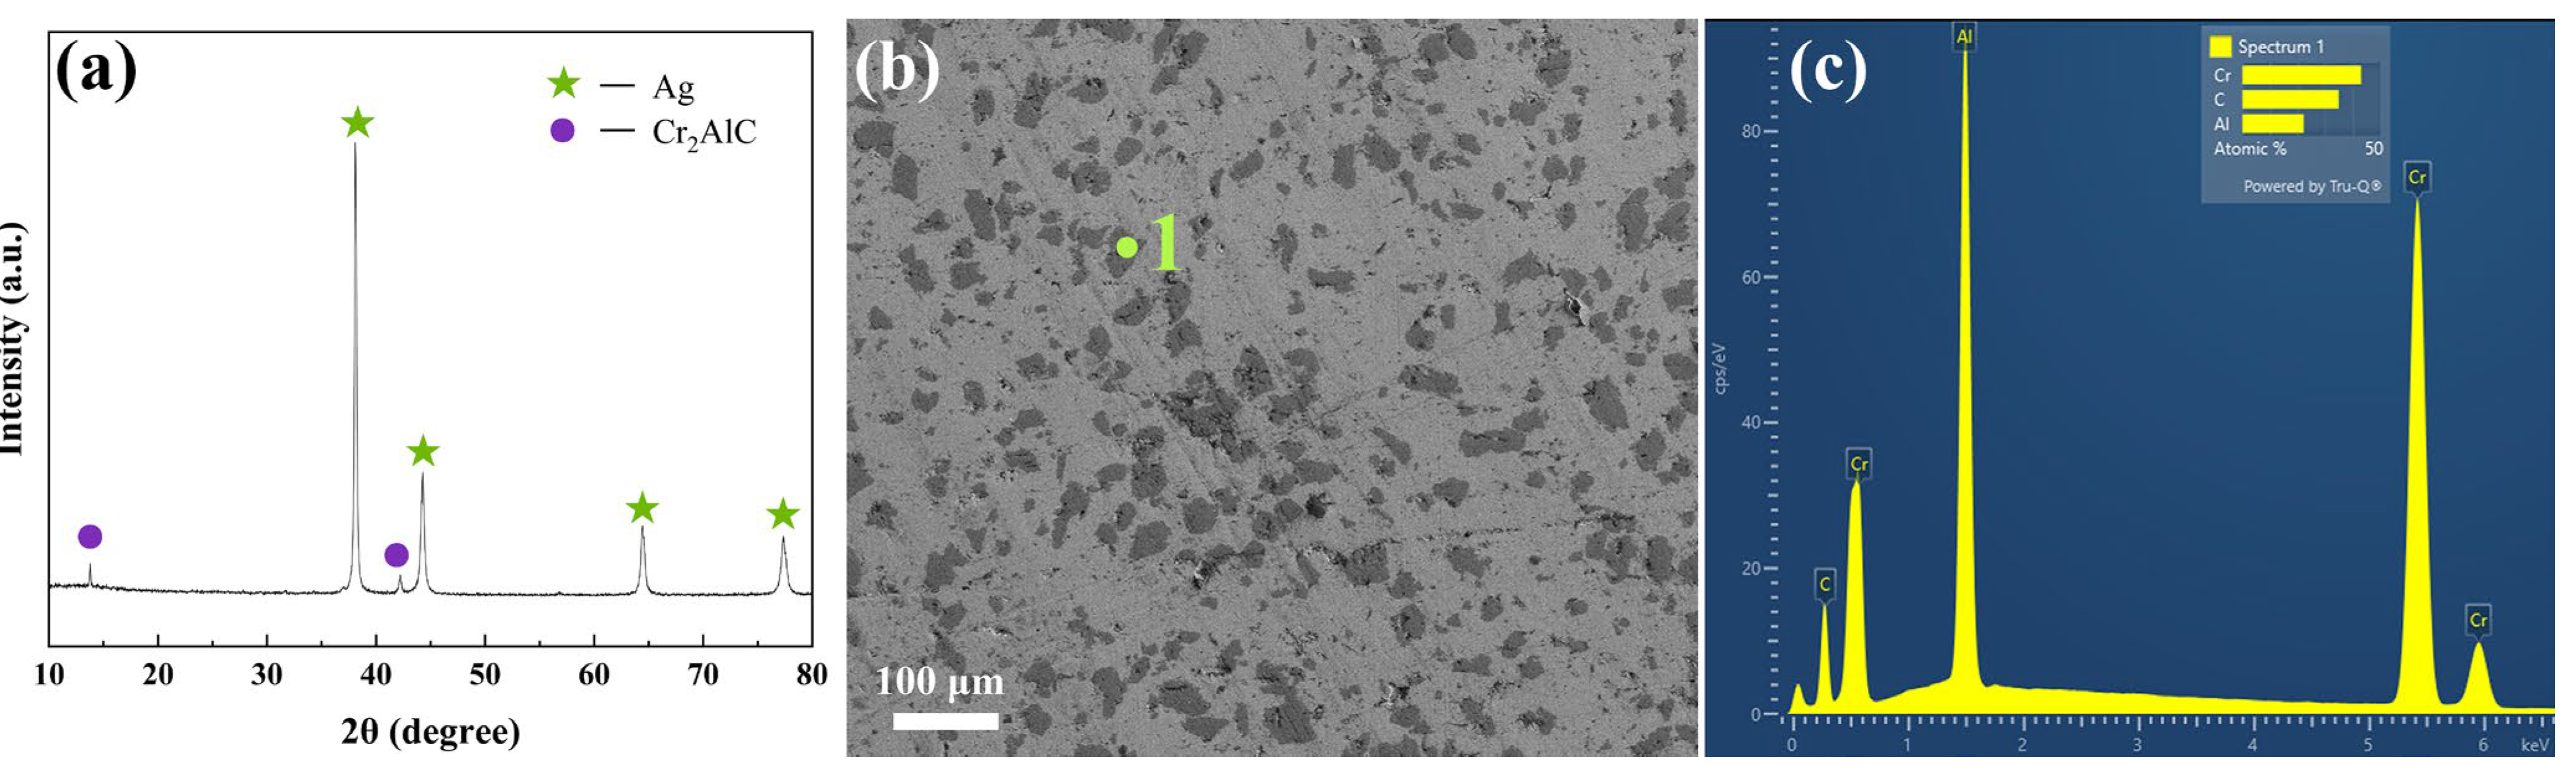
3.1. Physical Properties

The composition of the sintered sample was examined, as illustrated in Figure 1. Peaks corresponding to Ag (PDF#04-0783) and Cr2AlC (PDF#29-0017) materials were identified in Figure 1a. Figure 1b presents a microscopic image of the Ag-Cr2AlC composite material, revealing the presence of two distinct phases. The dark grey phase is uniformly distributed across the surface of the light grey phase. A point-scanning analysis was conducted on the dark grey phase at position 1 (green dot in Figure 1b), with the results displayed in Figure 1c. From Figure 1c, it is evident that this phase corresponds to the Cr2AlC material.
The densities of Ag-20 vol.% Cr2AlC composites were determined to be 93.3% using the Archimedes’ method. Upon applying a load of 0.98 N to the surface of Ag-Cr2AlC with a microhardness tester, the resulting formation is illustrated in Figure 2. The diagonal length of the indentation measured by the microhardness tester is presented in Table 1, and the average microhardness, calculated from three measurements, was found to be 60.9 HV. In Table 1, d1 and d2 represent the diagonal lengths of the indentations, and d represents the average value of the diagonal lengths. The indentation images suggest non-uniform deformation around the particles. This non-uniformity is indeed related to the heterogeneous microstructure of the Ag-Cr2AlC composite material. The composite consists of a soft Ag matrix and hard Cr2AlC particles, which exhibit significantly different mechanical properties. During indentation the soft Ag matrix undergoes plastic deformation more readily, while the hard Cr2AlC particles resist deformation, resulting in localized stress concentrations and non-uniform deformation patterns around the particles. This behavior aligns with previous studies on metal-ceramic composites, where the hardness mismatch between the matrix and reinforcement phases leads to similar deformation characteristics.

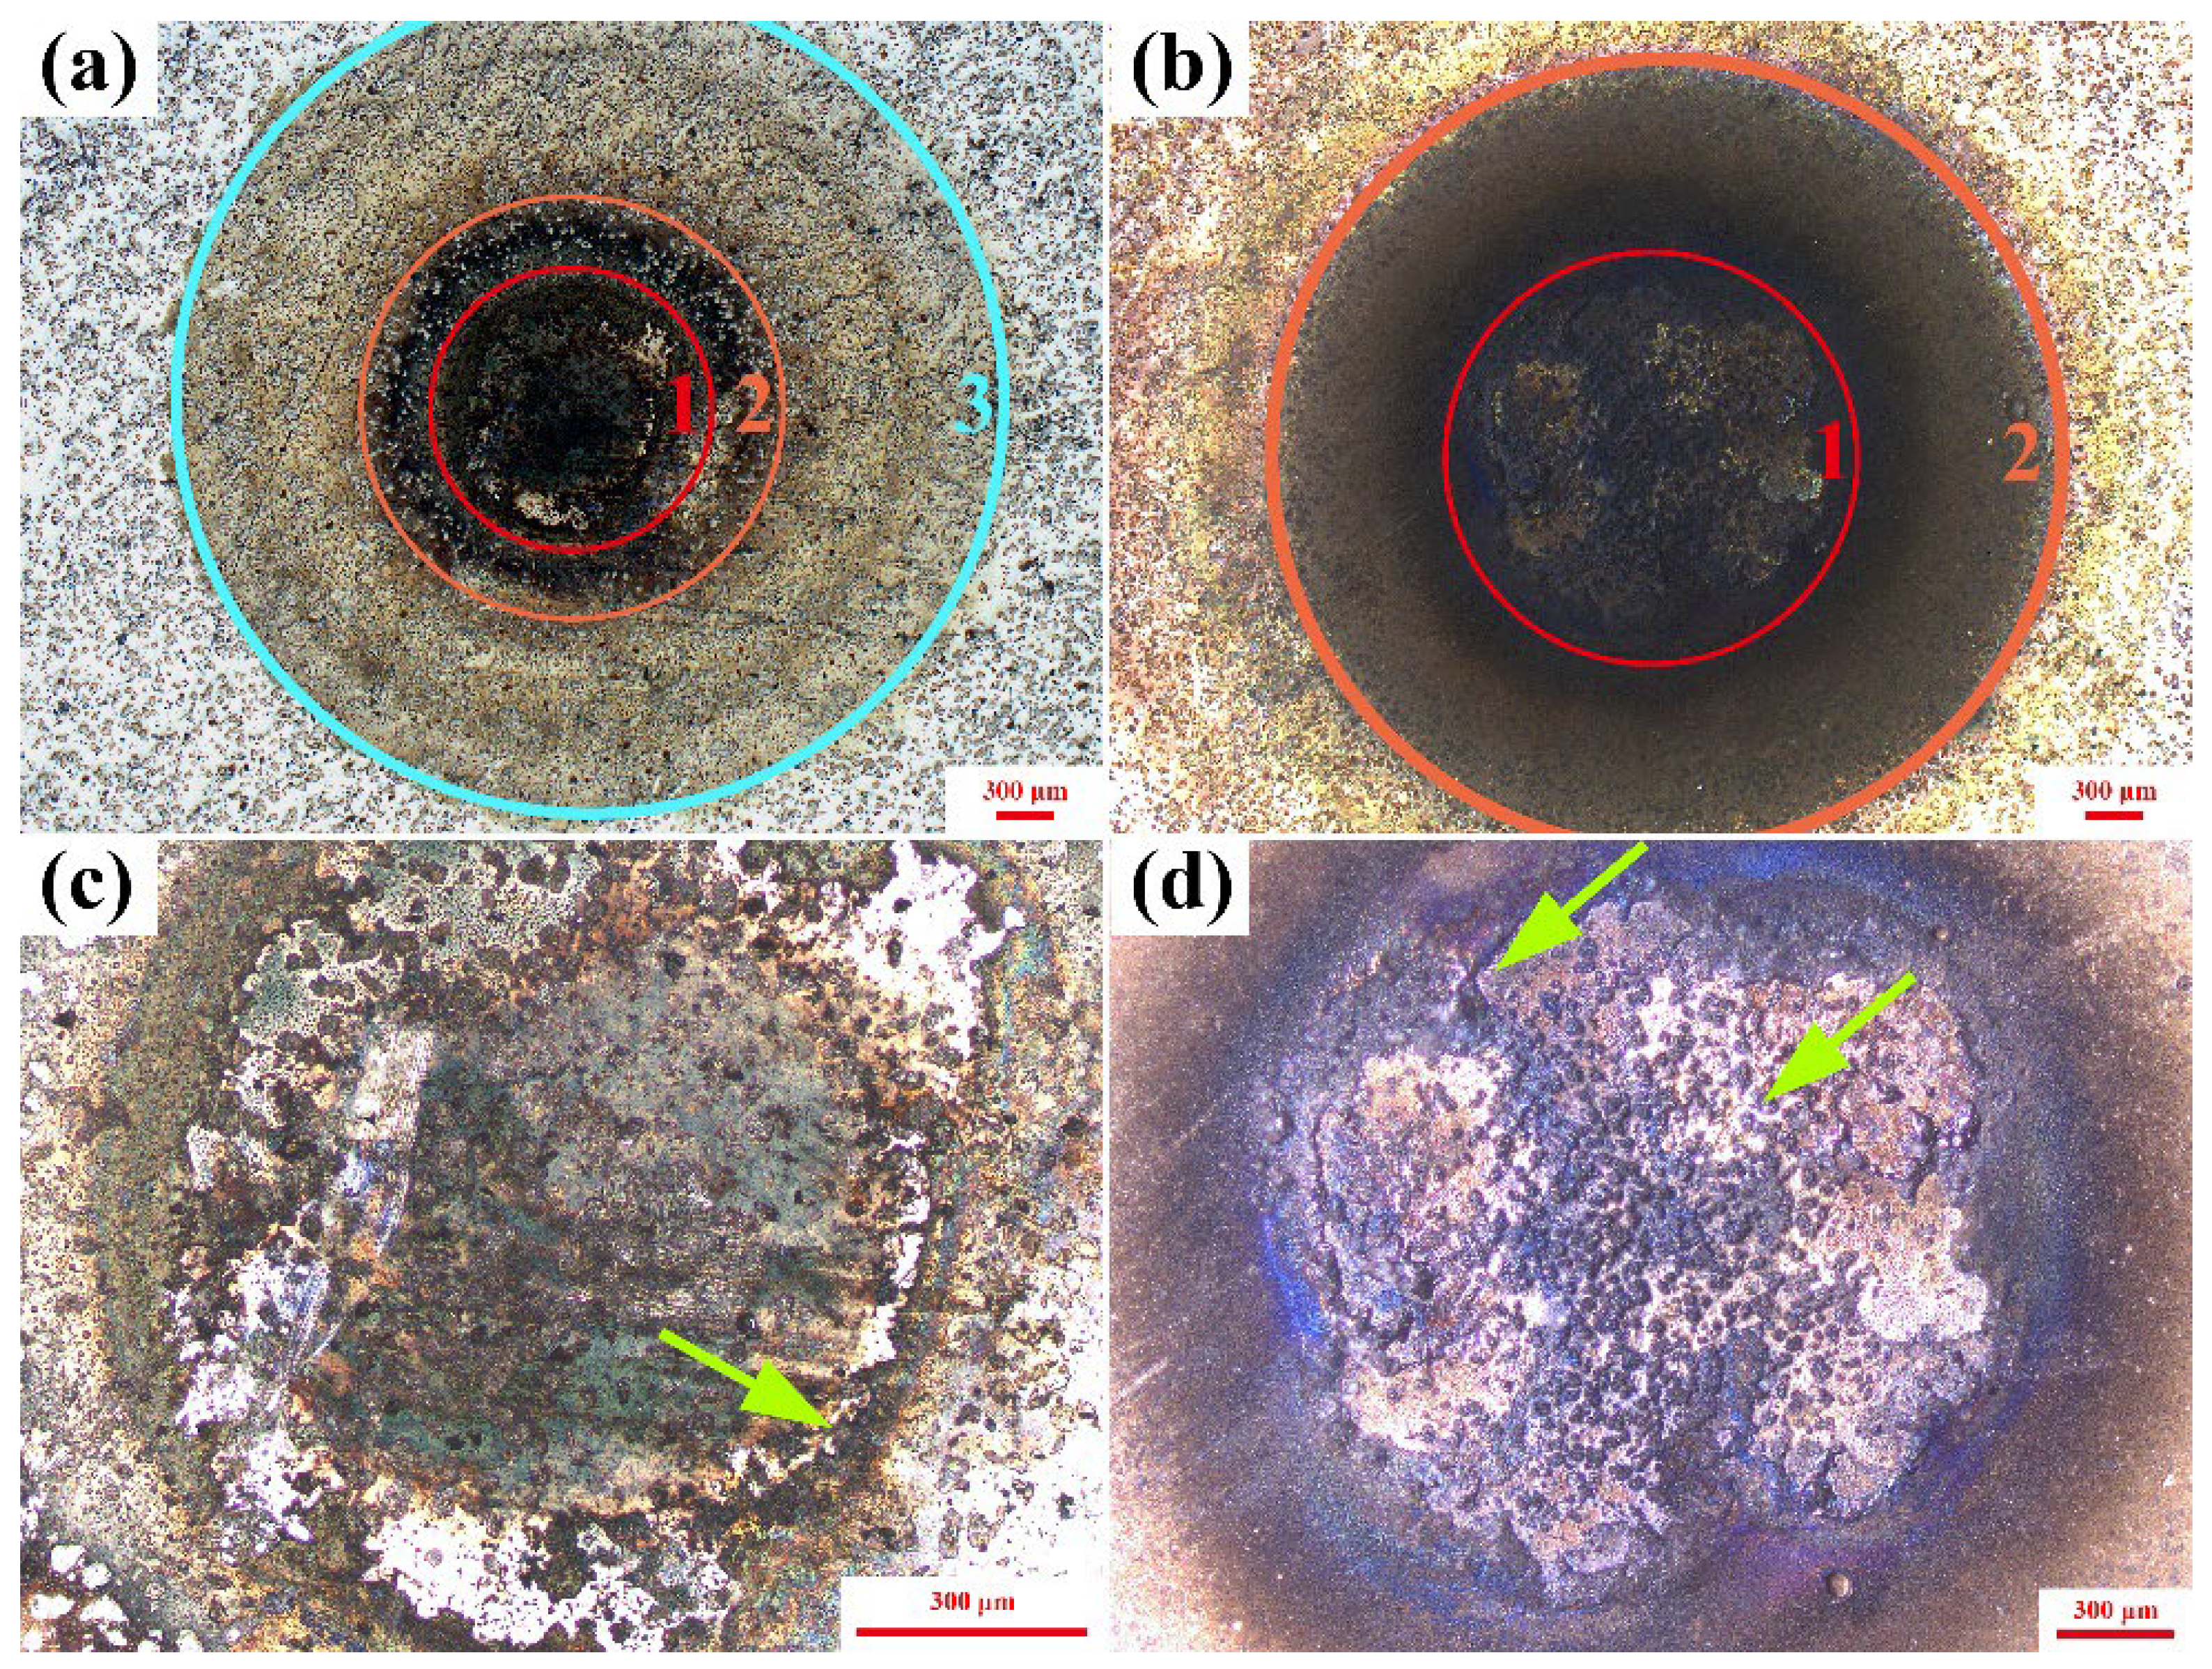
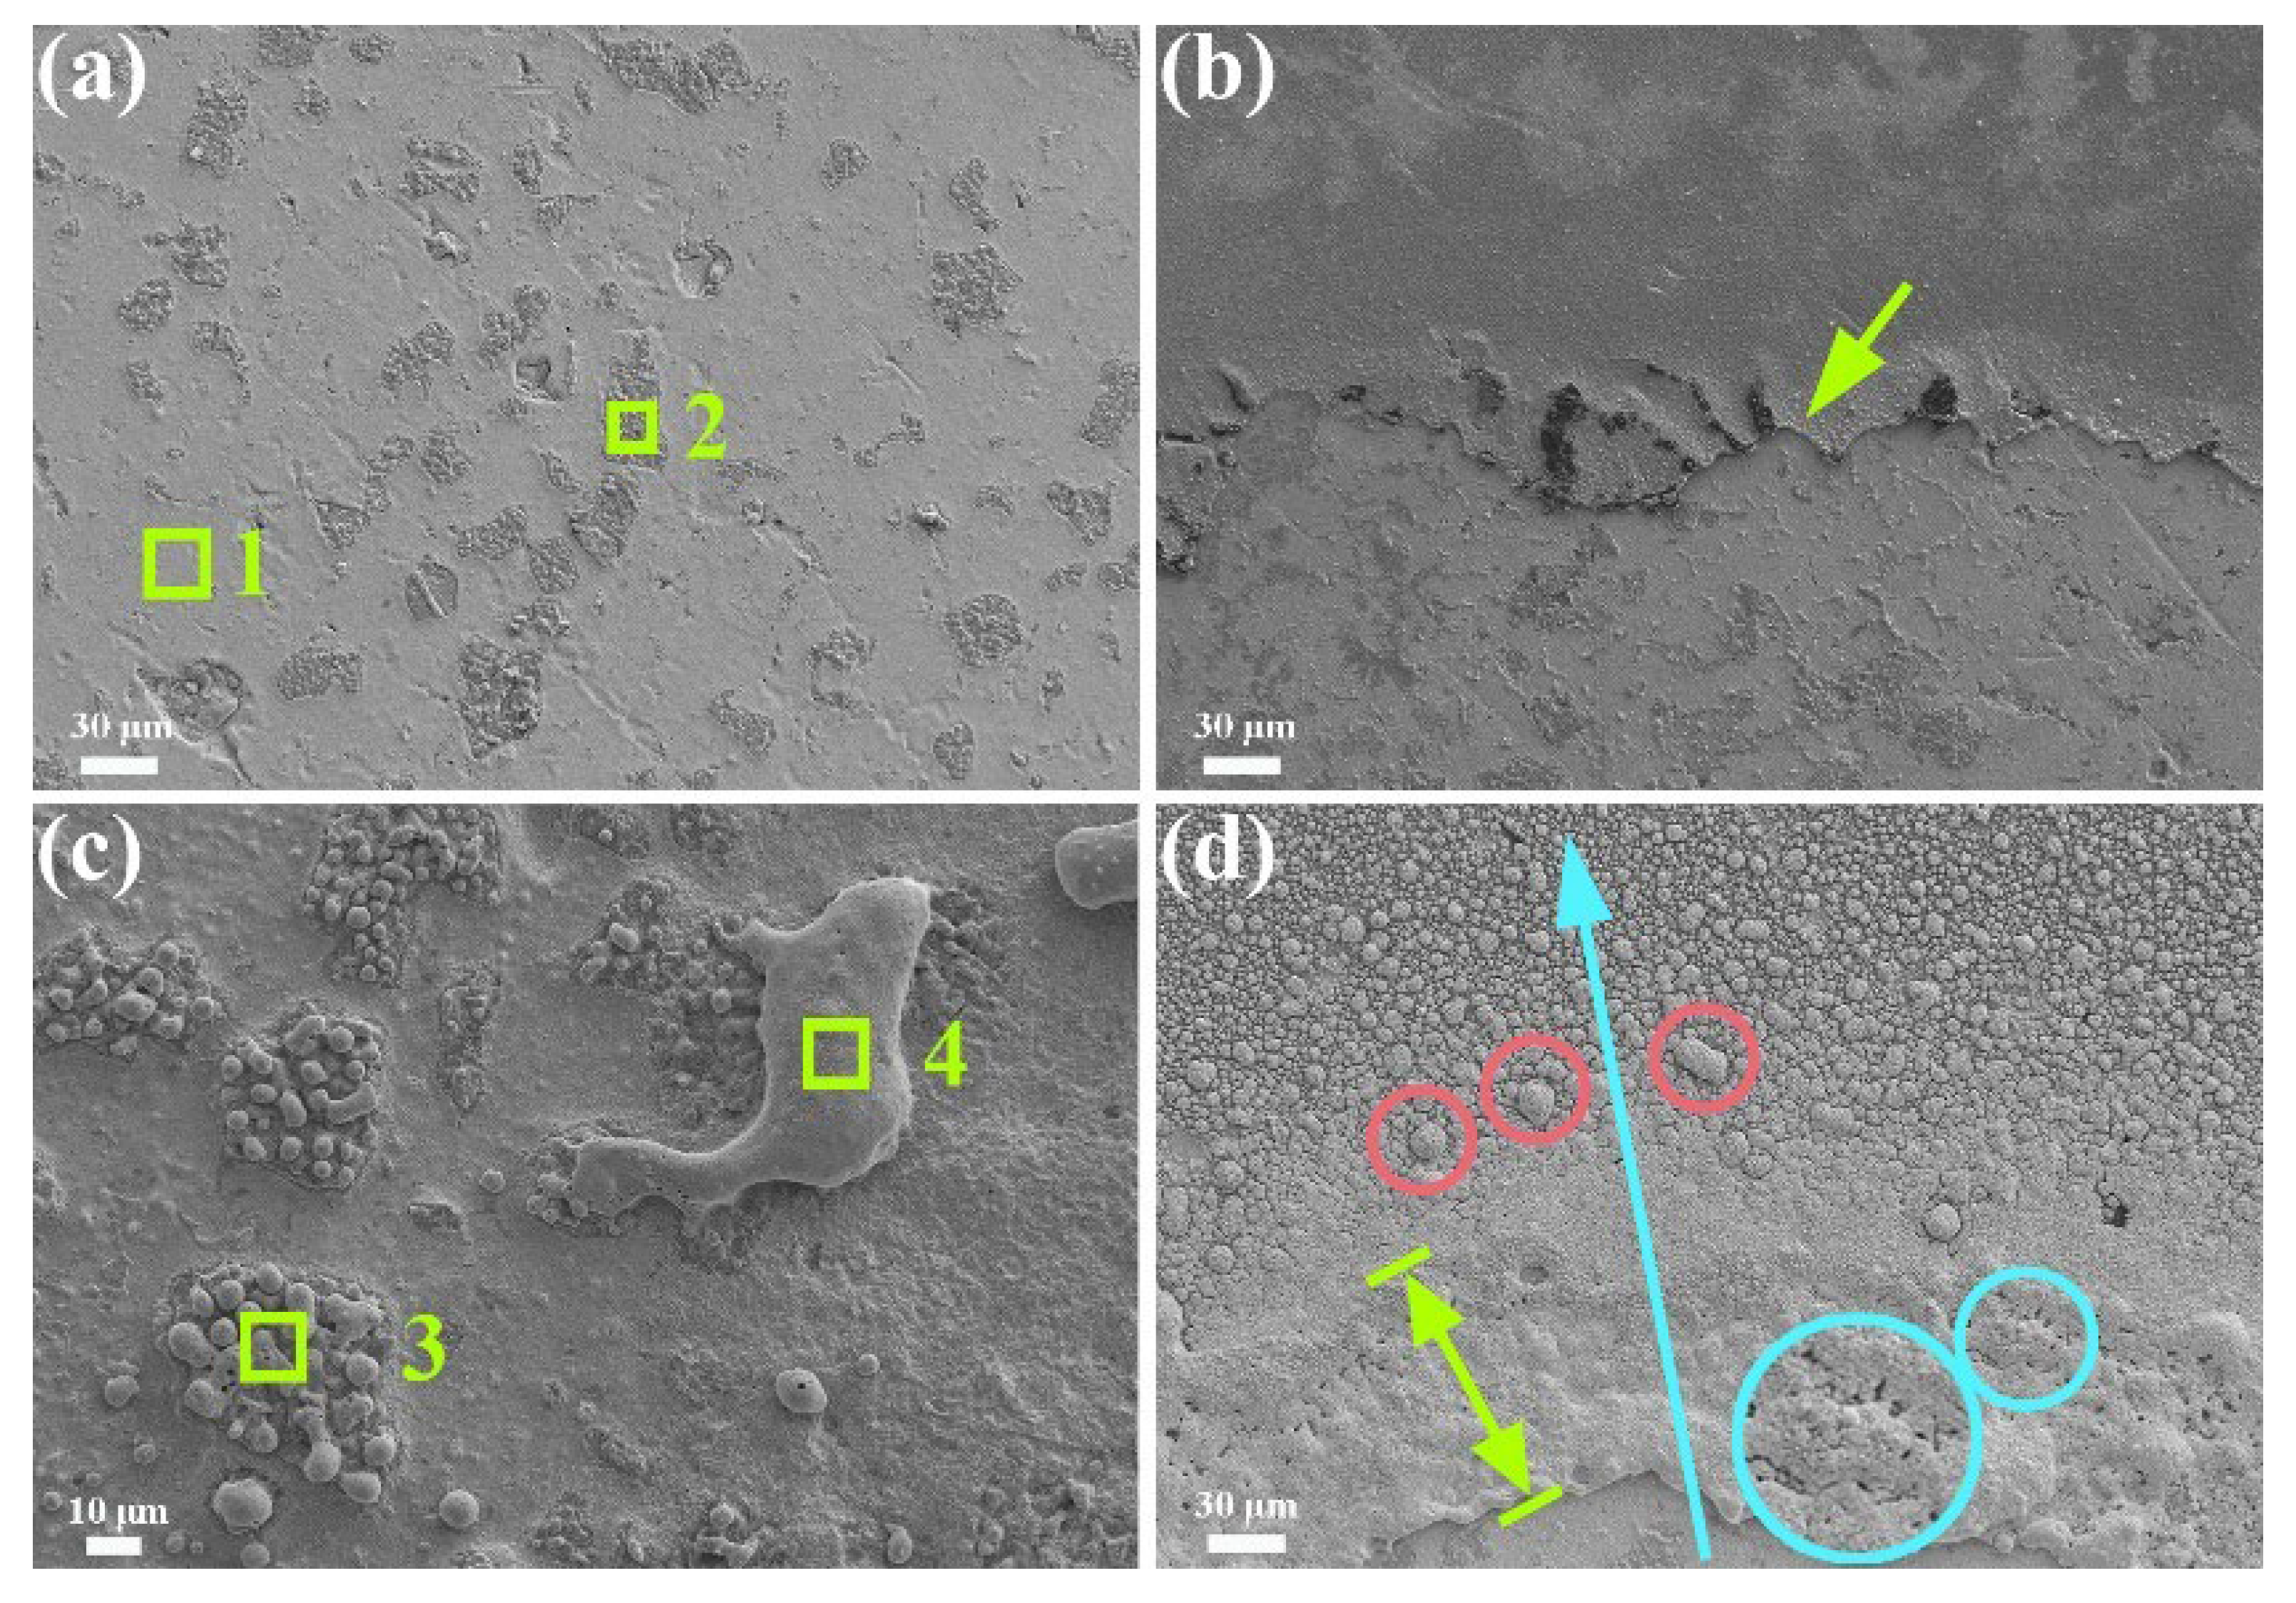
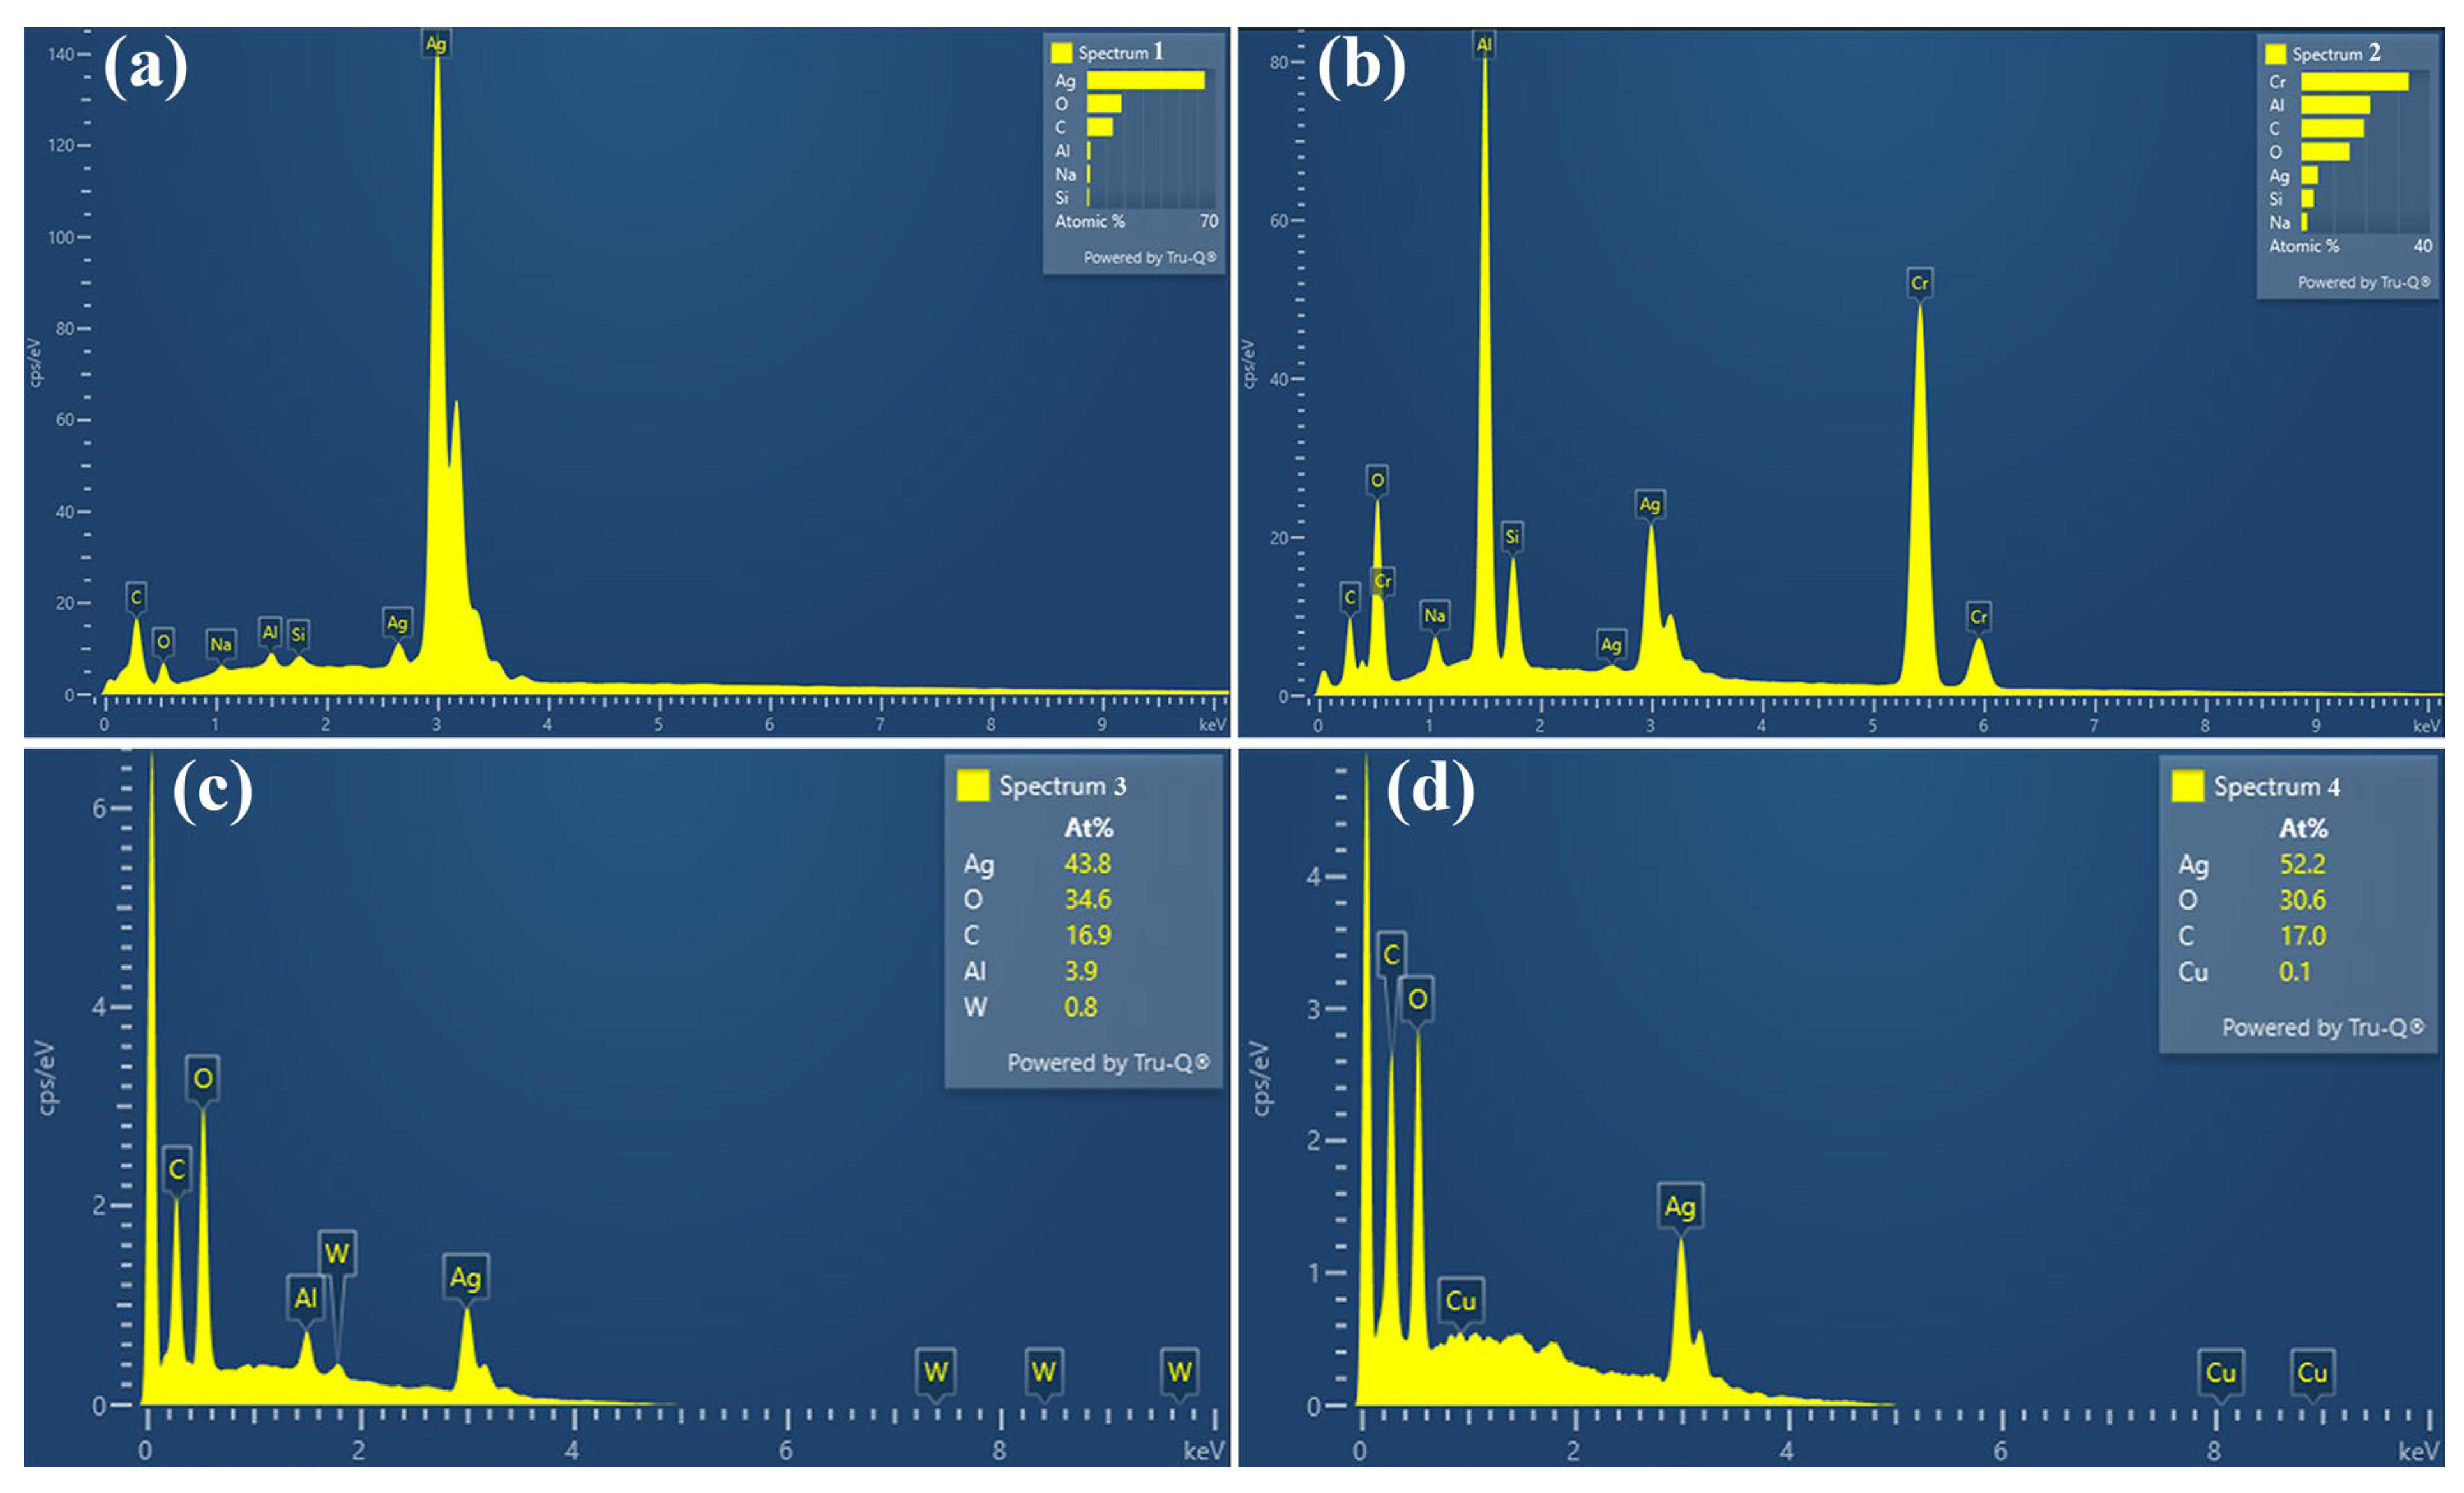
3.2. Arc Erosion Performance

The Ag-Cr2AlC composites were subjected to one and 100 times of arc erosion at a load voltage of 7 kV, with the eroded morphology illustrated in Figure 3a and Figure 3b, respectively. As observed in Figure 3a, the eroded shape exhibits a rounded shape. Based on the varying colors following erosion, the eroded area can be categorized into three distinct regions: the eroded center area, the eroded edge area, and the heat-affected area, as depicted in Figure 3a. The eroded center area corresponds to the region within circle 1, while the eroded edge area is defined as the space enclosed between circle 1 and circle 2. The heat-affected area is located between circle 2 and circle 3. In Figure 3b, the same divisions are applied; however, due to the limited magnification of the device, the heat-affected zone is not depicted within the image. The software equipped with the 3D LSCM was utilized to measure the arc erosion area. The erosion area of Ag-Cr2AlC composites after one arc erosion is approximately 1.32 × 106 μm2, while the erosion area after 100 arc erosions is approximately 3.84 × 106 μm2. A comparison of Figure 3a,b reveals that, after 100 times of arc erosion, the eroded center area is significantly larger than that observed after a single erosion. This trend is also evident in both the eroded edge area and the heat-affected area. The morphology of the eroded center area is further enlarged in Figure 3c and Figure 3d, respectively. The morphology appears relatively flat, with only the edge of the eroded center exhibiting a morphology of protrusion, as shown by arrow in Figure 3c. Conversely, Figure 3d displays a topography characterized by numerous protrusions, as indicated by the arrows.
The micrographs of the surface of Ag-Cr2AlC composites after one and 100 times of arc erosion are shown in Figure 4a,b and Figure 4c,d, respectively. In Figure 4a, the eroded morphology is relatively flat, and basically the distribution of the matrix and reinforcement phases can be recognized. The eroded edges are narrower, as indicated by the arrows in Figure 4b. The materials in rectangles 1 and 2 were analyzed through EDS, as shown in Figure 5a,b. From Figure 5a, it is evident that rectangle 1 primarily contains the elements Ag and O, along with a minor presence of Al. Meanwhile, rectangle 2 predominantly consists of the elements Cr, Al, and C, with a small amount of Ag. This suggests that after one arc erosion, only a limited quantity of Ag oxidized on the surface, and only a small fraction of the Cr2AlC phase decomposed. Small amounts of elemental Si and Na were also detected in both EDS results, which may be impurities left over from polishing and cleaning. After 100 times of arc erosion, the eroded center area depicted in the local magnification of Figure 4c, material melting and solidification can be observed. Focusing on the eroded edge area, it is observed that the width of the edge is greater than that observed after one time of arc erosion, measuring over 100 µm. There are many spatter particles of different sizes outside the eroded edge area, as the area shown by the red circle in Figure 4d, where the spatter particles are larger. From the eroded center towards the edge, the particle size gradually becomes smaller, as indicated by the blue arrow in Figure 4d. The eroded edge exhibits distinct morphological characteristics of material melting and re-solidifying, while numerous holes are formed, as illustrated by the blue circle in Figure 4d. Point-scanning of the material at rectangles 3 and 4 were conducted, and the results are presented in Figure 5c,d. Elemental analysis revealed that Ag, O, and C were predominantly detected at rectangle 3, along with trace amounts of Al and W. In comparison to the results from one arc erosion, these findings indicate that a significant quantity of molten Ag was sputtered onto the surface of the material, while W elements from the anode were deposited onto the surface of the cathode following 100 cycles of arc erosions. At rectangle 4, the elements Ag, O, and C were primarily examined. The morphology observed at this location is a result of the melting and re-solidification of metallic silver. Spectroscopic analysis reveals that the Ag-Cr2AlC composites exhibit oxides on their surface, and Cr2AlC decomposed following both 1 and 100 arc erosions. After 100 cycles of erosion, the melted silver was subjected to arc forces, resulting in the sputtering of particles of varying sizes. The splashed/sputtered Ag particles observed after 100 arc erosions could indeed contribute to the formation of conductive debris, which may have significant implications for the electrical performance of the contact material. Conductive debris could potentially lead to short circuits, increased contact resistance, or even arc reignition under certain conditions. We suggest that future studies could explore surface modifications or protective coatings to minimize the splashing of Ag particles and reduce debris formation. In Figure 4, traces of material melting and re-solidification are evident. Additionally, Figure 3 shows that the eroded area resulting from 100 arc erosions is significantly larger than that from a single arc burn. Moreover, after one arc erosion, as depicted in Figure 4, the amount of material ejected from the melt pool is minimal; conversely, after 100 arc erosions, a substantial number of particles are observed to be splashing.
The 3D laser scan images following 1 and 100 arc erosions are presented in Figure 6. The color coordinates in this figure indicates height, with red representing a bump and blue indicating a depression. In Figure 6a, there is an absence of blue areas at the eroded center, suggesting that a single arc erosion does not produce a depression. Conversely, Figure 6b clearly shows that the eroded center is blue, while the edges are raised in red. This observation indicates that after multiple arc erosions, a concentrated eroded crater morphology has formed at the center, while the edges exhibit a raised morphology due to the arc force [18,19,20].
Raman spectroscopy was employed to analyze the composition of the eroded center area following 1 and 100 arc erosions. The laser light from the Raman spectrometer is directed at the green cross in the inset of Figure 7. Figure 7a presents the Raman spectrum of the Ag-Cr2AlC composite following one arc erosion, revealing the presence of Cr2O3 (R060892), Al2O3 (X050045), and Ag2O on the surface [21,22,23]. Figure 7b displays the Raman spectrum of the Ag-Cr2AlC composite after 100 arc erosions, where the same substances—Cr2O3, Al2O3, and Ag2O—are also detected on the surface. Combined with the energy spectrum results in Figure 1, these findings indicate that the Ag-Cr2AlC composite material experiences oxidation after both one and 100 arc erosions.
Under the action of the electric field, the original insulation of the air breakdown occurs, the current instantaneously reaches its maximum value, this maximum value is the breakdown current. Figure 8 shows the curve of current-time after one discharge. This time the breakdown current is 28 A. The breakdown currents for 100 discharges are recorded in Figure 9a. It is evident that when the loading voltage is set at 7 kV, the breakdown current values remain relatively stable, fluctuating between 20 A and 35 A.
Breakdown strength is employed to evaluate the susceptibility to arc formation; a higher breakdown strength indicates a lower likelihood of arc occurrence. The breakdown strength can be calculated using Equation (2) [24].
E = U d
where E is the breakdown strength (V/m), U is the loading voltage (V), and d(m) is the distance between the two electrodes. The breakdown strength of 100 arc erosions is calculated and presented in Figure 9b. It can be observed that when the number of discharges ranges from the 1st to the 70th, the breakdown strength remains relatively stable between 3 × 10⁶ V/m and 6 × 10⁶ V/m. Subsequently, as the arc erosion reaches the 90th discharge, the breakdown strength gradually increases to 11.38 × 10⁶ V/m, indicating that the arc of the Ag-Cr2AlC material becomes more resistant to occurrence after numerous discharges. This phenomenon is known as ageing, which has also been reported in other literature [25,26,27,28]. Starting from the 91st discharge, the breakdown strength again stabilizes between 3 × 10⁶ V/m and 6 × 10⁶ V/m. According to the Fowler-Nordheim equation, the field enhancement factor (β) is intrinsically linked to the surface geometry [29,30]. As illustrated in Figure 3c,d, an increase in the number of discharges results in the formation of a pronounced protrusion morphology on the surface. The tips of these protrusions exhibit a smaller radius of curvature, which contributes to a higher β-value. This enhancement significantly amplifies the local electric field, thereby accelerating electron emission prior to breakdown and ultimately reducing the breakdown strength. In our previous discussion, we analyzed the breakdown strength of T3SiC2 material at a voltage of 7 kV [18]. The breakdown strength of Ti3SiC2 after 100 cycles of arc erosions remains stable, ranging from 1.2 × 10⁶ V/m to 1.3 × 10⁶ V/m. Notably, the breakdown strength of Ag-Cr2AlC composites exceeds that of pure Ti3SiC2 material, indicating that Ag-Cr2AlC composite material exhibits superior resistance to arc erosion. This observation reinforces the conclusion that Ag-Cr2AlC composites possess enhanced resistance to arc erosion compared to pure Ti3SiC2 material.

4. Conclusions

In this study, the arc erosion properties of Ag-Cr2AlC composites were systematically investigated from both theoretical and practical perspectives using a combination of the finite element method and experiments.
(1) Ag-20 vol.% Cr2AlC composites were prepared using SPS, resulting in a hardness of 60.9 HV and a densification of 93.3%. The Cr2AlC particles were uniformly distributed on the surface of the Ag matrix.
(2) The Ag-Cr2AlC composite material underwent both single and multiple arc erosions using a self-made arc erosion device. The eroded area was categorized into three distinct regions: the eroded center area, the eroded edge area, and the heat-affected area. Following single arc erosion, the surface of the material appeared relatively flat. In contrast, after 100 arc erosions, the surface exhibited numerous pores, scattered particles, and protrusions morphology. Additionally, Ag2O, Al2O3, and Cr2O3 were formed on the surface of the material after both a single and 100 arc erosion cycles.
(3) During 100 arc erosions, the breakdown current value remained relatively stable, ranging from 20 to 35 A. From the first to the seventieth discharge, the breakdown strength was consistently stable, fluctuating between 3 × 10⁶ V/m and 6 × 10⁶ V/m. However, after the 70th discharge, the breakdown strength increased and the phenomenon of ageing appeared. At the 90th arc erosion, the highest breakdown strength is 11.38 × 10⁶ V/m. As the number of discharges increases, the breakdown strength diminishes due to the formation of numerous protrusions features on eroded surface, which in turn amplify the local electric field.

Author Contributions

X.H.: methodology, formal analysis, writing-original draft preparation, writing-review and editing, and funding acquisition. J.G.: Conceptualization, resources, software, and validation. Z.Z.: methodology, investigation, formal analysis, validation, and funding acquisition. B.C.: investigation, software, formal analysis, and methodology. F.Z.: investigation, software, formal analysis, and methodology. H.Z.: investigation, software, formal analysis, and methodology. All authors have read and agreed to the published version of the manuscript.

Funding

This work was financially supported by the Nature Science Foundation of Anhui Province, China (Nos. 2208085ME104, 1908085QE218), the University Natural Science Research Project of Anhui Province (Nos. KJ2021ZD0141, 2022AH051589), the Cultivation Programme for the Outstanding Young Teachers of Anhui Province (No. YQYB2023054), the Application Project of Bengbu University (No. 2024YYX29QD), and the Guiding Science and Technology Plan Project in Huainan City (No. 2023017).

Data Availability Statement

The original contributions presented in this study are included in the article. Further inquiries can be directed to the corresponding authors.

Conflicts of Interest

The authors declare no conflict of interest.

References

  1. Nian, Y.H.; Zhang, Z.Y.; Liu, M.M.; Zhou, X.L. The electronic structure and stability of Ti2SnC/Ag interface studied by first-principles calculations. Adv. Theory Simul. 2023, 7, 2300649. [Google Scholar] [CrossRef]
  2. Ren, W.; Zheng, Z.; Zhang, C.; Liu, J.; Liu, X. Characterization method for electric arc erosion based on the in-situ measurement of electrode surface morphology. Measurement 2023, 221, 113501. [Google Scholar] [CrossRef]
  3. Sone, H.; Takagi, T. Role of the metallic phase arc discharge on arc erosion in Ag contacts. IEEE Trans. Compon. Hybrids. Manuf. Technol. 1990, 13, 13–19. [Google Scholar] [CrossRef]
  4. Pons, F.; Cherkaoui, M.; Ilali, I.; Dominiak, S. Evolution of the AgCdO contact material surface microstructure with the number of arcs. J. Electron. Mater. 2010, 39, 456–463. [Google Scholar] [CrossRef]
  5. Wang, H.; Cai, Q.; Wang, J.; Zhang, Y.; Hu, D.; Wang, Y. First-principles and experimental investigations on physical properties and arc erosion behavior of metal-doped AgSnO2 electrical contact materials. Ceram. Int. 2023, 49, 26033–26048. [Google Scholar] [CrossRef]
  6. Li, G.; Ma, Y.; Zhang, X.; Fang, X.; Feng, W. Interface strengthening and fracture characteristics of the Ag-based contact materials reinforced with nanoporous SnO2(Cu, CuO) phases. Appl. Surf. Sci. 2021, 543, 148812. [Google Scholar] [CrossRef]
  7. Feng, W.; Lu, H.; Li, G. Electrical contact performances of Ag-SnO2(CuO)/Cu-SnO2(CuO) heterogeneous materials prepared by hot-press sintering. Ceram. Int. 2025. [Google Scholar] [CrossRef]
  8. Yang, M.; Xie, M.; Ning, D.; Chen, S.; Yang, Y. Research progress of AgCu electrical contact materials. Precious Met. 2024, 45, 1–6. [Google Scholar]
  9. Li, H.; Cao, Q.; Zheng, J.; Sun, L.; Rong, W. Enhancing the electrical performance of AgNi contact material by doping Ag2WO4. Mater. Lett. 2024, 372, 137009. [Google Scholar] [CrossRef]
  10. Kesim, M.T.; Yu, H.; Sun, Y.; Aindow, M.; Alpay, S.P. Corrosion, oxidation, erosion and performance of Ag/W-based circuit breaker contacts: A review. Corros. Sci. 2018, 135, 12–34. [Google Scholar] [CrossRef]
  11. Wu, C.; Wu, X.; Ding, J.; Ding, K.; Zhang, P.; Ma, C.; Hu, D.; Liu, D.; Zhang, S.; Zheng, W.; et al. Achieving highly conductive Ag/Ti3AlC2 composite by inhibiting interdiffusion. Scripta. Mater. 2025, 255, 116343. [Google Scholar] [CrossRef]
  12. Radovic, M.; Barsoum, M.W. MAX phases: Bridging the gap between metals and ceramics. Am. Ceram. Soc. Bull. 2013, 92, 20–27. [Google Scholar]
  13. Barsoum, M.W. The MN+1AXN phases: A new class of solids: Thermodynamically stable nanolaminates. Prog. Solid. State. Chem. 2000, 28, 201–281. [Google Scholar] [CrossRef]
  14. Ding, J.; Tian, W.; Wang, D.; Zhang, P.; Chen, J.; Sun, Z. Arc erosion and degradation mechanism of Ag/Ti2AlC composite. Acta Metall. Sin. 2019, 55, 627–637. [Google Scholar]
  15. Wang, D.; Tian, W.; Ma, A.; Ding, J.; Wang, C.; You, Y.; Zhang, P.; Chen, J.; Zhang, Y.; Sun, Z. Anisotropic properties of Ag/Ti3AlC2 electrical contact materials prepared by equal channel angular pressing. J. Alloys Compd. 2019, 784, 431–438. [Google Scholar] [CrossRef]
  16. Wu, X.L.; Wu, C.Z.; Wei, X.P.; Sun, W.J.; Ma, C.J.; Zhang, Y.D.; Li, G.G.; Chen, L.M.; Wang, D.D.; Zhang, P.G.; et al. Influence of nano-mechanical evolution of Ti3AlC2 ceramic on the arc erosion resistance of Ag-based composite electrical contact material. J. Adv. Ceram. 2024, 13, 176–188. [Google Scholar] [CrossRef]
  17. Ding, K.; Ding, J.; Zhang, K.; Chen, L.; Ma, C.; Bai, Z.; Zhang, P.; Sun, Z. Micro/nano-mechanical properties evolution and degradation mechanism of Ti3AlC2 ceramic reinforced Ag-based composites under high-temperature arc corrosion. Ceram. Int. 2022, 48, 33670–33681. [Google Scholar] [CrossRef]
  18. Huang, X.C.; Feng, Y.; Qian, G.; Zhou, Z.J. Arc ablation properties of Ti3SiC2 material. Ceram. Int. 2019, 45, 20297–20306. [Google Scholar] [CrossRef]
  19. Zhou, Z.; Feng, Y.; Zhao, H.; Qian, G.; Zhang, J.; Zhang, X.; Huang, X. Arc erosion behavior and mechanism of Ag/Ti3SiC2 cathodes in different atmospheres. Ceram. Int. 2021, 47, 2319–2328. [Google Scholar] [CrossRef]
  20. Huang, X.; Li, L.; Ge, J.; Zhao, H.; Zhou, Z. Investigation on the arc erosion performance of Ag–Ta2AlC composite under air conditions. J. Adv. Ceram. 2024, 13, 1359–1368. [Google Scholar] [CrossRef]
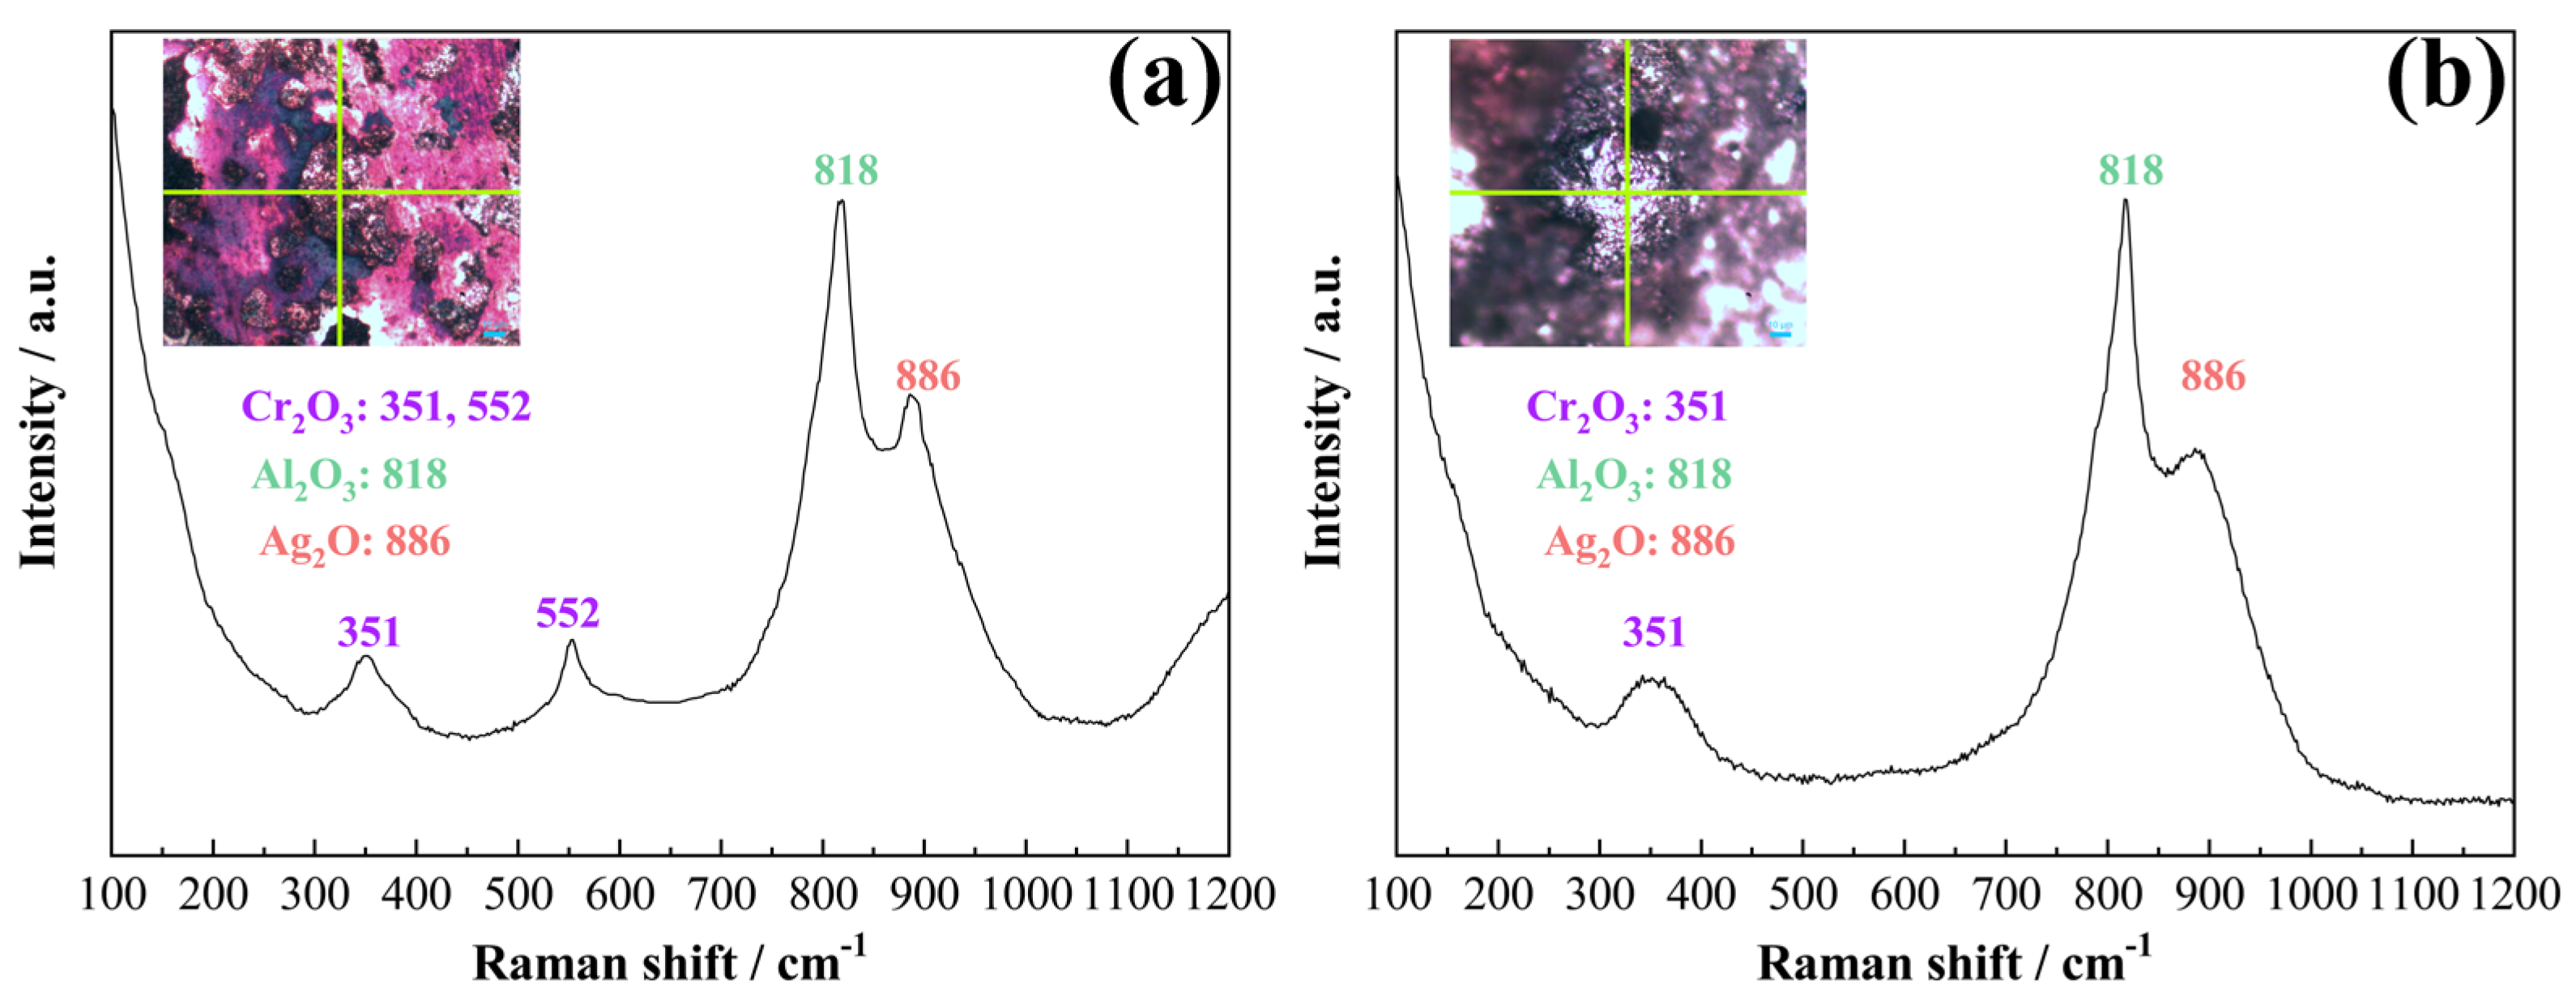
  21. Gomes, A.S.O.; Yaghini, N.; Martinelli, A.; Ahlberg, E. A micro-Raman spectroscopic study of Cr(OH)3 and Cr2O3 nanoparticles obtained by the hydrothermal method. J. Raman Spectrosc. 2017, 48, 1256–1263. [Google Scholar] [CrossRef]
  22. Larbi, T.; Ouni, B.; Gantassi, A.; Doll, K.; Amlouk, M.; Manoubi, T. Structural, optical andvibrational properties of Cr2O3 with ferromagnetic and antiferromagnetic order: A combined experimental and density functional theory study. J. Magn. Magn. Mater. 2017, 444, 16–22. [Google Scholar] [CrossRef]
  23. Anjum, M.; Kumar, R.; Barakat, M.A. Visible light driven photocatalytic degradation of organic pollutants in wastewater and real sludge using ZnO–ZnS/Ag2O–Ag2S nanocomposite. J. Taiwan Inst. Chem. Eng. 2017, 77, 227–235. [Google Scholar] [CrossRef]
  24. Meek, J.M.; Craggs, J.D. Electrical Breakdown of Gases; Oxford University Press: Oxford, UK, 1953. [Google Scholar]
  25. Miller, H.C.; Farrall, G.A. Polarity effect in vacuum breakdown electrode conditioning. J. Appl. Phys. 1965, 36, 1338–1344. [Google Scholar] [CrossRef]
  26. Wang, X.; Liang, S.; Yang, P.; Fan, Z. Effect of milling time on electrical breakdown behavior of Al2O3/Cu composite. J. Mater. Eng. Perform. 2010, 19, 906–911. [Google Scholar] [CrossRef]
  27. Bingjun, D.; Zhimao, Y.; Xiaotian, W. Influence of microstructure on dielectric strength of CuCr contact materials in a vacuum. IEEE Trans. Compon. Packag. Manuf. Technol. Part A 1996, 19, 76–81. [Google Scholar] [CrossRef]
  28. Dong, L.; Chen, W.; Deng, N.; Song, J.; Wang, J. Investigation on arc erosion behaviors and mechanism of W70Cu30 electrical contact materials adding graphene. J. Alloys Compd. 2017, 696, 923–930. [Google Scholar] [CrossRef]
  29. Jensen, K.L. Electron emission theory and its application: Fowler–Nordheim equation and beyond. J. Vac. Sci. Technol. B Microelectron. Nanometer Struct. Process. Meas. Phenom. 2003, 21, 1528–1544. [Google Scholar] [CrossRef]
  30. Koneru, A.; Karmarkar, N.; Wang, Y.; Mohanty, P.S.; Li, B.Q. Evaluation of cold-sprayed CuCr coatings as contact materials for vacuum interrupters. Vacuum 2023, 216, 112384. [Google Scholar] [CrossRef]
Figure 1. (a) X-ray diffraction (XRD), (b) scanning electron micrograph (SEM), (c) point-scanning results of Ag-Cr2AlC composite.
Metals 15 00293 g001
Figure 2. Micro-indentation (inside red boxes) images of Ag-Cr2AlC composites (a) test point a; (b) test point b; (c) test point c.
Metals 15 00293 g002
Figure 3. The surface of Ag-Cr2AlC composite eroded by (a) 1 time and (b) 100 times of arc erosion. (c,d) corresponding to the enlarged image inside circles 1 of (a,b), respectively.
Metals 15 00293 g003
Figure 4. SEM images of Ag-Cr2AlC composite surface after eroded for (a,b) 1 time; (c,d) 100 times.
Metals 15 00293 g004
Figure 5. (ad) corresponding to point-scanning results of rectangles 1–4 in Figure 4.
Metals 15 00293 g005
Figure 6. Three-dimensional morphology of Ag-Cr2AlC composite surface after eroded for (a) 1 time and (b) 100 times.
Metals 15 00293 g006
Figure 7. Raman spectrum of Ag-Cr2AlC eroded with (a) 1 and (b) 100 times of arc erosion.
Metals 15 00293 g007
Figure 8. Curve of current-time after one discharge.
Metals 15 00293 g008
Figure 9. Curves of (a) breakdown current and (b) breakdown strength with the number of arc erosion.
Metals 15 00293 g009
Table 1. Microhardness measurement values corresponding to Figure 2.
Test Pointd1 (μm)d2 (μm)d (μm)Hardness (HV)
(a)55.34655.99455.6759.8
(b)55.18855.40455.29660.6
(c)54.97254.10954.540562.3
Disclaimer/Publisher’s Note: The statements, opinions and data contained in all publications are solely those of the individual author(s) and contributor(s) and not of MDPI and/or the editor(s). MDPI and/or the editor(s) disclaim responsibility for any injury to people or property resulting from any ideas, methods, instructions or products referred to in the content.

