Article

In Situ Observation by X-Ray Radioscopy of Liquid Decomposition During Directional Solidification of Al-Cu-Sn Alloys

by
Sarah De Albuquerque
1,2,
Guillaume Reinhart
1,
Hadjer Soltani
3,
Danielle Cristina Camilo Magalhães
2,4,
José Eduardo Spinelli
2,4 and
Henri Nguyen-Thi
1,*
1
Aix-Marseille Univ, Université de Toulon, CNRS, IM2NP, 13013 Marseille, France
2
Graduate Program in Materials Science and Engineering, Federal University of São Carlos, São Carlos 13565-905, Brazil
3
Laboratory of Foundry, Badji Mokhtar University, BP 12, Annaba 23000, Algeria
4
Department of Materials Engineering, Federal University of São Carlos, São Carlos 13565-905, Brazil
*
Author to whom correspondence should be addressed.
Metals 2025, 15(3), 296; https://doi.org/10.3390/met15030296
Submission received: 31 January 2025 / Revised: 24 February 2025 / Accepted: 4 March 2025 / Published: 7 March 2025

Abstract

:
Immiscible Al–Sn–Cu alloys may offer attractive properties, attaining superior tribological and mechanical properties when Sn-rich soft particles are homogeneously distributed in the reinforced Al–Cu matrix. In this paper, the solidifications of both Al-10 wt.% Cu-10 wt.% Sn and Al-10 wt.% Cu-20 wt.% Sn alloys were investigated to analyze the successive stages that occur during the controlled cooling of these alloys, from the initial formation of the α-Al dendritic array to the final eutectic reaction. In particular, we focus on the liquid-phase demixing occurring during the solidification path, which leads to the formation of Sn droplets in the melt through a nucleation-growth process. Horizontal directional solidifications were performed on thin samples in a Bridgman-type furnace, with in situ and real-time observations using X-ray radioscopy. Two different behaviors have been found concerning liquid separation: for the low-Sn-content alloy, liquid demixing occurs in one single step, whereas for the high-Sn-content alloy, it is a two-step process, with first the nucleation of a few small Sn droplets followed by a sudden formation of a large amount of wide Sn droplets. The possible causes of these different behaviors are discussed in relation to the literature, namely, either a switch from immiscible to miscible liquids or a transition from the binodal region to the spinodal region.

1. Introduction

Immiscible alloys, which are characterized by the presence of a miscibility gap in the liquid state, are considered excellent candidates for advanced bearings in the aerospace or automotive industry. In general, for such types of alloys, soft metal elements (like Pb, Bi, or Sn) are formed as small solid particles regularly distributed in a hard metal matrix [1,2,3,4,5]. Currently, two main issues arise for the choice of a system with excellent mechanical and tribological properties. Firstly, because of environmental problems, it is mandatory to replace toxic lead with other soft and environmentally friendly elements. Secondly, the use of increasingly high temperatures and strains in engines calls for materials with even higher mechanical properties. Accordingly, ternary Al-Cu-Sn alloys are increasingly employed in the fabrication of bearing components due to their capacity to combine all the requested properties like high strength, large wear resistance, high machinability, as well as high corrosion resistance [6,7,8,9,10,11,12].
For optimum utilization of these alloys, it is crucial to take into account not only their chemical composition but also the dynamics of the solidification process that lead to the formation of various microstructures. Indeed, the formation of dendritic microstructures, the univariant reactions (monotectic and eutectic), as well as the liquid-phase separation in two immiscible liquids (or liquid demixing), strongly impact the final mechanical and tribological properties of the materials.
It is now well-established that the most efficient, and also simple, technique for analyzing the dynamics of the microstructure formation during the solidification of metal alloys is in situ and time-resolved X-ray radioscopy, either using synchrotron radiation [13,14,15,16] or with microfocus X-ray sources [17,18,19,20]. However, studies of liquid-phase separation using the X-ray radioscopy technique are few in number. A very nice example is the work of Schaffer et al. [21,22], who investigated the spinodal decomposition in Al-Bi and Al-Bi-Zn alloys and highlighted the complex interactions between droplets. Very recently and in a hyper-monotectic Al-Bi alloy, Zhang et al. [23] analyzed in detail—via synchrotron radiography—the motion of droplets at the solid–liquid interface under the effects of solutal Marangoni force and lift force. It is worth mentioning that those experiments were conducted during vertical solidification, when the effects of gravity of droplet motion are very strong. Still, for binary Al-Bi alloys using metallographic post-mortem analysis, the motion of droplets under the effects of Marangoni, centrifugal, and Stokes forces, their collision and coagulation, as well as the impact of droplet motion on the segregation were analyzed by Lu et al. [3].
In the case of ternary immiscible alloy, Al-Cu-Sn alloy is the most suitable system for studying the liquid-phase separation that occurs during the solidification process for a great number of reasons. The choice of this ternary alloy system for this study relies on the fact that it is already widely used in industry as a bearing material, owing to its low density, which is a great advantage for environmental concerns. The addition of copper enhances the mechanical properties of the alloy. It has a reasonable temperature interval between the liquidus and the monotectic temperatures, which allows for analyzing the succeeding events in a reasonable experiment duration. This alloy shows a very good contrast, from an X-ray radioscopy point of view, between the solid grains (α-Al) mainly consisting of aluminum and the inter-dendritic liquid, which is enriched in copper and tin during the solidification process. Finally, the Al-Cu-Sn alloy melting temperature, which is typically lower than 700 °C, is suitable in the SFINX (Solidification Furnace with IN situ X-ray radioscopy) furnace that will be used in this study.
The experimental findings presented in this paper are mainly based on the application of in situ X-ray radioscopy to reveal the dynamics of the solidification process during the directional solidification of both Al-10 wt.% Cu-10 wt.% Sn and Al-10 wt.% Cu-20 wt.% Sn alloys, with a special emphasis on the liquid demixing that is expected to occur during the solidification. To simplify the writing, the two alloys will be referred to hereafter in the text as Al-10Cu-10Sn and Al-10Cu-20Sn, respectively. Part of the Thermo-Calc calculations and DSC (Differential Scanning Calorimetry) measurements have been recently published in [24]. However, a recent more detailed examination of the in situ observations presented revealed two different behaviors for the two alloys, which are not predicted by the Thermo-Calc calculations nor by the thermal analysis by DSC. For the low-Sn-composition alloy (Al-10Cu-10Sn), the liquid-phase separation into two non-miscible liquids occurs progressively until the monotectic reaction occurs. In contrast, for the high-Sn-composition alloy (Al-10Cu-20Sn), the liquid-phase separation evolves in two steps. Indeed, in the first step, small, fine, and rare droplets formed while at a lower temperature; then, a large number of wide diffuse droplets suddenly emerged. Accordingly, while in the previous paper, the ultimate goal was to compare three different approaches (thermodynamic calculations, DSC, and X-ray radioscopy) that can be utilized to determine the solidification paths of the Al-Cu-Sn alloy system, in the present paper, the main goal is to describe in detail the X-ray radioscopy observations during the liquid-phase demixing and to suggest possible explanations for these observations.

2. Materials and Methods

2.1. Thermodynamic Calculations

Thermo-Calc software (Version 2021.1.79906-475) [25,26] is widely used by materials scientists and engineers to predict solidification paths of alloys and to provide key information about material properties. In a previous paper [24], the (Al-10Cu)-Sn pseudo-binary phase diagram was calculated through the CALPHAD method for a fixed amount of 10 wt.% Cu and for Sn content varying from 0 up to 25 wt.%. The pseudo-binary phase diagram is very convenient as it gives a general idea of what could occur during the solidification of a ternary alloy. However, the information derived from it is not complete and is sometimes misleading because it is only a cross-section of a three-dimensional phase diagram.
In the present paper, the solidification paths and some isothermal sections of the Al-Cu-Sn alloy system for a selection of key temperatures were calculated by Thermo-Calc software to ascertain the solidification paths of both alloy compositions that were under investigation. The thermodynamic calculations were conducted using the TCAL7: Al-Alloys v7.1 database and assuming equilibrium solidification like in [24].

2.2. Differential Scanning Calorimetry

For the sake of comparison with the Thermo-Calc calculations, the solidification paths of both alloys were also determined by DSC (Differential Scanning Calorimetry) with a NETZCH SAT 449 F3 Jupiter differential scanning calorimeter (Selb, Germany). The calorimeter was properly calibrated with high-purity elements In, Sn, Bi, Zn, Al, Ag, Au, and Ni metals in terms of the melting points and enthalpies of fusion. DSC measurements were carried out for both alloys under a protective nitrogen atmosphere and at a rate of −5 °C/min [24]. Before the DSC measurements, the accurate compositions of both alloys were checked by ICP-MS (Inductively Coupled Plasma–Mass Spectrometer) measurements carried out at Aix-Marseille University (AGILENT 7800, Santa Clara, US): it was estimated to be about ± 0.2 wt.% in Cu and Sn. The weight of the sample used in the DSC measurements is approximately 20 mg ± 3 mg.
The DSC curves obtained during the cooling (solidification) processes highlighted the succession of the exothermic transformations. The temperature values corresponding to each peak of the DSC curves are given in the figure captions.

2.3. In Situ X-Ray Radioscopy Applied to Solidification Experiments

In situ and real-time observation of the solidification process in non-transparent materials (metals and semiconductors) is a longstanding critical issue. Standard investigation techniques, such as quenching or decanting, do not provide the interface evolution over time in 3D but give only a frozen picture of the solid microstructure. Therefore, to study in detail the dynamics of the liquid-to-solid transformations of immiscible alloys, directional solidifications of the Al-10Cu-10Sn and Al-10Cu-20 Sn samples were performed using the SFINX (Solidification Furnace with in situ X-radioscopy) apparatus [24,27,28]. This device is dedicated to the solidification of aluminum-based alloys with in situ and real-time observation by X-ray radioscopy. It was developed within the framework of an ESA (European Space Agency) project named XRMON (in situ X-ray monitoring of advanced metallurgical processes under microgravity and terrestrial conditions). The SFINX apparatus was built by SSC (Swedish Space Corporation, Solna, Sweden), under contract with the ESA. With this laboratory device, the monitoring of the whole solidification process can be followed in situ and is time-resolved.

2.3.1. Experimental Procedure

For the sake of comparison, thick slices with an average thickness of 400 µm and a surface area of 5 mm × 50 mm were cut from the raw rectangular ingots of dimensions 50 mm × 20 mm × 5 mm—elaborated for the thermal analysis measurements by DSC, which enable a straightforward comparison between the two experimental determinations of the phase diagram. Then, the thick slices were ground and polished on silicon carbide abrasive paper and diamond paste to obtain samples 50 mm long, 5 mm wide, and 0.2–0.25 mm thick. The thickness range of 0.2–0.25 mm is of great significance for several reasons. Firstly, it allows for the formation of a single layer of the microstructure within the sample thickness, which is essential for the accurate interpretation of X-ray images that display a projected image of the microstructure. Furthermore, this small thickness assists in reducing convective flows within the liquid, thus, enabling the system to achieve the diffusive regime typically often employed in analytical models or numerical simulations. Additionally, it ensures sufficient transmission for high-quality X-ray radioscopy, thereby enhancing the overall effectiveness of the imaging process.
The sample was placed in the middle of stainless-steel spacers sandwiched between two flexible glassy carbon sheets sewn together with a silica thread. Then, the crucible-sample set was slid inside the Bridgman furnace, which was composed of two identical heaters whose temperatures were independently controlled (Figure 1a). This way, it is possible to impose a temperature gradient Gapp of 5.55 °C/mm in the region of the sample that is in the field of view of the X-ray radioscopy. The sample solidification was then accurately controlled by decreasing both heater temperatures at the same cooling rate R of −0.15 °C/s. This power-down method has the great advantage of keeping Gapp nearly constant during the whole solidification experiment. To dampen the disturbing effects of gravity on the solidification process—such as natural convection that can provoke undesirable Cu/Sn solute segregation or buoyancy that can lead to Sn-droplet sedimentation—the furnace and thus the sample was placed in a horizontal position [28].
With the improvement in the quality of X-ray sources (spot size, intensity, and divergence) and detectors (sensibility, signal/noise ratio, size of the field of view), new laboratory devices were developed [17,18,19,20]. These devices are now widely used both in laboratory and on-board microgravity platforms dedicated to research in materials science. For the study of the aluminum-based alloy solidification, molybdenum is chosen, with two intensity peaks at 17.4 keV and 19.6 keV that correspond to the optimal energy to obtain an excellent contrast and a good radiograph quality with Al-Cu alloys [17,18,19,20]. The X-ray radioscopy system comprises a micro-focus X-ray source with a molybdenum target which provides a 3 μm focal spot and, thus, a typical spatial resolution of about 4–5 µm. The detector system incorporates a digital camera (Vosskuhler11000, Osnabrück, Germany) that is adapted for X-ray usage by the integration of a thick optical fiber plate that protects the sensor from radiation. A scintillator plate placed in front of the optical fiber converts X-ray radiation to visible-spectrum light. Due to the X-ray beam divergence, a geometric magnification of the object was observed at the detector position, which is the ratio of the source-detector by source-sample distances (Figure 1b). By adjusting the relative positions of the sample and the detector, a geometric magnification of five was obtained and a square field of view (FoV) of about 5 mm × 5 mm was achieved, with an effective pixel size of approximately 4 μm × 4 μm. In the presented experiments (see the two videos provided in the Supplementary Materials), the acquisition rate was 0.5 Hz, which is enough to follow the details of the solidification process. For Al-Cu-Sn alloys, the densities of the three elements (Al, Cu, and Sn) are very different, resulting in significant differences in absorption contrast between the liquid and solid phases that are expected to form during the solidification sequence.

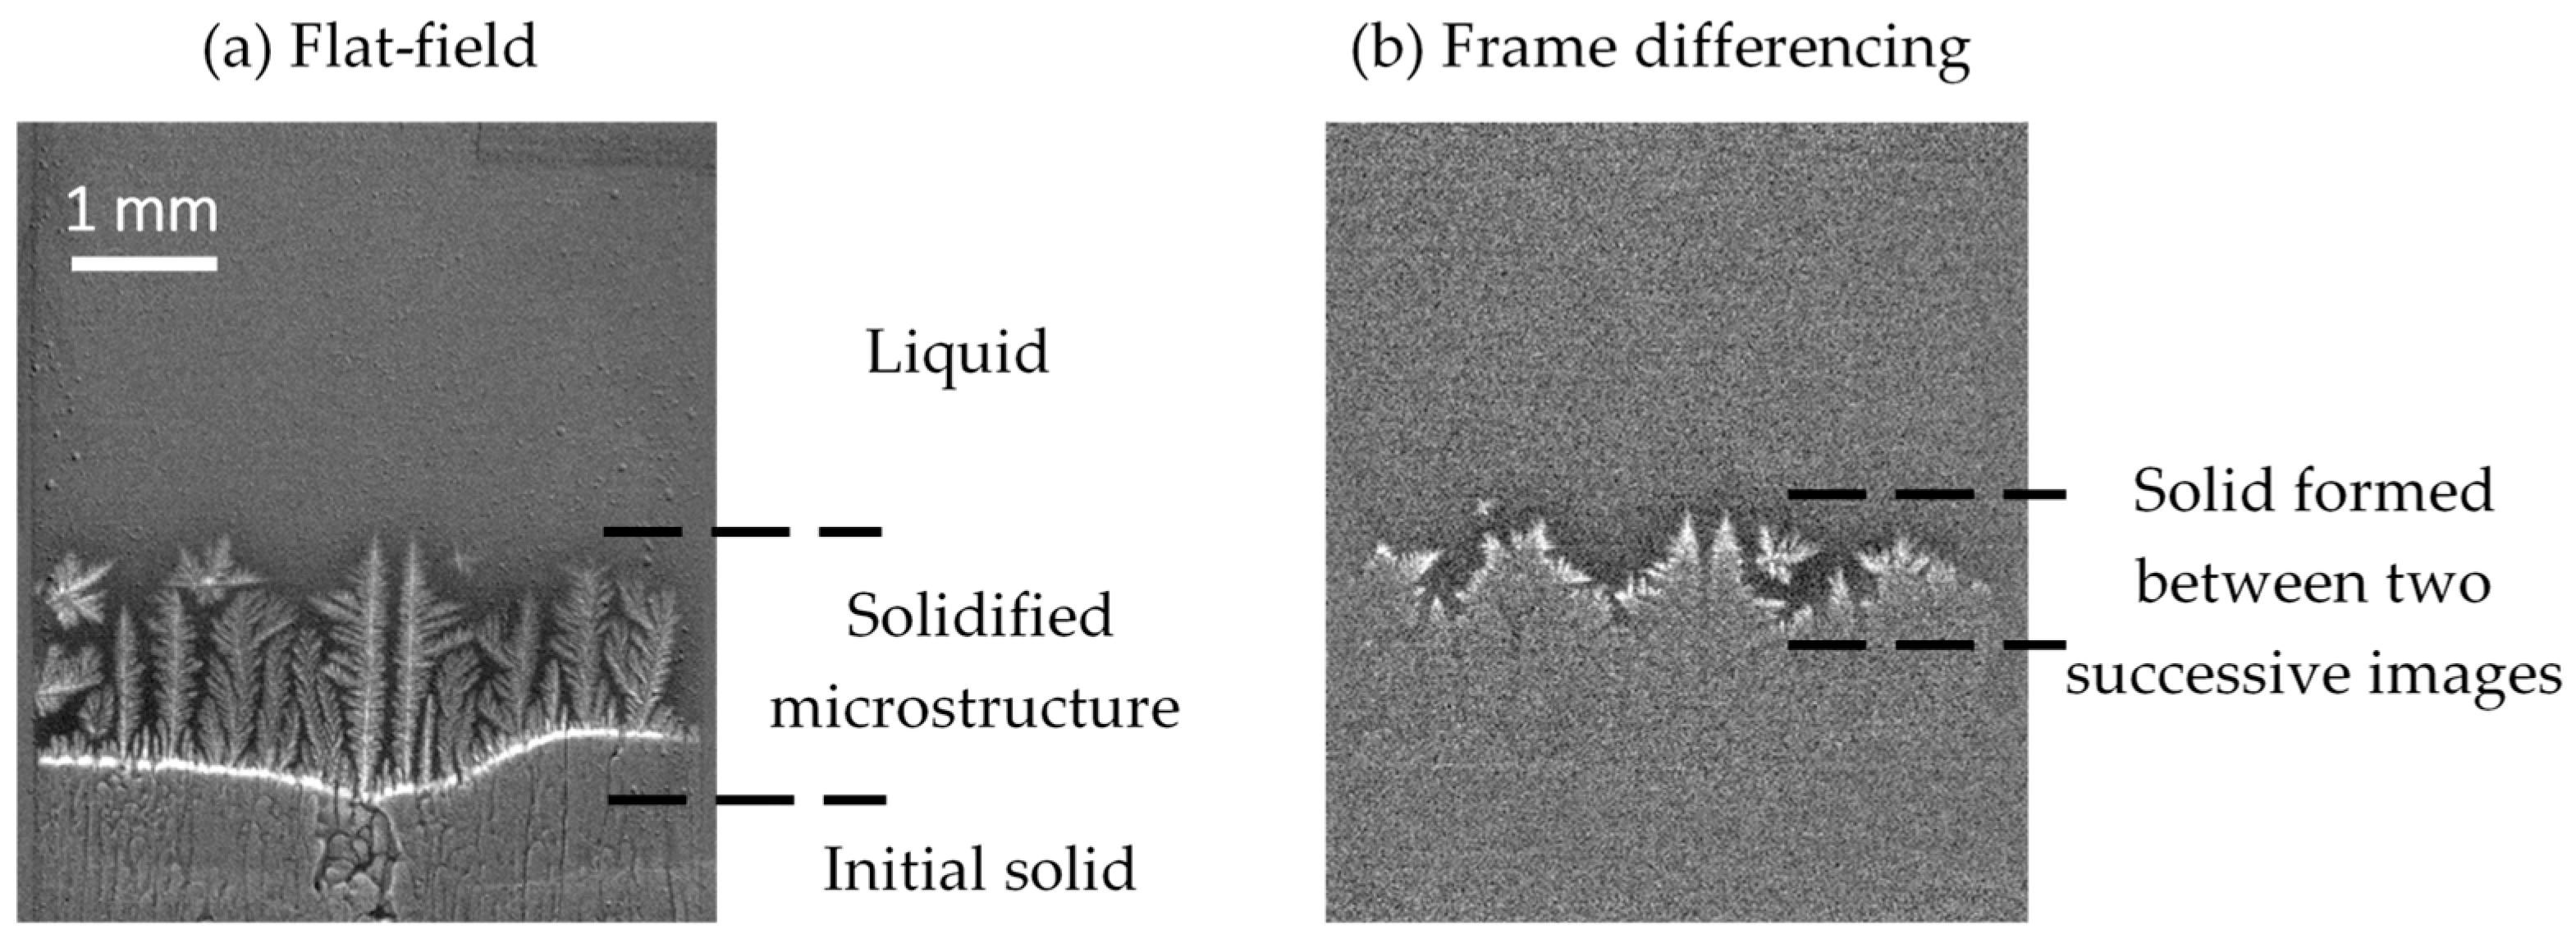
2.3.2. Image Processing

The contrasts in the raw recorded images arise from differences in X-ray absorption between the different parts of the sample. To improve the legibility of the images, it is mandatory to enhance these contrasts and also to remove some defects related to the X-ray system. Therefore, two different image processing techniques were required, which provided complementary information on the solidification dynamics. These image treatments were applied to raw recorded radiographs with the most-used software ImageJ (version 1.52p) [29].
The first image processing technique is the flat-field correction, which involves dividing (or subtracting) “pixel by pixel” the gray-level value of the raw radiograph at a given time of solidification by the gray-level value of a reference radiograph [24]. For the solidification experiment, the reference radiograph is usually recorded just before the beginning of the solidification, when the part of the sample in the FoV is partially or almost entirely liquid. The final image of this flat-field correction shows a significant improvement in terms of readability and a sharper contrast is visible between the solid aluminum (light gray) and the Cu/Sn-rich liquid (dark gray), as visible in Figure 2a.
A second and less common image processing technique that is called frame differencing was also applied for analyzing our solidification experiments [24]. This image processing is widely used to detect the motion of objects. The approach consists in dividing (or subtracting) the raw radiograph of interest by a previous raw radiograph recorded a few seconds prior. By using this image processing, it is possible to detect the weak difference between two frames. For instance, in Figure 2b, the brightest pixels display the solid formed at the dendrite tips between the two successive images. The time interval between the two images was selected to ensure distinct gray-level contrast in the resulting images and depends on the time evolution of the solidification microstructure. In fact, too short an interval does not show any or enough change in the microstructure, while too long an interval may lead to a loss of information about microstructure evolution. The higher the cooling rate, the shorter the time interval between the two images. In the presented experiments, values of 5 to 7 s were chosen depending on the cooling rate.

3. Results

3.1. Solidification Path Calculations

The Thermo-Calc software provides the solidification paths of both alloy compositions, with the chemical composition of each phase depending on the temperature variation, which provides key information on the successive reactions.
Figure 3 depicts the solidification paths for the two investigated alloy compositions, with the successive steps during cooling (from the right side to the left side) in the form of the calculated phase fraction as a function of temperature.
The accurate values of the predicted temperatures for each reaction or transformation are given in Table 1.
Figure 4 displays six isothermal sections of the Al-Cu-Sn alloy system that were calculated by Thermo-Calc software for a selection of key temperatures. Figure 4a is the isothermal section calculated at T = 625 °C, which is an arbitrary temperature higher than the liquidus temperatures of both alloys (615 °C for Al-10Cu-10Sn and 597.5 °C for Al-10Cu-20Sn). For this temperature, it can be seen that both alloy compositions (red and blue dots) are in the region corresponding to the fully liquid state.
The first solidification step during the melt cooling involves the formation of solid α-Al, as seen in Figure 4b, which is expected to start at a temperature slightly lower than the respective liquidus temperature of each alloy. Because of the solute rejection during the liquid-to-solid transformation, the copper and tin inter-dendritic liquid compositions progressively rise as solidification proceeds.
The second step takes place when the enriched liquid L′ meets the liquid miscibility gap. This occurs at a temperature of 537.5 °C for Al-10Cu-10Sn and 550.6 °C for Al-10Cu-20Sn (see Table 1). Figure 4c is the isothermal section at T = 540 °C, when the high-Sn-content alloy (blue dot) is inside the region of liquid decomposition, whereas the low-Sn-content alloy (red dot) is still in the L′ + α-Al region. In Figure 4d, both alloys are inside the region of liquid decomposition for a temperature just higher than the monotectic temperature of 529.4 °C. Inside the miscibility gap, concomitantly with the α-Al growth, the inter-dendritic liquid phase is expected to undergo a separation into two immiscible liquids. In this step, there is a formation of dense Sn-rich liquid L″ droplets, which separate from light Al-rich L′. The proportion of droplets in number and size directly depends on the nominal liquid composition [30].
According to Thermo-Calc calculations, the liquid-phase demixing ends at the invariant ternary monotectic reaction, which takes place at the temperature of 529.4 °C with the simultaneous formation of two Al-rich solid phases (α-Al and θ-Al2Cu), concomitantly with the Cu/Sn-enrichment of the residual liquid phase L′ due to Cu/Sn rejection during the liquid-to-solid phase transformation.
At temperatures below the monotectic plateau, like in Figure 4e, the liquid weakly interacts with the solid α-Al to form solid θ-Al2Cu. The little remaining liquid finally transforms at the eutectic temperature (T = 229.4 °C) into the ternary eutectic phase consisting of β-Sn, α-Al, and θ-Al2Cu, as shown in Figure 4f.

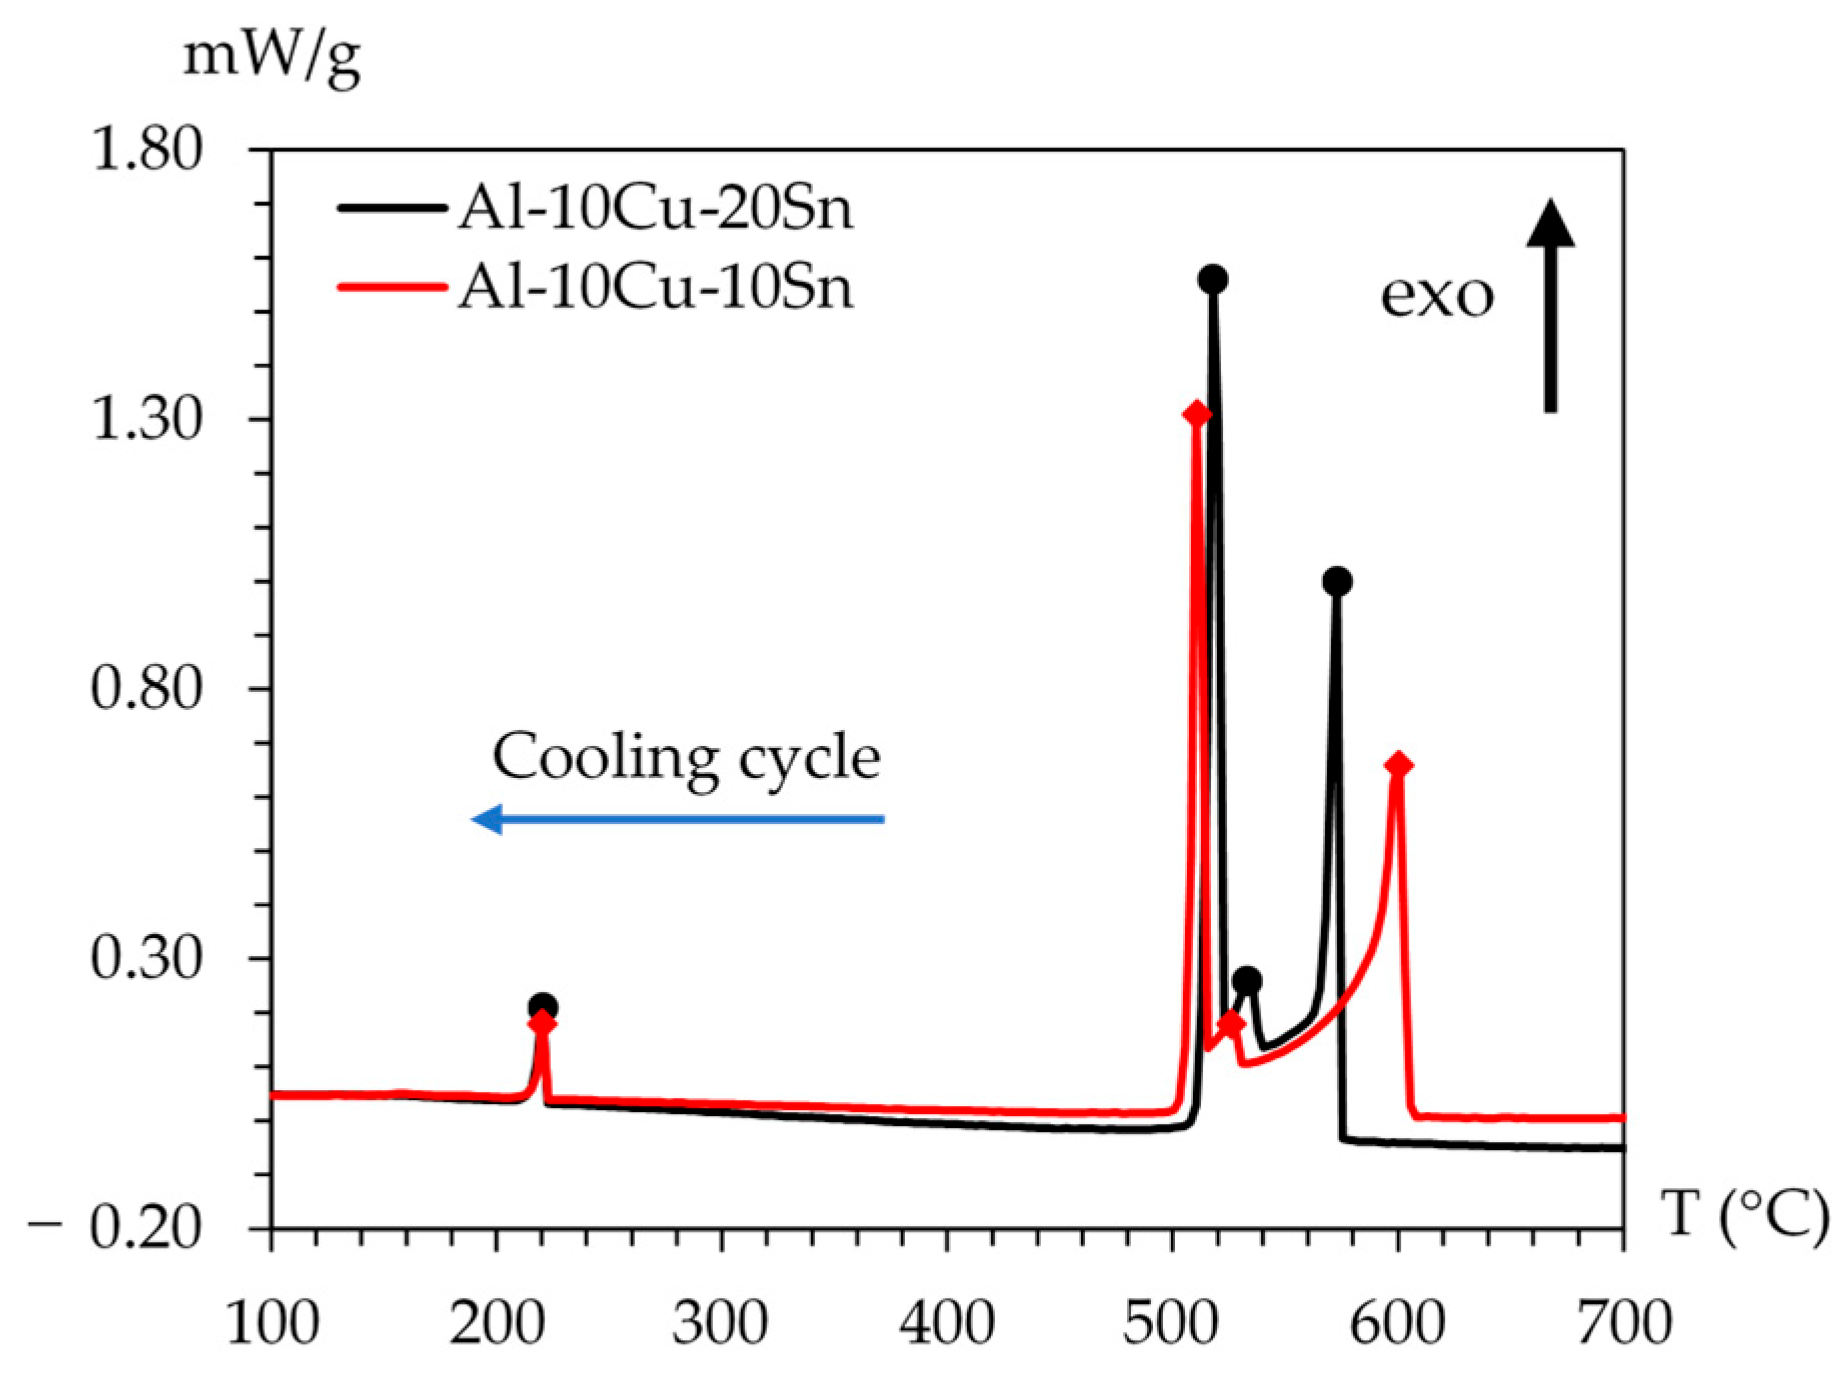
3.2. Solidification Sequence Determined by Differential Scanning Calorimetry

The DSC curves obtained during the cooling (solidification) processes are presented in Figure 5, highlighting the succession of the exothermic transformations. The temperature values corresponding to each peak of DSC curves are given in the figure caption.
For both alloys, and for the decreasing temperature (from the right side to the left side of the DSC curves), a first peak is conspicuous, which is the visible signature of the growth of primary α-Al dendrites. The peak values are 600.5 °C for Al-10Cu-10Sn and 572.8 °C for Al-10Cu-20Sn, which correspond to the expected trend (the higher the solute composition, the lower the liquidus temperature) but with values much lower than the predicted value from Thermo-Calc. Then, a very small peak is visible at 525.5 °C for the Al-10Cu-10Sn alloy and at 530.3 °C for the Al-10Cu-20Sn alloy, indicating the occurrence of liquid-phase separation when the homogeneous inter-dendritic liquid separates into two immiscible liquids. The narrow and intense peaks at 510.5 °C and 517.8 °C for Al-10Cu-10Sn and Al-10Cu-20Sn, respectively, are the signatures of the monotectic reaction, with the formation of both θ-Al2Cu and α-Al phases. The final transformation is the formation of the ternary eutectic phase, which is composed of three solids: β-Sn + θ-Al2Cu + α-Al.
By comparing the DSC curves with Thermo-Calc calculations, a good qualitative agreement is obtained in terms of predicted transformations during the cooling process. However, large discrepancies are found for the values of the reaction temperatures. As explained in reference [24], each method is subject to experimental uncertainty or bias. Actually, Thermo-Calc values are calculated at equilibrium based on the phase diagram, whereas thermal analysis measurements are performed likely out of equilibrium. For thermal analysis measurements, uncertainty can have many causes, including the following: (i) the accurate alloy composition [31], which is estimated to be about ± 0.2 wt.% in Cu and Sn according to ICP ICP-MS (Inductively Coupled Plasma–Mass Spectrometer) measurements carried out at Aix-Marseille University (AGILENT 7800, Santa Clara, US); (ii) the weight of the sample used in the DSC measurements [32], which is approximately 20 mg ± 3 mg in our measurements; and (iii) the value of the cooling rate [33,34]. For the DSC curves displayed in Figure 5, a common cooling rate of 5 °C/min was applied—which is most probably too high to obtain equilibrium conditions—therefore, nucleation undercooling has to be considered. Extrapolation of the DSC results to a cooling rate of 0 °C/min could be performed but this is outside of the scope of this paper.

3.3. Dynamics of Al-Cu-Sn Solidification Processes

All images presented in Figure 6, Figure 7 and Figure 8 illustrate the time evolution of the microstructure either in the whole FoV (Figure 6) or in a selected region located in the middle of the sample (Figure 7 and Figure 8) following the gradual decrease in the heater temperatures (the power-down method). In these figures, the temperature Tavg corresponds to the average value of the thermocouple temperatures that were used to control the heater elements and, therefore, roughly indicates the temperature at the center of the field of view. The two videos of the experiments, after both image processing procedures (flat-field correction and the frame-differencing procedure) are provided in the Supplementary Materials.

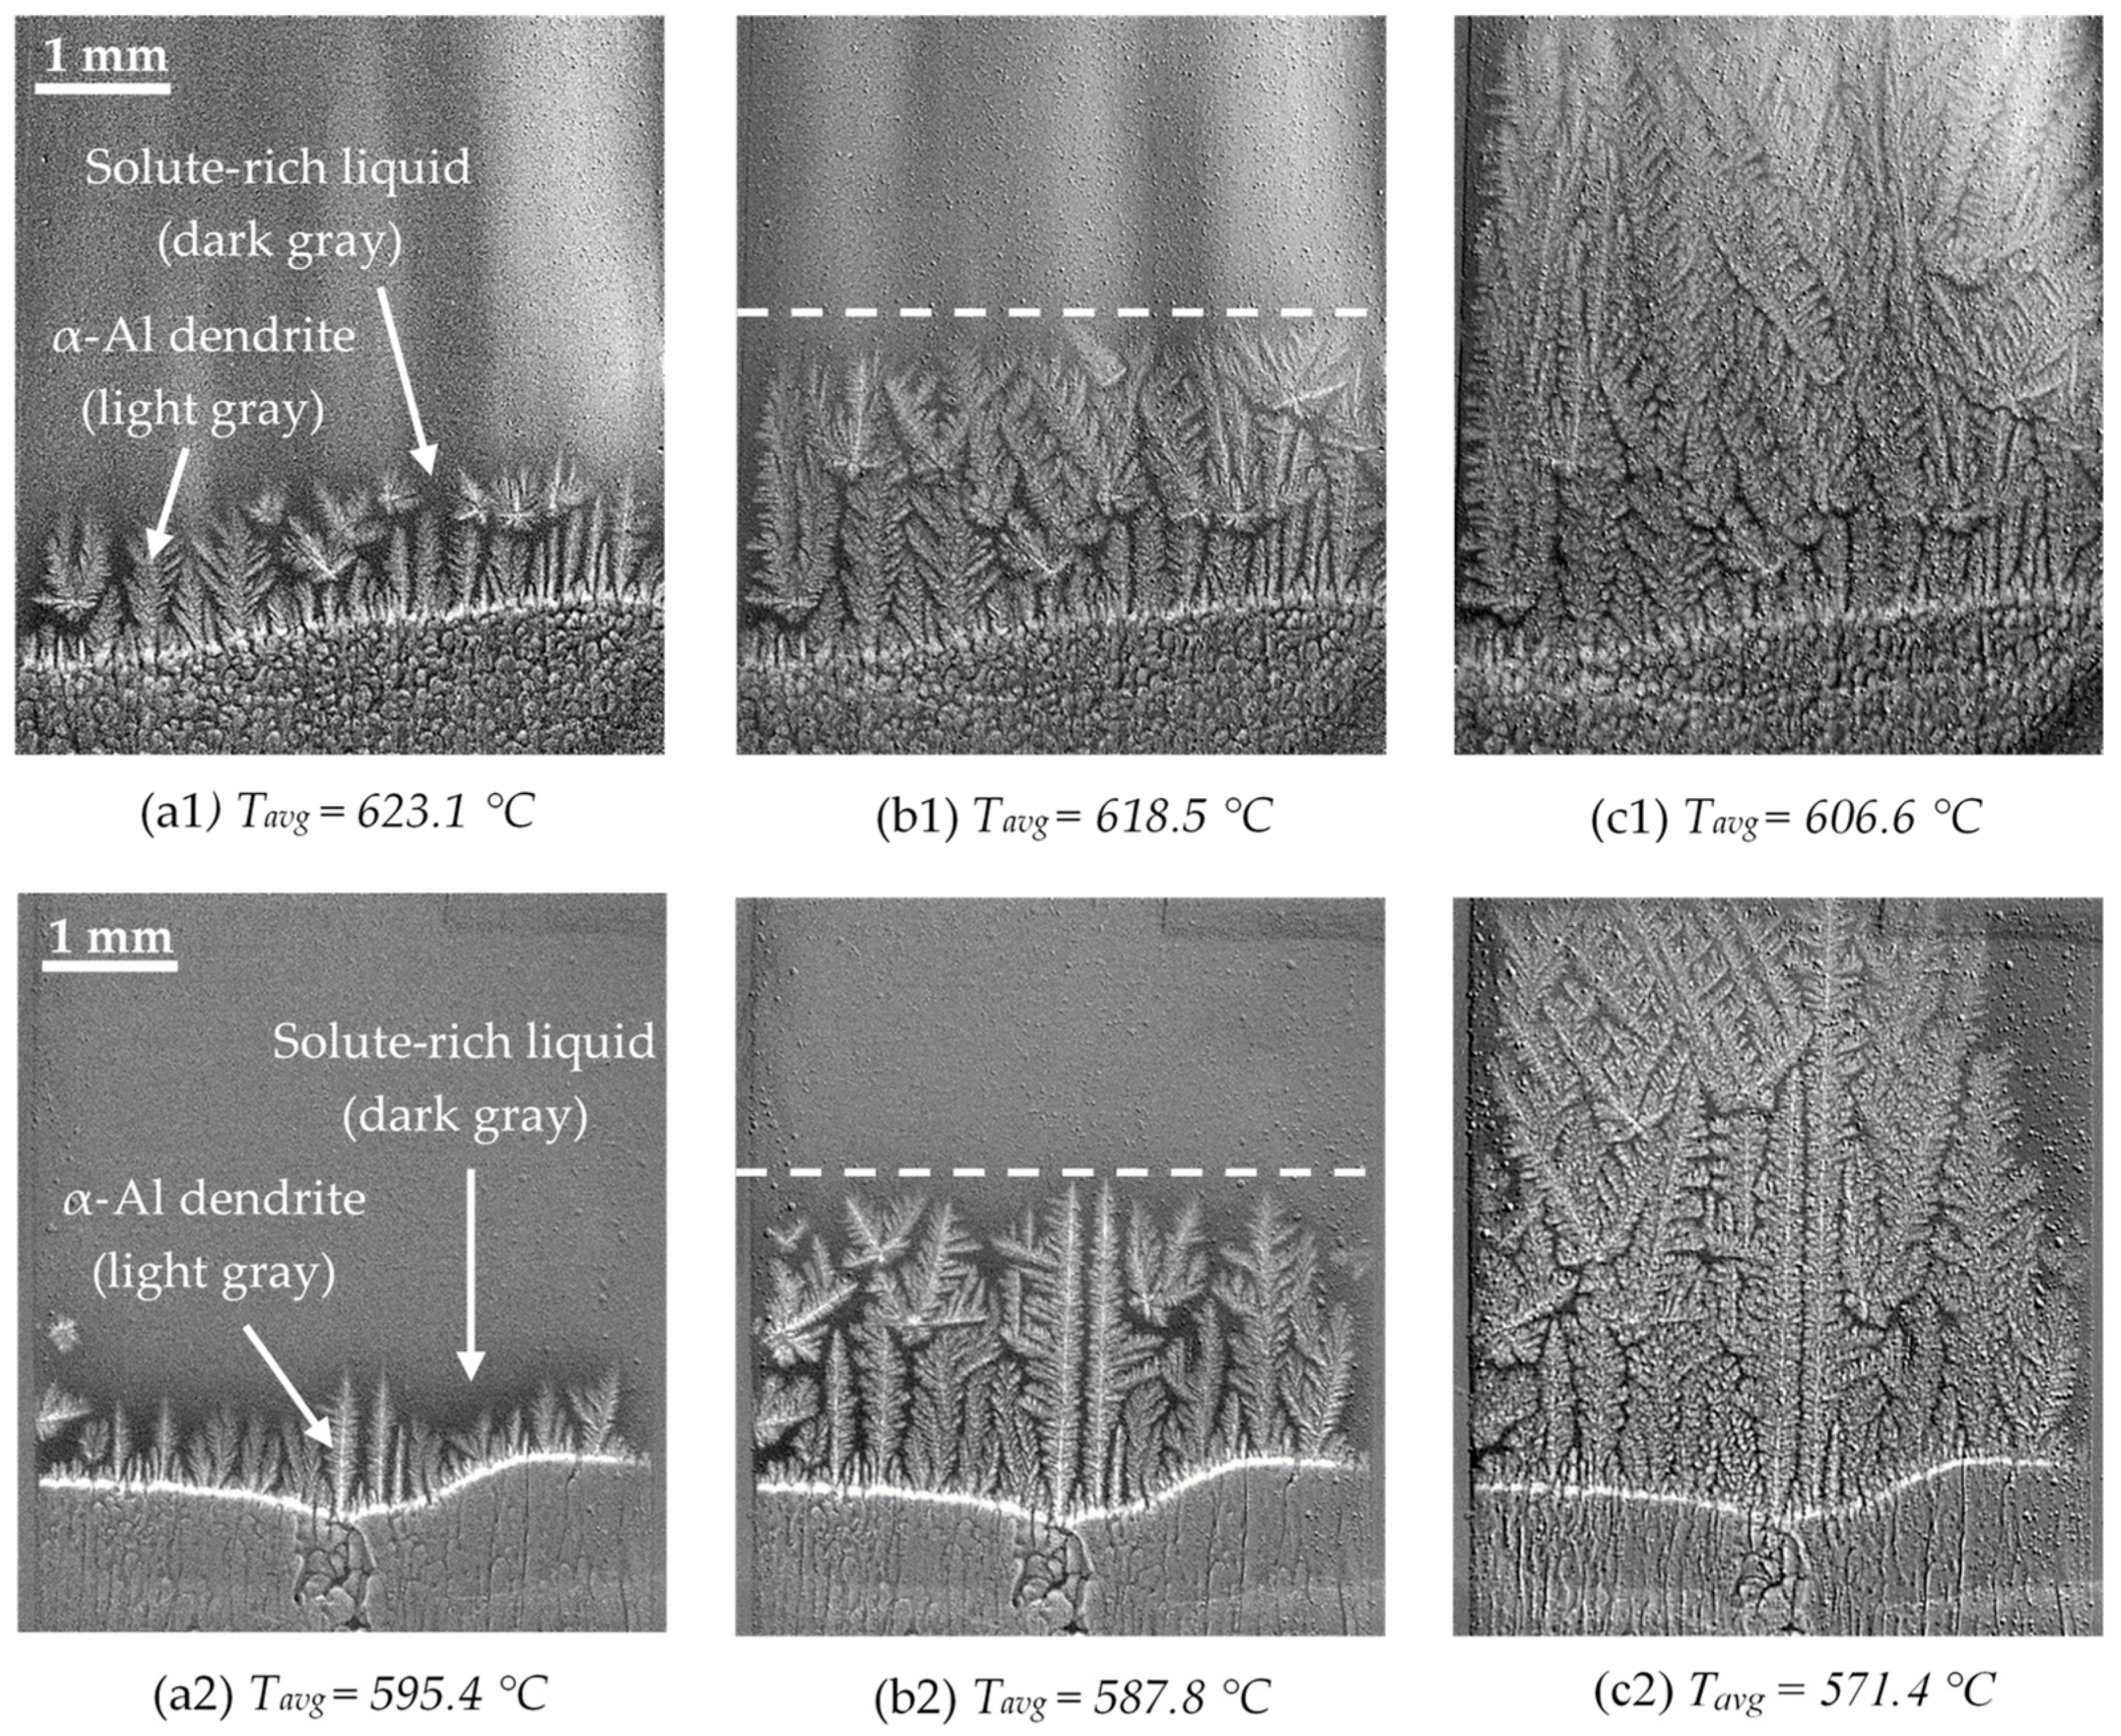
3.3.1. First Step: Columnar Growth of α-Al Dendrites

For both alloys, the first stage of the solidification process is the growth of elongated α-Al grains initiated a few minutes after the beginning of the cooling, as depicted in Figure 6 in the first row (a1), (b1), and (c1) for Al-10Cu-10Sn and the second row (a2), (b2), and (c2) for Al-10Cu-20Sn. The radiographs clearly show dendrites in light gray, surrounded by a darker liquid because of the Cu/Sn rejections during the liquid-to-solid transformation.
Because of the absence of seed in our experiments, α-Al grains have random orientations but they all grow preferentially parallel to the direction of the temperature gradient as expected [27]. For both compositions, nucleation of the new grains regularly occurred ahead of the advancing columnar front, which resulted in the creation of a new layer of columnar grains. In Figure 6b1,b2, the white dashed lines indicate the mean position of the dendrite tips. It appears that the solidification fronts are rather flat, which shows that the transverse temperature gradients in the samples are weak in our experiments.
As solidification proceeds, the dendritic patterns fill the whole FoV, as can be seen in Figure 6c1,c2. Then, coarsening phenomena began to blur the dendrites, as visible in both flat-field videos provided in the Supplementary Materials. It is worth noticing that coarsening phenomena are not detectable in the frame-differencing images because of the very weak modifications induced by coarsening during the five-second time interval between the two raw images.

3.3.2. Second and Third Steps: Liquid-Phase Demixing and Monotectic Reaction

According to the thermodynamic calculations, both alloys (Al-10Cu-10Sn and Al-10Cu-20Sn) should exhibit similar behavior. After the initial stage of the α-Al dendrite growth, liquid demixing is expected, followed by a monotectic reaction. The unique difference between the two alloys is the temperature interval between the liquid-phase separation and the monotectic reaction, which is smaller for the low-Sn-content alloy compared to the high-Sn-content alloy (Table 1). Unexpectedly, two different time evolutions for those reactions were observed in our experiments depending on the alloy composition, which will be described in the following section.
To reveal the dynamics of the second and third steps, the time evolution of a longitudinal cut of the central region of the FoV is analyzed in detail (Figure 7 and Figure 8). The two videos of the experiments, with both image-processing procedures (flat-field correction and frame-differencing procedure) are given in the Supplementary Materials. By applying the frame-differencing processing to the radiographs, the solid dendritic network (that does not evolve during the sample cooling) is completely erased and replaced by a uniform gray background above the white dashed lines in Figure 7a and Figure 8a, indicating that nothing has changed for these regions between the two images separated by five seconds. Consequently, the liquid-phase demixing, as well as the monotectic reaction, are dramatically highlighted, which helps us to understand these phenomena more effectively.
  • Al-10Cu-10Sn alloy
(For a better understanding of the dynamics of the phenomena, the reader is strongly advised to watch Video S1 provided in the Supplementary Materials.)
Figure 7 shows three images illustrating the liquid-phase separation during the cooling of the Al-10Cu-10Sn alloy. The times have been marked arbitrary in reference to the first image of the sequence (t0). At the bottom of Figure 7a, the inception of the liquid-phase separation in between the dendrites is visible; the white dashed line indicates the altitude where the first droplets are detected, measuring a few tens of microns in diameter. The black areas correspond to the Sn-rich liquid L″ zones that have nucleated in the L′ liquid during the liquid demixing. These Sn-rich liquid zones, which appear in black because of their higher X-ray absorption than the remaining liquid L′, are shaped either in the form of round droplets or as large zones of liquid that could be the result of droplet coalescence. The few white dots are artifacts due to the frame-differencing image processing. According to Figure 7a, the liquid demixing roughly begins at a value of 540 °C, while it is predicted to start at 537.5 °C for the Al-10-Cu-10Sn alloy by Thermo-Calc software. Those values are in good agreement, considering the uncertainties or errors of both methods. For directional solidification experiments, the uncertainty is mainly attributed to the temperature distribution in the FoV, the resolved pixel size (of about 4 µm), and possibly the presence of natural convection—which is not fully eliminated—or buoyancy forces acting on Sn droplets. All these effects prevent obtaining an accurate value for the inception of the liquid separation.
As cooling proceeds, it is then possible to see in Figure 7b both the liquid-phase demixing and the subsequent monotectic reaction. The latter creates a very white layer due to the formation of a large amount of α-Al and θ-Al2Cu. The impact of the dark and white layers on the vertical average gray-level profile along the field of view is visible in Figure 7d. The extent of the liquid-phase separation appears as a bump toward the left side of the average gray value, while the monotectic reaction appears as a narrower peak toward the right-hand side. The temperature gap between the liquid-phase separation and the monotectic reaction can be estimated from the distance between the inception of the phase separation and the monotectic front and knowing the applied temperature gradient. A temperature difference of about 5 °C is obtained for the Al-10Cu-10Sn alloy, which is nearly twice as small as the value predicted by Thermo-Calc calculations which is about 8 °C.
  • Al-10Cu-20Sn alloy
(For a better understanding of the dynamics of the phenomena, the reader is strongly advised to watch Video S2 provided in the Supplementary Materials.)
For the Al-10Cu-20Sn alloy, the in situ X-ray radioscopy observation revealed a different behavior for the liquid-phase separation. On the contrary to the first alloy, the liquid demixing did not occur with a gradual increase in the proportion of L″ as predicted by Thermo-Calc calculations but in two consecutive steps. Figure 8 displays three images illustrating the liquid-phase separation during the solidification experiment of the Al-10Cu-20Sn alloy, as well as the vertical average gray-level profile along the field of view. It is worth reminding that the three radiographs are processed by using frame differencing to highlight the liquid-phase decomposition. The times have been marked arbitrary in reference to the first image of the sequence (t0).
In the lower-third of Figure 8a, the early stages of the liquid-phase separation in between the dendrites are visible; the white dashed line indicates the first droplets that are detected, measuring a few tens of microns in diameter. Below the dashed line, the first step of the liquid demixing is clearly visible, with the nucleation of small spherical black Sn droplets (L″) in a light gray layer (L′). The light gray layer that is visible in Figure 8a and then visible on the top of the yellow rectangle in Figure 8b,c can be ascribed to the Sn depletion of the remaining liquid L′. In Figure 8d, the light gray layer causes a small bump toward the right-hand side to appear on the top of the vertical average gray-level profile.
As cooling proceeds, it is then possible to see in Figure 8b the second step of the liquid-phase demixing and the subsequent monotectic reaction. The second step of liquid-phase demixing starts with a sudden increase in the amount of L″, which leads to the formation of a blurred dark region with the presence of a few droplets, roughly one millimeter below the beginning of the first step of liquid-phase demixing. This darkening causes the bump toward the left side seen in the vertical average gray level in Figure 8d. At a lower temperature, the monotectic reaction creates a very white layer due to the formation of a large amount of α-Al and θ-Al2Cu.
The impact of the two-step liquid decomposition and the monotectic reaction on the vertical average gray-level profile along the field of view is visible in Figure 8d. The temperature difference between the liquid-phase separation and the monotectic reaction can be estimated in the same way as for the low-Sn-content alloy. A temperature gap of about 11 °C is measured for the Al-10Cu-20Sn alloy, which is nearly half the value predicted by Thermo-Calc calculations which is about 21 °C.

3.3.3. Third Step: Final Eutectic Reaction

The solidification process for both alloys ends with the eutectic transformation, which gives the formation of β-Sn, α-Al, and θ-Al2Cu. This transformation is predicted at about 230 °C by Thermo-Calc calculations and is determined at 223 °C from both thermal analysis by DSC and solidification experiments, showing good agreement. It is worth noticing that the crossing of the eutectic front from the bottom to the top of the FoV is detectable in frame-differencing images as it induces a weak variation in gray level in the radiographs due to the large temperature difference between the monotectic and the eutectic reactions, the passages of the eutectic fronts were cut from the videos to shorten them.

4. Discussion

On the basis of these experimental observations, the following question arises: why is this two-step liquid-phase separation happening for the Al-10Cu-20Sn alloy?
A first explanation may be a transition of the liquid from the immiscible domain to a miscible domain as suggested by Schaffer et al. [21] for Al-6 wt.% Bi-8 wt.% Zn. Like for Al-10Cu-20Sn, the liquid-phase demixing in their ternary alloy is followed very closely by the monotectic reaction. With synchrotron in situ X-ray radioscopy, Schaffer et al. [21] found that as the monotectic front approaches the Bi droplets, they dissolve and form diffuse clouds, as can be seen in Figure 9—reproduced from reference [21].
In our experiments, a very similar behavior may occur due to the changes in melt composition induced by the monotectic reaction that occurs at a lower temperature (Figure 7 and Figure 8). Indeed, during the latter, the excess of Sn is rejected in the melt ahead of the monotectic front, which creates the formation of a Sn-rich boundary layer by diffusion. Consequently, a critical Sn concentration may exist for which droplet surface tension may decrease dramatically, leading to a transition from the immiscible domain to a miscible domain, which causes the droplets to break up into clouds. This change in droplet behavior may likely explain the ”fuzzy” black color in larger quantities in Figure 8b,c.
A second plausible explanation for this two-step liquid demixing observed for the high-Sn-content alloy is a transition from the binodal region to the spinodal region, which occurs as a result of changes in composition and temperature as described by Ratke et al. [35]. Indeed, in certain cases, the miscibility gap may comprise two regions (Figure 10):
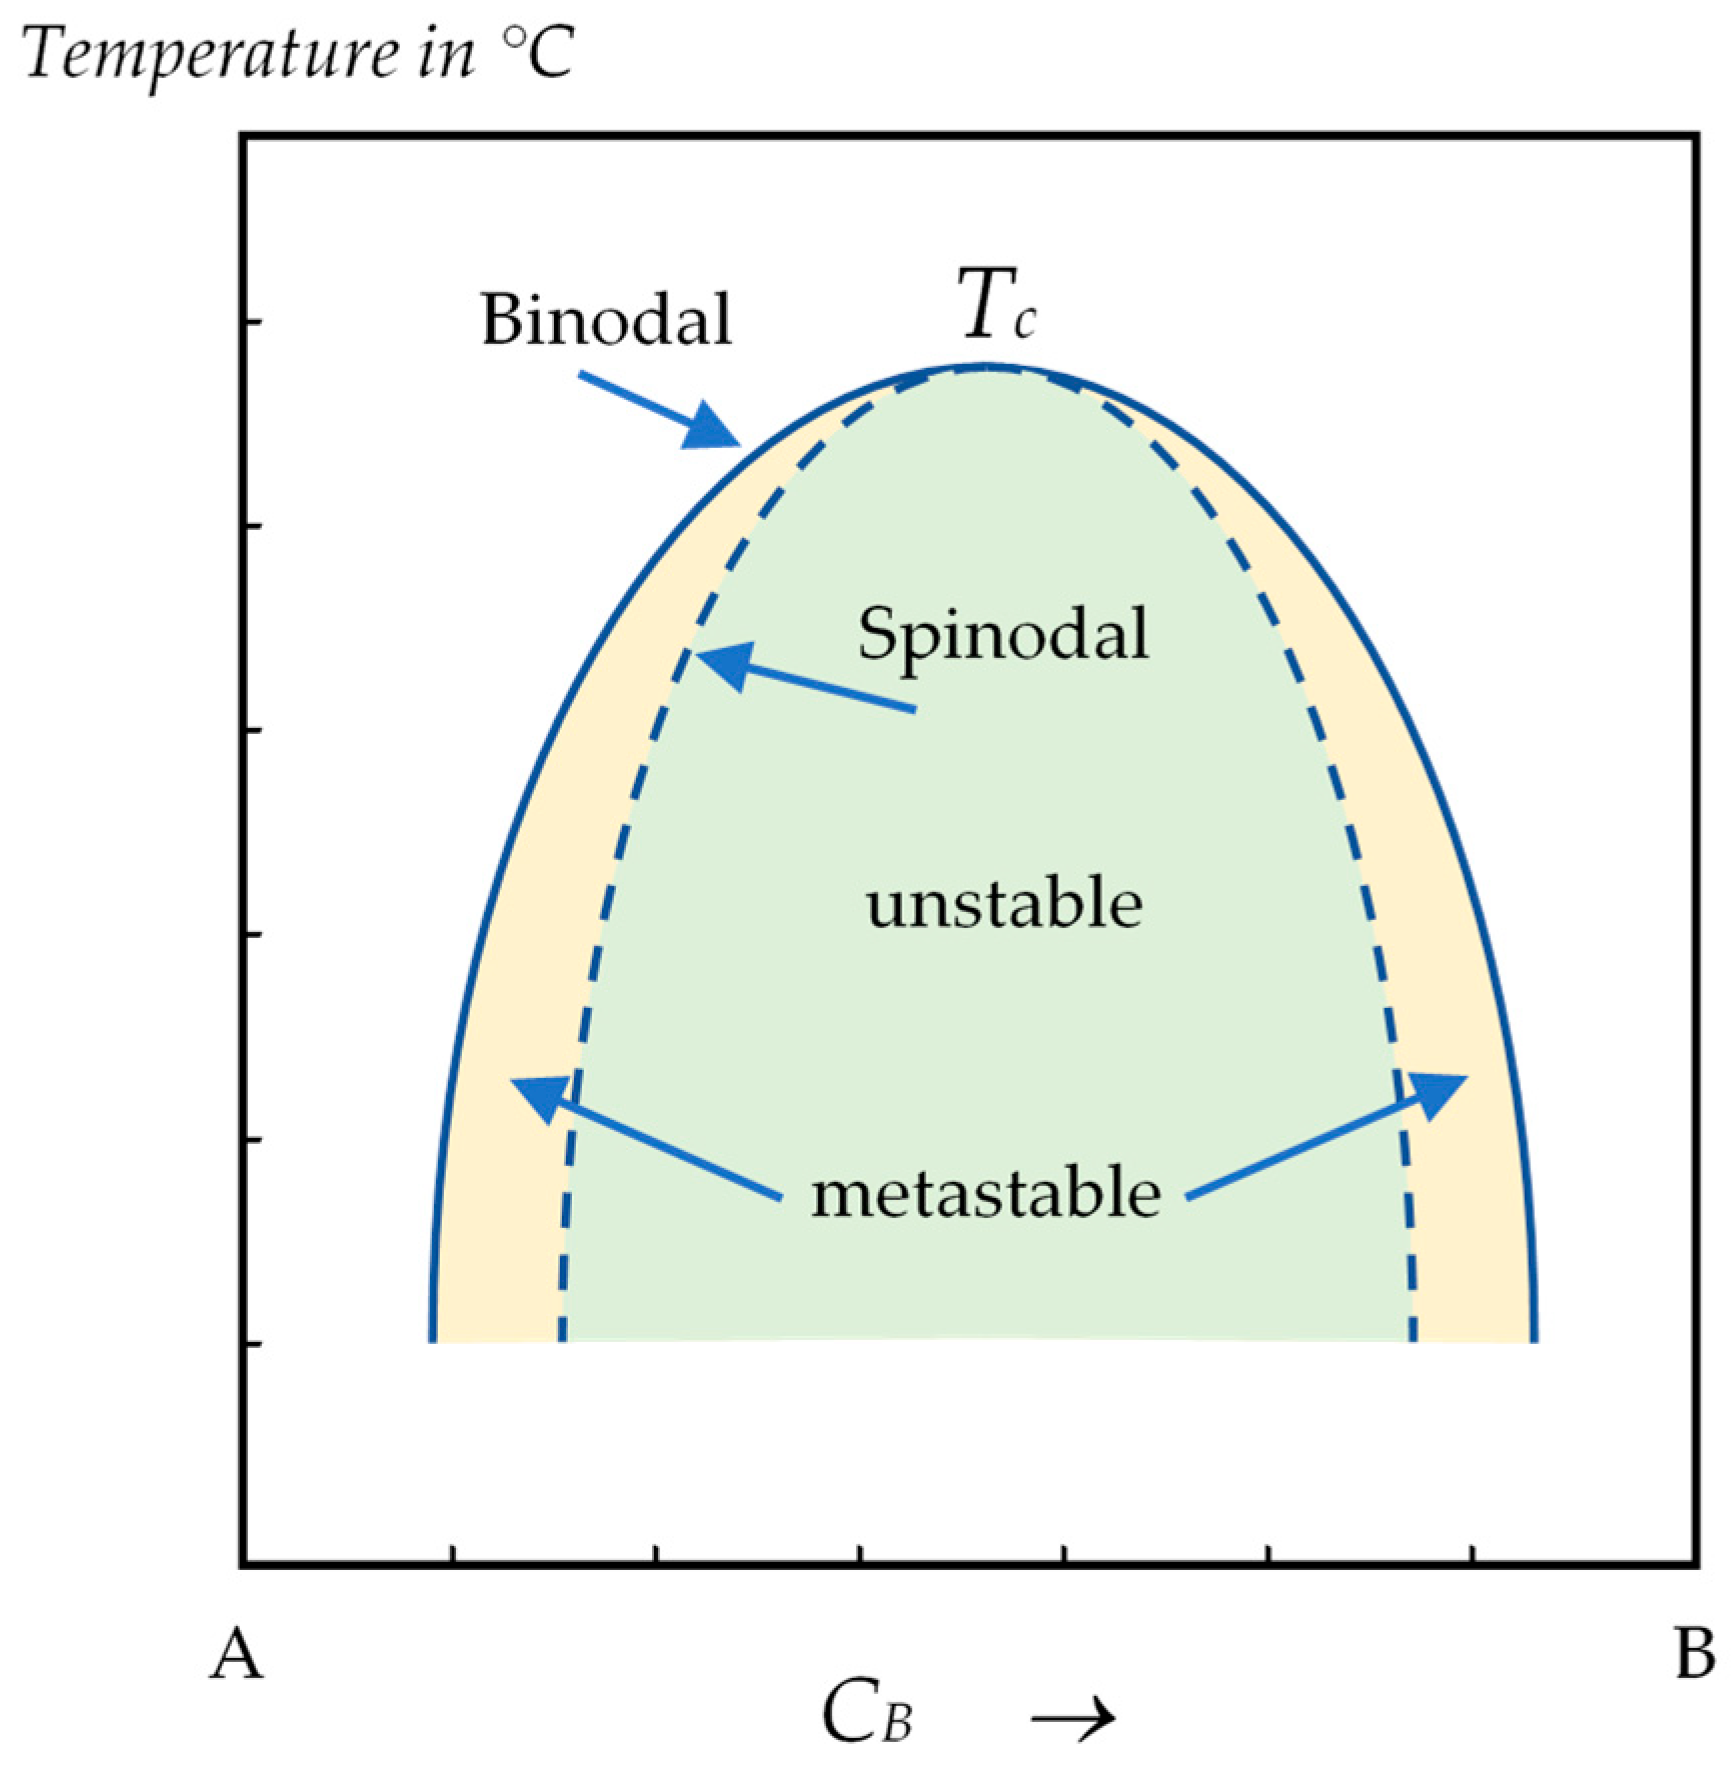
  • In the region between the binodal and the spinodal curves, the uniform liquid is assumed to be metastable. Therefore, the formation of Sn droplets requires a certain amount of energy, which can be greatly reduced by the help of inhomogeneities or impurities in the system (heterogeneous nucleation). In our experiments, owing to the thickness of the sample, the internal oxide layer of the sample could provide some active sites, like for the nucleation and growth of equiaxed grains [27,28]. Nevertheless, the nucleation and growth of Sn droplets remains rare;
  • For liquid compositions within the spinodal dome, the homogeneous solution is unstable against microscopic fluctuations in density or composition. Therefore, the liquid demixing will take place immediately, with no thermodynamic barrier to the growth of a new phase and the phase transformation is solely diffusion-controlled. In that case, the Sn-rich liquid may appear in the form of clouds and in large quantities.
Accordingly, in our experiments with the Al-10Cu-20Sn alloy, the two-step liquid-phase separation that has been observed by in situ X-ray radioscopy may be explained by the fact that, to reach the spinodal region of the phase diagram, a transition must take the material through the binodal region so that liquid-phase separation will start by a first step of nucleation and the growth of some rare Sn droplets, followed by the spinodal decomposition with the formation of a huge quantity of Sn liquid.

5. Conclusions

In this paper, the solidifications of the Al-10Cu-10Sn and Al-10Cu-20Sn alloys were successfully investigated using in situ X-ray radioscopy visualization, completed by Thermo-Calc calculations and thermal analysis. The main objective was to analyze the dynamics of the solidification process, with a special emphasis on the liquid-phase separation followed by the monotectic reaction that are expected to occur during the solidification of both alloys.
For both alloys, a dendritic microstructure was observed in the early stages of the sample cooling. However, it has been found that, depending on the alloy composition, the liquid-phase separation processes were dramatically different. For the low-Sn-content sample, the liquid-phase separation takes place gradually until the monotectic reaction occurs. For the high-Sn-content sample, liquid-phase separation is performed in two steps, which cannot be predicted by Thermo-Calc calculations. The origin of this two-step liquid separation is unclear and two plausible explanations are proposed. Further analyses and complementary experiments are required to improve our knowledge about this topic. Nevertheless, the high sensitivity of liquid-phase separation behavior depending on alloy composition, and the resulting different microstructures, show the importance of this type of study from both fundamental and industrial points of view. In the future, the influence of gravity has also to be investigated, in particular the characterization of the droplet motion and phase distribution for vertical directional solidification.

Supplementary Materials

The following supporting information can be downloaded at https://www.mdpi.com/article/10.3390/met15030296/s1. The two videos of the solidification experiments for the two alloys are provided in the online version. Video S1: Al-10Cu-10Sn: video showing the evolution of the solidification microstructure of Al -10 wt.% Cu–10 wt.% Sn by applying a cooling rate R = −0.15 °C/s, a thermal gradient Gapp = 5.55 °C/mm. Video S2: Al- 10Cu-20Sn: video showing the evolution of the solidification microstructure of Al -10 wt.% Cu–20 wt.% Sn by applying a cooling rate R = −0.15 °C/s, a thermal gradient Gapp = 5.55 °C/mm.

Author Contributions

Conceptualization and methodology, J.E.S., G.R. and H.N.-T.; Investigation, S.D.A., G.R., J.E.S., D.C.C.M. and H.S., Formal analysis, S.D.A., J.E.S. and H.S.; Writing—original draft preparation, S.D.A.; Writing—review and editing, S.D.A., G.R., D.C.C.M., H.S. and H.N.-T.; Visualization, S.D.A.; Validation, S.D.A., G.R. and H.S.; Supervision, G.R. and H.N.-T.; Project administration, G.R., J.E.S. and H.N.-T.; Funding acquisition, J.E.S. and H.N.-T. All authors have read and agreed to the published version of the manuscript.

Funding

This research is supported by the French National Space Agency (CNES) no. 200761/00 through the GDR MFA (no. 2799) network. Mrs Sarah De Albuquerque benefits from a PhD grant from the French Embassy in Brazil. This study was also financed in part by the Coordenação de Aperfeiçoamento de Pessoal de Nível Superior—Brasil (CAPES)—Finance Code 001. The authors also acknowledge FAPESP (grant #2023/06107-3).

Data Availability Statement

The original contributions presented in the study are included in the article, further inquiries can be directed to the corresponding author.

Acknowledgments

A. Garcia, F. Bertelli, and N. Cheung are warmly acknowledged for their help with the ingot preparation.

Conflicts of Interest

The authors declare no conflicts of interest. The founding sponsors had no role in the design of this study; in the collection, analyses, or interpretation of data; in the writing of the manuscript; or in the decision to publish the results.

References

  1. Ran, G.; Zhou, J.-E.; Xi, S.; Li, P. Microstructure and morphology of Al–Pb bearing alloy synthesized by mechanical alloying and hot extrusion. J. Alloys Compd. 2006, 419, 66–70. [Google Scholar] [CrossRef]
  2. Yang, Q.; Sun, Z.P.; Wang, Z.M. Effects of Sn, Si, and Cu addition on the microstructure and properties of hypermonotectic Al92Bi8 alloy. Mater. Sci. Eng. A 2019, 756, 71–81. [Google Scholar] [CrossRef]
  3. Lu, W.; Zhang, S.; Li, J. Segregation driven by collision and coagulation of minor droplets in Al–Bi immiscible alloys under aerodynamic levitation condition. Mater. Lett. 2013, 107, 340–343. [Google Scholar] [CrossRef]
  4. Lu, W.; Zhang, S.; Zhang, W.; Kaptay, G.; Yu, J.; Fu, Y.; Li, J. Direct observation of the segregation driven by bubble evolution and liquid phase separation in Al–10 wt.% Bi immiscible alloy. Scr. Mater. 2015, 102, 19–22. [Google Scholar] [CrossRef]
  5. Lu, Z.C.; Zeng, M.; Gao, Y.; Zhu, M. Significant improvement of wear properties by creating micro/nano dual-scale structure in Al-Sn alloys. Wear 2012, 296, 469–478. [Google Scholar] [CrossRef]
  6. Kotadia, H.R.; Patel., J.B.; Fan, Z.Y.; Doernberg, E.; Schmid-Fetzer, R. Processing of Al-45Sn-10Cu Based Immiscible Alloy by a Rheomixing Process. In Proceedings of the 10th International Conference on Semi-Solid Processing of Alloys and Composites, Aachen, Germany, 16–18 September 2008; Trans Tech Publications Ltd.: Stafa-Zurich, Switzerland, 2008. [Google Scholar]
  7. Kotadia, H.R.; Das, A.; Doernberg, E.; Schmid-Fetzer, R. A comparative study of ternary Al-Sn-Cu immiscible alloys prepared by conventional casting and casting under high-intensity ultrasonic irradiation. Mater. Chem. Phys. 2011, 131, 241–249. [Google Scholar] [CrossRef]
  8. Bertelli, F.; Brito, C.; Ferreira, I.L.; Reinhart, G.; Nguyen-Thi, H.; Mangelinck-Noël, N.; Cheung, N.; Garcia, A. Cooling thermal parameters, microstructure, segregation and hardness in directionally solidified Al-Sn-(Si;Cu) alloys. Mater. Des. 2015, 72, 31–42. [Google Scholar] [CrossRef]
  9. Bertelli, F.; Freitas, E.S.; Cheung, N.; Arenas, M.A.; Conde, A.; de Damborenea, J.; Garcia, A. Microstructure, tensile properties and wear resistance correlations on directionally solidified Al-Sn-(Cu; Si) alloys. J. Alloys Compd. 2017, 695, 3621–3631. [Google Scholar] [CrossRef]
  10. Li, S.H.; Li, Y.; Guo, H.; Wen, Z.; Zhu, Z. Effect of electromagnetic stirring frequency on tribological performance and corrosion resistance of Al-Sn bearing alloy. Mater. Today Commun. 2022, 32, 14. [Google Scholar] [CrossRef]
  11. Xu, M.; Yin, Y.-G.; Li, C.-M.; Duan, C.-C. A comparative study on Sn macrosegregation behavior of ternary Al-Sn-Cu alloys prepared by gravity casting and squeeze casting. China Foundry 2023, 20, 63–70. [Google Scholar] [CrossRef]
  12. Bykov, P.A.; Kalashnikov, I.; Kobeleva, L.; Katin, I.; Mikheev, R. Mapping wear modes of composite materials with intermetallic reinforcing based on antifrictional alloy of system Al-Sn-Cu. Lett. Mater. 2021, 11, 181–186. [Google Scholar] [CrossRef]
  13. Karagadde, S.; Leung, C.L.A.; Lee, P.D. Progress on In Situ and Operando X-ray Imaging of Solidification Processes. Materials 2021, 14, 2374. [Google Scholar] [CrossRef] [PubMed]
  14. Xiang, K.; Qin, L.; Zhao, Y.; Huang, S.; Du, W.; Boller, E.; Rack, A.; Li, M.; Mi, J. Operando study of the dynamic evolution of multiple Fe-rich intermetallics of an Al recycled alloy in solidification by synchrotron X-ray and machine learning. Acta Mater. 2024, 279, 120267. [Google Scholar] [CrossRef]
  15. Han, I.; Feng, S.; Wilde, F.; Grant, P.S.; Liotti, E. Revealing hot tear formation dynamics in Al–Cu alloys with X-ray radiography. Acta Mater. 2024, 262, 119421. [Google Scholar] [CrossRef]
  16. Qin, L.; Du, W.; Cipiccia, S.; Bodey, A.J.; Rau, C.; Mi, J. Synchrotron X-ray operando study and multiphysics modelling of the solidification dynamics of intermetallic phases under electromagnetic pulses. Acta Mater. 2024, 265, 119593. [Google Scholar] [CrossRef]
  17. Becker, M.; Klein, S.; Kargl, F. In-situ solute measurements with a laboratory polychromatic microfocus X-ray source during equiaxed solidification of an Al-Ge alloy. Scr. Mater. 2016, 124, 34–37. [Google Scholar] [CrossRef]
  18. Shevchenko, N.; Roshchupkina, O.; Sokolova, O.; Eckert, S. The effect of natural and forced melt convection on dendritic solidification in Ga-In alloys. J. Cryst. Growth 2015, 417, 1–8. [Google Scholar] [CrossRef]
  19. Reinhart, G.; Browne, D.J.; Kargl, F.; García-Moreno, F.; Becker, M.; Sondermann, E.; Binder, K.; Mullen, J.S.; Zimmermann, G.; Mathiesen, R.H.; et al. In-situ X-ray monitoring of solidification and related processes of metal alloys. Npj Microgravity 2023, 9, 70. [Google Scholar] [CrossRef]
  20. Werner, T.; Becker, M.; Baumann, J.; Xiao, X.; Pickmann, C.; Sturz, L.; Brillo, J.; Kargl, F. In situ observation of the cryophile migration of hydrogen bubbles in Al-alloys during directional melting and the impact of surface tension. Acta Mater. 2022, 224, 117503. [Google Scholar] [CrossRef]
  21. Schaffer, P.L.; Mathiesen, R.H.; Arnberg, L.; Di Sabatino, M.; Snigirev, A. In situ investigation of spinodal decomposition in hypermonotectic Al–Bi and Al–Bi–Zn alloys. New J. Phys. 2008, 10, 053001. [Google Scholar] [CrossRef]
  22. Schaffer, P.L.; Mathiesen, R.H.; Arnberg, L. L-2 droplet interaction with alpha-Al during solidification of hypermonotectic Al-8 wt.% Bi alloys. Acta Mater. 2009, 57, 2887–2895. [Google Scholar] [CrossRef]
  23. Zhang, Y.; Wu, Y.; Tang, Y.; Ma, J.; Mao, B.; Xue, Y.; Xing, H.; Zhang, J.; Sun, B. In situ study on the oscillation of mobile droplets and force analysis during the directional solidification of Al-Bi alloy. J. Mater. Res. Technol. 2024, 177, 1–9. [Google Scholar] [CrossRef]
  24. De Albuquerque, S.; Reinhart, G.; Magalhães, D.C.C.; Spinelli, J.E.; Soltani, H.; Boumechta, W.; Bertelli, F.; Nguyen-Thi, H. Solidification paths of Al-Cu-Sn alloys: Comparison of thermodynamic analyses and solidification experiments using in situ X-radiography. Mater. Today Commun. 2024, 40, 109545. [Google Scholar] [CrossRef]
  25. Thermo-Calc Software: Computational Materials Engineering. Available online: https://thermocalc.com (accessed on 3 March 2025).
  26. Jain, S.; Patel, M.; Kumar, V.; Samal, S. Effect of Si on Phase Equilibria, Mechanical Properties and Tribological Behaviour of Al-Cu Alloy. Silicon 2023, 15, 1807–1820. [Google Scholar] [CrossRef]
  27. Soltani, H.; Ngomesse, F.; Reinhart, G.; Benoudia, M.C.; Zahzouh, M.; Nguyen-Thi, H. Impact of gravity on directional solidification of refined Al-20wt.%Cu alloy investigated by in situ X-radiography. J. Alloys Compd. 2021, 862, 158028. [Google Scholar] [CrossRef]
  28. Soltani, H.; Reinhart, G.; Benoudia, M.C.; Zahzouh, M.; Nguyen-Thi, H. Impact of gravity-related phenomena on the grain structure formation: Comparative study between horizontal and vertical solidification of a refined Al-20wt.%Cu alloy. IOP Conf. Ser. Mater. Sci. Eng. 2019, 529, 012019. [Google Scholar] [CrossRef]
  29. Schneider, C.A.; Rasband, W.S.; Eliceiri, K.W. NIH Image to ImageJ: 25 years of image analysis. Nat. Methods 2012, 9, 671–675. [Google Scholar] [CrossRef] [PubMed]
  30. Hecht, U.; Gránásy, L.; Pusztai, T.; Böttger, B.; Apel, M.; Witusiewicz, V.; Ratke, L.; De Wilde, J.; Froyen, L.; Camel, D.; et al. Multiphase solidification in multicomponent alloys. Mat. Sci. Eng. R 2004, 46, 1–49. [Google Scholar] [CrossRef]
  31. Zhang, D.; Atkinson, H.V.; Dong, H.; Zhu, Q. Differential Scanning Calorimetry (DSC) and Thermodynamic Prediction of Liquid Fraction vs Temperature for Two High-Performance Alloys for Semi-Solid Processing (Al-Si-Cu-Mg (319s) and Al-Cu-Ag (201)). Metall. Mater. Trans. A 2017, 48, 4701–4712. [Google Scholar] [CrossRef]
  32. Kočí, V.; Fort, J.; Madera, J.; Scheinherrova, L.; Trnik, A.; Cerny, R. Correction of Errors in DSC Measurements Using Detailed Modeling of Thermal Phenomena in Calorimeter-Sample System. IEEE Trans. Instrum. Meas. 2020, 69, 8178–8186. [Google Scholar] [CrossRef]
  33. Höhne, G.W.H.; Cammenga, H.; Eysel, W.; Gmelin, E.; Hemminger, W. The temperature calibration of scanning calorimeters. Thermochim. Acta 1990, 160, 1–12. [Google Scholar] [CrossRef]
  34. Ghanbari, E.; Picken, S.J.; van Esch, J.H. Analysis of differential scanning calorimetry (DSC): Determining the transition temperatures, and enthalpy and heat capacity changes in multicomponent systems by analytical model fitting. J. Therm. Anal. Calorim. 2023, 148, 12393–12409. [Google Scholar] [CrossRef]
  35. Ratke, L.; Diefenbach, S. Liquid immiscible alloys. Mat. Sci. Eng. R 1995, 15, 263–347. [Google Scholar] [CrossRef]
Figure 1. (a) Scheme of the furnace with its components; (b) scheme of the imaging system showing the distances of the source-sample (5 mm) and source-detector (25 mm) used to determine the geometric magnification factor.
Metals 15 00296 g001
Figure 2. Examples of images after the two image processing procedures used to improve the legibility of the images. Radiographs of Al–10Cu–20Sn alloy solidification (R = 0.15 °C/s and Gapp = 5.55 °C/mm): (a) flat-field correction revealing the growth microstructure; (b) frame-differencing procedure showing the solidified α-Al during a time interval of 5 s.
Metals 15 00296 g002
Figure 3. Equilibrium solidification paths of the two investigated alloy compositions: (a) Al-10Cu-10Sn; (b) Al-10 Cu-20Sn. Calculated by Thermo-Calc software.
Metals 15 00296 g003
Figure 4. Series of isothermal sections of the ternary phase diagram for Al-Cu-Sn alloy, calculated at several temperatures by Thermo-Calc software: (a) T = 625 °C; (b) T = 570 °C; (c) T = 540 °C; (d) T = 529.5 °C; (e) T = 520 °C; (f) T = 229.4 °C. The red and blue dots indicate the positions of the Al-10Cu-10Sn and Al-10Cu-20Sn alloy compositions in the isothermal sections.
Metals 15 00296 g004
Figure 5. DSC cooling curves at a rate of 5 °C/min of the two Al-Cu-Sn alloys displaying the exothermic peaks of each transformation (α-Al dendrite growth, liquid-phase separation, monotectic reaction, and eutectic reaction). For Al-10Cu-10Sn (red line), the transformation temperatures are T(α-Al) = 600.5 °C; T (liquid-phase separation) = 525.5 °C; T (monotectic reaction) = 510.5 °C; and T (eutectic reaction) = 220.5 °C. For Al-10Cu-20Sn (black line), the corresponding temperatures are T(α-Al) = 572.8 °C; T (liquid-phase separation) = 517.8 °C; T (monotectic reaction) = 530.3 °C; and T (eutectic reaction) = 220.3 °C.
Metals 15 00296 g005
Figure 6. Sequence of radiographs processed by flat-field image processing technique showing the early stages of solidification experiments of Al-10Cu-10Sn (first row: (a1c1)) and Al-10Cu-20Sn (second row: (a2c2)) with R = −0.15 °C/s and Gapp = 5.55 °C/mm. For each image, the average temperature Tavg at the center of the field of view is given. In these images, α-Al dendrites appear in white surrounded by a darker gray solute-rich liquid. The white dashed lines in (b1) and (b2) indicate the mean position of the dendrite tips.
Metals 15 00296 g006
Figure 7. Sequence of three radiographs (ac) after the frame-differencing processing revealing the liquid-phase separation followed by the monotectic reaction during the directional solidification of Al-10Cu-10Sn (R = −0.15 °C/s, Gapp = 5.55 °C/mm). Tavg is the temperature at the center of the field of view. The white dashed line in Figure (a) indicates the altitude where the first droplets are detected. (d) Vertical average gray level profile along the field of view in arbitrary unit (a.u.).
Metals 15 00296 g007
Figure 8. Sequence of three radiographs (ac) after the frame-differencing processing revealing the liquid-phase separation followed by the monotectic reaction during the directional solidification of Al-10Cu-20Sn (R = −0.15 °C/s, Gapp = 5.55 °C/mm). Tavg is the temperature at the center of the field of view. The white dashed line in Figure (a) indicates the altitude where the first droplets are detected. (d) Vertical average gray level profile along the field of view in arbitrary unit (a.u.). The initial stage of liquid demixing, which gives rise to the formation of small L″ droplets, is observable in Figure 6a. In the second stage, the abrupt generation of a copious quantity of the Sn-rich liquid L″ is discernible from t = 65 s.
Metals 15 00296 g008
Figure 9. (Reproduced from Schaffer et al. [21]) Al–6 wt.% Bi–8 wt.% Zn alloy solidified in a thermal gradient of 60 K/mm and at a velocity of 17.5 µm/s. The transition from immiscible to miscible liquids when the Zn-rich boundary layer approaches can be seen from t = 0 to 16.8 s. As the diffuse Bi domains move closer to the monotectic front, Zn concentration reduces, and immiscibility re-establishes leading to secondary nucleation of Zn droplets (t = 25.2 to 42 s). Image size corresponds to 1.3 × 1.3 mm2. © Deutsche Physikalische Gesellschaft. Reprinted with permission from ref. [21]. 2008 IOP Publishing. CC BY-NC-SA.
Metals 15 00296 g009
Figure 10. Typical temperature–composition graph for a binary alloy, showing the miscibility gap and spinodal line in a regular solution system. Uniform liquid within the spinodal curve is unstable and can decompose without overcoming an energy activation barrier. Uniform liquid between the binodal and spinodal curves are metastable and decomposition must proceed by a process of nucleation and growth.
Metals 15 00296 g010
Table 1. Temperature ranges of the successive reactions predicted by Thermo-Calc software during the cooling of the Al-10Cu-10Sn (second column) and Al-10Cu-20Sn (third column) alloys.
Phase ReactionsAl-10Cu-10SnAl-10Cu-20Sn
Liquid L>615 °C>597.5 °C
L → L′ + α-Al (dendrites)615 → 537.5 °C597.5 → 550.6 °C
L′ → α-Al + L′ + L″ (Sn-rich)537.5 → 529.4 °C550.6 → 529.4 °C
L′ → α-Al + L″ + θ-Al2CuMonotectic reaction at 529.4 °C
L′ + α-Al → θ-Al2Cu529.4 → 229.5 °C529.4 → 229.5 °C
L″ → α-Al + θ-Al2Cu + β-Sn Eutectic reaction at 229.5 °C
Disclaimer/Publisher’s Note: The statements, opinions and data contained in all publications are solely those of the individual author(s) and contributor(s) and not of MDPI and/or the editor(s). MDPI and/or the editor(s) disclaim responsibility for any injury to people or property resulting from any ideas, methods, instructions or products referred to in the content.

