Article

Achieving High Strength and Plasticity by Controlling the Volume Fractions of Martensite and Ferrite in Rare Earth, Micro-Alloyed Dual-Phase Steel

State Key Laboratory of Refractory and Metallurgy, Wuhan University of Science and Technology, Wuhan 430081, China
*
Author to whom correspondence should be addressed.
Metals 2025, 15(3), 310; https://doi.org/10.3390/met15030310
Submission received: 13 February 2025 / Revised: 7 March 2025 / Accepted: 10 March 2025 / Published: 13 March 2025

Abstract

:
The volume fractions of martensite and ferrite in dual-phase steel affect its strength and plasticity. In this study, the effect of heat treatment on the structure morphology and volume fractions of martensitic and ferrite was studied in rare earth, micro-alloyed dual-phase steel, and the strain-hardening behaviour of the experimental steel under various process conditions was determined. The results show that a uniform structure with an alternating distribution of ferrite and martensite could be obtained by complete quenching before critical annealing, and the martensitic phase content increased from 60% to 93% with a rise in annealing temperature. With the growth in the martensitic phase content, the strength of dual-phase (DP) steel gradually increased, and elongation gradually decreased. However, the strength–plasticity product remained at approximately 17 GPa∙%, showing good comprehensive mechanical properties, and the mechanical properties were better at 780 and 820 °C annealing temperatures. When the martensite content was higher, the strain-hardening ability of the DP steel was stronger. The results show that the failure mode of the DP steel was a typical ductile fracture, and only a small amount of cleavage pattern was observed in the samples annealed at 840 °C. No obvious interfacial disbonding was seen in the tensile fracture, and only a few cracks formed. By optimizing the heat treatment process, the microstructural uniformity was improved, and the ferrite phase was strengthened to some extent, which better coordinated the deformation of ferrite and martensite, thereby delaying fracture. The modification effect of rare earth elements on inclusions in the DP steel was obvious.

1. Introduction

Advanced high-strength steel has high strength and elongation and significant advantages in its balance of strength and plasticity, and it plays an important role in the automotive industry [1,2,3,4]. A dual-phase (DP) steel structure is usually composed of a hard martensitic phase and a soft ferrite phase. Its high strength, ductility, and strain-hardening ability; good formability; and weldability allow it to demonstrate excellent comprehensive performance [5,6,7,8,9,10]. The mechanical properties of DP steel are influenced by various factors, such as the volume fraction and distribution of constituent phases, the morphology and mechanical behaviour of component phases, grain size, the morphology and distribution of inclusions, the segregation and clustering of alloying elements, and the distribution of dislocations [11,12,13,14,15,16].
By controlling DP steel’s annealing temperature, the martensite volume fraction can be gradually increased from 40% to 80%. The tensile and yield strengths of the experimental steel had been increased by 200 MPa and 100 MPa, respectively, but its elongation decreased by 5.7% [17]. However, some scholars [12] have pointed out that the mechanical properties of DP steel are not entirely linearly related to its martensite content, and its strength first rises to a peak and then decreases. Some scholars [18] have pointed out that with the increase in martensite, the strength and plasticity of DP steel grow simultaneously. Xu et al. [11] designed three different heat treatment processes to prepare DP steel. First, they heated the original hot-rolled samples to the complete austenitizing phase zone and then isothermally quenched it in the two-phase zone to obtain a ferrite-surrounded, martensitic-island DP steel. They also directly heated the original hot-rolled sample to the two-phase zone for a period of time and obtained a martensitic ferrite island surrounded by DP steel. Finally, they completely austenitized and quenched the original sample, heated it to the two-phase zone for a period of time, and obtained DP steel with an alternating uniform distribution of martensite and ferrite [martensite–intercritical quenching (MIQ) process]. Among the three processes, the DP steel produced by the MIQ process has the best strength–plasticity properties. Park [19] used equal-channel angle extrusion and critical annealing to produce ultra-fine-crystal DP steel. Ashrafi [20] achieved microstructure refinement through multiple critical annealing. Papa Rao [21] and Alibeyki [22] obtained fine-crystal DP steel by rolling at various temperatures and critical annealing.
Rare earth elements are often added to steel as purifiers, and it is essential to reduce impurity elements such as oxygen and sulfur in steel [23]. Wang et al. [24] elaborated the modification mechanism of inclusions and the resulting property changes in related reviews. Rare earth inclusions with an aspect ratio close to 1 are more beneficial for improving the steel’s plasticity and toughness. Torkamani et al. [25] found in their study that rare earth inclusions continue to support the matrix after the application of impact stress. Rare earth inclusions can serve as heterogeneous nucleation cores, providing more nucleation sites [26]. In addition, they can hinder grain boundary migration through solute drag and pinning effects, thereby inhibiting grain growth [27,28]. Rare earth elements can also interact with other atoms in steel (e.g., Nb and C), promoting the precipitation of niobium-containing nano-sized carbides and affecting dislocation slip at certain locations, which positively contributes to improving the material’s strength and strain-hardening ability [25,29]. In DP steel, the morphology and size of inclusions, crack initiation, grain size and microstructural uniformity, interactions between alloying elements, dislocation slip, and other factors all directly or indirectly affect its mechanical properties. Considering the characteristics of rare earth elements, they also have potential applications in DP steel, and some researchers have already conducted studies in this area [30,31,32].
Scholars seem to focus more on the martensitic phase in DP steel; there is not enough in-depth research on the ferrite phase and the interaction between the two phases, and studies on the relevant characterization methods for DP steel are not comprehensive enough. In this study, rare earth, micro-alloyed DP steel was taken as the research object, and a more reasonable and popularized heat treatment process was adopted. The volume fractions of the ferrite and martensitic phases in the DP steel were regulated by controlling the annealing temperature in various two-phase zones. Different characterization methods were used to analyze the micro-morphology of the experimental steel. The influence law and mechanism of microstructures on the strain-hardening behaviour of DP steel were expounded, and the process parameters of strength–plasticity optimization were obtained.

2. Materials and Methods

2.1. Experimental Material and Heat Treatment Methods
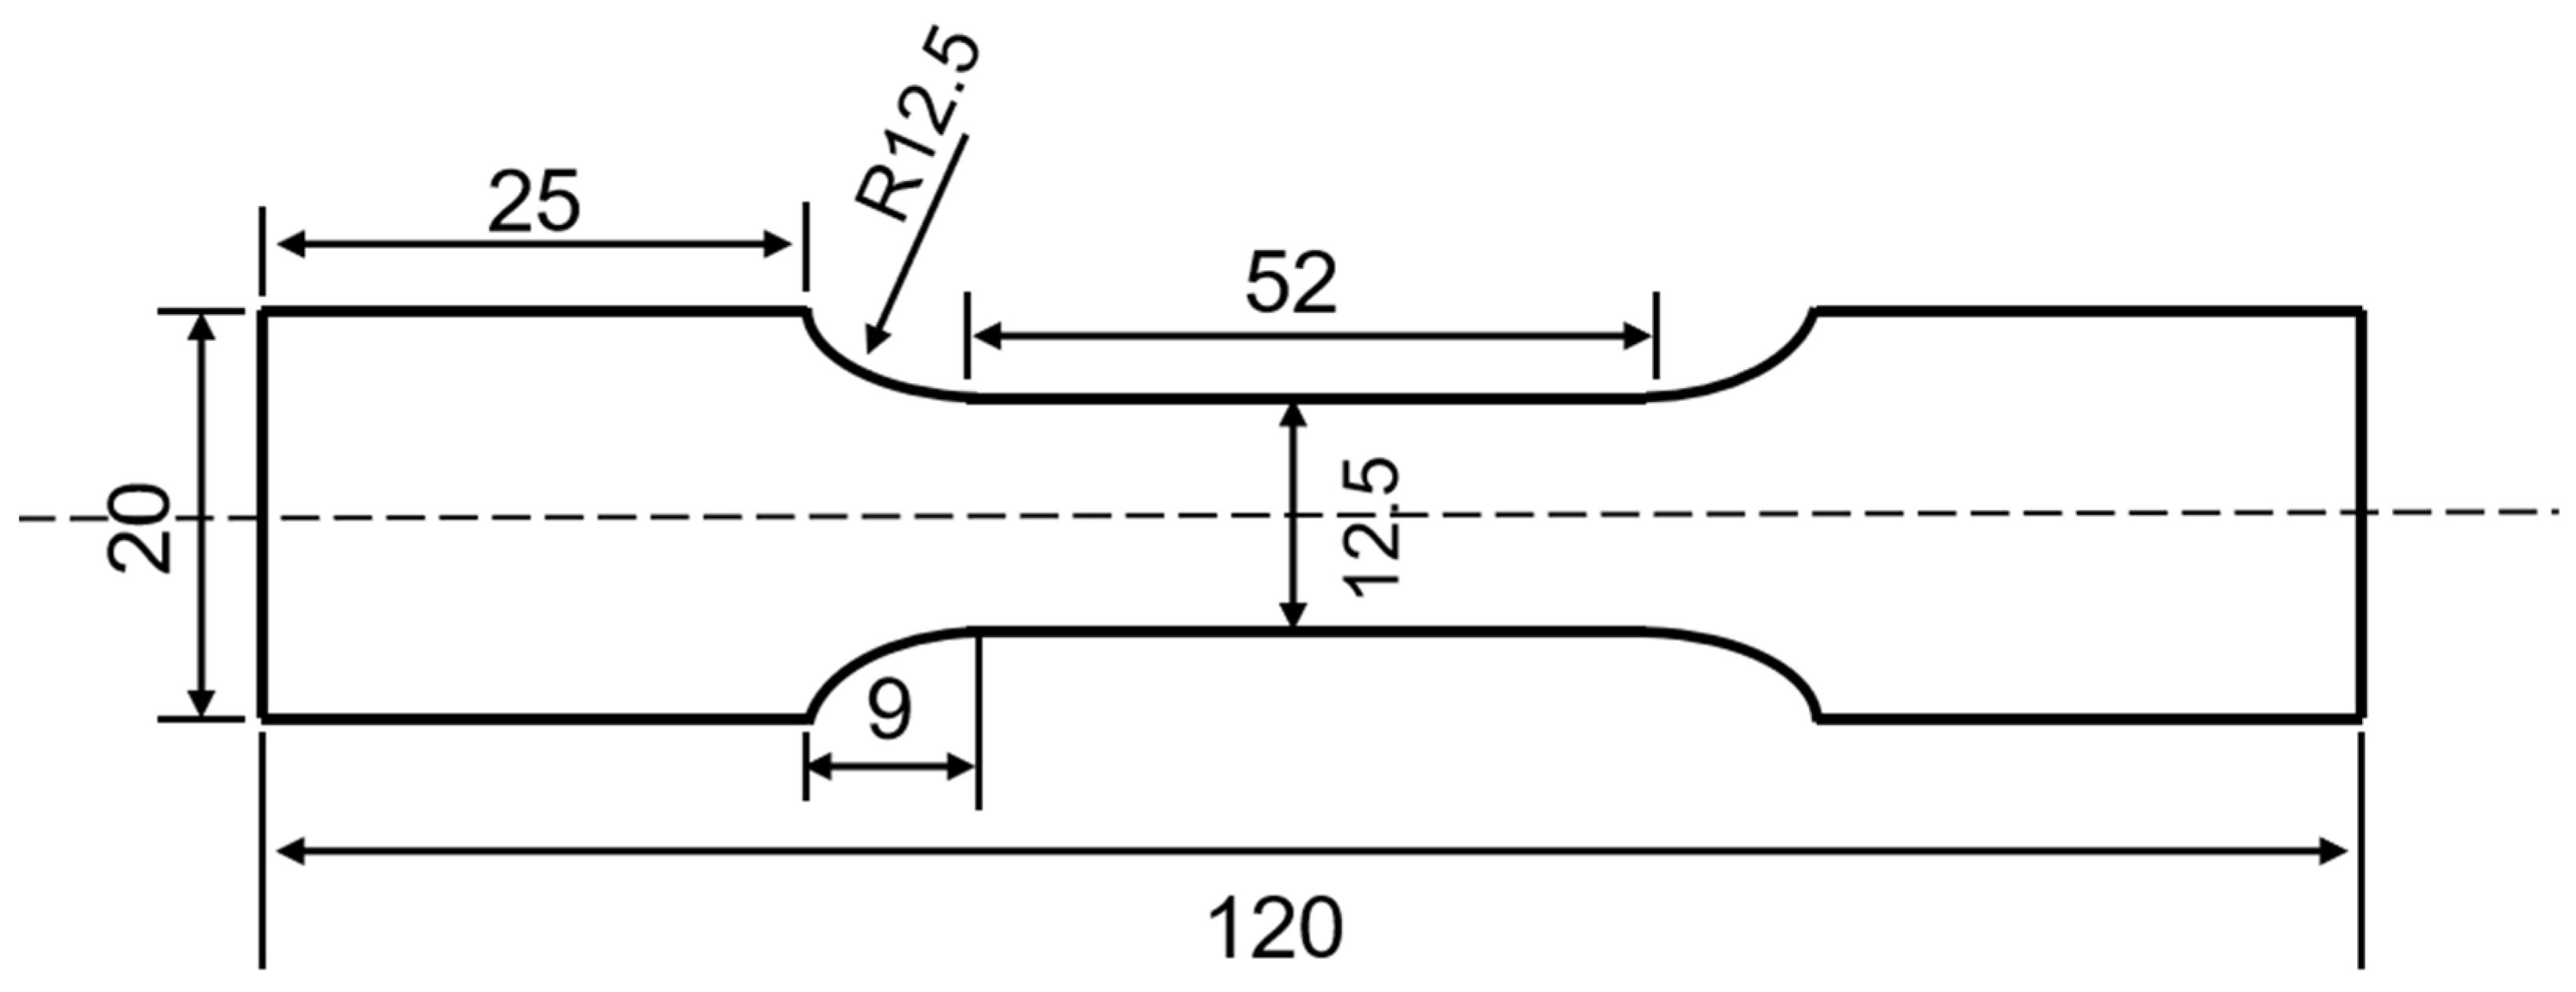
The hot-rolled steel plate used in this study was initially 5 mm thick. Its chemical composition is shown in Table 1.
According to the calculations performed using JMatPro V7.0 and Thermo-Calc 2021b software, the Ac1 temperature was 690.7 °C, the Ac3 temperature was 842.7 °C, and the Ms temperature was 384.7 °C. First, the experimental steel samples were heated to 880 °C for 20 min to obtain a single austenitic structure. Then, they were quenched in water. The 4 samples were then heated to dual-phase-zone temperatures of 780, 800, 820, and 840 °C, annealed for 20 min and then water-cooled, and finally tempered at a temperature of 250 °C for 40 min. The heat treatment process curve is shown in Figure 1.

2.2. Tensile Tests

After heat treatment, the samples were processed as tensile specimens in accordance with the ASTM E8/E8M-2021 standard [33]. The size of the tensile specimens is shown in Figure 2; they are 2 mm thick. The tensile tests were performed using an INTRON-8801 tensile test machine (Norwood, MA, USA), and the parameters were determined in accordance with the ASTM E8/E8M-2021 standard. The test rate was 0.75 mm/min and was constant until fracture. The relevant stress–strain data were recorded during the tensile tests. (It should be noted that due to the limitations of the testing machine, the extensometer had to be removed when the strain reached 0.2%). Three tensile tests were performed at each annealing temperature to ensure the accuracy of the data.

2.3. Microstructure Characterization

Microstructure observation samples were taken at the 1/2 widths of the steel plates. They were successively ground with 400, 600, 800, 1000, and 1500 mesh sandpapers and mechanically polished with diamond polishing paste. The microstructure was revealed by etching in a 4% nitric acid alcohol solution for approximately 10 s. The microstructure morphology and element distribution were analyzed by scanning electron microscopy (SEM) (FEI NOVA 400 NanoSEM, Hillsboro, OR, USA), transmission electron microscopy (TEM) (CF-HR JEM-F200, Tokyo, Japan), and a field emission electron probe microanalyzer (EPMA) (Shimadzu EPMA-8050G, Kyoto, Japan). For samples observed using an electron backscatter diffractometer (EBSD) (Oxford Symmetry S3, Abingdon, UK), electrolytic polishing was performed with a 10% perchloric acid alcohol solution at 30 V for approximately 6 s. The EBSD data acquisition step size was set to 0.4 μm, and the data were processed using AZtecCrystal 2.1.2 software. A 1 mm thick TEM sample was obtained by wire cutting, and then it was successively ground with 600, 800, 1000, 1500, and 2000 mesh sandpapers to a thickness of 80 μm, punched into a 3 mm diameter disc with a punch, and then further ground with 3000 mesh sandpaper to a thickness of 60 μm. Then, electrolytic double-jet polishing was performed in a 10% perchloric acid alcohol solution at 23.5 V and a temperature of −13 °C. The tensile fracture surface was studied using SEM to compare the differences among the samples annealed at various annealing temperatures.

3. Results

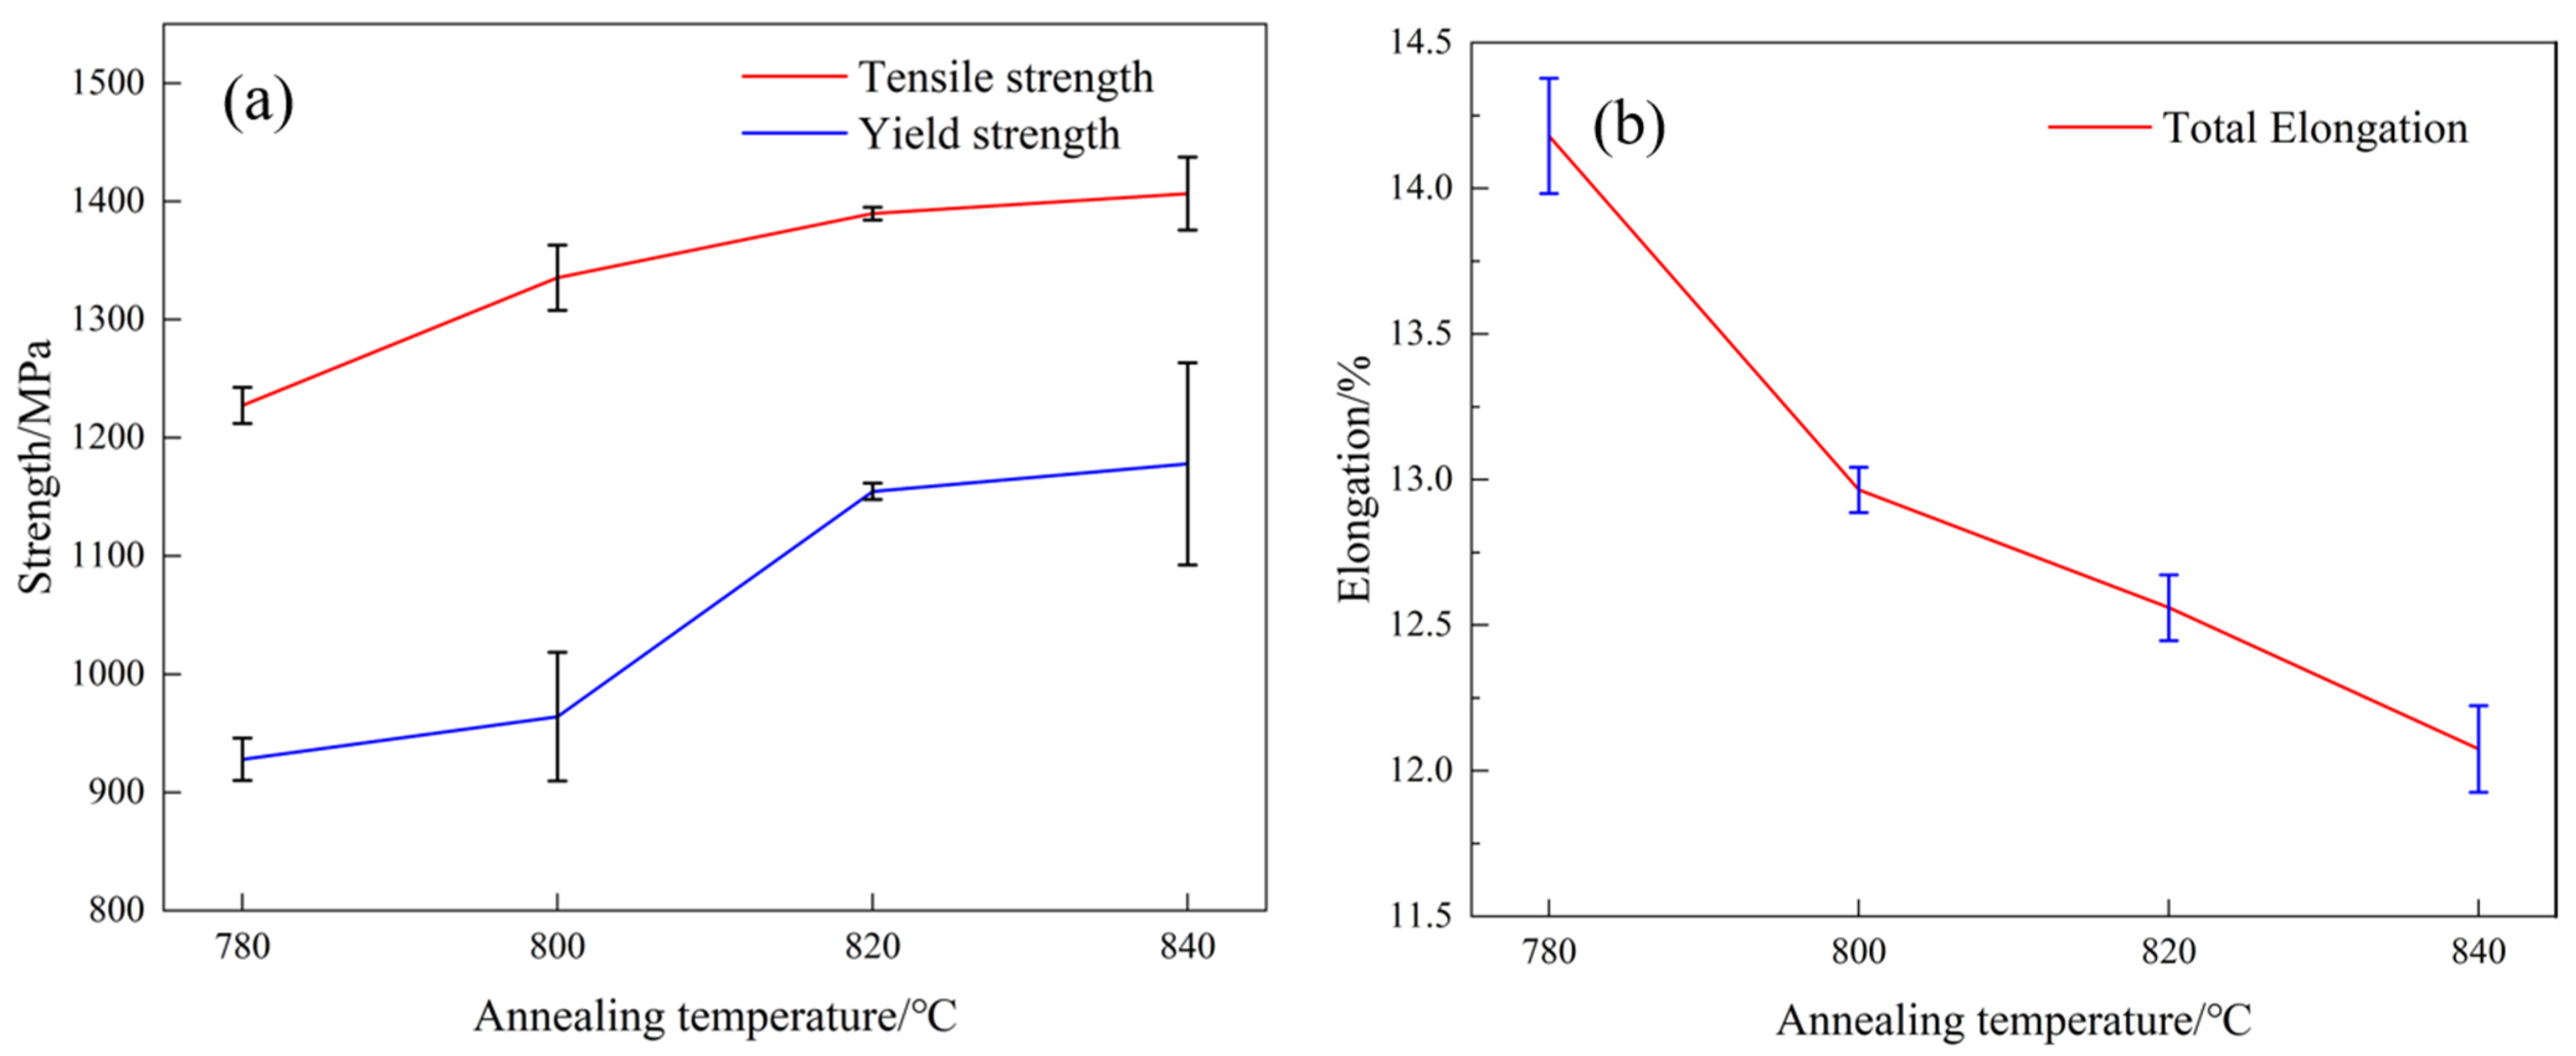
3.1. Mechanical Properties

The engineering stress–strain curves of the four groups of experimental steels are shown in Figure 3. All specimens had good strength and plasticity. As the intercritical annealing temperature increased, the strength of the experimental steels increased significantly, but the plasticity decreased. Figure 4 shows the specific changes in the mechanical properties. The ultimate tensile strength (UTS) of the experimental steels increased from 1227 MPa to 1406 MPa, the yield strength increased from 928 MPa to 1177 MPa, and the total elongation (TE) decreased from 14.18% to 12.07%.
The product with tensile strength and TE is called the strength–plasticity product, namely UTS × TE [34,35]. Ferritic–martensitic dual-phase steel’s high strength–plasticity product reflects its good structure and comprehensive mechanical properties. By calculation, the strength–plasticity product of the four groups of experimental steels were 17.40, 17.31, 17.46, and 16.99 GPa∙%, respectively, which showed that the overall mechanical properties were optimal when annealing was performed at 780 and 820 °C. When annealing was performed at 800 °C, the strength increased a little, and the elongation decreased more, whereas when annealing was performed at 840 °C, although the strength was higher, the high annealing temperature led to a large reduction in the ferrite content, the elongation was reduced by 2% relative to that at 780 °C, and the strength–plasticity product was reduced. One of the main advantages of DP steel is its high work-hardening rate during deformation, and its good work-hardening ability is the basis of its good strength–plasticity balance [36,37,38,39].

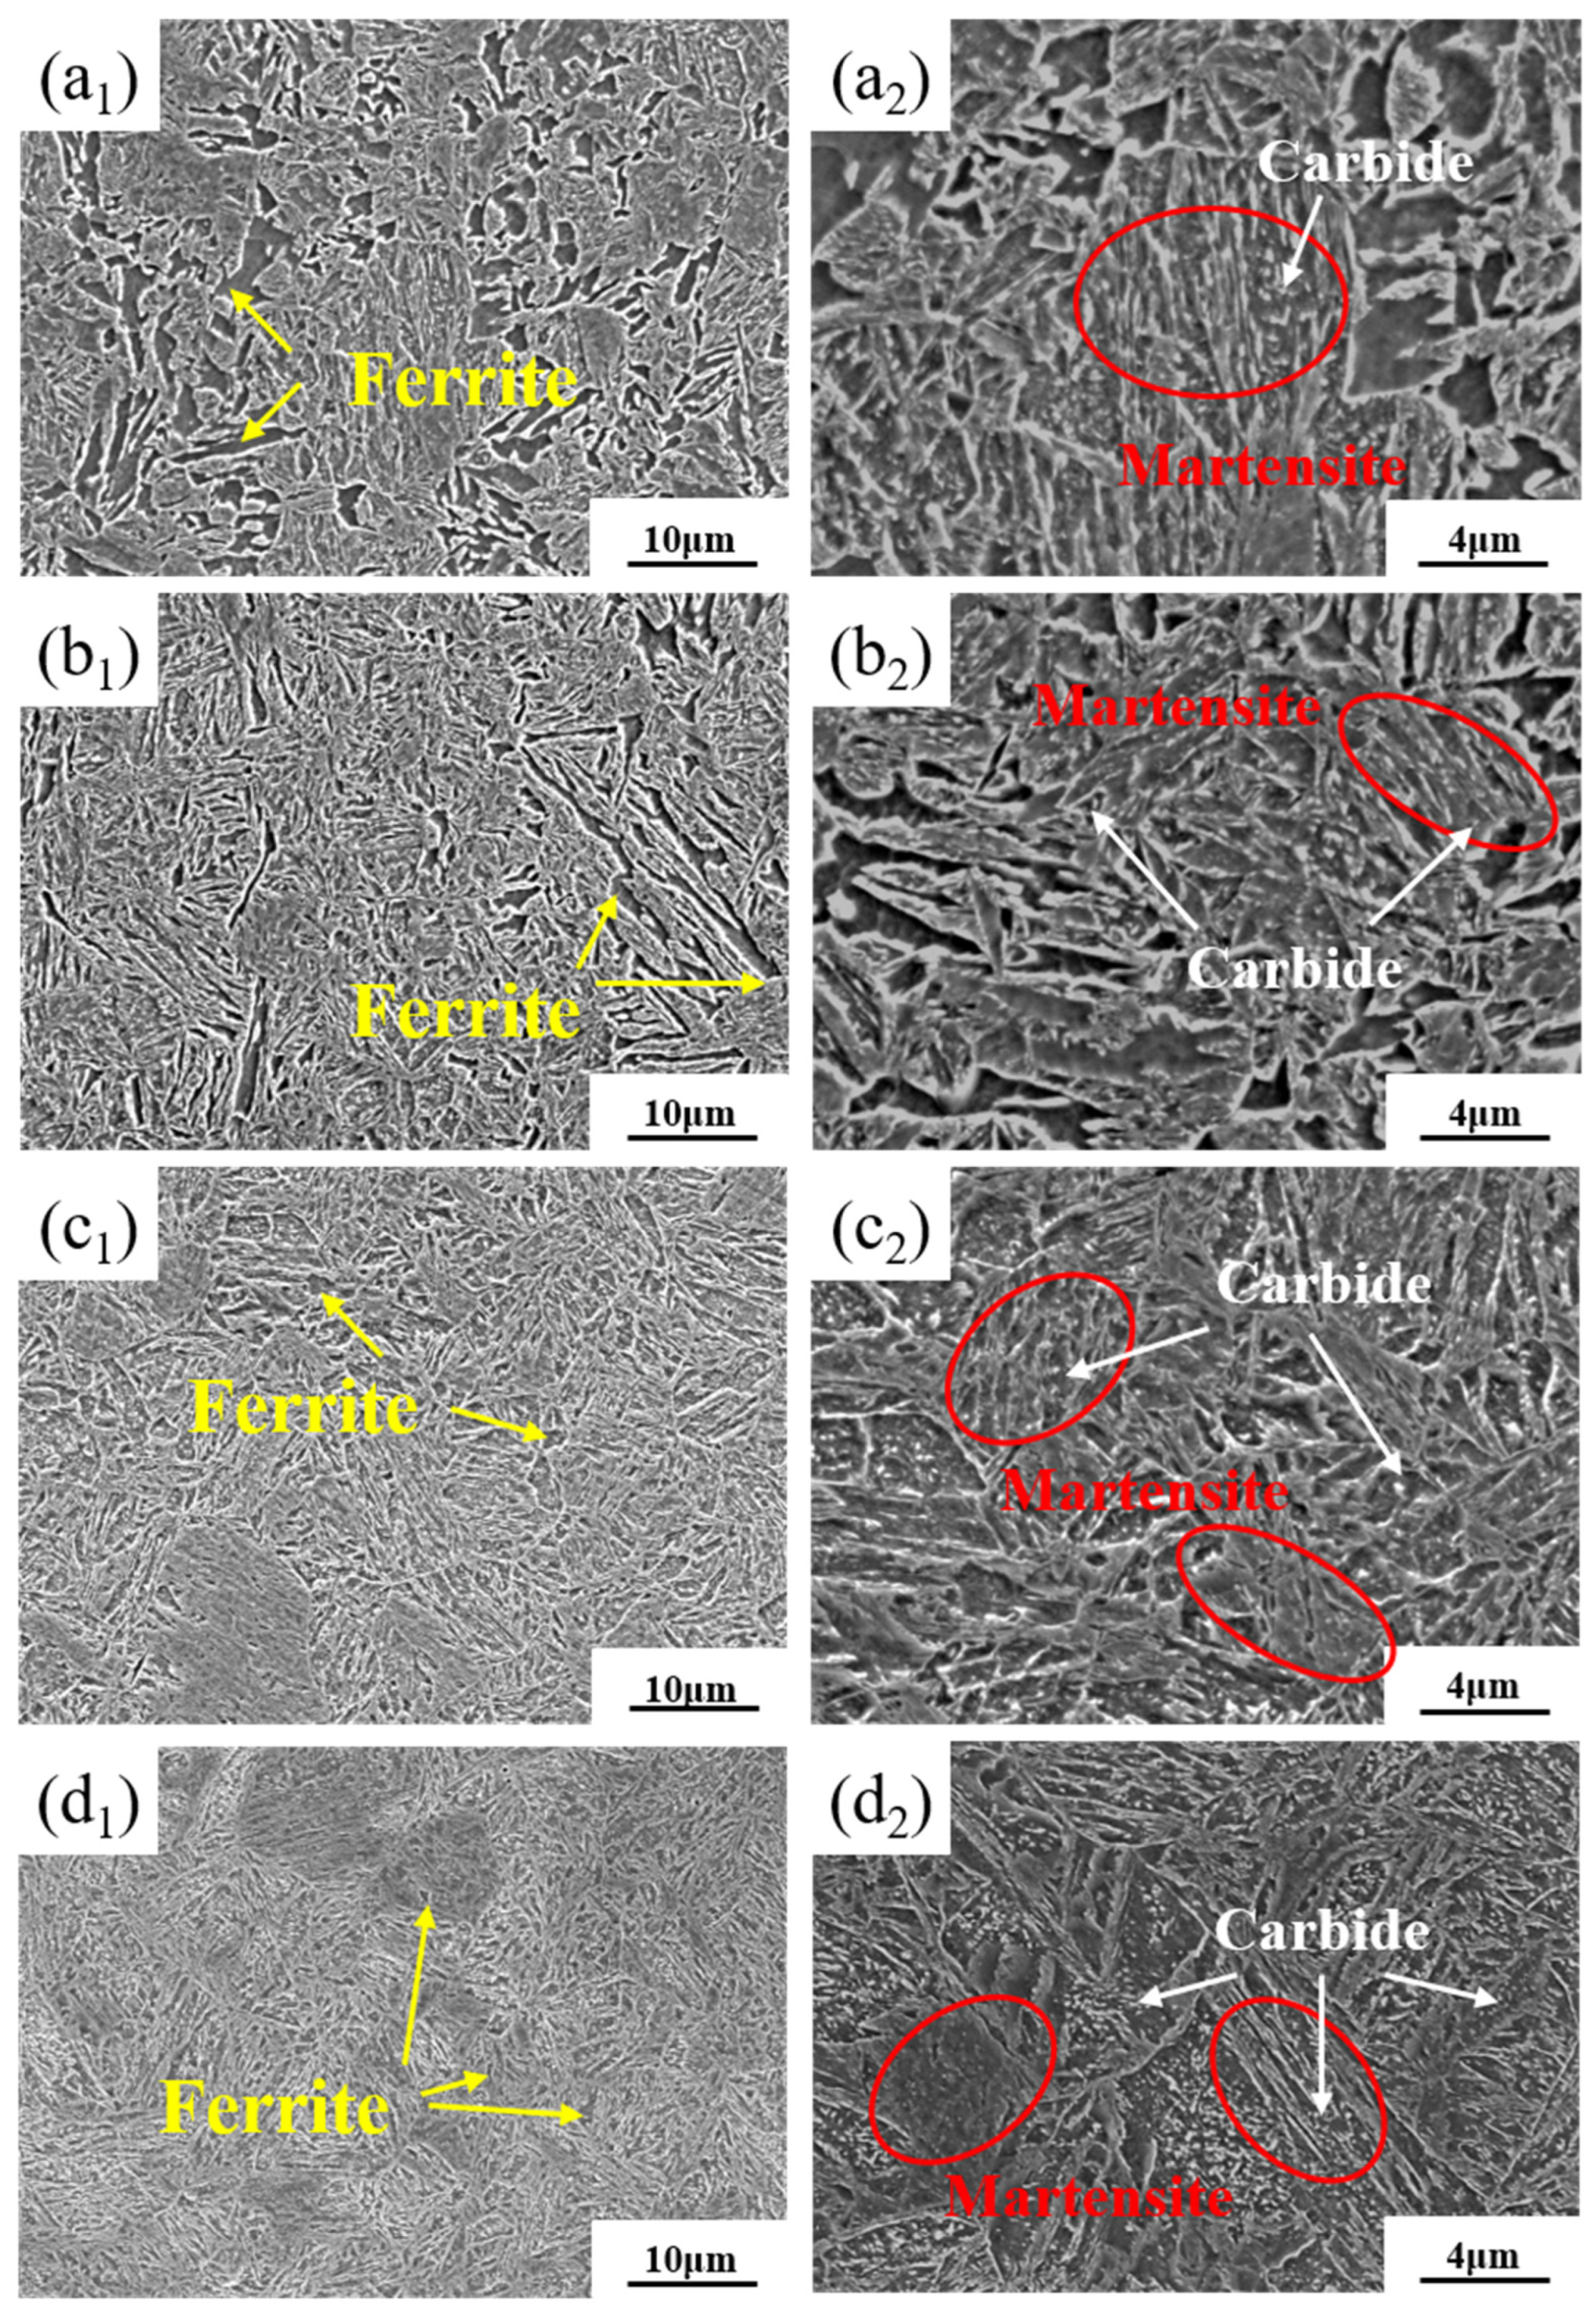
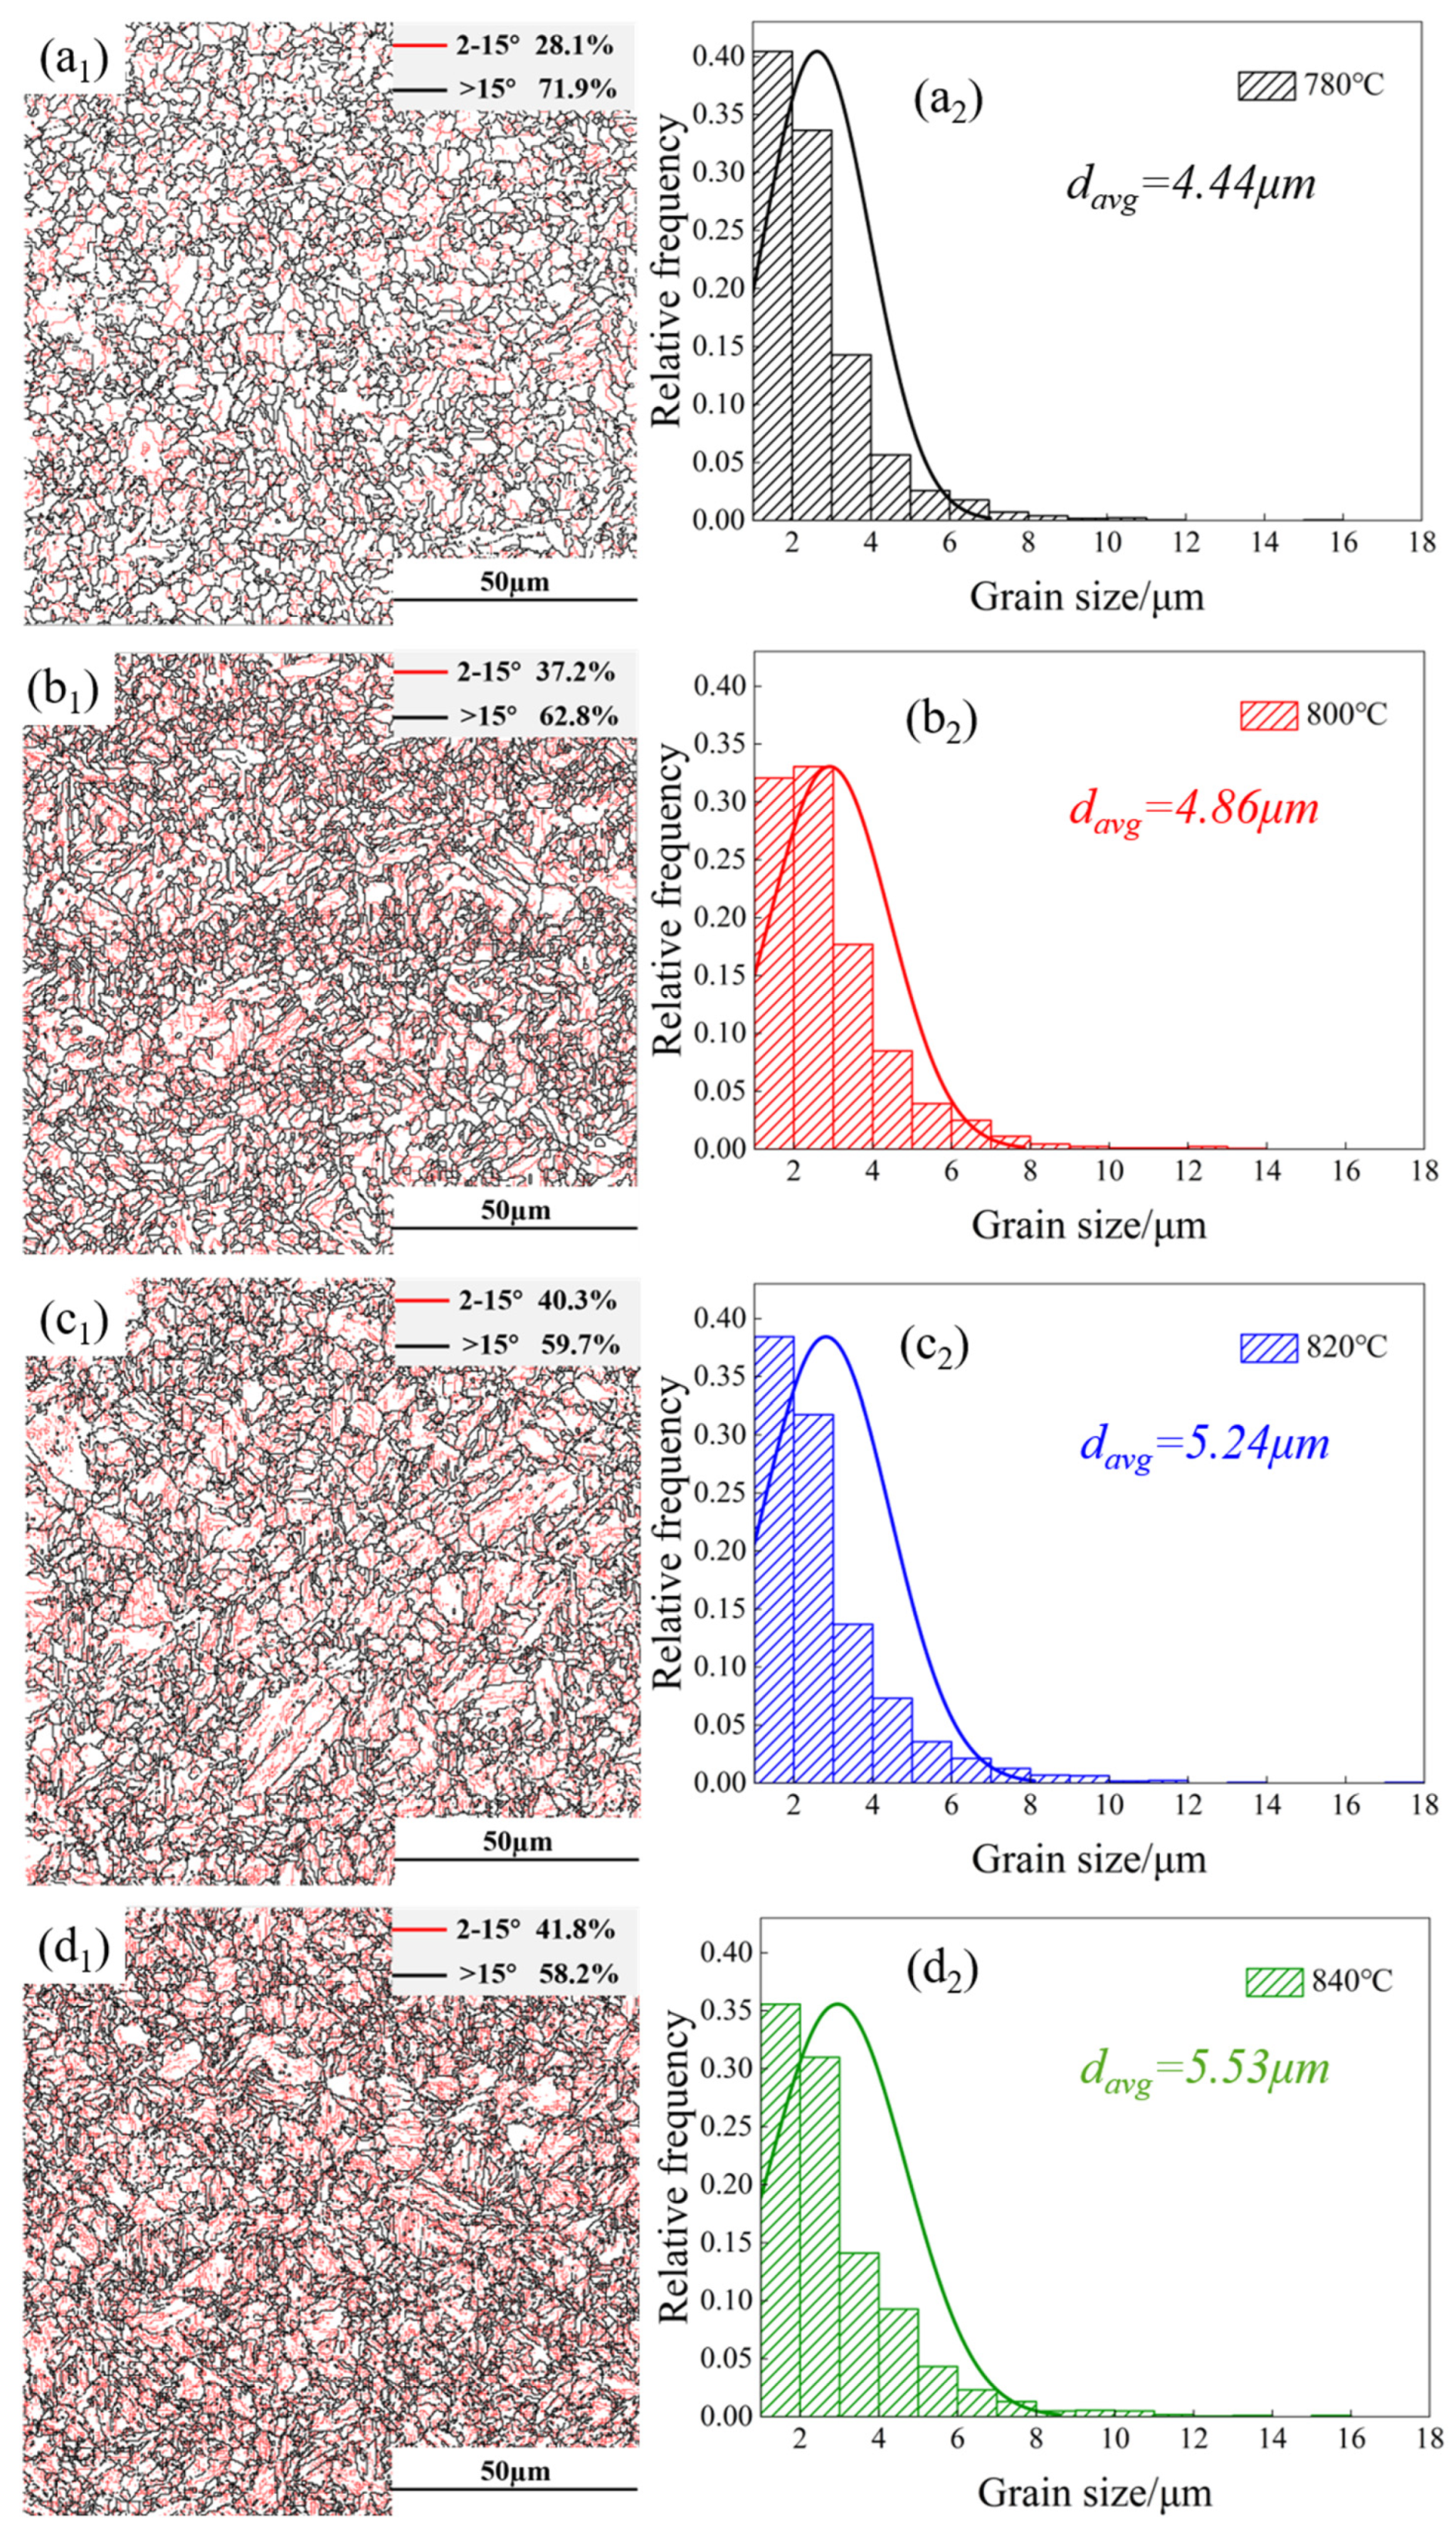
3.2. Microstructural Distribution

SEM micrographs of the experimental steels after treatment at various intercritical annealing temperatures are shown in Figure 5. After annealing in the two-phase zone, the obtained structures were both ferrite–martensite structures, but the volume fraction and distribution of the martensite and ferrite phases were significantly different. The experimental steel was annealed at 780 and 800 °C (Figure 5(a1,a2,b1,b2)) to form fine lath martensite and a small amount of massive martensite, with ferrite distributed among the martensite. With a further increase in the annealing temperature (Figure 5(c1,c2,d1,d2)), only a sporadic ferrite distribution could be seen among the martensite. In addition, the number of massive martensite increased. After tempering at a low temperature, the martensite decomposed slightly, and the saturated carbon that was dissolved in the martensite gradually precipitated in the form of carbides, which could be seen between the martensite laths in the four groups of experimental steels.
The changes in the proportion of martensite and ferrite phases are shown in Figure 6. Phase statistics were obtained with the help of AZtecCrystal, and one area was scanned at one-quarter, one-half, and three-quarters of the sample thickness for each annealed temperature sample to ensure data reliability. When the experimental steel was annealed at 780 and 800 °C, the ferrite contents were 40% and 28%, respectively, and the observed ferrite distribution is shown in Figure 5(a1,b1). When the annealing temperature was further increased, the ferrite content dropped to approximately 10%, and the ferrite distribution was no longer visible (Figure 5(c1,d1)).
The distribution of grain boundaries (GBs) and statistical charts of equivalent grain sizes (EGS) for the four experimental steels are shown in Figure 7 (EGS refers to the overall grain size of the experimental steels rather than the grain size of a single phase). In Figure 7(a1–d1), low-angle GBs (LAGBs, 2° < θ ≤ 15°) are marked with red lines, and high-angle grain boundaries (HAGBs, θ > 15°) are marked with black lines. As the intercritical annealing temperature increased, the proportion of HAGBs decreased from 71.9% to 58.2%, whereas the proportion of LAGBs increased from 28.1% to 41.8%. That was due primarily to the reduction in ferrite distributed among the martensite and the large numbers of substructures and subgrain boundaries within the martensite, which typically existed as LAGBs. For the ferrite–martensite DP steels, the deflection of cracks at HAGBs was more frequent than at LAGBs, which inhibited crack propagation. A greater number of HAGBs helped improve the plasticity and toughness of the experimental steel [40,41].
Figure 7(a2–d2) show the variations in the EGS in the four experimental steels. With the increase in annealing temperature, the EGS increased from 4.44 μm to 5.53 μm, which was not a significant increase. There were several reasons for this: the annealing temperature was in the two-phase region, the alloying element diffusion rate was low, and the grain growth driving force was limited. Fine structures might benefit from lath martensite obtained by complete quenching before annealing when ferrite and austenite nucleate heavily at the interface of those laths. Additionally, it has been reported [42] that rare earth elements in steel tend to segregate at GBs, reduce the energy of austenite GBs, and reduce the driving force of grain growth. The refinement of the microstructure not only benefits the strength but could also effectively prevent the propagation of dissociation cracks, deflect the direction of crack propagation, and improve the plasticity and toughness of the experimental steel [43].
The carbon content significantly affected the strength and hardness of the phases in the microstructure. As it is shown in Figure 8, through EPMA line scan wavelength-dispersive spectroscopies (WDSs), it could be seen that the carbon distribution in the ferrite was more uniform, whereas a distinct carbon concentration gradient appeared in the martensite. The carbon concentration near the two-phase boundary was significantly higher than that in the centre of the martensite, and there was a considerable difference in the carbon concentration between the two phases.
The ferrite had a body-centred cubic structure, where the atomic gaps were relatively small, limiting the solubility of the carbon. In contrast, the original austenite had a face-centred cubic structure with higher carbon solubility. With the increase in the intercritical quenching temperature, the carbon in the ferrite gradually became saturated, and more carbon would have been dissolved in the original austenite, which directly led to a greater carbon concentration gradient between the ferrite and martensite after quenching.
The increase in annealing temperature led to an increasing gap in equilibrium carbon solubility between the ferrite and primary austenite so that more carbon diffused from ferrite to austenite. That led to the intensification of the carbon concentration near the two-phase interface of the primary austenite, whereas the relative carbon deficiency far away from the two-phase interface formed a more pronounced carbon concentration gradient. The original austenite underwent a nonequilibrium transformation to martensite during the quenching process. Martensite is a metastable phase, and due to the rapid cooling rate, the diffusion of carbon was greatly limited, which further aggravated the gradient distribution of carbon. Also, more carbides were precipitated in the tempering process (Figure 5), which increased the spatial change in the carbon concentration and also had a certain effect on the carbon concentration gradient. The larger carbon concentration difference between the two phases and the greater carbon concentration gradient in the martensite phase reduced the plasticity of the experimental steel.
Figure 9 shows kernel average misorientation (KAM) maps and geometrically necessary dislocation (GND) statistical diagrams of the experimental steel. In the KAM maps, blue and green represent minor orientation deviations, and yellow and red indicate large deviations. As the intercritical quenching temperature increased, the experimental steel’s local orientation differences and stress concentration gradually increased (Figure 9(a1–d1)). This was related to the increase in the martensite content, the high hardness of the martensite phase, poor plasticity, serious dislocation accumulation, and a lower ferrite content. This also meant that more ferrite boundaries were surrounded by martensite, and the ferrite had to adapt to martensitic deformation and a higher stress distribution. At higher annealing temperatures, the carbon solubility in the martensite was greater (Figure 8), and the hardness gap between the martensitic and ferrite phases was further increased, which also led to a stronger stress concentration on the interface of the two phases.
The GND is quantified by characterizing local orientation differences and strain gradients, and its density can be calculated using Equation (1), which is highly correlated with KAM values [44,45].
ρ G N D = 2 θ K A M u b ,
where ρ G N D is the GND density, θ K A M is the average misorientation at the point, u is the unit length which is equal to twice the step size used in EBSD acquisition (400 nm), and b is the Burgers vector represented as a/2 [111].
The variation trends of the GND statistical charts (Figure 9(a2–d2)) were consistent with those of the KAM charts. The decrease in ferrite and the increase in martensite were the direct causes of the increase in GND density. The volume expansion caused by the transformation of prior austenite to martensite induced plastic deformation and generated unpinned GNDs, which maintained the continuity of the lattice. Those dislocations of heterogeneous distribution were partially mobile, helping to improve the strain-hardening ability of the experimental steel. A high-density GND could form more dislocation entanglement and a dislocation wall through continuous slip and accumulation, which would greatly increase the resistance between dislocations and impeded the stress transfer between soft-phase ferrite and hard-phase martensite. That would increase the yield strength of the test steel on a macro level (Figure 4a). However, too high a GND density would also lead to a higher stress concentration inside the test steel, which might initiate cracks and accelerate fracture occurrence.
Figure 10 shows TEM micrographs of the experimental steel. The TEM microstructure of the experimental steels annealed at 780 and 820 °C consisted mainly of ferrite and martensite, with ferrite not being abundant in the field of view, consistent with the statistical results in Figure 6. In some regions, large areas of martensite laths are visible (Figure 10(a2,b2)). There was a high density of dislocations in the martensite due to the austenite transforming into martensite through shear, which underwent a large lattice distortion, and a higher carbon concentration in martensite than in ferrite. The black laths with more dislocation tangles in the image are typically considered martensite, whereas the relatively dislocation-free, white-coloured fibrous or blocky structures are usually considered ferrite.
More rod-like carbides were distributed in the lath martensite matrix. Those carbides were usually identified as cementite, which were related mainly to the precipitation of saturated carbon in martensite. In addition, there were nano-sized carbides, and an energy-dispersive spectroscopy (EDS) analysis showed that the nano-precipitated phase was mainly niobium-containing carbide, which can play a role in strengthening precipitation. Also, Mo in steel will interact with it, thus hindering the coarsening rate of niobium-containing carbide.

3.3. Fracture Morphology of the Experimental Steel

Figure 11(a1–d1) show the macroscopic morphology of tensile fractures in the experimental steels, all of which show typical ductile fracture characteristics. The three elements of fracture characteristics were a fibre region, a radiation region, and a shear lip. The crack propagation rate in the fibre region was very slow, and after reaching its critical size, the crack expanded rapidly to form a radiation region. In the final stage of fracture, a shear lip was formed. In the macroscopic morphology of the fracture, the fibre zone of the sample with a lower annealing temperature was uneven and rougher. With the increase in the annealing temperature, the fibre zone gradually became smooth, and the area of the fibre zone also shrank, which corresponded to the gradual decrease in the plasticizability of the experimental steel.
Figure 11(a2–d2) show the microfracture morphologies of the tensile fractures. Many dimples are shown in the fractures of the four groups of experimental steels. The dimples in the specimens that had a lower annealing temperature were smaller and more uniform, and a few large dimples were distributed in them. With the increase in the annealing temperature, elongated dimples appeared in the fracture, weakening the uniformity. The large difference in mechanical properties between the martensitic and ferrite phases resulted in uneven or concentrated stress distribution. Those elongated dimples are usually caused by the inconsistency between the expansion direction of some cracks and the direction of tensile stress. Cleavage fracture features were also seen in samples annealed at 840 °C (Figure 11(d2)).
There are two important pore formation mechanisms in two-phase steel, including unbonding at the ferrite–martensite interface, which was caused by the plastic incompatibility between ferrite and martensite, and the cracking of martensite, which was caused by residual stress and dislocation accumulation in the martensite. For DP steel, the unsticking of the two-phase interface often meant that during the process of plastic deformation, the mechanical behaviour difference between the two phases was large, and the stress concentration at the two-phase interface was intense; that had a greater negative effect on the mechanical properties of DP steel than martensitic cracking [46,47,48,49]. As shown in Figure 11(a2–d2), no obvious disadhesion phenomenon was observed at the two-phase interface in the fracture morphology of the experimental steel, and only slight cracks were seen, which also reflected its good plasticity from the side.
In the high-magnification tensile fracture morphology of the samples annealed at 820 and 840 °C, obvious tearing ridges could be seen (Figure 12). For samples with high plasticity, during the process of micropore aggregation, growth, and connection, the plastic dissipation of the crack tip was adequate, the crack propagation path was smoother and more uniform, and the microscopic deformation around the dimples was more coordinated, so tear edges were not readily formed. For the specimens with low plasticity, the plastic deformation of the crack tip was limited, the energy could not be uniformly absorbed during crack propagation, and the local crack propagation was rapid in the process of micropore growth and connection. Tear edges formed around the dimples, showing an obvious convex structure, which also indicated that the plasticity of the experimental steel decreased gradually due to the increase in annealing temperature.

4. Discussion

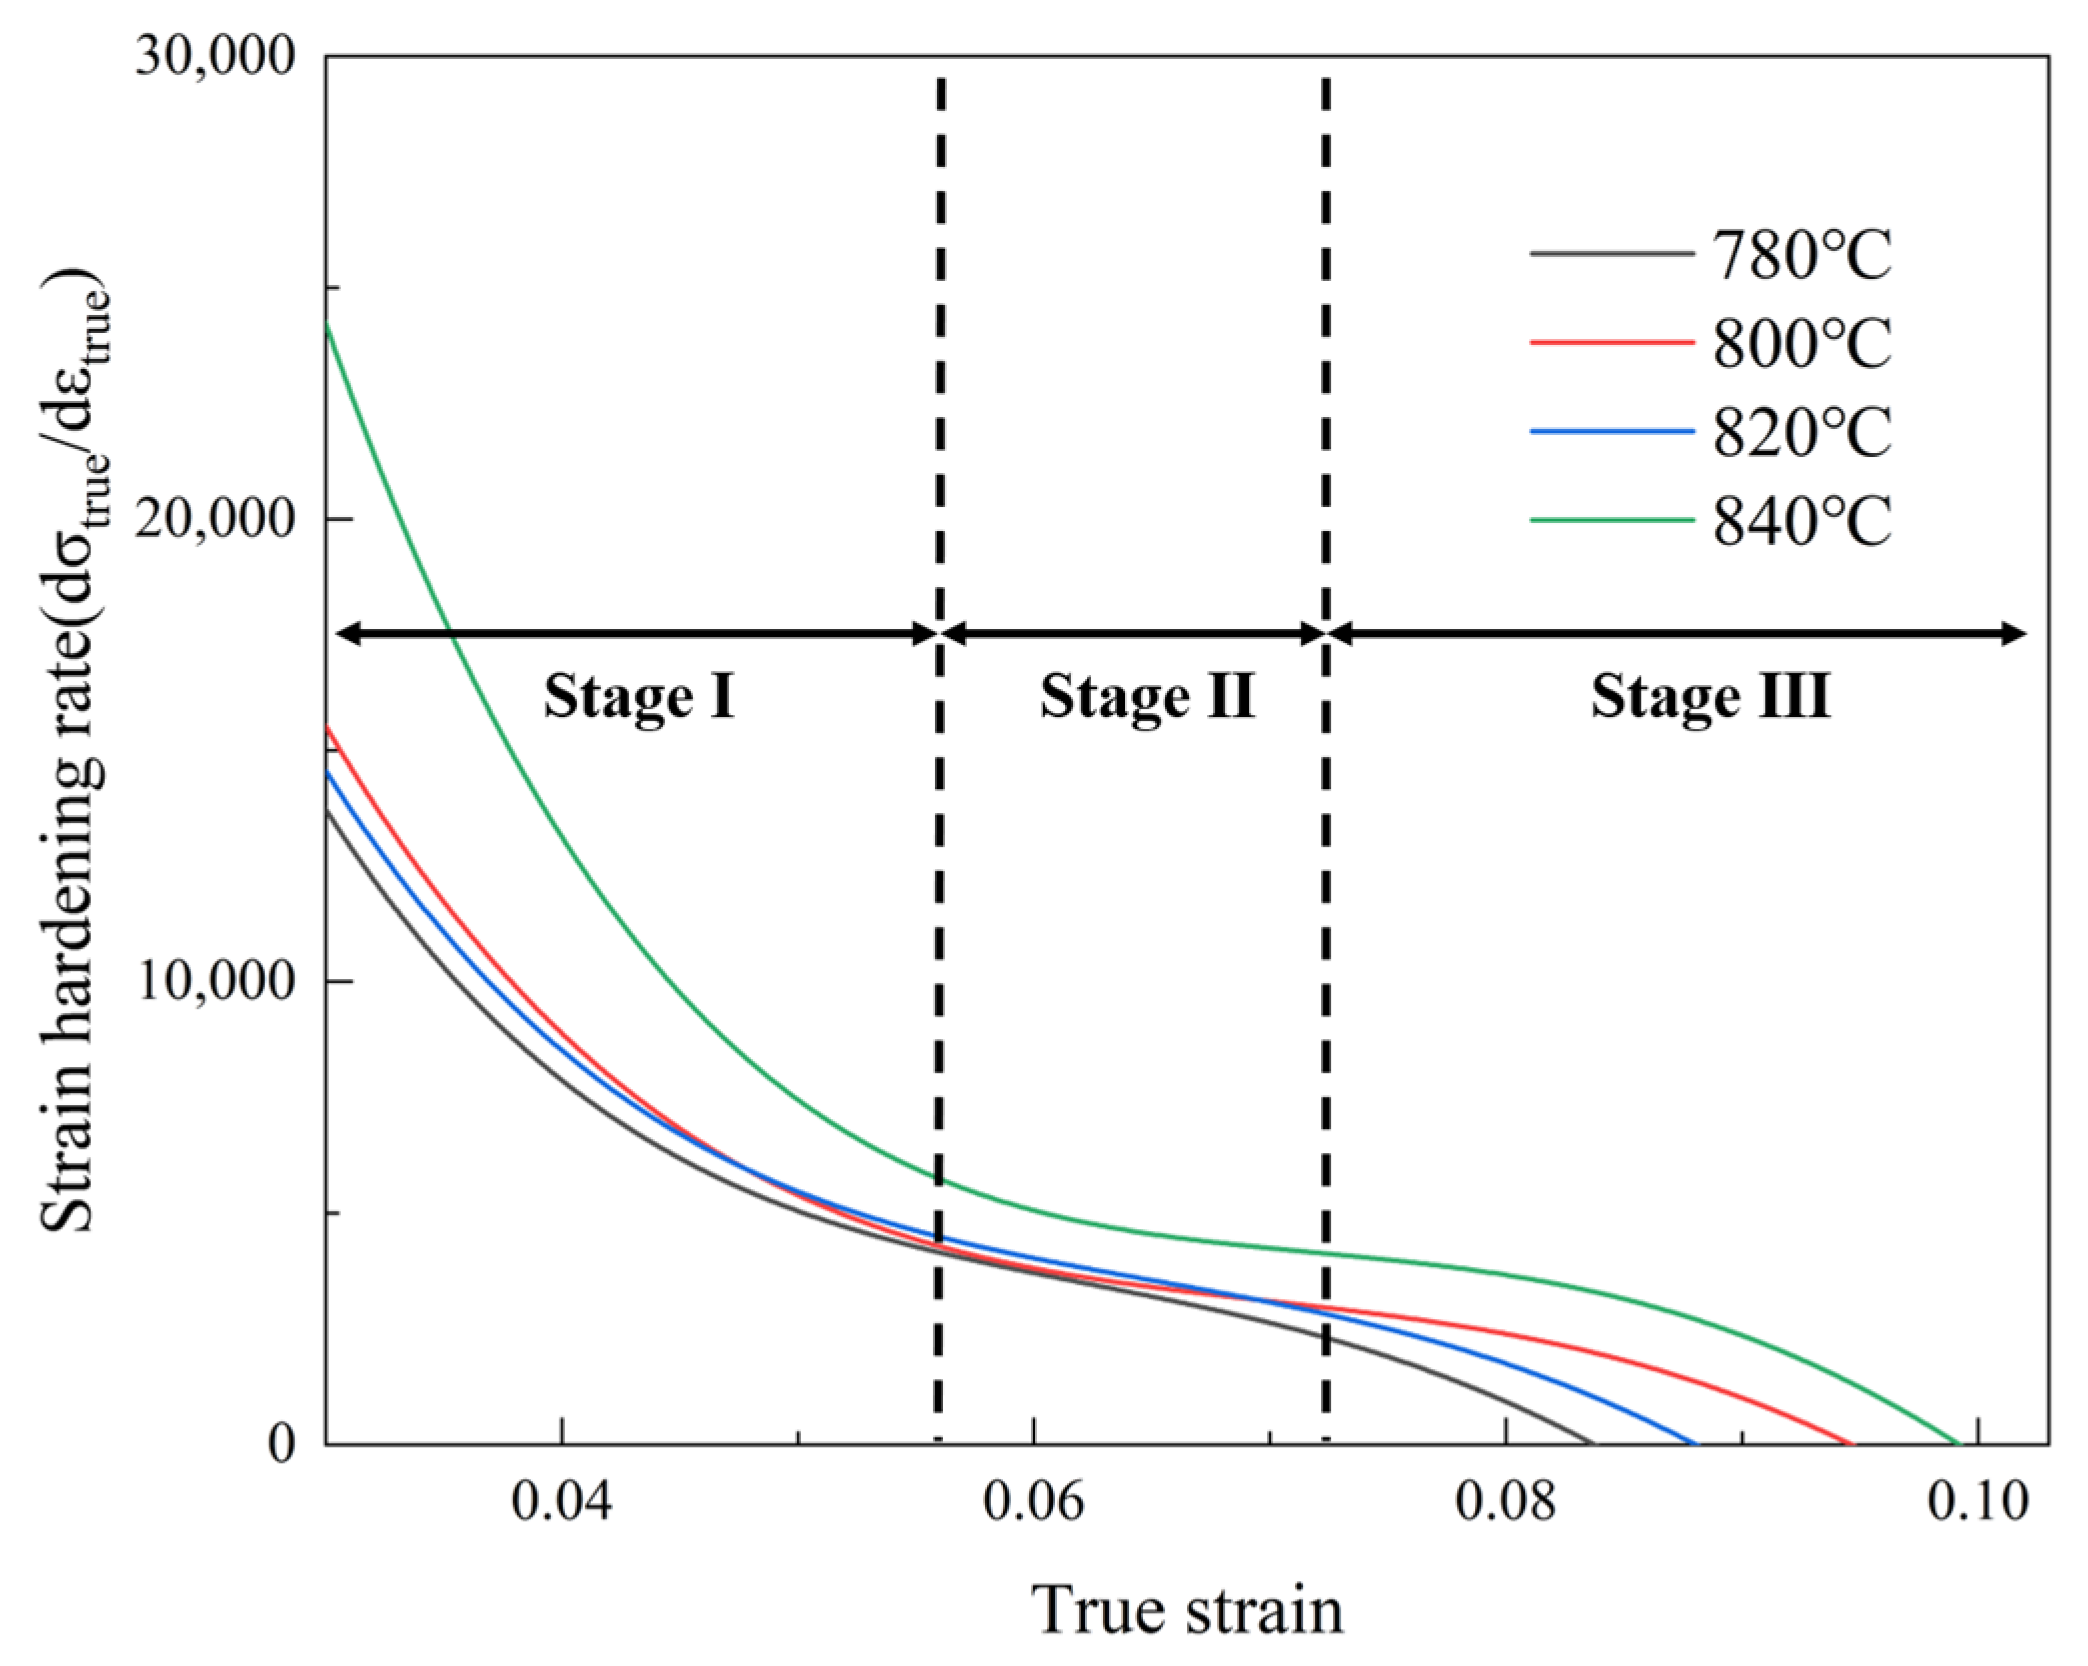
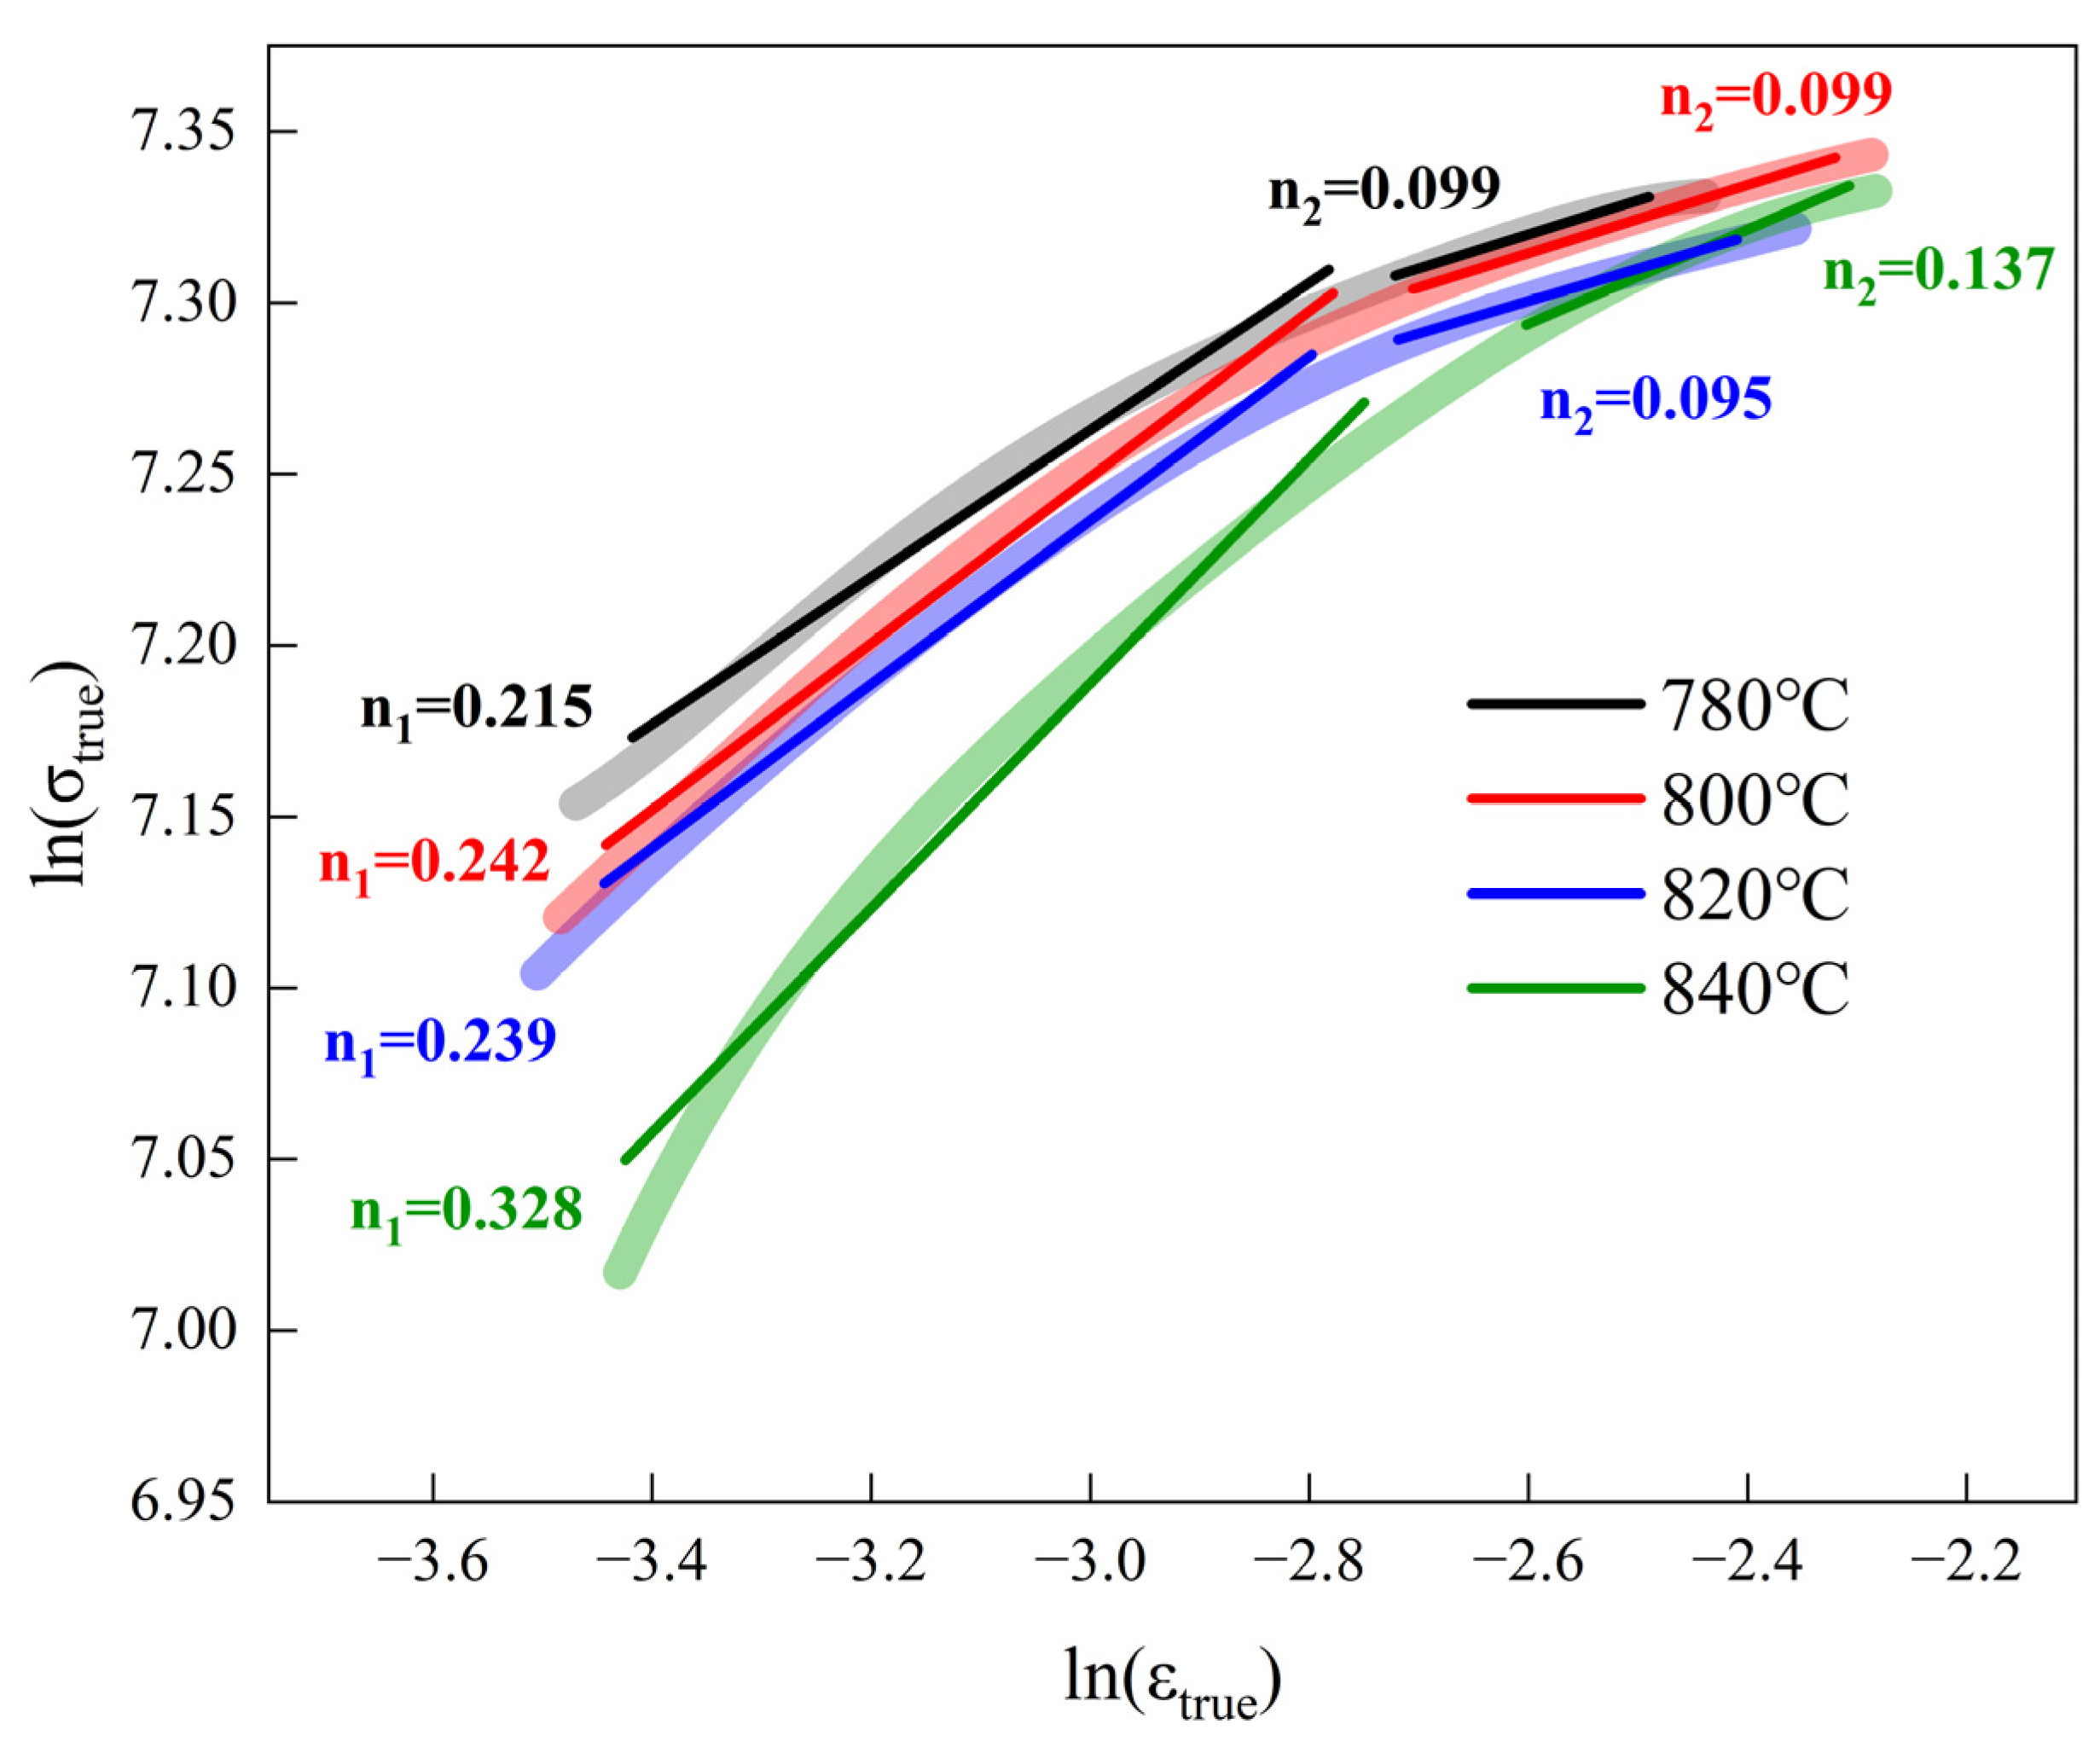
4.1. The Strain-Hardening Ability of the Experimental Steel

The engineering stress and strain were converted into real stress and strain using Equations (2) and (3).
ε t r u e = ln 1 + ε e n g ,
where ε t r u e is the true strain, and ε e n g is the engineering strain.
σ t r u e = σ e n g × 1 + ε e n g ,
where σ t r u e is the actual stress, and ε e n g is the engineering stress.
After the elastic stage was removed, the true stress–strain curve was derived from the remaining part of the engineering stress–strain curve, and the strain-hardening curve of the experimental steel was further obtained, as shown in Figure 13.
The strain-hardening process was divided into stages I, II, and III. The initial hardening stage, stage I, was mainly the soft (ferritic) phase in the experimental steel deformation, and the strain-hardening rate was very fast. After the stable hardening stage, stage II, started, the strain-hardening rate tended to stabilize, and the hard (martensitic) phase in the experimental steel also began to participate in deformation. As the softening stage, stage III, started, the strain-hardening rate decreased, and the experimental steel might have experienced local cracks or microscopic damage. The plastic deformation ability of the experimental steel was limited. With the increase in the annealing temperature, the ferrite phase gradually decreased, and the martensitic phase with high fault density increased. The samples annealed at 820 and 840 °C went through stage I faster and entered stage II first. Both had stronger strain-hardening ability and a faster strain-hardening rate. For the DP steels, the initial work-hardening rate was significantly increased due to the presence of unpinned dislocations. Those curves showed that the uniform extensibility of the DP steel has advantages.
The strain-hardening index n reflected the ability of the experimental steel to resist uniform plastic deformation; a higher n meant that the experimental steel had greater strength and lower total elongation. The n index was used to study the difference in the strain-hardening behaviour of the four groups of experimental steels. For ferritic–martensitic composite steels, the Hollomon equation can be used to reflect the relation between stress and strain, as shown in Equation (4). Equation (5) shows the logarithmic form of Equation (4) with slope n.
σ t r u e = K ε t r u e n
l n σ t r u e = l n K + n l n ε t r u e ,
where σ t r u e is the actual stress, ε t r u e is the actual strain, K is the hardening coefficient, and n is the strain-hardening index.
As shown in Figure 14, according to Equation (5), the l n σ t r u e l n ε t r u e curve can be obtained. The slope derived from the l n σ t r u e l n ε t r u e curve was not a fixed value. It could be roughly divided into two stages. The first stage of the n value was higher, but the second-stage n value was reduced. That was because the plastic deformation occurred first in the soft ferrite phase, and dislocations accumulate near the phase boundary to achieve collaborative deformation. With the further increase in deformation, deformation accumulation transferred to the harder martensitic phase.
Some studies [50] have pointed out that the strain-hardening rate is influenced by both the martensite content and the martensite size, which can be expressed explicitly by
d σ t r u e d ε t r u e V M S M ,
where V M is the martensite content, and S M is the martensite size.
As shown in Figure 7, the equivalent grain size (EGS) changed a little, and the overall structure was relatively small. Therefore, the martensite content played a leading role in the work-hardening rate. With the increase in the martensite content, the work-hardening rate of DP steel was enhanced, and the strain-hardening index also increased. Note that when the annealing temperature was low, the work-hardening rate of the experimental steel was adequate, and the strain-hardening ability was still at an excellent level (the n values in stage I were above 0.2), which was related to the microstructure distribution of the experimental steel and the mechanical behaviour of ferrite. The positive role of rare earth elements Ce and La in the steel also had a certain effect.

4.2. Effects of Rare Earth Elements

The inclusion morphologies in the experimental steels are shown in Figure 15a,b. The inclusions in the experimental steel were spherical or ellipsoidal. An energy-dispersive spectroscopy analysis showed that the cores of the complex inclusions were composed of rare earth aluminide, and the outer layers were rare earth oxide–sulphide. Manganese sulphide distribution could also be seen in the outermost layer of some complex inclusions. No single, long, grey MnS distributed along the rolling direction was seen, and no single black Al2O3 distribution was observed in the matrix.
The change in the standard Gibbs free energy for the generation of MnS and Al2O3 is shown in Equations (7) and (8) [51,52], and the change in the standard Gibbs free energy for the generation of rare earth aluminoxide is shown in Equation (9) [53,54]. It can be seen that at the same temperature, rare earth aluminoxide had a greater reaction driving force, which also explained the EDS analysis. Strong signals of Al, O, and rare earth elements were detected in the cores of complex inclusions, and Al2O3 was successfully modified by rare earth elements.
S + M n = M n S s     G 0 = 172,676.1 + 56.07 T
2 A l + 3 O = A l 2 O 3 s     G 0 = 1,203,623 + 386.7 T
R e + A l + 3 O = R e A l O 3 s     G 0 = 1,366,460 + 364 T
The standard Gibbs free energy change for the formation of rare earth oxide–sulphide is shown in Equation (10) [55,56]. The driving force of the reaction ranged from rare earth oxide aluminum oxide and MnS, so rare earth oxide–sulphide was attached to the rare earth oxide aluminum oxide in the cores, whereas the incomplete elements S and Mn formed MnS and were distributed in the outer parts of the complex inclusions.
R e + O + 0.5 S = R e 2 O 2 S s     G 0 = 675,700 + 165.5 T
When rare earth aluminide and rare earth oxide–sulphide are formed in steel, their surface energy tends to be minimized, and these compounds have better thermodynamic stability and a more uniform structure. These factors jointly promote the inclusions’ evolution into a spherical shape [24]. The stress concentration caused by spherical inclusions was lower than that of irregular inclusions, which was conducive to maintaining uniform deformation of the experimental steel. The strain-hardening ability of the test steel was improved, which was beneficial to its overall mechanical properties, so the combination of strength and plasticity was easily achieved [57,58].
Figure 16 shows the segregation of rare earth elements at the GBs. To ensure data reliability, the content of rare earth elements was measured at seven points along the GBs of the samples at 780 and 820 °C, and the average value was taken. It can be seen that the concentration of rare earth elements at the GBs was much higher than that in the alloy composition of the experimental steel, and the rare earth elements showed a strong GB segregation effect. The polarization of rare earth elements was more intense when annealing at lower temperatures, which was related to the relatively poor diffusion ability of rare earth elements at those temperatures. Segregating rare earth elements at the GBs has many advantages. Rare earth elements can purify impurity elements and reduce the segregation of harmful elements at GBs. Rare earth elements can also affect the growth kinetics of grains by changing the grain boundary energy, thus refining the microstructure (Figure 7(a2–d2)), and fine-grain strengthening can also improve the strength and toughness of the material. In addition, the strong napping effect of rare earth elements at the GBs could have effectively hindered the movement of GND, causing the dislocations to accumulate at the GBs, improving the strain-hardening ability of the experimental steel.

4.3. Microstructure Analysis

The microstructure of the experimental steel after annealing in the two-phase zone was composed of ferrite and martensite. In the high-magnification TEM images (Figure 17), the structure distribution of ferrite and martensite was relatively uniform, the two were arranged alternately, and only a small amount of concentrated distribution was visible. That alternating distribution reflected the advantages of adding a complete quenching link before annealing in the two-phase zone. That could have significantly improved the tissue distribution and refined the structure because the martensitic laths obtained by complete quenching could be used as an effective nucleation site. Ferrite and austenite nucleated and grew between those fine laths, and finally, a fine, uniform structure was obtained. It has been reported [17] that the higher the annealing temperature, the stronger the role of martensitic lath as a ferritic nuclear site. Relative to the sample annealed at 780 °C, the sizes of fibrous ferrite and martensite in the sample annealed at 820 °C were closer, and the two-phase distribution was more uniform.
The experimental steel’s fine and uniform microstructure distribution improved its strength and plasticity. When plastic deformation occurred, the stress was evenly distributed in the martensitic and ferritic phases, and the two phases coordinated deformation, which prevented excessive stress concentration at the interface of the two phases. The complex interface between the two phases could also promote the generation and accumulation of dislocations, which also hindered the expansion of cracks and avoided premature local hardening, ensuring that the work-hardening capacity remained stable over a wide deformation range.
Figure 18 shows high-magnification images of ferrite in the experimental steel after annealing at 780 and 820 °C. It was evident that after the complete quenching treatment, then annealing and tempering, the microstructure was significantly refined, and the ferrite grain size was approximately 700 nm. The fine-grain strengthening effect was pronounced, and the high dislocation density within the fine ferrite grains further increased the strain-hardening rate of the experimental steel [59]. After critical quenching in the two-phase region and tempering, the phase transformation from austenite to martensite led to a large volume change, which induced the plastic deformation of adjacent ferrite grains, generating many dislocations. Obvious dislocation entanglement could be seen in the ferritic grains, and obvious dislocation aggregation could also be seen at the GBs. Other studies have pointed out [60] that fine ferrite is more able to absorb more dislocation through the shear and extensive deformation caused by martensitic transformation. These martensite-induced dislocation interactions can increase the ferrite phase’s strength and produce a higher work-hardening rate in the initial stage of plastic deformation [61]. The effect of martensite-induced dislocation is expected to be further enhanced [36]. The dislocation distribution in Figure 18 shows a clear gradient, and the dislocation density in regions more tightly surrounded by martensite was higher than in other areas because a lower ferrite content and smaller ferrite grain sizes led to an increase in the portion of individual ferrite grains undergoing local plastic deformation. Reducing the average dislocation spacing is conducive to improving the hardness of ferrite [62,63]. To a certain extent, this could make up for the two-phase hardness gap caused by the difference in the distribution of carbon concentration between the two phases, thus reducing the degree of separation at the interface of the two phases. This is conducive to the distribution and transfer of stress in the plastic deformation process, improving the coordinated deformation ability of the two phases and delaying the formation of pores and failure in the tensile test. Also, the tempering treatment after annealing in the two-phase region could further reduce the difference in mechanical properties between the two phases. The dislocation density in the martensite was much higher than that in the ferrite, and the recovery and rearrangement of the dislocation during tempering led to a greater reduction in strength and hardness. The carbon in the martensite was intensely saturated, and many carbides (such as cementite) were precipitated in the process of tempering (Figure 5 and Figure 10). This led to a reduction in lattice distortion, resulting in a significant decrease in both strength and hardness. Finally, a large amount of residual stress introduced by the martensitic phase transition was also released during the tempering process, which also caused its strength and hardness to decrease.

5. Conclusions

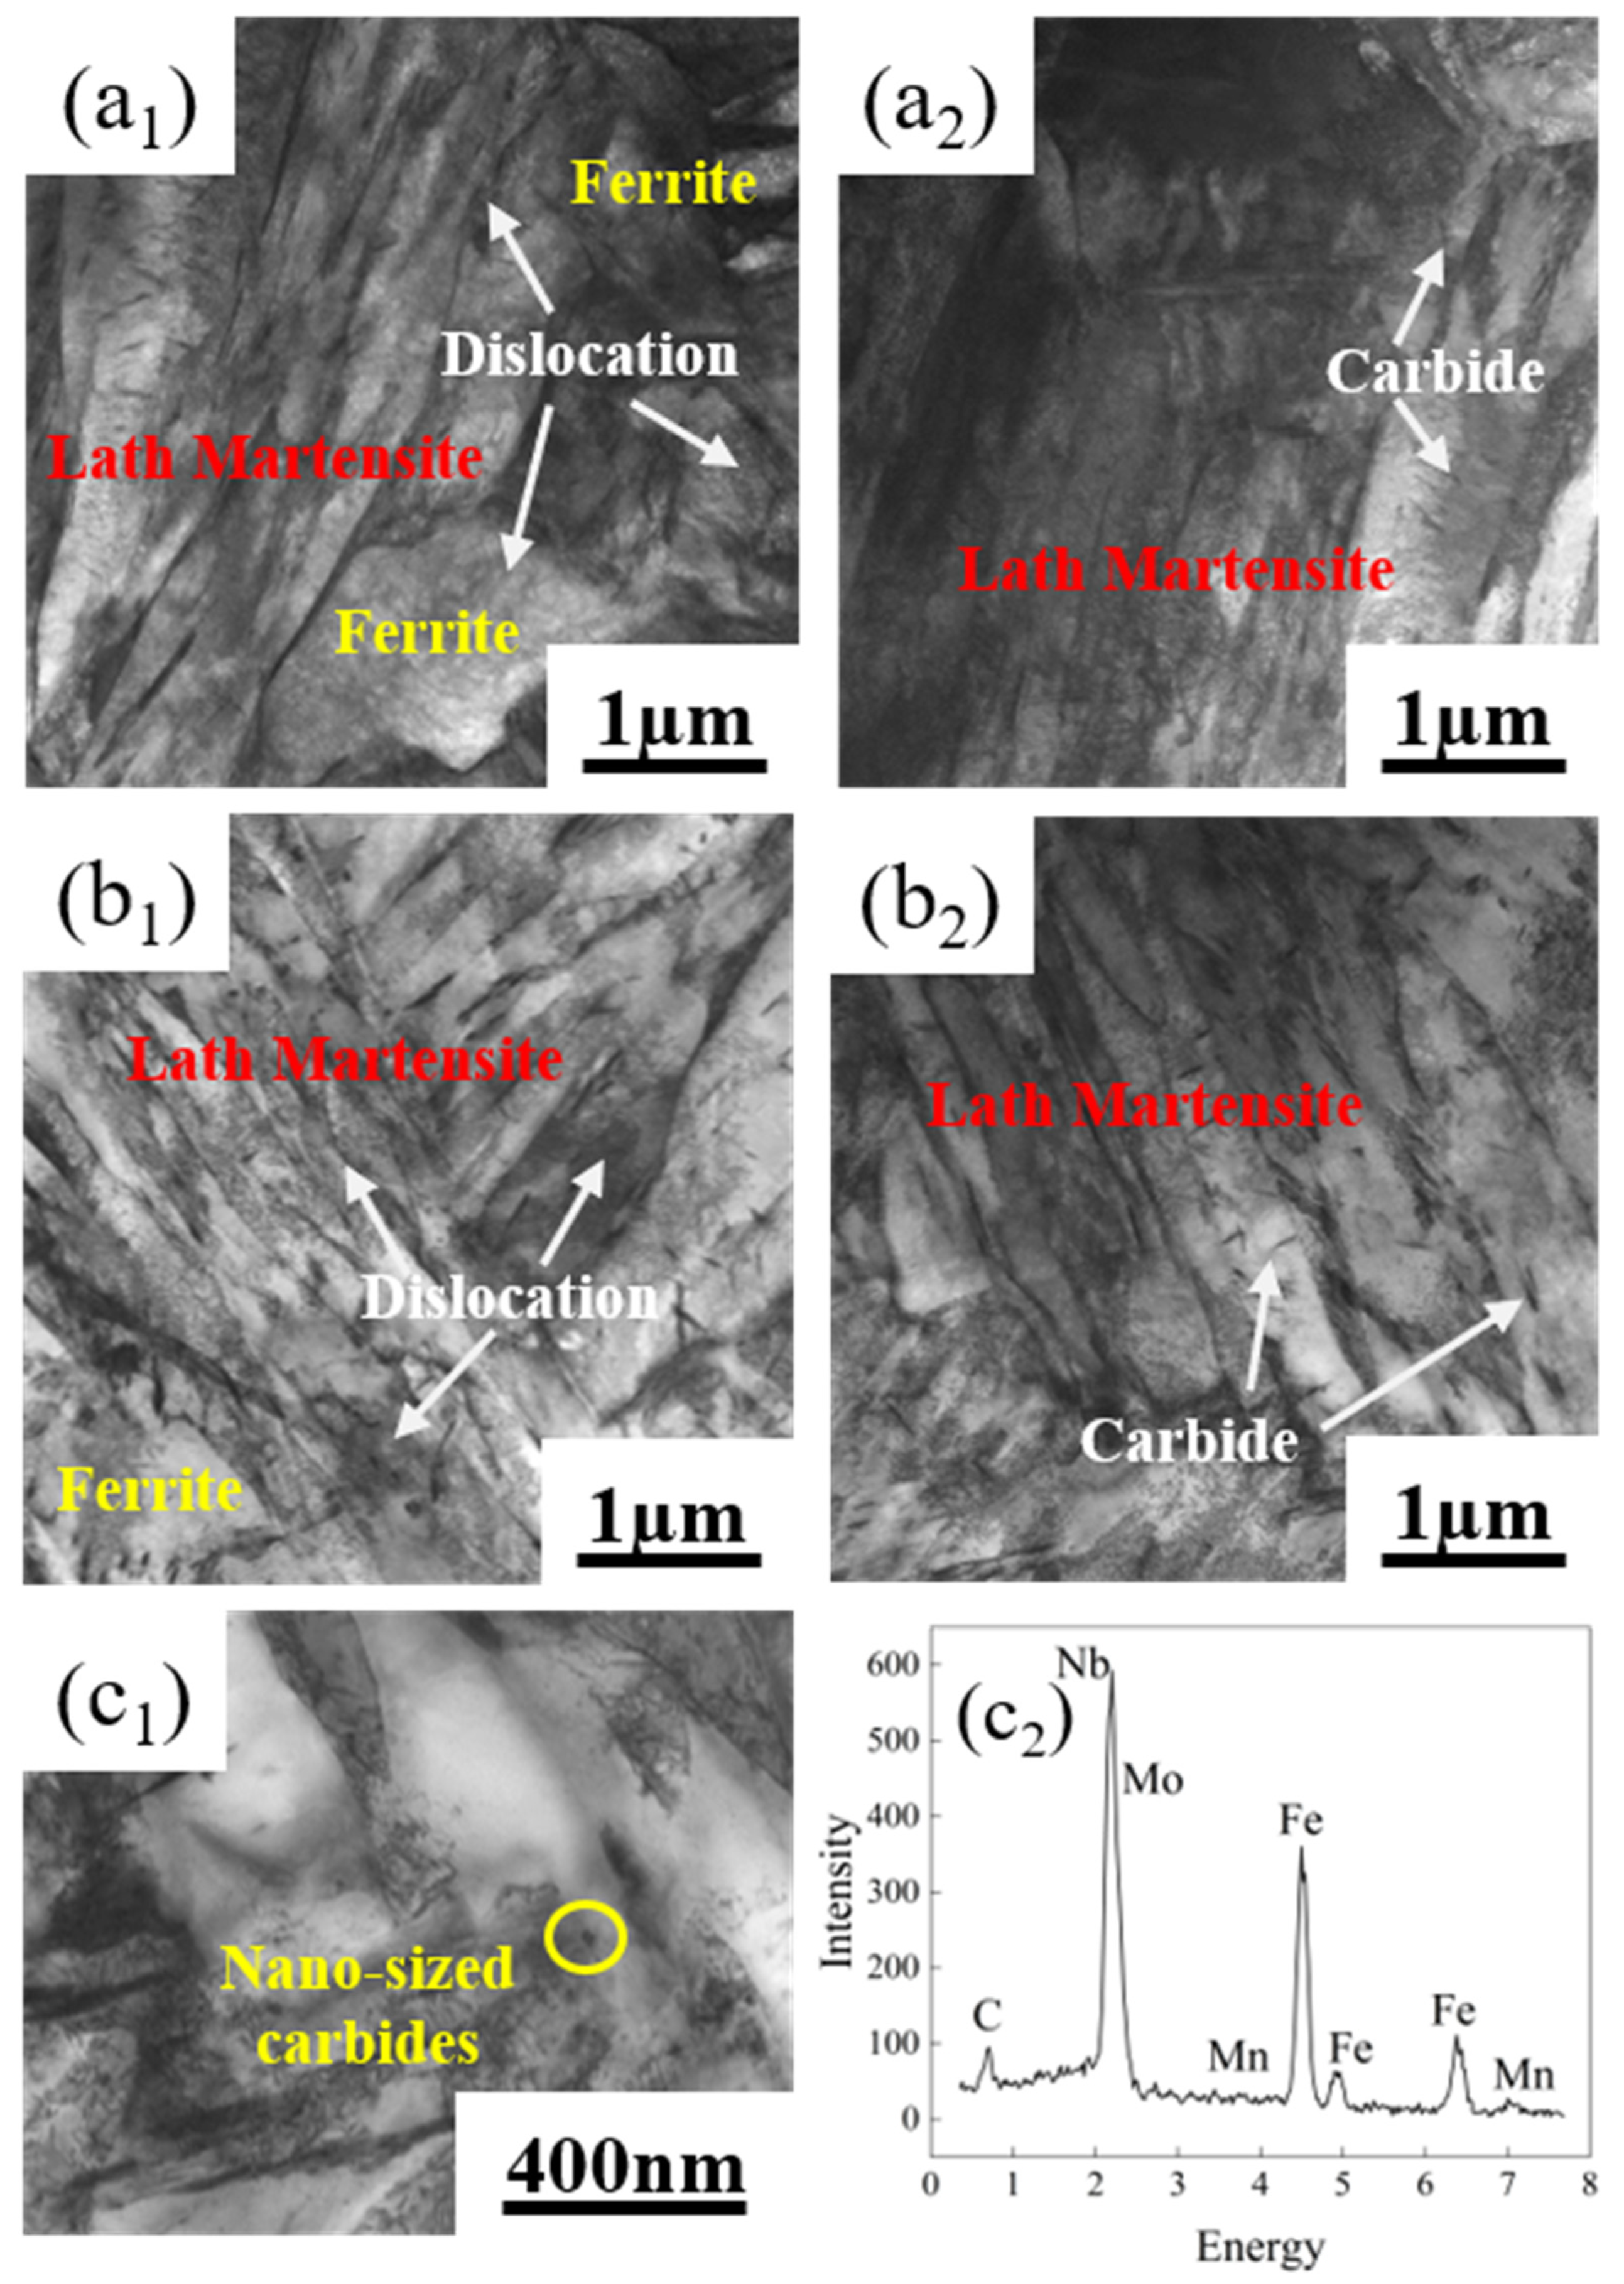
  • After complete quenching and intercritical quenching and tempering, the microstructure of the DP steel consisted of martensite and ferrite, with most martensite appearing in the lath form, and only a small amount of blocky martensite was visible. The alternating and uniform distribution of ferrite and martensite confirmed that quenched martensite laths served as effective nucleation sites. The small EGS of all four groups of DP steel also indicated that performing complete quenching before critical annealing helped refine the microstructure.
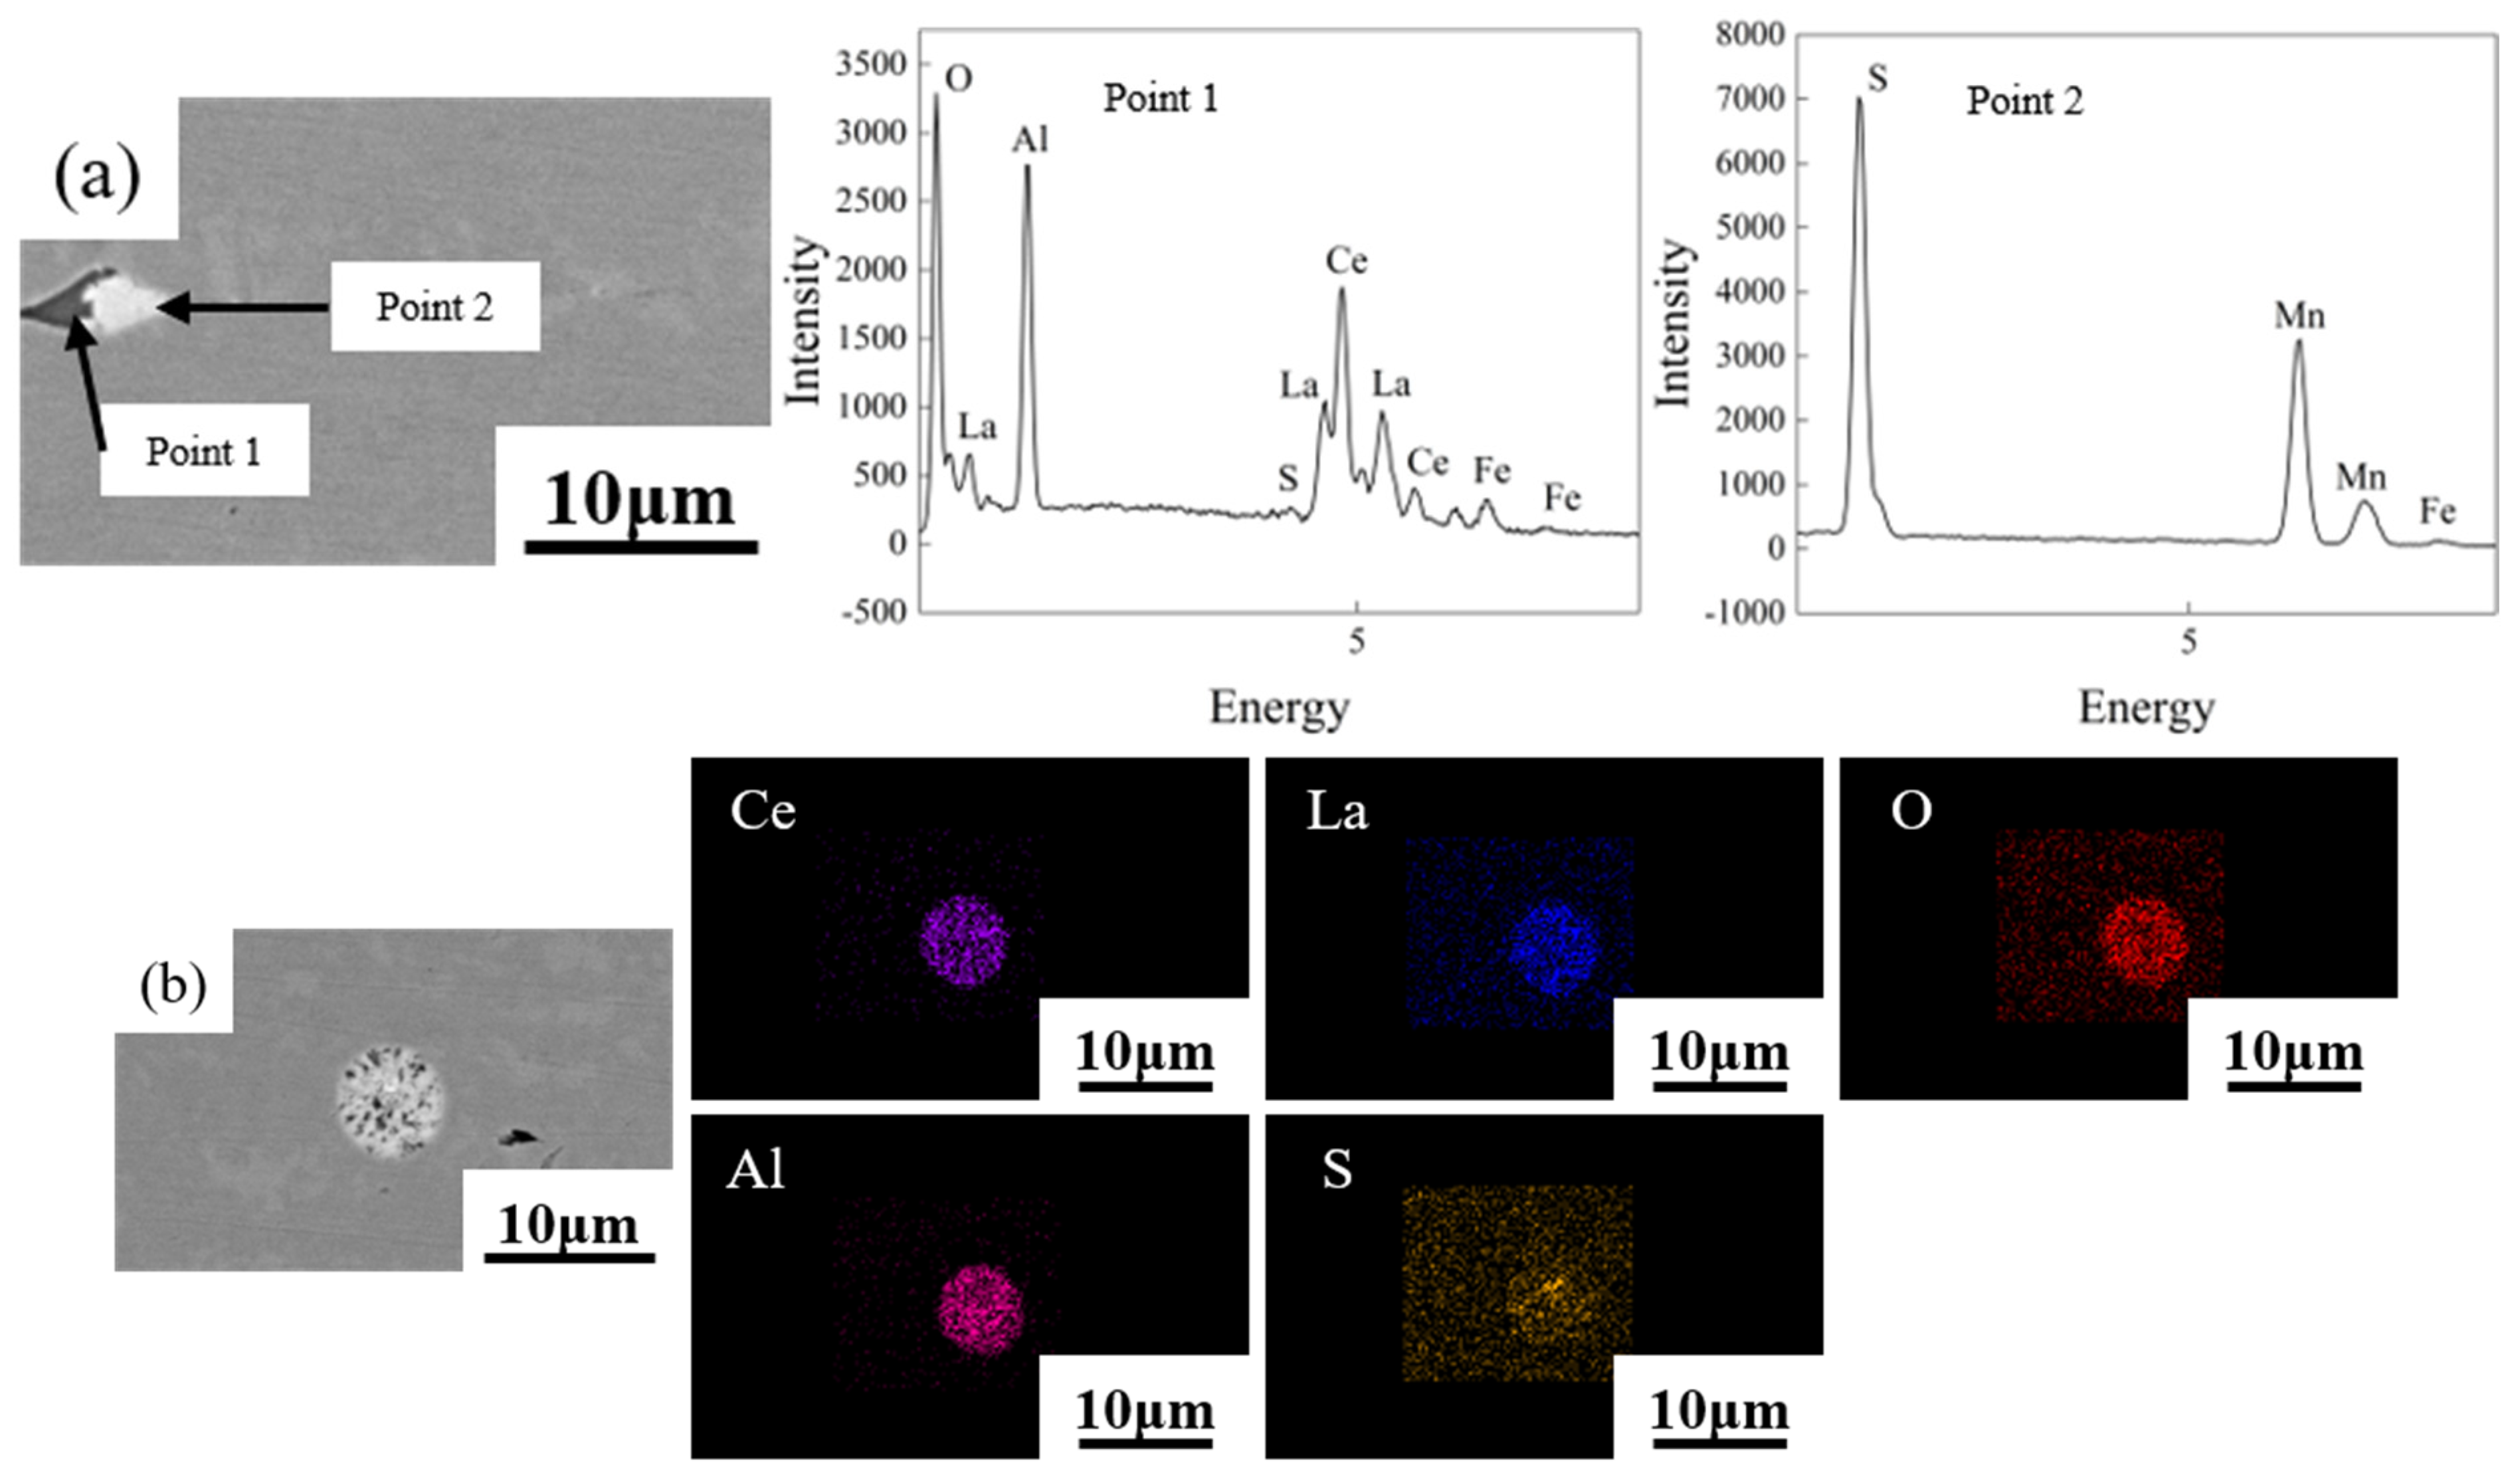
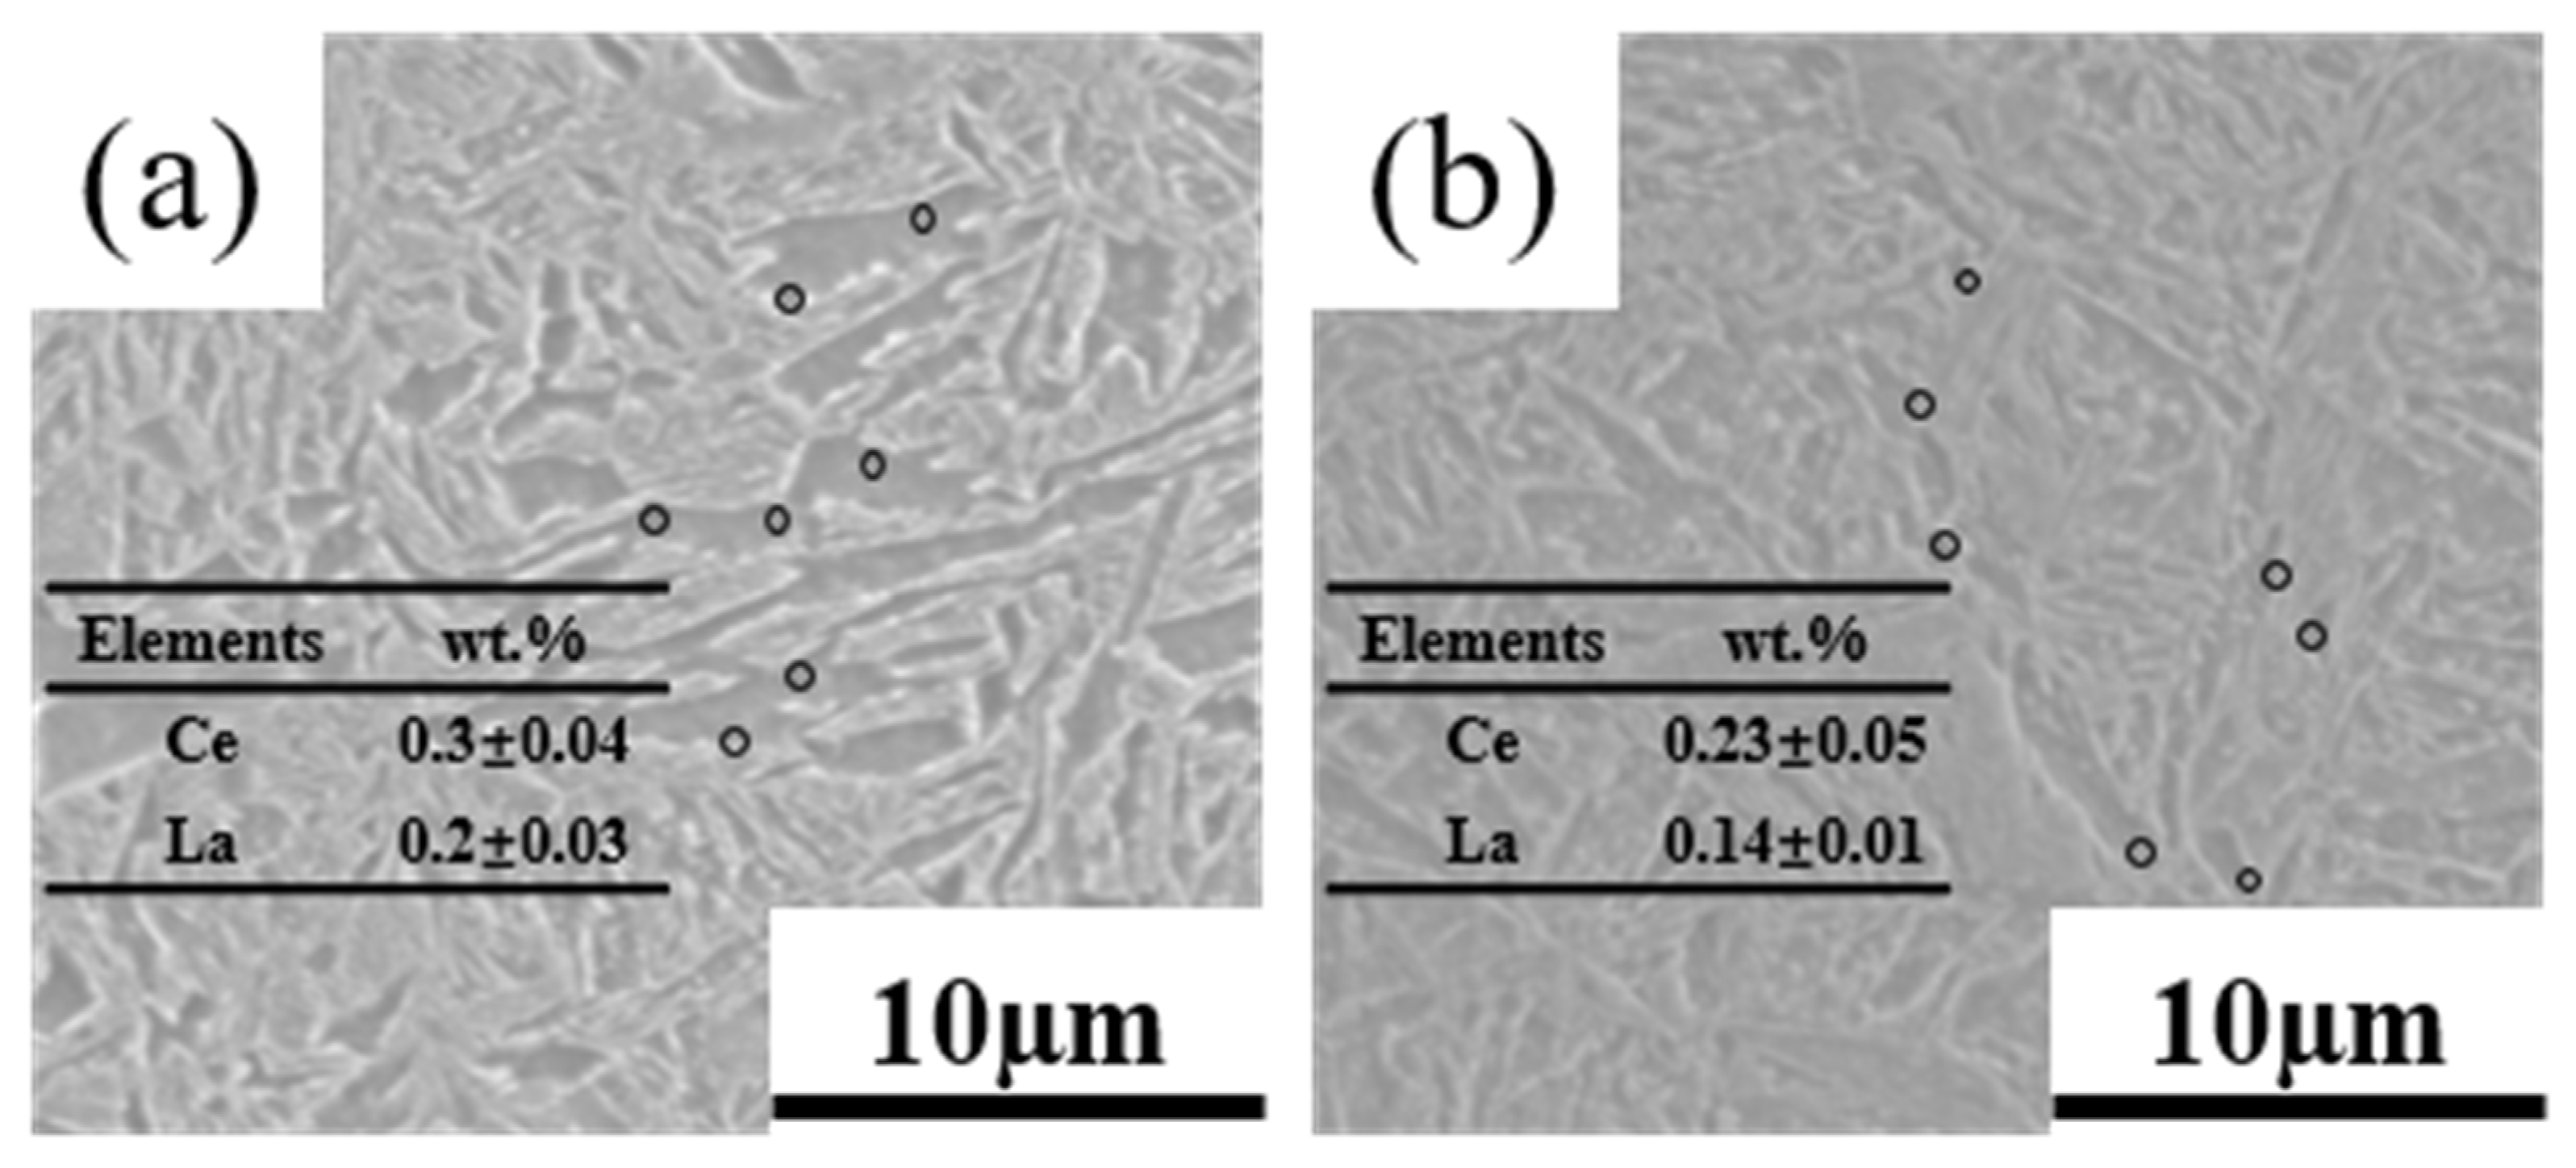
  • The rare earth elements readily adsorbed impurity elements, forming composite inclusions that were nearly ellipsoidal. That reduced the detrimental effect of inclusions on the mechanical properties of the DP steel. The segregation of rare earth elements at GBs helped refine the grains and enhanced the DP steel’s strength, toughness, and strain-hardening capacity. Due to the diffusion ability of alloying elements, the segregation of rare earth elements at GBs was more pronounced at lower annealing temperatures.
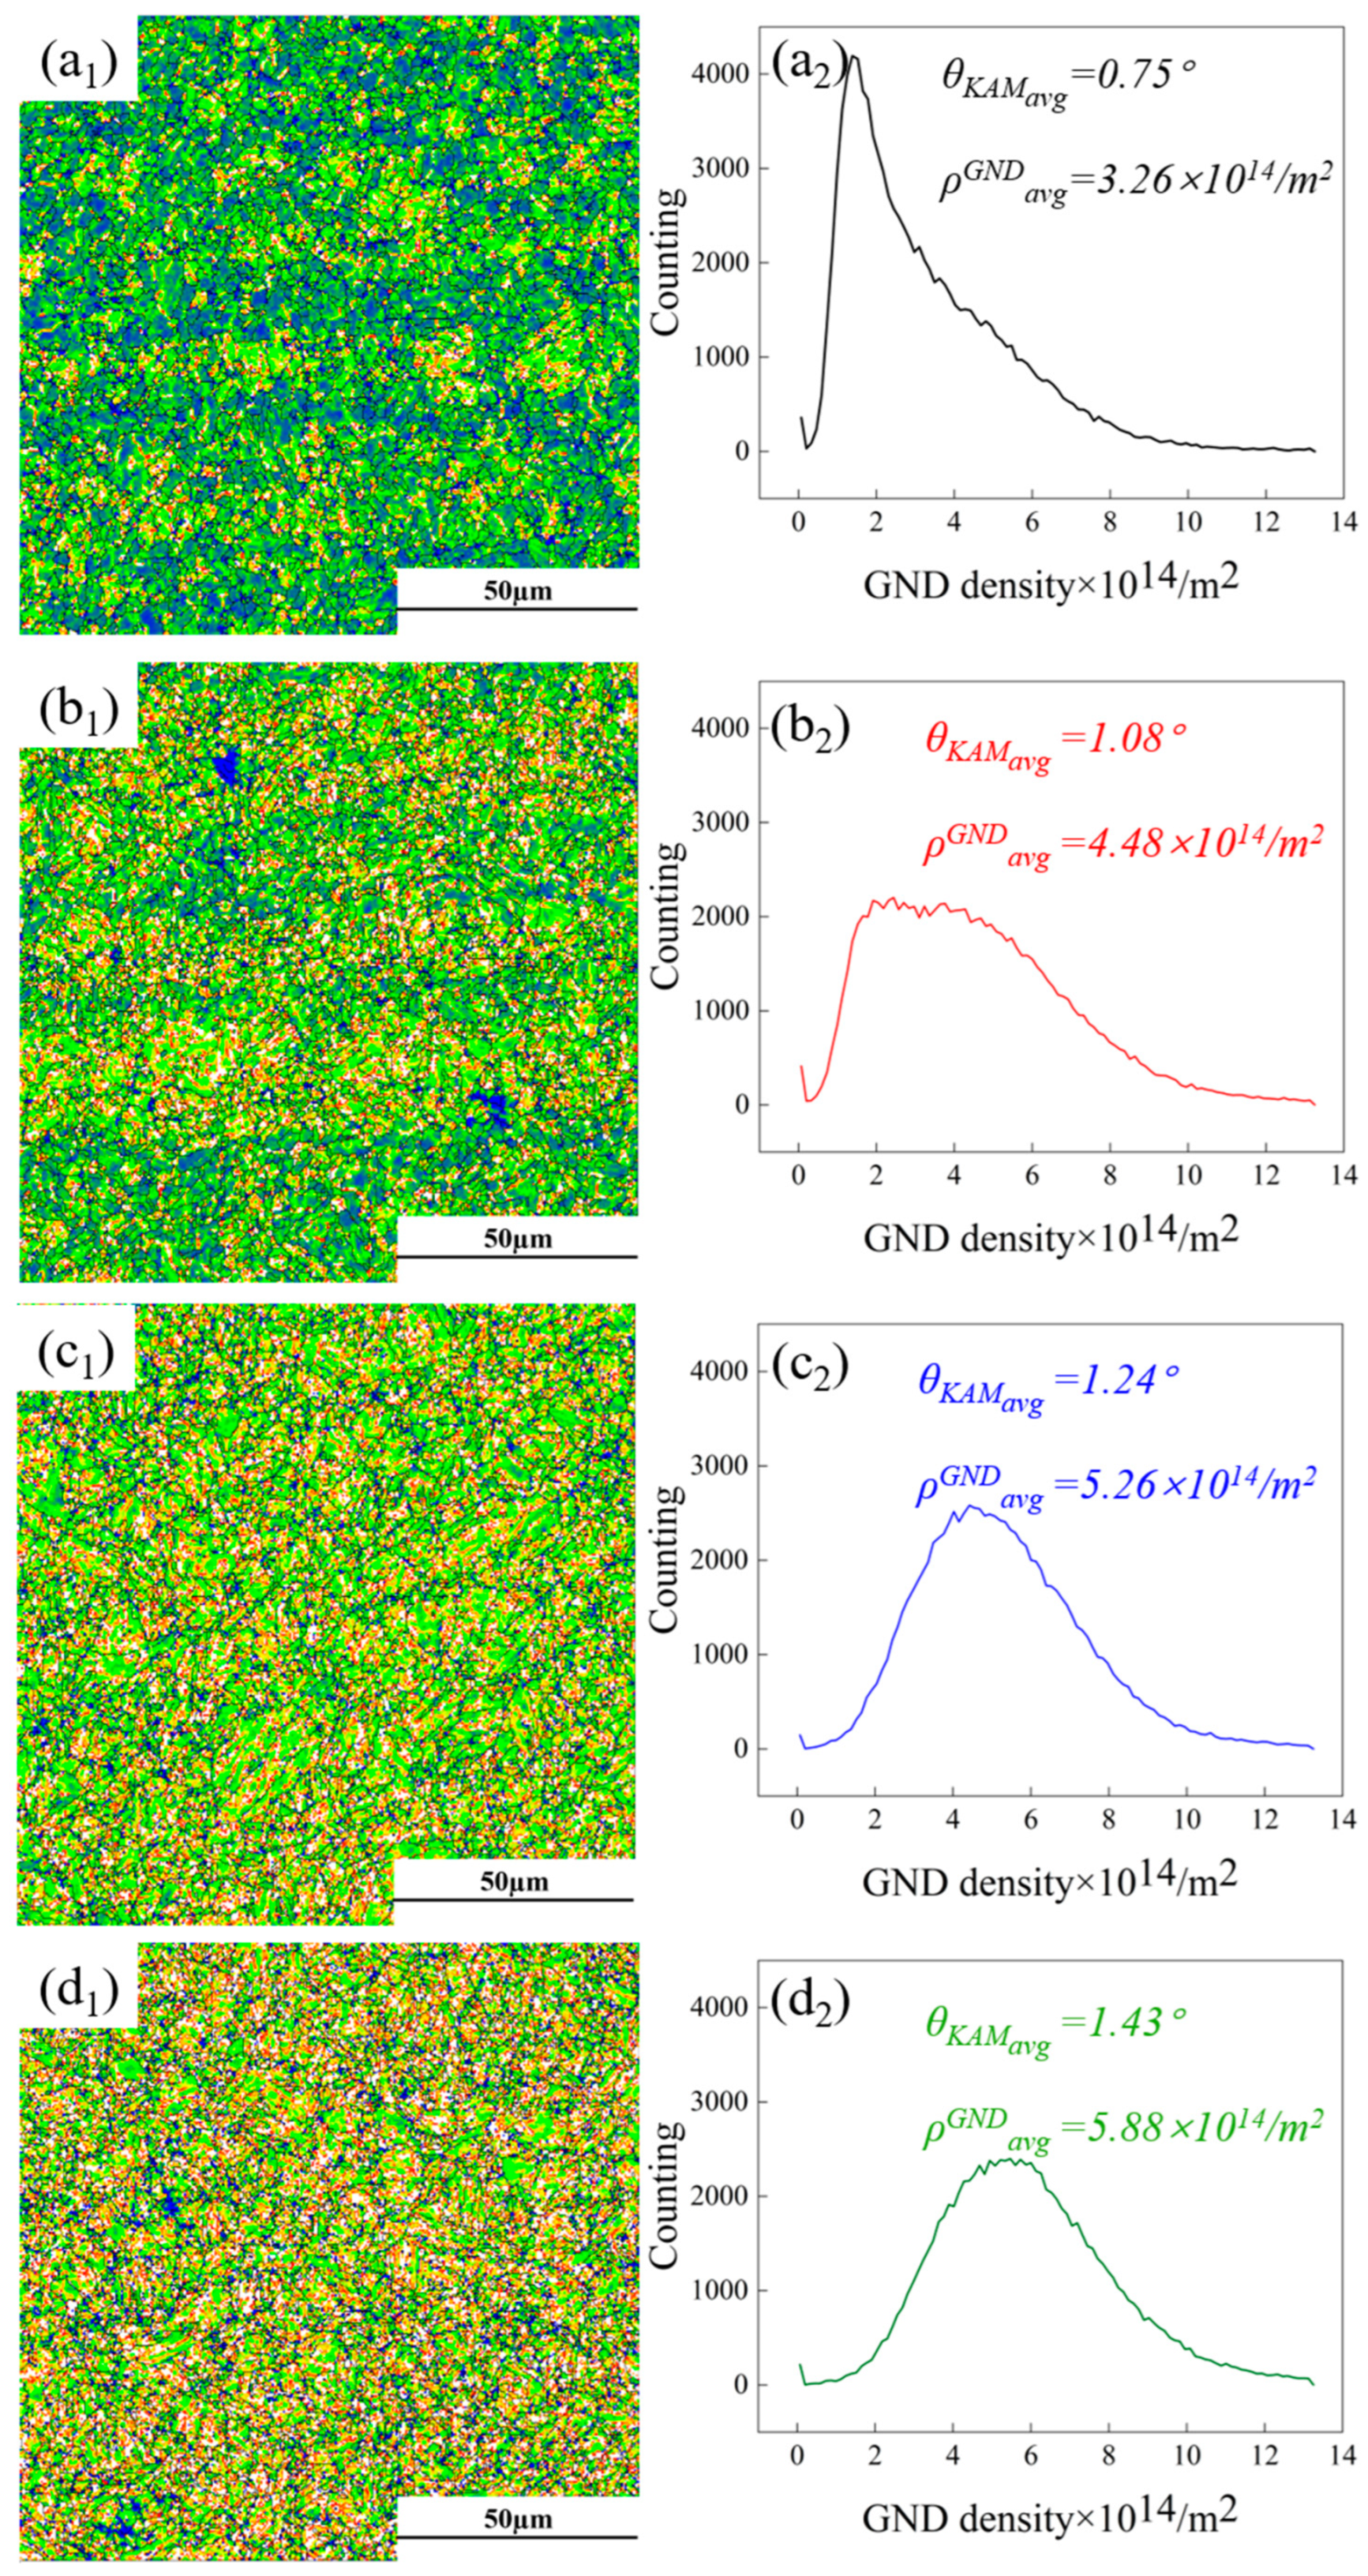
  • As the critical annealing temperature rose, the martensite content rose from 60% to 93%. The UTS of the experimental steel increased from 1227 MPa to 1406 MPa, the yield strength increased from 928 MPa to 1177 MPa, the TE decreased from 14.18% to 12.07%, and the strain-hardening index increased from 0.215 to 0.328. The mechanical properties of the DP steel were strongly related to the martensite content. The dislocation density in the martensite was much higher than in the ferrite, and the corresponding plasticity and toughness decreased. All four groups of DP steel had excellent strength–toughness synergy, with a strength–plasticity accumulation of approximately 17 GPa∙% and better performance after annealing at 780 and 820 °C.
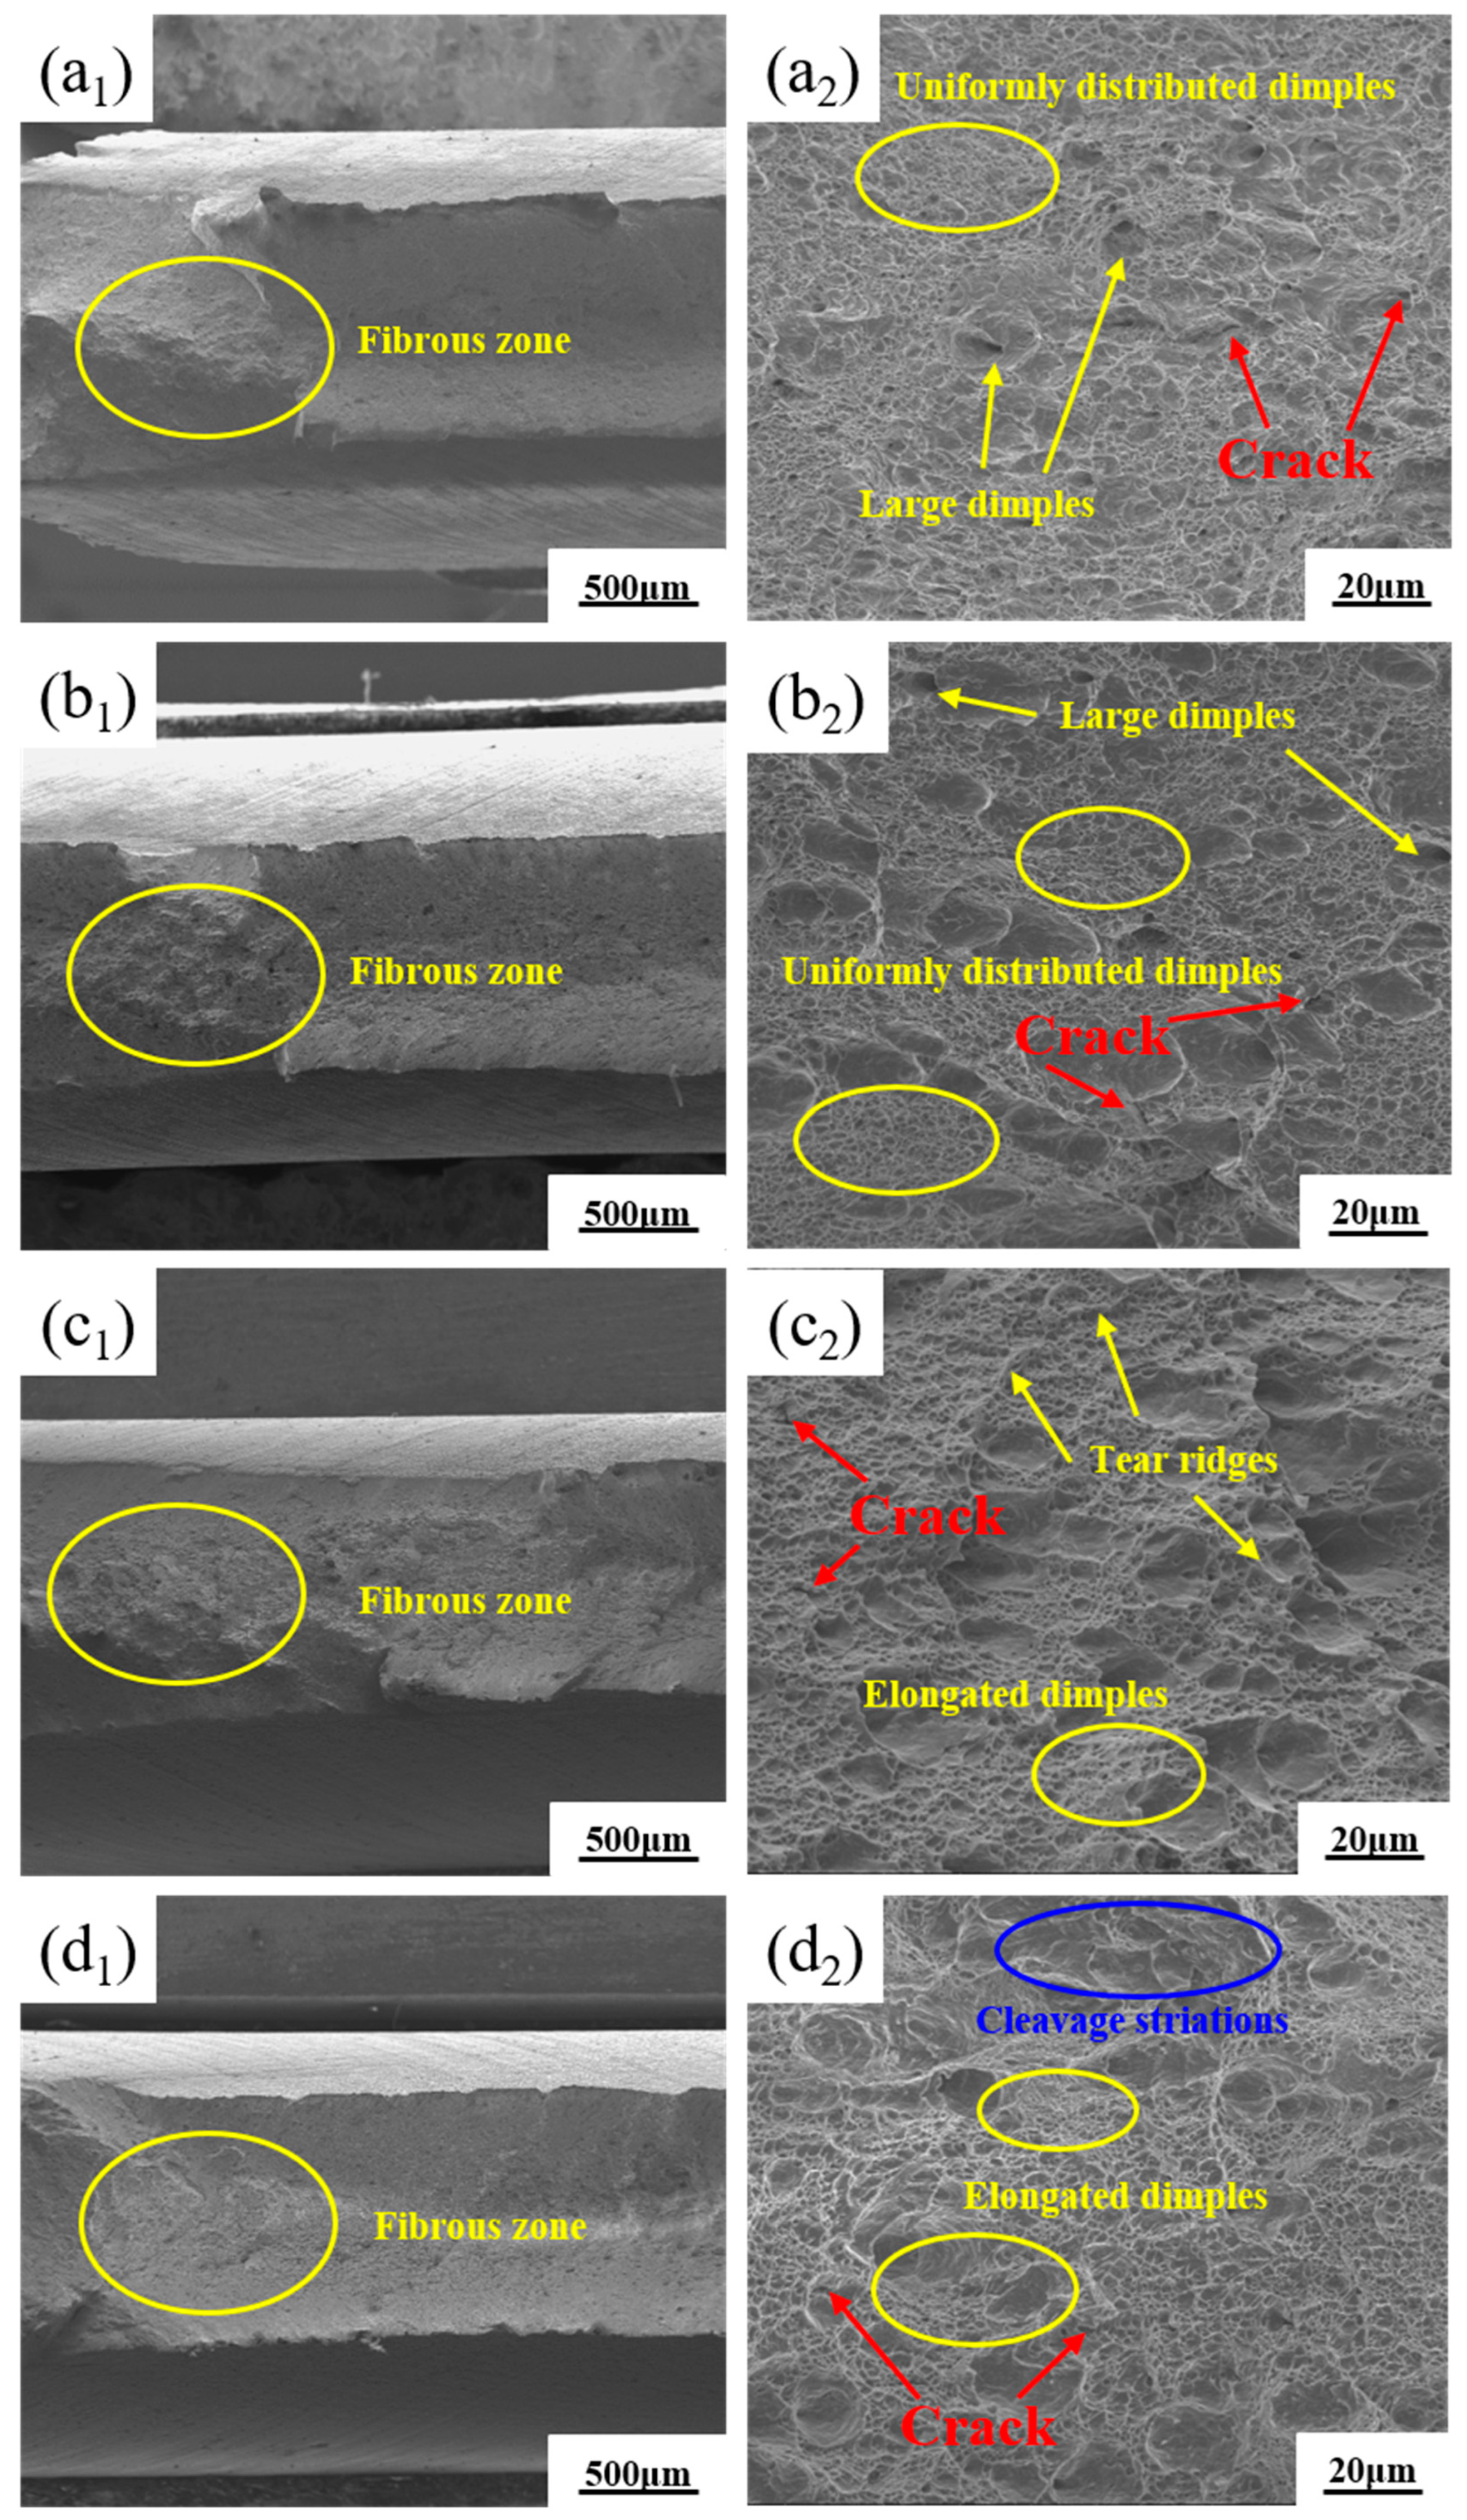
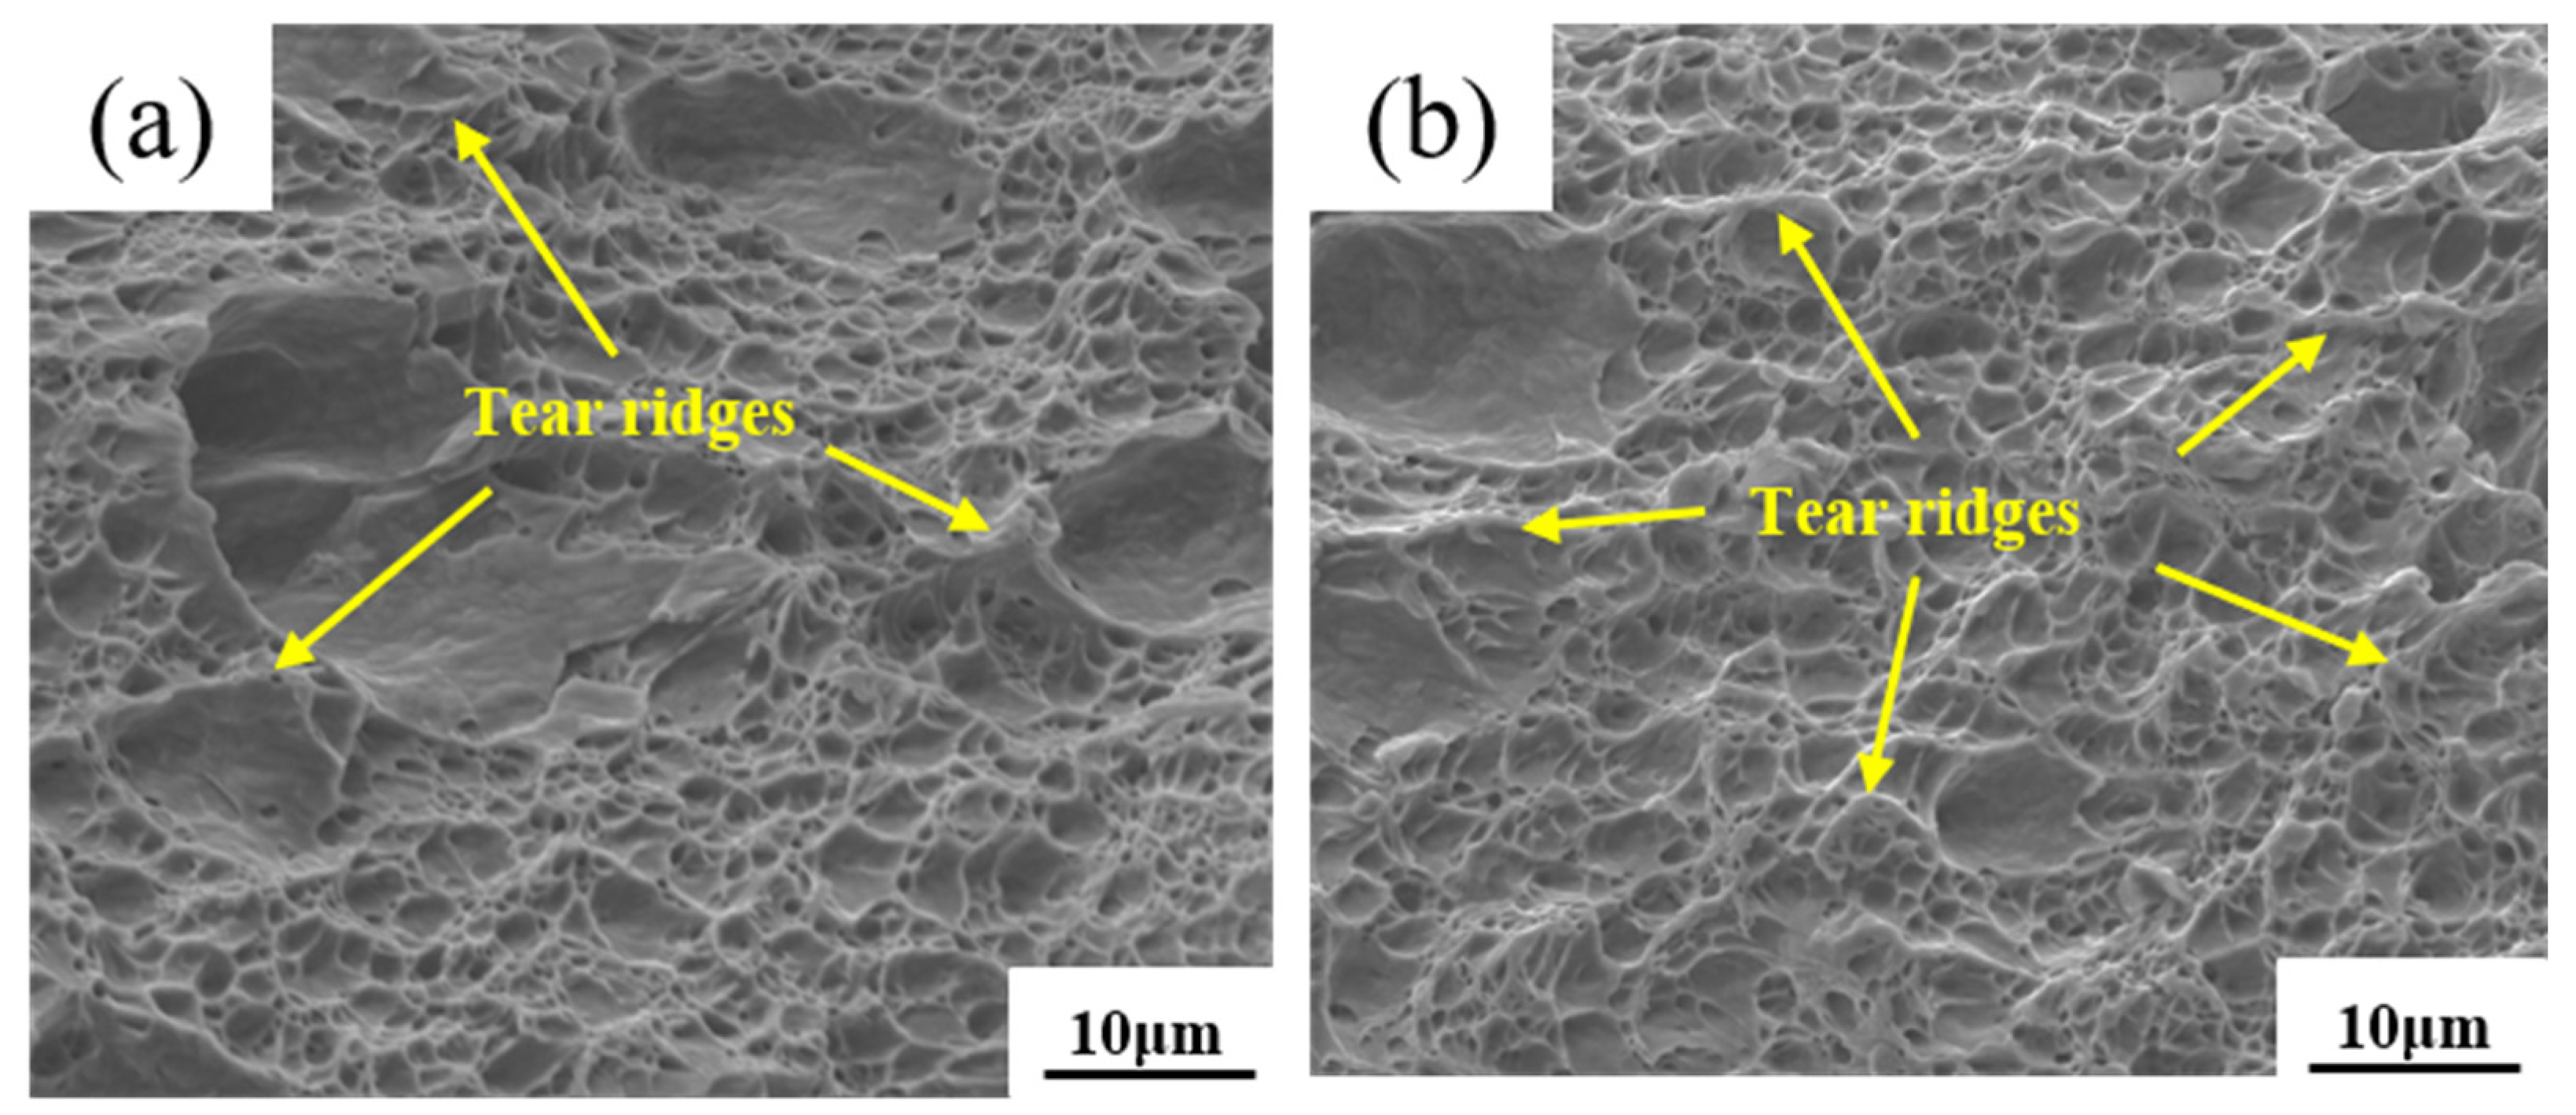
  • The fracture mode of the DP steel was typically a ductile fracture. At lower annealing temperatures, it had better plasticity and toughness. The refinement of the DP steel microstructure, the uniform distribution of both phases, the modification of inclusions, dislocation behaviour in the ferrite phase, and low-temperature tempering that weakened the martensite phase’s hardness collectively resulted in the improved coordination of deformation between the martensite and the ferrite. That prevented significant phase separation, enhancing the overall mechanical performance.

Author Contributions

Conceptualization, Z.L., J.J. and X.S.; methodology, Z.L., J.Y., W.G. and X.Y.; software, Z.L., J.Y., W.G. and X.Y.; validation, Z.L., J.J. and X.S.; formal analysis, Z.L. and J.Y.; investigation, Z.L., J.Y., W.G. and X.Y.; resources, Z.L., J.J. and X.S.; data curation, Z.L.; writing—original draft preparation, Z.L.; writing—review and editing, Z.L., J.Y., W.G., X.Y., J.J. and X.S.; visualization, Z.L., J.Y., W.G. and X.Y.; supervision, X.S.; project administration, X.S. All authors have read and agreed to the published version of the manuscript.

Funding

This research received no external funding.

Data Availability Statement

The datasets associated with this article are not publicly available due to privacy and ethical concerns. The data contain sensitive information that cannot be shared without proper consent or clearance. We are committed to maintaining confidentiality and adhering to relevant ethical standards in the handling of the data.

Acknowledgments

The authors would like to thank Yuanyuan Li, Zhen Wang, and Wei Yuan from the Analysis and Testing Center, Wuhan University of Science and Technology.

Conflicts of Interest

The authors affirm that there are no conflicts of interest. We formally declare that all authors have reviewed and approved the final version of this manuscript. This manuscript has not been previously published and is not under consideration for publication elsewhere.

References

  1. Bouaziz, O.; Zurob, H.; Huang, M. Driving Force and Logic of Development of Advanced High Strength Steels for Automotive Applications. Steel Res. Int. 2013, 84, 937–947. [Google Scholar] [CrossRef]
  2. Soleimani, M.; Kalhor, A.; Mirzadeh, H. Transformation-Induced Plasticity (TRIP) in Advanced Steels: A Review. Mater. Sci. Eng. A 2020, 795, 140023. [Google Scholar] [CrossRef]
  3. Liu, L.; Maresca, F.; Hoefnagels, J.P.M.; Vermeij, T.; Geers, M.G.D.; Kouznetsova, V.G. Revisiting the Martensite/Ferrite Interface Damage Initiation Mechanism: The Key Role of Substructure Boundary Sliding. Acta Mater. 2021, 205, 116533. [Google Scholar] [CrossRef]
  4. Hofmann, H.; Mattissen, D.; Schaumann, T.W. Advanced Cold Rolled Steels for Automotive Applications. Steel Res. Int. 2009, 80, 22–28. [Google Scholar] [CrossRef]
  5. Asadipoor, M.; Kadkhodapour, J.; Pourkamali Anaraki, A.; Sharifi, S.M.H.; Darabi, A.C.; Barnoush, A. Experimental and Numerical Investigation of Hydrogen Embrittlement Effect on Microdamage Evolution of Advanced High-Strength Dual-Phase Steel. Met. Mater. Int. 2021, 27, 2276–2291. [Google Scholar] [CrossRef]
  6. Prahl, U.; Papaefthymiou, S.; Uthaisangsuk, V.; Bleck, W.; Sietsma, J.; Van Der Zwaag, S. Micromechanics-Based Modelling of Properties and Failure of Multiphase Steels. Comput. Mater. Sci. 2007, 39, 17–22. [Google Scholar] [CrossRef]
  7. Frómeta, D.; Cuadrado, N.; Rehrl, J.; Suppan, C.; Dieudonné, T.; Dietsch, P.; Calvo, J.; Casellas, D. Microstructural Effects on Fracture Toughness of Ultra-High Strength Dual Phase Sheet Steels. Mater. Sci. Eng. A 2021, 802, 140631. [Google Scholar] [CrossRef]
  8. Soliman, M.; Palkowski, H. Strain Hardening Dependence on the Structure in Dual-Phase Steels. Steel Res. Int. 2021, 92, 2000518. [Google Scholar] [CrossRef]
  9. Mostaan, H.; Saeedpour, P.; Ahmadi, H.; Nouri, A. Laser Welding of Dual-Phase Steels with Different Silicon Contents: Phase Evolutions, Microstructural Observations, Mechanical Properties, and Fracture Behavior. Mater. Sci. Eng. A 2021, 811, 140974. [Google Scholar] [CrossRef]
  10. Mazaheri, Y.; Jahanara, A.H.; Sheikhi, M.; Kalashami, A.G. High Strength-Elongation Balance in Ultrafine Grained Ferrite-Martensite Dual Phase Steels Developed by Thermomechanical Processing. Mater. Sci. Eng. A 2019, 761, 138021. [Google Scholar] [CrossRef]
  11. Xu, X.; Van Der Zwaag, S.; Xu, W. The Effect of Ferrite–Martensite Morphology on the Scratch and Abrasive Wear Behaviour of a Dual Phase Construction Steel. Wear 2016, 348–349, 148–157. [Google Scholar] [CrossRef]
  12. Chakraborti, P.C.; Mitra, M.K. Microstructure and Tensile Properties of High Strength Duplex Ferrite–Martensite (DFM) Steels. Mater. Sci. Eng. A 2007, 466, 123–133. [Google Scholar] [CrossRef]
  13. Bag, A.; Ray, K.K.; Dwarakadasa, E.S. Influence of Martensite Content and Morphology on the Toughness and Fatigue Behavior of High-Martensite Dual-Phase Steels. Metall. Mater. Trans. A 2001, 32, 2207–2217. [Google Scholar] [CrossRef]
  14. Rosenberg, G.; Sinaiová, I.; Juhar, Ľ. Effect of Microstructure on Mechanical Properties of Dual Phase Steels in the Presence of Stress Concentrators. Mater. Sci. Eng. A 2013, 582, 347–358. [Google Scholar] [CrossRef]
  15. Pinard, P.T.; Schwedt, A.; Ramazani, A.; Prahl, U.; Richter, S. Characterization of Dual-Phase Steel Microstructure by Combined Submicrometer EBSD and EPMA Carbon Measurements. Microsc. Microanal. 2013, 19, 996–1006. [Google Scholar] [CrossRef]
  16. Han, J.; Wang, K.; Wang, Z.; Yu, H. Tailoring the Strength and Low-Temperature Toughness of HSLA Structural Steel by Adding Trace Ce. Mater. Today Commun. 2024, 40, 109789. [Google Scholar] [CrossRef]
  17. Zhang, J.; Di, H.; Deng, Y.; Misra, R.D.K. Effect of Martensite Morphology and Volume Fraction on Strain Hardening and Fracture Behavior of Martensite–Ferrite Dual Phase Steel. Mater. Sci. Eng. A 2015, 627, 230–240. [Google Scholar] [CrossRef]
  18. Yaghoobi, F.; Jamaati, R.; Jamshidi Aval, H. Simultaneous Enhancement of Strength and Ductility in Ferrite-Martensite Steel via Increasing the Martensite Fraction. Mater. Chem. Phys. 2021, 259, 124204. [Google Scholar] [CrossRef]
  19. Park, K.-T.; Lee, Y.K.; Shin, D.H. Fabrication of Ultrafine Grained Ferrite/Martensite Dual Phase Steel by Severe Plastic Deformation. ISIJ Int. 2005, 45, 750–755. [Google Scholar] [CrossRef]
  20. Ashrafi, H.; Shamanian, M.; Emadi, R.; Saeidi, N. A Novel and Simple Technique for Development of Dual Phase Steels with Excellent Ductility. Mater. Sci. Eng. A 2017, 680, 197–202. [Google Scholar] [CrossRef]
  21. Papa Rao, M.; Subramanya Sarma, V.; Sankaran, S. Processing of Bimodal Grain-Sized Ultrafine-Grained Dual Phase Microalloyed V-Nb Steel with 1370 MPa Strength and 16 Pct Uniform Elongation Through Warm Rolling and Intercritical Annealing. Metall. Mater. Trans. A 2014, 45, 5313–5317. [Google Scholar] [CrossRef]
  22. Alibeyki, M.; Mirzadeh, H.; Najafi, M. Fine-Grained Dual Phase Steel via Intercritical Annealing of Cold-Rolled Martensite. Vacuum 2018, 155, 147–152. [Google Scholar] [CrossRef]
  23. Yin, C.-C.; Cheng, L.; Wang, Z.-H.; Zhao, T.-L.; Cheng, S.; Hu, S.-E.; Liu, Z.-C.; Luo, D.; Xiao, D.-H.; Jin, X.; et al. Local Corrosion Behaviors in the Coarse-Grained Heat-Affected Zone in a Newly Developed Zr–Ti–Al–RE Deoxidized High-Strength Low-Alloy Steel. Materials 2023, 16, 876. [Google Scholar] [CrossRef]
  24. Wang, X.; Wu, Z.; Li, B.; Chen, W.; Zhang, J.; Mao, J. Inclusions Modification by Rare Earth in Steel and the Resulting Properties: A Review. J. Rare Earths 2024, 42, 431–445. [Google Scholar] [CrossRef]
  25. Torkamani, H.; Raygan, S.; Garcia Mateo, C.; Rassizadehghani, J.; Palizdar, Y.; San-Martin, D. Contributions of Rare Earth Element (La,Ce) Addition to the Impact Toughness of Low Carbon Cast Niobium Microalloyed Steels. Met. Mater. Int. 2018, 24, 773–788. [Google Scholar] [CrossRef]
  26. Zhang, S.; Yu, J.; Li, H.; Jiang, Z.; Geng, Y.; Feng, H.; Zhang, B.; Zhu, H. Refinement Mechanism of Cerium Addition on Solidification Structure and Sigma Phase of Super Austenitic Stainless Steel S32654. J. Mater. Sci. Technol. 2022, 102, 105–114. [Google Scholar] [CrossRef]
  27. Liu, P.; Hou, X.; Yang, C.; Luan, Y.; Zheng, C.; Li, D. Synergic Evolution of Microstructure-Texture-Stored Energy in Rare-Earth-Added Interstitial-Free Steels Undergoing Static Recrystallization. Acta Metall. Sin. (Engl. Lett.) 2023, 36, 661–680. [Google Scholar] [CrossRef]
  28. Liu, P.; Hou, X.; Yang, C.; Luan, Y.; Zheng, C.; Li, D.; Ma, G. Tailoring Microstructure Evolution and Austenite Stability of TRIP Steels by Rare-Earth Micro-Alloying. Mater. Charact. 2023, 203, 113035. [Google Scholar] [CrossRef]
  29. Cheng, S.; Hou, T.; Zheng, Y.; Yin, C.; Wu, K. Effect of Rare Earth Elements on Microstructure and Tensile Behavior of Nb-Containing Microalloyed Steels. Materials 2024, 17, 1701. [Google Scholar] [CrossRef]
  30. Zhao, J.; Guo, Y.; Fan, X.; Yan, B.; Lu, X. Tensile Properties and Prediction of DP780 Treated with Rare Earth Ce Based on DE-SVM-II. Mater. Today Commun. 2022, 33, 104771. [Google Scholar] [CrossRef]
  31. Ayyandurai, A.; Uzair Ul Haque, M. Influence of Rare Earth Metals on Inclusion Modification of Dual Phase Steel: Influence Des Métaux de Terres Rares Sur La Modification Des Inclusions de l’acier Biphasé. Can. Metall. Q. 2024, 63, 1030–1039. [Google Scholar] [CrossRef]
  32. Zhao, J.; He, K.; Guo, Y.; Fan, X.; Yan, B.; Lu, X.; Zhang, X. Evolution of Microstructure and Mechanical Properties in Dual-Phase Steel Containing Ce and Nb. J. Mater. Eng. Perform. 2024, 33, 9829–9839. [Google Scholar] [CrossRef]
  33. ASTM E8/E8M-21; Standard Test Methods for Tension Testing of Metallic Materials. ASTM International: West Conshohocken, PA, USA, 2021.
  34. Kang, S.; Speer, J.G.; Krizan, D.; Matlock, D.K.; De Moor, E. Prediction of Tensile Properties of Intercritically Annealed Al-Containing 0.19C–4.5Mn (Wt%) TRIP Steels. Mater. Des. 2016, 97, 138–146. [Google Scholar] [CrossRef]
  35. Soliman, M.; Palkowski, H. On Factors Affecting the Phase Transformation and Mechanical Properties of Cold-Rolled Transformation-Induced-Plasticity–Aided Steel. Metall. Mater. Trans. A 2008, 39, 2513–2527. [Google Scholar] [CrossRef]
  36. Mirzadeh, H.; Alibeyki, M.; Najafi, M. Unraveling the Initial Microstructure Effects on Mechanical Properties and Work-Hardening Capacity of Dual-Phase Steel. Metall. Mater. Trans. A 2017, 48, 4565–4573. [Google Scholar] [CrossRef]
  37. Krauss, G. Steels: Processing, Structure, and Performance. Choice Rev. Online 2006, 43, 43-6550. [Google Scholar] [CrossRef]
  38. Nouroozi, M.; Mirzadeh, H.; Zamani, M. Effect of Microstructural Refinement and Intercritical Annealing Time on Mechanical Properties of High-Formability Dual Phase Steel. Mater. Sci. Eng. A 2018, 736, 22–26. [Google Scholar] [CrossRef]
  39. Azizi-Alizamini, H.; Militzer, M.; Poole, W.J. Formation of Ultrafine Grained Dual Phase Steels through Rapid Heating. ISIJ Int. 2011, 51, 958–964. [Google Scholar] [CrossRef]
  40. Barik, R.K.; Ghosh, A.; Sk, M.B.; Biswal, S.; Dutta, A.; Chakrabarti, D. Bridging Microstructure and Crystallography with the Micromechanics of Cleavage Fracture in a Lamellar Pearlitic Steel. Acta Mater. 2021, 214, 116988. [Google Scholar] [CrossRef]
  41. Xi, X.; Wang, J.; Chen, L.; Wang, Z. On the Microstructural Strengthening and Toughening of Heat-Affected Zone in a Low-Carbon High-Strength Cu-Bearing Steel. Acta Metall. Sin. (Engl. Lett.) 2021, 34, 617–627. [Google Scholar] [CrossRef]
  42. Geng, R.; Li, J.; Shi, C.; Zhi, J.; Lu, B. Effect of Ce on Microstructures, Carbides and Mechanical Properties in Simulated Coarse-Grained Heat-Affected Zone of 800-MPa High-Strength Low-Alloy Steel. Mater. Sci. Eng. A 2022, 840, 142919. [Google Scholar] [CrossRef]
  43. Luo, H.; Wang, X.; Liu, Z.; Yang, Z. Influence of Refined Hierarchical Martensitic Microstructures on Yield Strength and Impact Toughness of Ultra-High Strength Stainless Steel. J. Mater. Sci. Technol. 2020, 51, 130–136. [Google Scholar] [CrossRef]
  44. Kubin, L.P.; Mortensen, A. Geometrically Necessary Dislocations and Strain-Gradient Plasticity: A Few Critical Issues. Scr. Mater. 2003, 48, 119–125. [Google Scholar] [CrossRef]
  45. Ma, X.; Huang, C.; Moering, J.; Ruppert, M.; Höppel, H.W.; Göken, M.; Narayan, J.; Zhu, Y. Mechanical Properties of Copper/Bronze Laminates: Role of Interfaces. Acta Mater. 2016, 116, 43–52. [Google Scholar] [CrossRef]
  46. Kadkhodapour, J.; Butz, A.; Ziaei Rad, S. Mechanisms of Void Formation during Tensile Testing in a Commercial, Dual-Phase Steel. Acta Mater. 2011, 59, 2575–2588. [Google Scholar] [CrossRef]
  47. Samei, J.; Green, D.E.; Cheng, J.; De Carvalho Lima, M.S. Influence of Strain Path on Nucleation and Growth of Voids in Dual Phase Steel Sheets. Mater. Des. 2016, 92, 1028–1037. [Google Scholar] [CrossRef]
  48. Hosseini-Toudeshky, H.; Anbarlooie, B.; Kadkhodapour, J.; Shadalooyi, G. Microstructural Deformation Pattern and Mechanical Behavior Analyses of DP600 Dual Phase Steel. Mater. Sci. Eng. A 2014, 600, 108–121. [Google Scholar] [CrossRef]
  49. Chen, C.-Y.; Li, C.-H.; Tsao, T.-C.; Chiu, P.-H.; Tsai, S.-P.; Yang, J.-R.; Chiang, L.-J.; Wang, S.-H. A Novel Technique for Developing a Dual-Phase Steel with a Lower Strength Difference between Ferrite and Martensite. Mater. Today Commun. 2020, 23, 100895. [Google Scholar] [CrossRef]
  50. Balliger, N.K.; Gladman, T. Work Hardening of Dual-Phase Steels. Met. Sci. 1981, 15, 95–108. [Google Scholar] [CrossRef]
  51. Li, Y.; Liu, C.; Li, C.; Jiang, M. A Coupled Thermodynamic Model for Prediction of Inclusions Precipitation during Solidification of Heat-Resistant Steel Containing Cerium. J. Iron Steel Res. Int. 2015, 22, 457–463. [Google Scholar] [CrossRef]
  52. Ren, Q.; Zhang, L.; Liu, Y.; Cui, L.; Yang, W. Transformation of Cerium-Containing Inclusions in Ultra-Low-Carbon Aluminum-Killed Steels during Solidification and Cooling. J. Mater. Res. Technol. 2020, 9, 8197–8206. [Google Scholar] [CrossRef]
  53. Wang, H.; Bao, Y.; Zhi, J.; Duan, C.; Gao, S.; Wang, M. Effect of Rare Earth Ce on the Morphology and Distribution of Al2O3 Inclusions in High Strength IF Steel Containing Phosphorus during Continuous Casting and Rolling Process. ISIJ Int. 2021, 61, 657–666. [Google Scholar] [CrossRef]
  54. Geng, R.; Li, J.; Shi, C. Evolution of Inclusions with Ce Addition and Ca Treatment in Al-Killed Steel during RH Refining Process. ISIJ Int. 2021, 61, 1506–1513. [Google Scholar] [CrossRef]
  55. Cai, G.-J.; Li, C.-S. Effects of Ce on Inclusions and Corrosion Resistance of Low-Nickel Austenite Stainless Steel. Mater. Corros. 2015, 66, 1445–1455. [Google Scholar] [CrossRef]
  56. Liu, X.; Yang, J.; Yang, L.; Gao, X. Effect of Ce on Inclusions and Impact Property of 2Cr13 Stainless Steel. J. Iron Steel Res. Int. 2010, 17, 59–64. [Google Scholar] [CrossRef]
  57. Su, C.; Feng, G.; Zhi, J.; Zhao, B.; Wu, W. The Effect of Rare Earth Cerium on Microstructure and Properties of Low Alloy Wear-Resistant Steel. Metals 2022, 12, 1358. [Google Scholar] [CrossRef]
  58. Yin, T.W.; Shen, Y.F.; Xue, W.Y.; Jia, N.; Zuo, L. Ce Addition Enabling Superior Strength and Ductility Combination of a Low-Carbon Low-Manganese Transformation-Induced Plasticity Steel. Mater. Sci. Eng. A 2022, 849, 143474. [Google Scholar] [CrossRef]
  59. Calcagnotto, M.; Adachi, Y.; Ponge, D.; Raabe, D. Deformation and Fracture Mechanisms in Fine- and Ultrafine-Grained Ferrite/Martensite Dual-Phase Steels and the Effect of Aging. Acta Mater. 2011, 59, 658–670. [Google Scholar] [CrossRef]
  60. Ebrahimian, A.; Ghasemi Banadkouki, S.S. Mutual Mechanical Effects of Ferrite and Martensite in a Low Alloy Ferrite-Martensite Dual Phase Steel. J. Alloys Compd. 2017, 708, 43–54. [Google Scholar] [CrossRef]
  61. Calcagnotto, M.; Ponge, D.; Demir, E.; Raabe, D. Orientation Gradients and Geometrically Necessary Dislocations in Ultrafine Grained Dual-Phase Steels Studied by 2D and 3D EBSD. Mater. Sci. Eng. A 2010, 527, 2738–2746. [Google Scholar] [CrossRef]
  62. Ghassemi-Armaki, H.; Maaß, R.; Bhat, S.P.; Sriram, S.; Greer, J.R.; Kumar, K.S. Deformation Response of Ferrite and Martensite in a Dual-Phase Steel. Acta Mater. 2014, 62, 197–211. [Google Scholar] [CrossRef]
  63. Sodjit, S.; Uthaisangsuk, V. Microstructure Based Prediction of Strain Hardening Behavior of Dual Phase Steels. Mater. Des. 2012, 41, 370–379. [Google Scholar] [CrossRef]
Figure 1. Schematic diagram of heat treatment process.
Metals 15 00310 g001
Figure 2. Schematic diagram of tensile specimen dimensions (mm).
Metals 15 00310 g002
Figure 3. The engineering stress–strain curves of the experimental steel.
Metals 15 00310 g003
Figure 4. The mechanical properties of the experimental steel at different annealing temperatures: (a) strength variation curves; (b) elongation variation curves.
Metals 15 00310 g004
Figure 5. SEM micrographs of experimental steel at different annealing temperatures: (a1,a2) 780 °C; (b1,b2) 800 °C; (c1,c2) 820 °C; and (d1,d2) 840 °C.
Metals 15 00310 g005
Figure 6. Proportions of martensite and ferrite phases in the experimental steel at different annealing temperatures.
Metals 15 00310 g006
Figure 7. Grain boundary (GB) distribution maps and equivalent grain size (EGS) statistical charts of the experimental steel at different annealing temperatures: (a1d1) variations in the distribution of high-angle grain boundaries (HAGBs) and low-angle grain boundaries (LAGBs) in the experimental steel annealed at 780 °C, 800 °C, 820 °C, and 840 °C; (a2d2) variations in the equivalent grain size (EGS) in the experimental steel annealed at 780 °C, 800 °C, 820 °C, and 840 °C.
Metals 15 00310 g007
Figure 8. Micrographs and carbon line scan wavelength-dispersive spectroscopy (WDS) curves of the experimental steel at different annealing temperatures: (a1d1) micrographs of the experimental steel annealed at 780 °C, 800 °C, 820 °C, and 840 °C, with yellow dashed lines indicating the line scan regions; (a2d2) variations in the distribution of carbon in the ferrite and martensite phases of the experimental steel annealed at 780 °C, 800 °C, 820 °C, and 840 °C.
Metals 15 00310 g008
Figure 9. Kernel average misorientation (KAM) maps and geometrically necessary dislocation (GND) statistics of the experimental steel at different annealing temperatures: (a1d1) variations in the local orientation differences and stress concentration in the experimental steel annealed at 780 °C, 800 °C, 820 °C, and 840 °C; (a2d2) variations in orientation misorientation angles and geometrically necessary dislocations (GNDs) in the experimental steel annealed at 780 °C, 800 °C, 820 °C, and 840 °C (blue and green represent minor orientation deviations, and yellow and red indicate large deviations).
Metals 15 00310 g009
Figure 10. TEM micrographs and an EDS analysis of the nano-sized carbides in the experimental steel: (a1,a2) microstructural micrographs of the experimental steel annealed at 780 °C; (b1,b2) microstructural micrographs of the experimental steel annealed at 820 °C; (c1,c2) the morphology of the nano-sized carbides and an EDS analysis.
Metals 15 00310 g010
Figure 11. The tensile fracture morphology of the experimental steel annealed at different temperatures: (a1,a2) 780 °C; (b1,b2) 800 °C; (c1,c2) 820 °C; and (d1,d2) 840 °C.
Metals 15 00310 g011
Figure 12. The tear ridges’ morphology in the fracture surface of the experimental steel: (a) 820 °C; (b) 840 °C.
Metals 15 00310 g012
Figure 13. The strain-hardening curves of the experimental steel.
Metals 15 00310 g013
Figure 14. The l n σ t r u e l n ε t r u e curves of true stress–strain for the experimental steel at different annealing temperatures.
Metals 15 00310 g014
Figure 15. Inclusion morphology and EDS analysis of experimental steel: (a) analysis of ellipsoidal inclusion in experimental steel; (b) analysis of spherical inclusion in experimental steel.
Metals 15 00310 g015
Figure 16. Rare earth element segregation at the grain boundaries of the experimental steel: (a) the distribution of rare earth elements Ce and La in the experimental steel annealed at 780 °C; (b) the distribution of rare earth elements Ce and La in the experimental steel annealed at 820 °C.
Metals 15 00310 g016
Figure 17. The homogeneous distribution of ferrite and martensite in the experimental steel: (a) the distribution of ferrite and martensite in the experimental steel annealed at a 780 °C temperature; (b) the distribution of ferrite and martensite in the experimental steel annealed at an 820 °C temperature.
Metals 15 00310 g017
Figure 18. High-magnification TEM micrographs of the ferrite phase in the experimental steel: (a) ferrite morphology and dislocation distribution inside the ferrite phase in the experimental steel annealed at a 780 °C temperature; (b) ferrite morphology and dislocation distribution inside the ferrite phase in the experimental steel annealed at an 820 °C temperature.
Metals 15 00310 g018
Table 1. Chemical composition of experimental steel (mass percentage, %).
ElementMass Percentage
C0.19
Si0.40
Mn1.60
Cr0.15
Mo0.05
B0.0012
Nb0.02
Al0.035
P<0.010
S<0.0050
Ce + La0.015
FeBal.
Disclaimer/Publisher’s Note: The statements, opinions and data contained in all publications are solely those of the individual author(s) and contributor(s) and not of MDPI and/or the editor(s). MDPI and/or the editor(s) disclaim responsibility for any injury to people or property resulting from any ideas, methods, instructions or products referred to in the content.

