Article

Simulation Study on Directional Solidification of Titanium–Aluminum Alloy Based on Liquid Metal Cooling Method

1
AECC Beijing Institute of Aeronautical Materials, Beijing 100095, China
2
Beijing Engineering Research Center of Advanced Titanium Alloy Precision Forming Technology, Beijing 100095, China
3
College of Artificial Intelligence, Nanjing University of Aeronautics and Astronautics, Nanjing 211106, China
*
Authors to whom correspondence should be addressed.
Metals 2025, 15(4), 366; https://doi.org/10.3390/met15040366
Submission received: 7 March 2025 / Revised: 19 March 2025 / Accepted: 23 March 2025 / Published: 26 March 2025
(This article belongs to the Special Issue Solidification and Casting of Metals and Alloys (2nd Edition))

Abstract

:
In this study, the ProCast software (version 2014) incorporating the CAFE model is applied to conduct numerical simulation analysis of the directional solidification process of titanium–aluminium alloy cylindrical rods at varying withdraw rates. According to the analytical results, the withdraw rate is a critical parameter that affects the morphology of the solid–liquid interface and the grain growth behavior during the directional solidification process. An increase in the drawing rate facilitates nucleation undercooling within the rod, inducing a shift in grain morphology from columnar to equiaxed. At a drawing rate of 1 mm/min, the solid–liquid interface exhibits the most stable morphology, as characterized by a flat interface. As indicated by further analysis, at this drawing rate, specific grain orientations are eliminated during competitive growth with an increase in solid fraction, culminating in the formation of columnar grain structures. Additionally, the impact of drawing rate on grain size and number is investigated, with an increase observed in grain number with drawing rate and a decrease found in grain size. The findings of this study contribute to a deeper understanding of mechanisms behind the grain morphology evolution of titanium aluminide, providing crucial theoretical support for optimizing directional solidification processes.

1. Introduction

As a class of compounds combining titanium and aluminum, titanium–aluminium (Ti–Al) inter-metallics exhibit a density that is approximately 50% less compared to nickel-based superalloys. These alloys are characterized by excellent high-temperature creep resistance, superior oxidation resistance, and elevated melting points. When the temperature ranges from 600 °C to 800 °C, Ti–Al alloys exhibit a higher specific strength than both titanium and nickel-based alloys [1]. In 2006, General Electric (GE) pioneered the application of the Ti-48Al-2Nb-2Cr alloy in the low-pressure turbine blades of commercial aircraft engines [2]. Despite these advantages, Ti–Al alloys still perform poorly in ductility, which causes difficulty in processing and shaping. For this reason, casting and powder metallurgy are the mainstream forming methods [3]. Among various casting techniques, directional solidification is preferred. However, columnar-to-equiaxed transition (CET) readily occurs during the casting process of Ti–Al alloys, leading to heterogeneous microstructures that significantly degrade material performance [4].
Understanding the CET mechanism is critical for optimizing casting processes and enhancing material properties. Hunt established a seminal criterion for CET, showing that a high G/V ratio favors columnar growth, while a low G/V ratio promotes equiaxed grain formation. Hunt further demonstrated that CET is completed when the equiaxed grain volume fraction reaches 0.49, fully suppressing columnar growth [5]. Wang et al. combined a solute diffusion-controlled model (CA–FD) with cellular automaton (CA) to simulate the directional solidification of Ti-44Al alloys, demonstrating that low thermal gradients (G < 10 K/mm) and low withdrawal rates promote the columnar-to-equiaxed transition, whereas high thermal gradients (G > 30 K/mm) combined with high nucleation undercooling (ΔTn ≥ 1 K) suppress CET [6]. Lapin et al. investigated the directional solidification behavior of Ti-46Al-8Nb and Ti-46Al-8Ta alloys and established a dendrite arm spacing model applicable to TiAl-based alloys. Their study revealed that, in the Ti-46Al-8Ta alloy, rapid cooling induced the formation of a massive γ-phase, which obscured the columnar-to-equiaxed transition interface. The critical condition for CET in the Ti-46Al-8Ta alloy was determined to occur at a threshold value of G/V ≤ 6.92 × 10⁶ K·s/m2 [7]. Wang et al. investigated the effects of different withdrawal rates on the macroscopic and microscopic structures, as well as the mechanical properties, of TiAl alloys prepared by cold crucible directional solidification (CCDS). They found that, when the growth rate was ≤1.0 mm/min, the columnar grains were continuous, and the β phase was the dominant phase. At a growth rate of 1.2 mm/min, discontinuous structures appeared, with the emergence of α-phase mixed dendrites [8]. Lenart et al. successfully simulated the columnar-to-equiaxed transition in directional solidification of Inconel 718 alloy by coupling the phase field method with the lattice Boltzmann method. The model elucidated the regulatory effects of the temperature gradient and solidification rate on microstructure evolution, thereby validating the theoretical criteria from the Hunt and Kurz models. Additionally, a CET solidification map was constructed to delineate the transition boundaries governed by the dimensionless parameter G2/Vp [9]. Xu et al. investigated the influence of withdrawal rate on the columnar-to-equiaxed transition in high-Nb-containing TiAl alloys during cold crucible directional solidification. They found that, under a constant temperature gradient of 30 K/mm, the CET was dominated by the withdrawal rate. A critical withdrawal rate of 10 μm/s was identified, below which columnar grains were formed, and above which the fraction of equiaxed grains increased significantly. Complete equiaxed microstructures were achieved at a withdrawal rate of 16.7 μm/s [10]. Qu et al. investigated the equiaxed-to-columnar transition in Ti46Al8Nb0.5B alloy through directional solidification experiments and microstructural analysis. They revealed that macro-segregation is the dominant mechanism governing the CET, with fluctuations in Al content at the level of 0.3 at% sufficient to alter the solidification path [11].
Promoting the growth of molten metal in a direction opposite to the heat flow, this process results in columnar or single crystalline structures oriented in a specific crystallographic manner. Due to this orientation, the material possesses exceptional mechanical properties along a defined axis [12]. Depending on the exact cooling method used, directional solidification techniques can be divided into different categories, of which the Power Reduction Method (PD), High-Speed Solidification Method (HRS), and Liquid Metal Cooling Method (LMC) are the primary examples [13]. Notably, the LMC method has attracted widespread attention for its industrial potential. Its defining feature lies in the use of a liquid metal as a cooling medium for the mold shell, as achieved by submerging the shell in a liquid metal bath. This method is applicable to generate a steep temperature gradient [14].
With the emergence of computer numerical simulation technology, the casting industry has been revolutionized, with numerical simulation transformed into a powerful research tool. When this technology is applied, the directional solidification process in titanium–aluminium alloys can be visualized, which not only facilitates the study of defect formation mechanisms but also supports the optimization of process parameters. This is conducive to significantly reducing production costs, expediting the manufacturing time, and enhancing the overall efficiency of the manufacturing process [15,16]. Such advancements play a pivotal role in materials science and engineering, particularly under the context of alloy development and processing techniques. As a critical parameter, the drawing rate exerts a significant influence on the directional solidification process, which determines the patterns of temperature distribution and crystallographic growth within the solidifying material. Traditionally, empirical engineering knowledge provides guidance on the selection of an optimal drawing rate [17].
In this study, ProCast software (version 2014), which incorporates the Cellular Automata-Finite Element (CAFE) model, is applied to investigate the macroscopic temperature fields, solidification behavior, and microstructural evolution in titanium–aluminium alloy cylindrical test rods. At six different drawing rates, an analysis is conducted to thoroughly assess their impact on solidification dynamics.

2. Materials and Methods

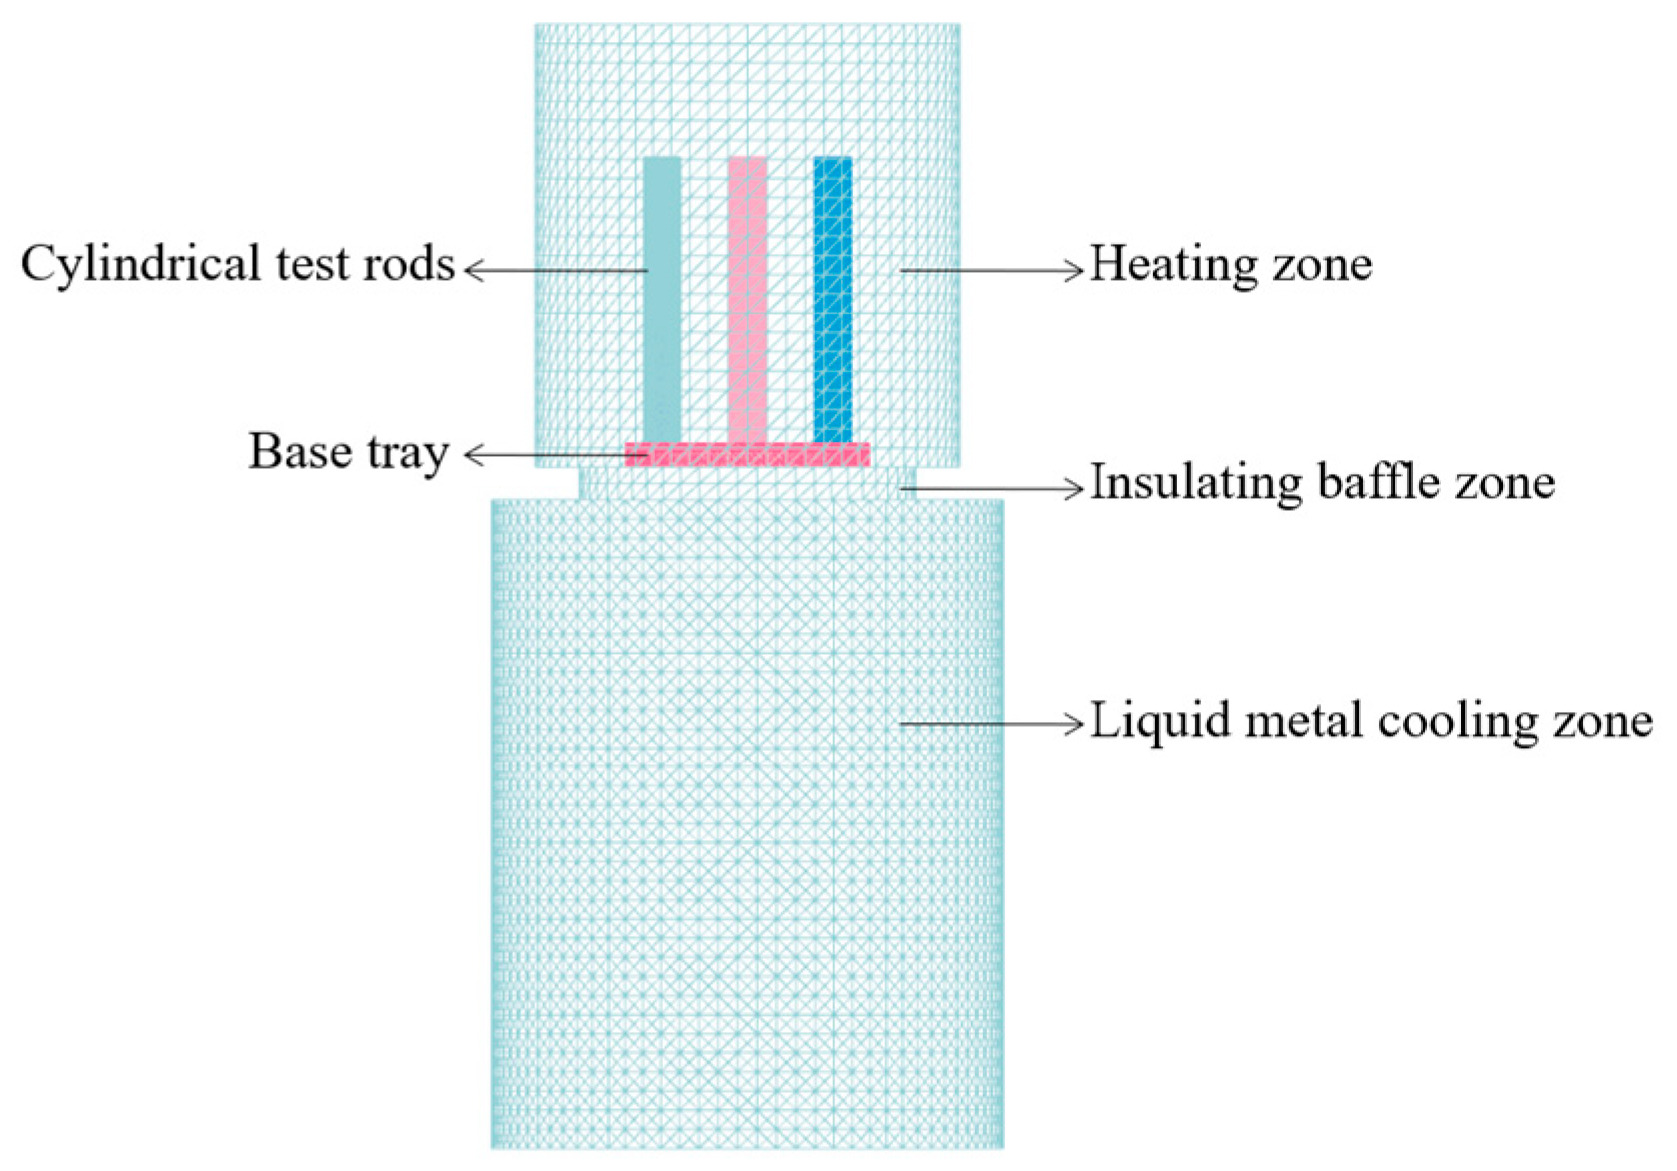
2.1. Three-Dimensional Model

A three-dimensional computational model was constructed using UG software (version 8.0), featuring a cylindrical test rod with a diameter of 15 mm and a length of 300 mm. The Bridgman method was used to design the directional solidification apparatus [18]. By facilitating the controlled descent of molten metal from the top to the bottom of the cooling zone through a drawing mechanism, this method is applicable in establishing a pronounced temperature gradient along the vertical axis. This gradient is beneficial for promoting the directional growth of crystals from the base of the rod upwards, which continues until the entire volume of molten metal has transitioned into a solidified state. Ensuring precise control over the solidification dynamics, this approach plays an essential role in manipulating the microstructural attributes of the final product.
For higher computational efficiency, the model was simplified to encompass three primary regions: a heating zone, an intermediate insulating baffle zone, and a liquid metal cooling zone. The cylindrical test rods were positioned on a base tray made of molybdenum alloy. For the purposes of this study, the influence of the drawing device was treated as negligible and thus excluded from the model, as shown in Figure 1. Through this streamlined approach, a focused analysis was conducted on the thermal dynamics within the critical zones of the directional solidification process.

2.2. Microstructure Mathematical Model

The solidification of titanium–aluminium alloys is highly complex. The numerical simulation methodologies applied to capture this process include various stochastic approaches, such as the Monte Carlo and cellular automaton methods, the phase-field method, and a series of deterministic methods, like the Cellular Automata–Finite Element (CAFE) model [19]. The solidification of metals is characterized by the nucleation and growth phases of crystals. As revealed by prior research, the nucleation rate is determined by the degree of undercooling and the elapsed time, whereas the growth rate is affected by the extent of undercooling. The temperature gradient at the solid–liquid interface acts as a major driving force for crystal growth.
In line with statistical methodologies, Rappaz et al. conducted an in-depth analysis of the nucleation process, with a continuous nucleation model proposed. Based on the Gaussian distribution, this model represents a robust framework used to predict nucleation events within the alloy [20]. Crucial to the accurate simulation of microstructural evolution during the solidification phase, this model provides insights into the formation and growth of crystalline structures within the titanium–aluminium alloy.
The grain generation model is expressed as follows:
d n d ( Δ T ) = n m a x Δ T σ 2 π exp 1 2 Δ T Δ T N Δ T σ 2
where Δ T represents the nucleation undercooling; d n / d ( Δ T ) denotes the rate of change in nucleation number; n m a x indicates the maximum nucleation density for heterogeneous nucleation; Δ T N represents the maximum undercooling for heterogeneous nucleation; and Δ T σ refers to the standard deviation undercooling.
The grain growth model based on the KGT model is expressed as follows [21]:
ν = a 2 Δ T 2 + a 3 Δ T 3
where ν represents the growth rate; a 2 and a 3 refer to the growth coefficients; and Δ T represents nucleation undercooling.

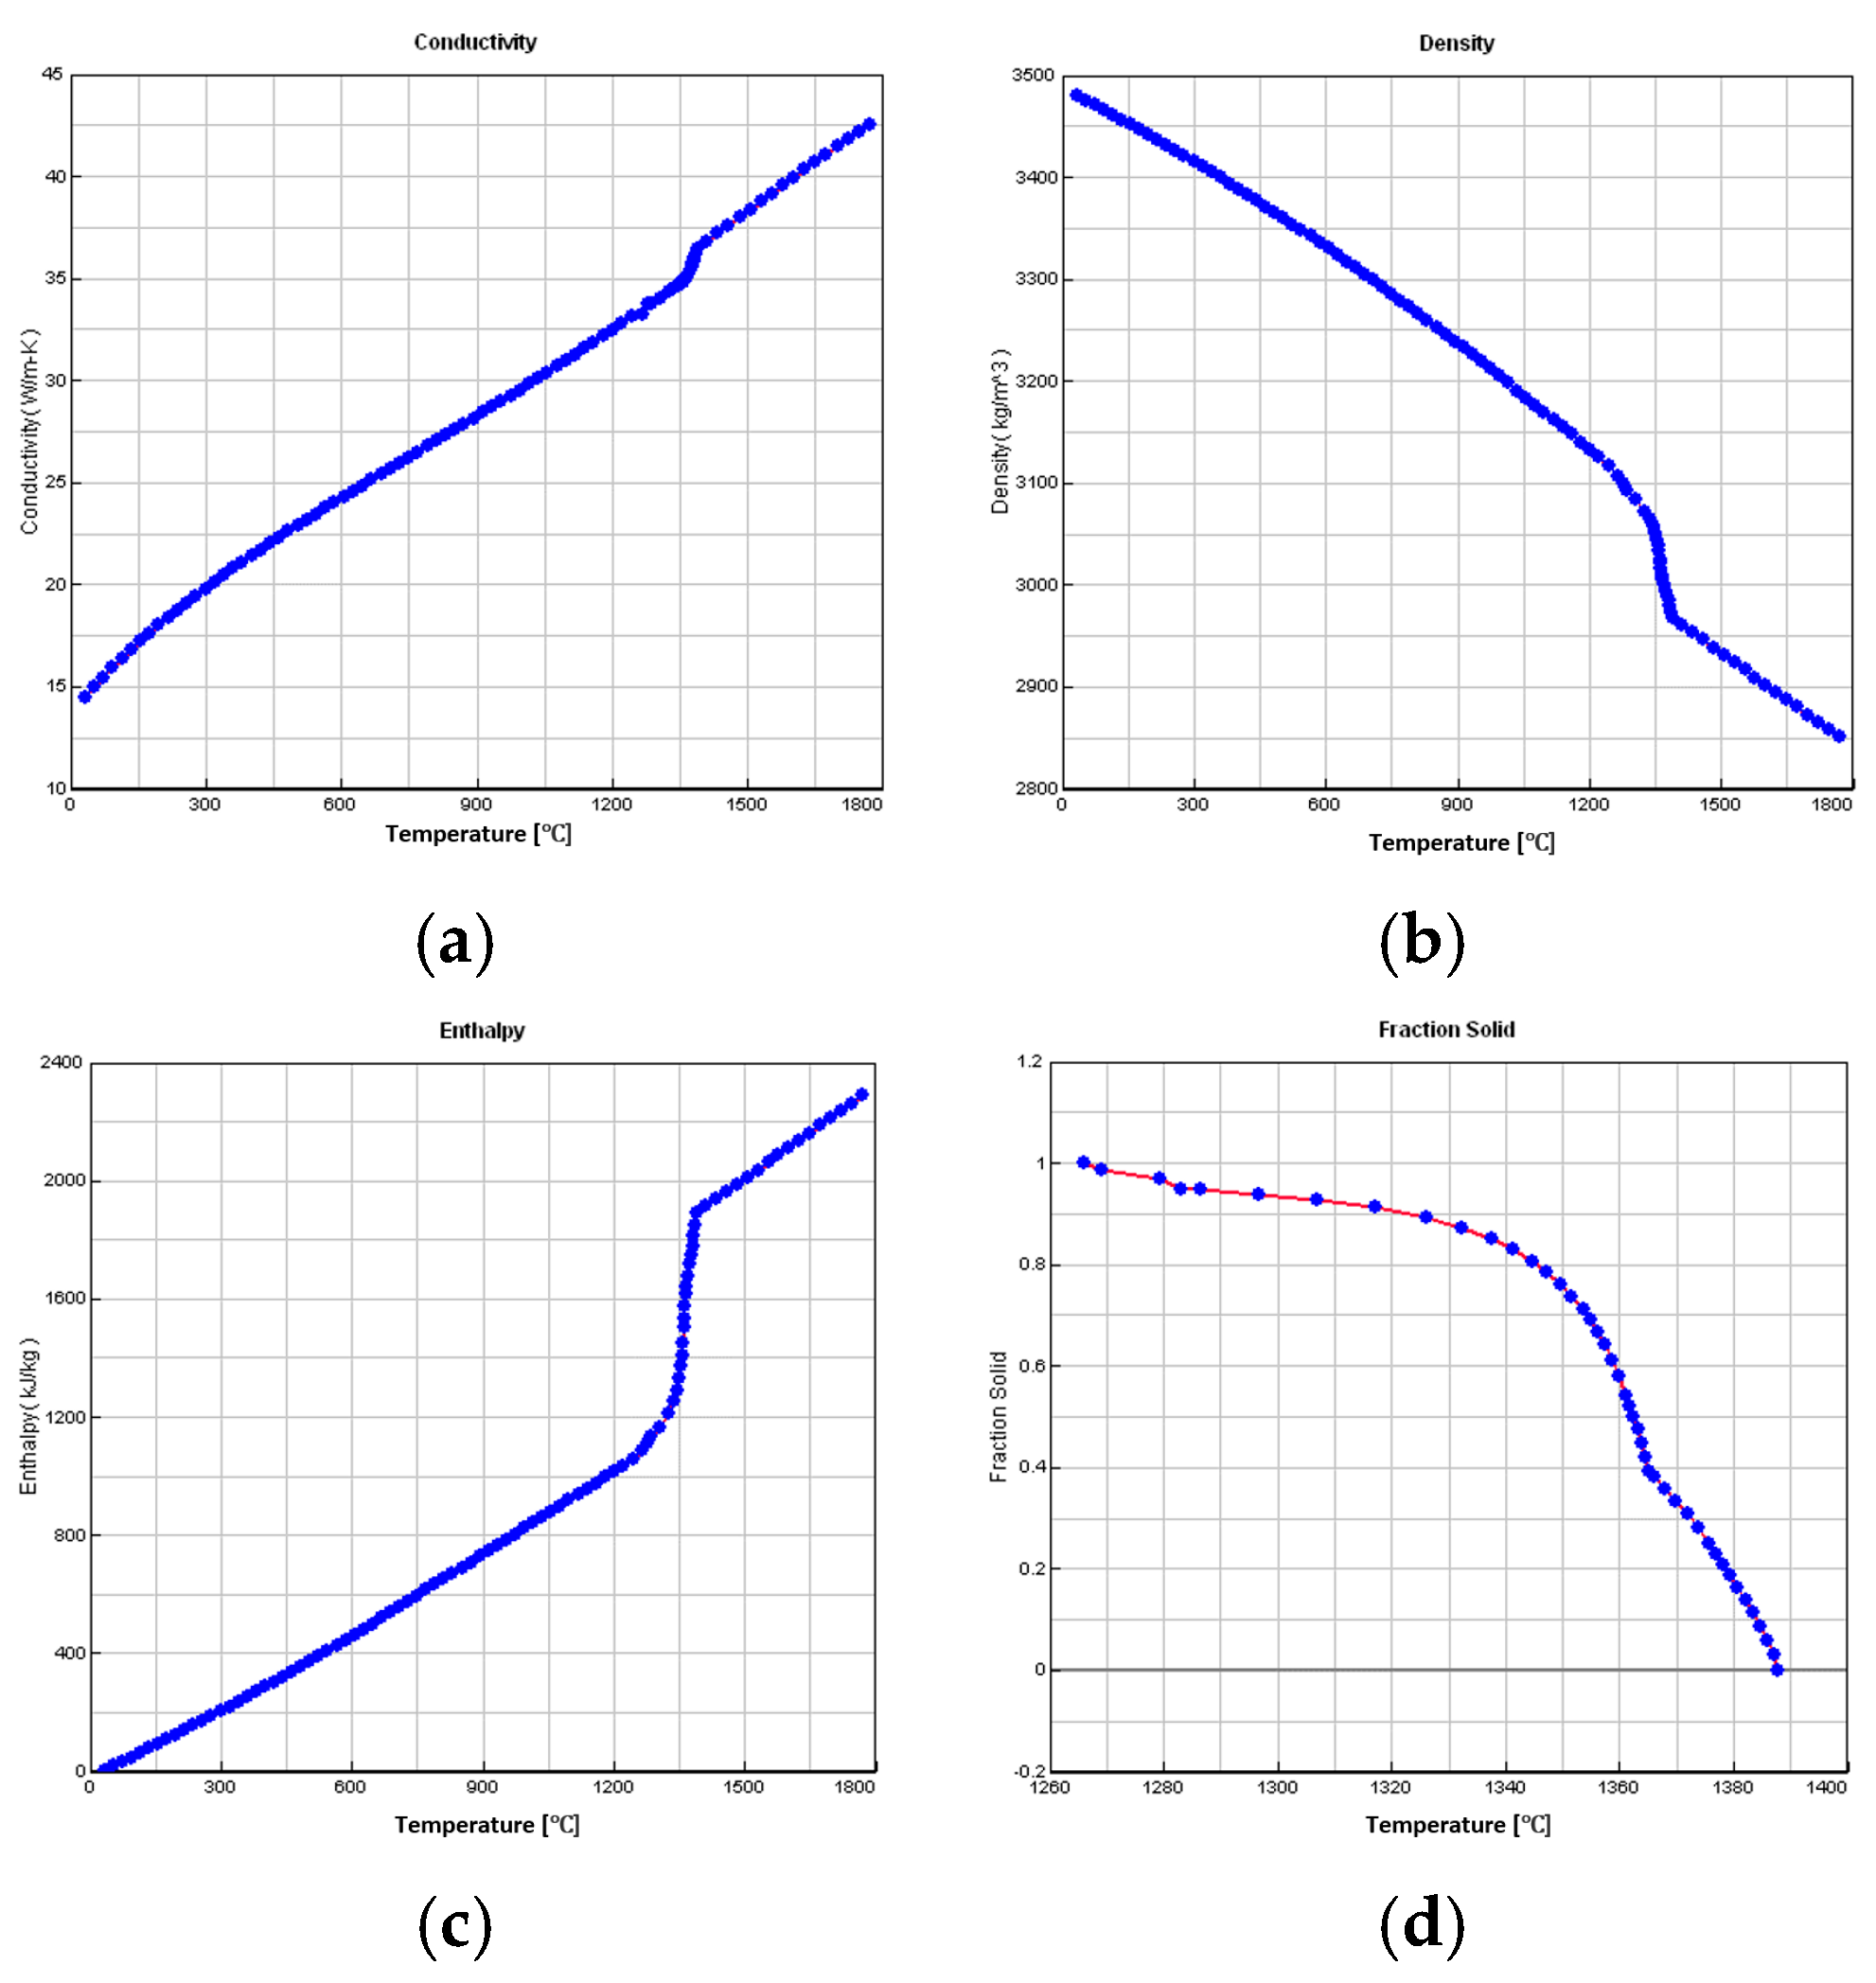
2.3. Material Parameters and Thermal Properties

The alloy material studied in this project is Ti-48Al-2Cr-2Nb. The composition of the alloy is shown in Table 1. ProCast software (2014) was applied to computationally determine the thermodynamic properties of the titanium–aluminium alloy, as detailed in the composition presented earlier. Figure 2 shows these calculation results. Considering its favorable inert characteristics, the mold shell material was selected as zirconia sand, which minimizes reactivity with the titanium–aluminium alloy. Made of molybdenum alloy, the base tray was selected for its high-temperature strength and thermal conductivity. As the liquid metal coolant used in the directional solidification process, a gallium–indium–tin alloy was chosen for its low melting point and high thermal conductivity, both of which are essential for achieving the expected cooling rates and temperature gradients. These material selections play a critical role in controlling the solidification kinetics, which leads to the desirable microstructure of titanium–aluminium alloy.

2.4. Boundary Conditions

During directional solidification, heat transfer is largely affected by two mechanisms: thermal conduction and thermal radiation. Thermal conduction occurs not only at the interfaces between the mold shell and the casting, but also between the casting and the chill plate. This process is significant to the controlled transfer of heat away from the casting. Conversely, thermal radiation is the primary mode of heat exchange between the mold shell and the external furnace environment.
For accurate simulation of these conditions, the heating process was modeled, with radiation heat transfer as the focus. The radiation coefficient for the heating zone was calibrated to 0.8, corresponding to an external heating temperature of 1600 °C. Under this setting, it can be ensured that the mold shell and the casting are subjected to a uniform and intense heat flux, which is essential for initiating and maintaining the directional solidification process. For the intermediate baffle zone and the cooling zone, the radiation coefficients were adjusted to 0.6. Through this nuanced approach to radiation coefficients, a more precise control can be imposed on the thermal environment, which has effect on the solidification kinetics and the resultant microstructure of the titanium-aluminium alloy. These boundary conditions were carefully defined to replicate the actual foundry conditions, thus providing a robust framework for the numerical simulation of the directional solidification process.
With variations in the drawing position, the external heat exchange characteristics of the mold shell were modulated in real time. To account for this, its application programming interface (API) was used to develop a custom program as an extension to the ProCast software. This secondary development was conducted in the C programming language to record the dynamic changes in external heat transfer coefficient of the mold shell, which are essential for reflecting the thermal behavior accurately during the directional solidification process. The implementation process is detailed as follows.
During the drawing process, the heat transfer coefficient is maintained at a low value of 10 W/(m2·K) in the heating zone. Immediately after entry of the casting into the liquid metal cooling zone, the heat transfer coefficient increases sharply to 2000 W/(m2·K). This is purposed to simulate the intense heat extraction occurring when the casting comes into contact with the liquid metal, which is conducive to directing the solidification path and manipulating the final microstructure of the titanium–aluminium alloy. Adapted to heat transfer coefficient modulation, this tailored approach is critical for a high-fidelity simulation of the directional solidification process.
The relevant experimental parameters to drawing speed were carefully selected, encompassing a range of different values: 0.5 mm/min, 1 mm/min, 2 mm/min, 3 mm/min, and 4 mm/min. These velocities provide a comprehensive spectrum required to evaluate their impact on the directional solidification process.
The nucleation parameters were determined using empirical data, including an average undercooling Dtm of 20 K, a standard deviation Dts of 5 K, and a maximum nucleation density of 200 nuclei per cubic centimeter. These parameters are indispensable for determining the initial stages of solidification and the subsequent microstructural development. According to previous experimental observations, the grain growth coefficient was assigned a value of 5.85 × 10⁻⁶. This coefficient is crucial for modeling the growth of grains during the solidification process.

3. Results

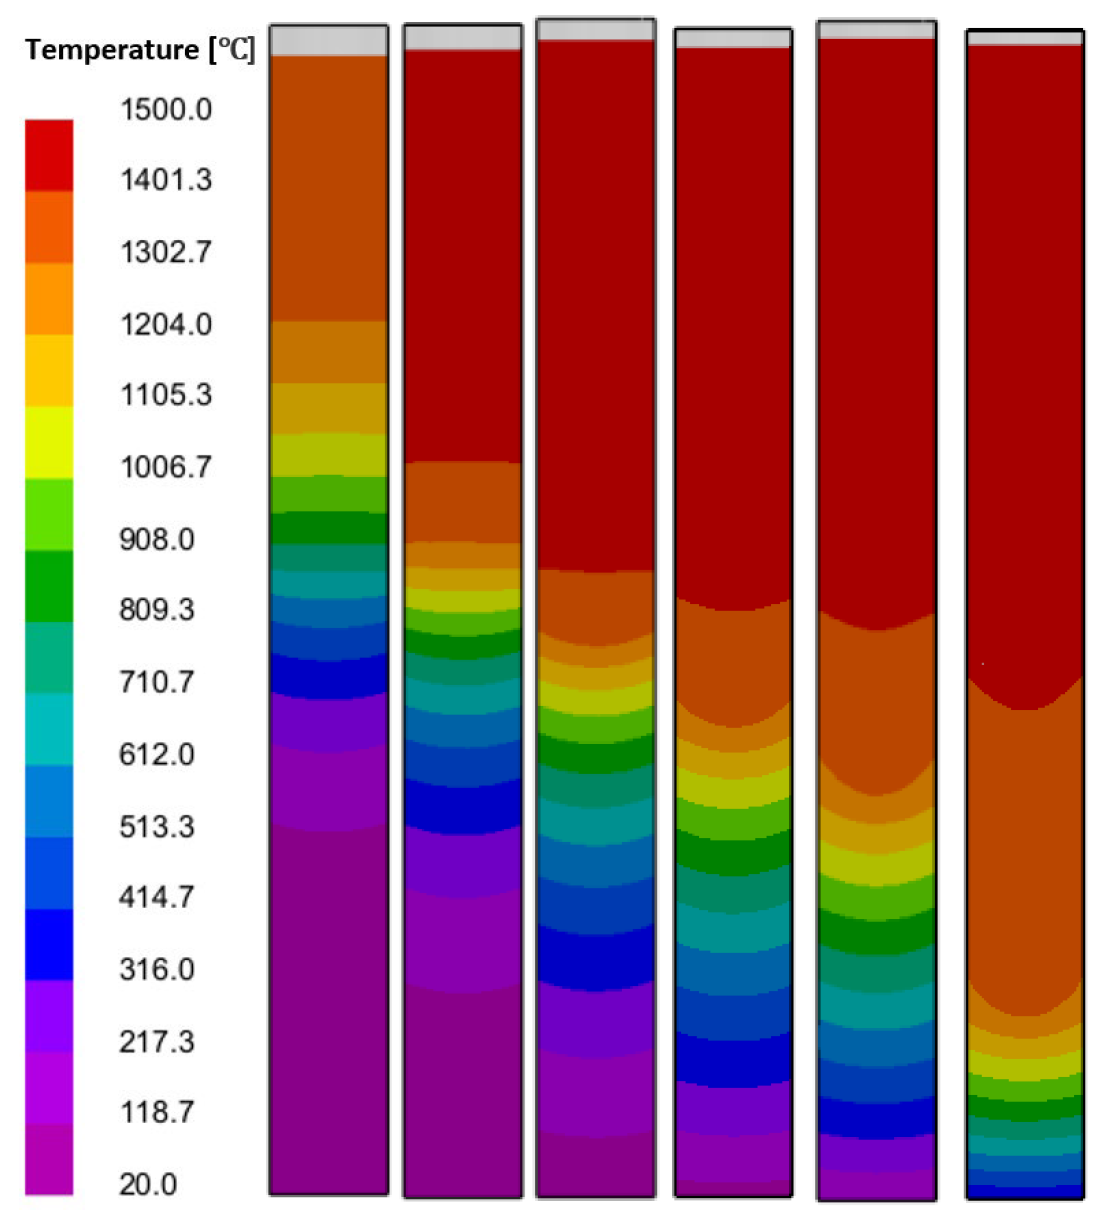
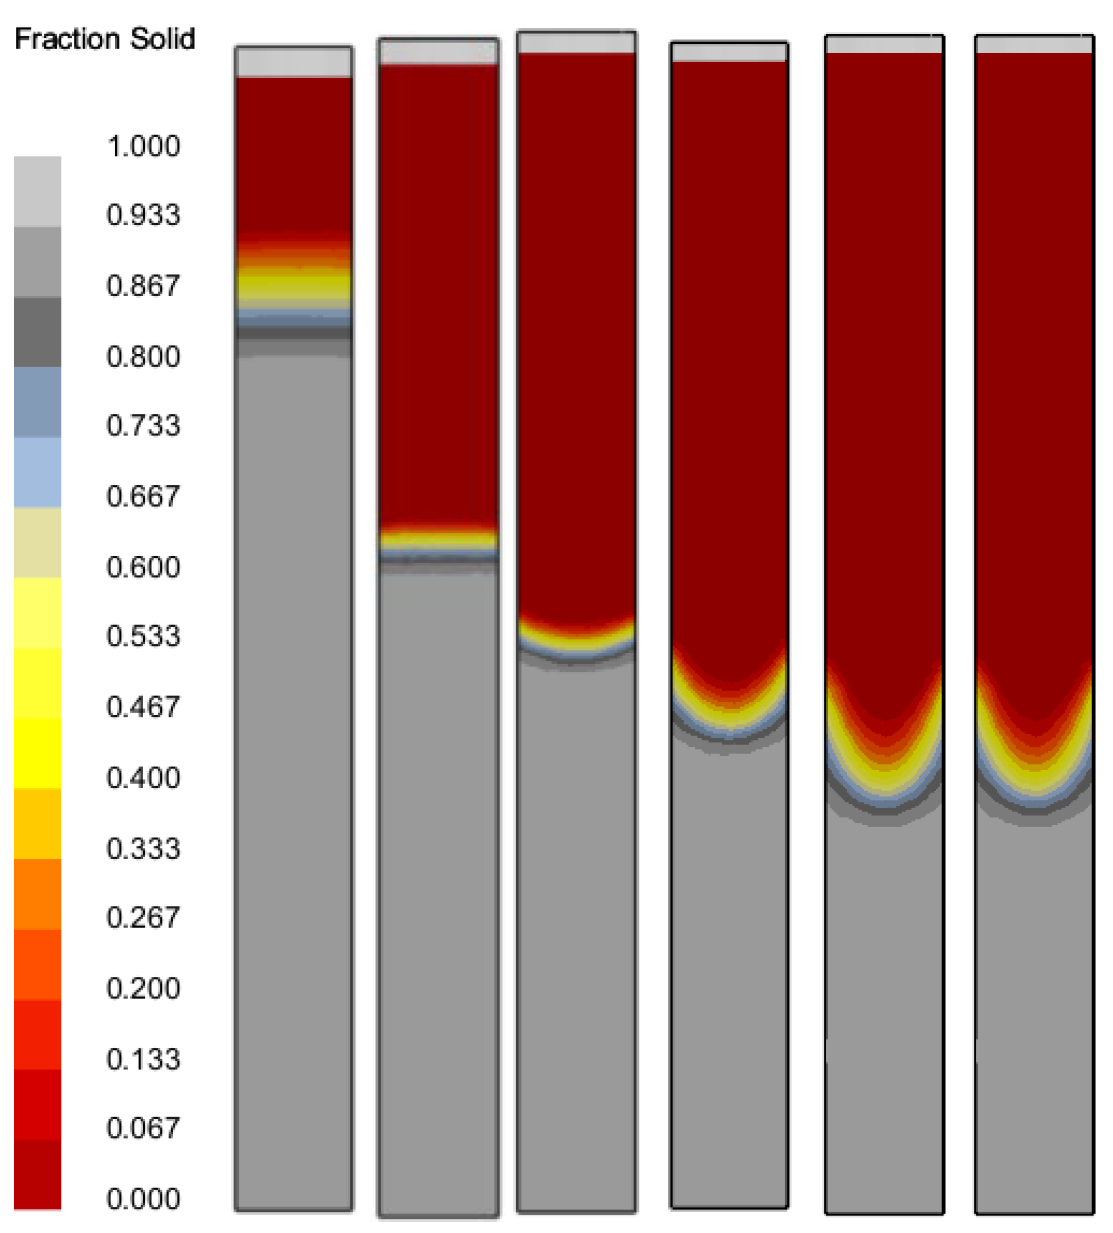
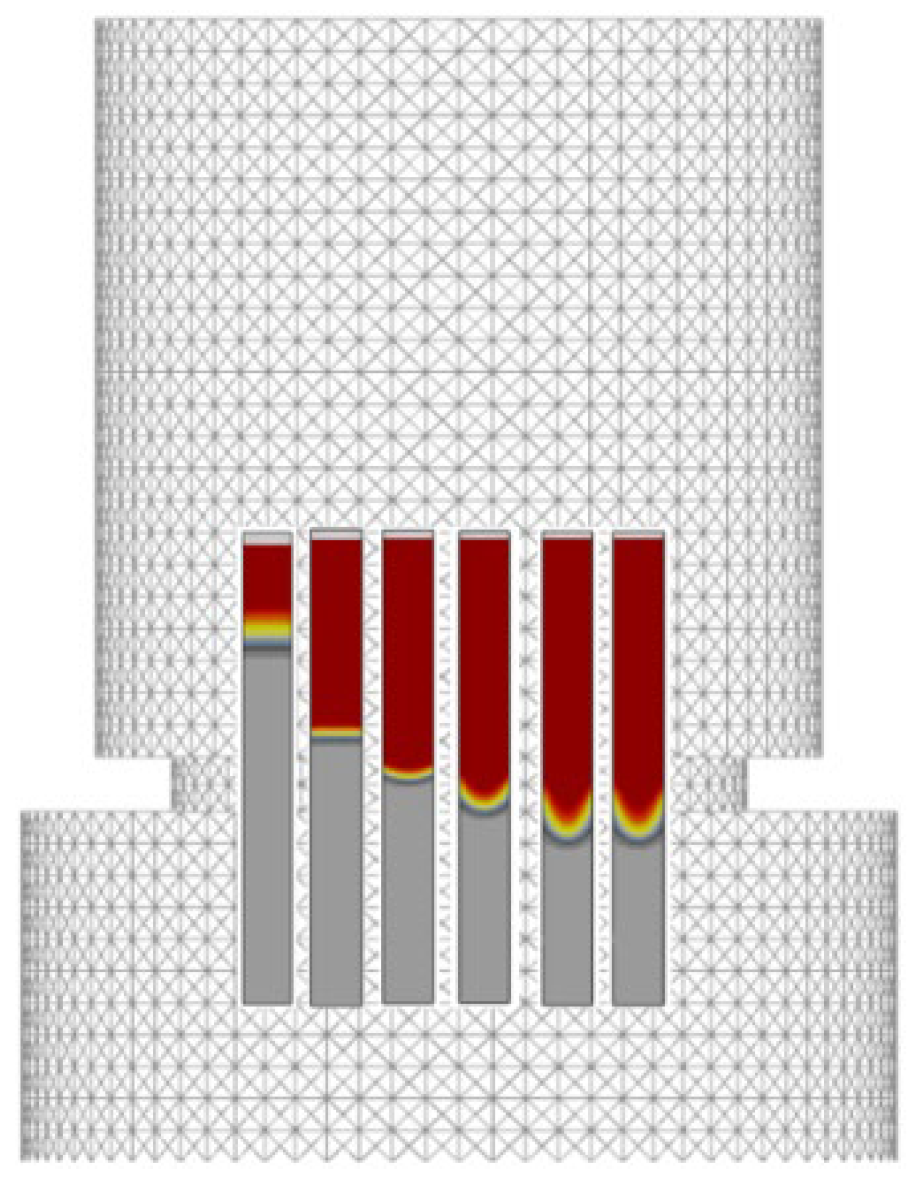
3.1. The Influence of Drawing Speed on the Temperature Field and Solidification Field of the Test Rods

Figure 3 illustrates the temperature distribution within the test rods as they reach an equivalent position within the liquid metal cooling zone at different drawing speeds. Notably, there is a significant thermal gradient observed in the intermediate baffle area, which represents a critical region for heat exchange during the solidification process.
As the drawing speed increases, there is a progressive downward shift observed in the solid–liquid interface. Indicative of the dynamic thermal conditions within the system, this migration has a significant effect on the solidification kinetics. Meanwhile, the isothermal lines, which represent the lines of constant temperature, undergo morphological transformation. First aligned in a straight configuration, they are transformed into a concave shape as the drawing speed increases incrementally. As a direct response to the change in thermal landscape, this shift in isothermal line configuration highlights the important role of drawing speed in the thermal profile within the solidifying alloy. These observations are beneficial for understanding the interplay between processing parameters and the thermal behavior of the material during directional solidification.
Figure 4 illustrates the evolution of the solidification interface at varying drawing speeds. Obviously, an increase in drawing speed causes the shift in interface morphology from a planar to a concave configuration.
At an optimal drawing speed of 1 mm/min, the solid–liquid interface remains planar, exhibiting the highest stability in configuration. This is attributed to a balanced heat transfer rate that promotes uniform solidification across the interface. However, the interface characteristics vary significantly given the deviations from this optimal speed.
When the drawing speed exceeds the recommended threshold, the rapid immersion of the test rod into the liquid metal renders inadequate the transmission of internal heat downwards. Concurrently, the mold shell surface’s accelerated heat dissipation rate precipitates the premature formation of a solidification layer along the mold wall. Because of this uneven heat distribution, a concave solidification interface results.
Conversely, the mushy zone, as the intermediate region between solid and liquid phases, expands excessively at extremely low drawing speeds. In an overextended mushy zone, the solidification process can be complicated, as it may accommodate inhomogeneities and increase the likelihood that such defects as porosity or segregation arise.
Figure 5 illustrates the solid–liquid interface position within the test rod under different drawing speeds. At the relatively low drawing speed of 0.5 mm/min, the rate is deemed insufficient. Consequently, the base’s cooling effect is more significant compared to the liquid metal coolant. Due to this imbalance, the solid–liquid interface is positioned far away from the intermediate baffle separation area, which indicates a slower rate of heat extraction from the system.
At a drawing speed of 1 mm/min, the solid–liquid interface is observed to be slightly above the intermediate baffle zone, which results from the cooling effect exerted by the base on the liquid metal. As the increase in drawing speed continues, the solid–liquid interface progressively descends, moving closer to the liquid metal cooling area. This downward migration demonstrates the intensified cooling effect as the test rod stays in the liquid metal for longer. Accordingly, heat transfer occurs more rapidly from the rod to the coolant.

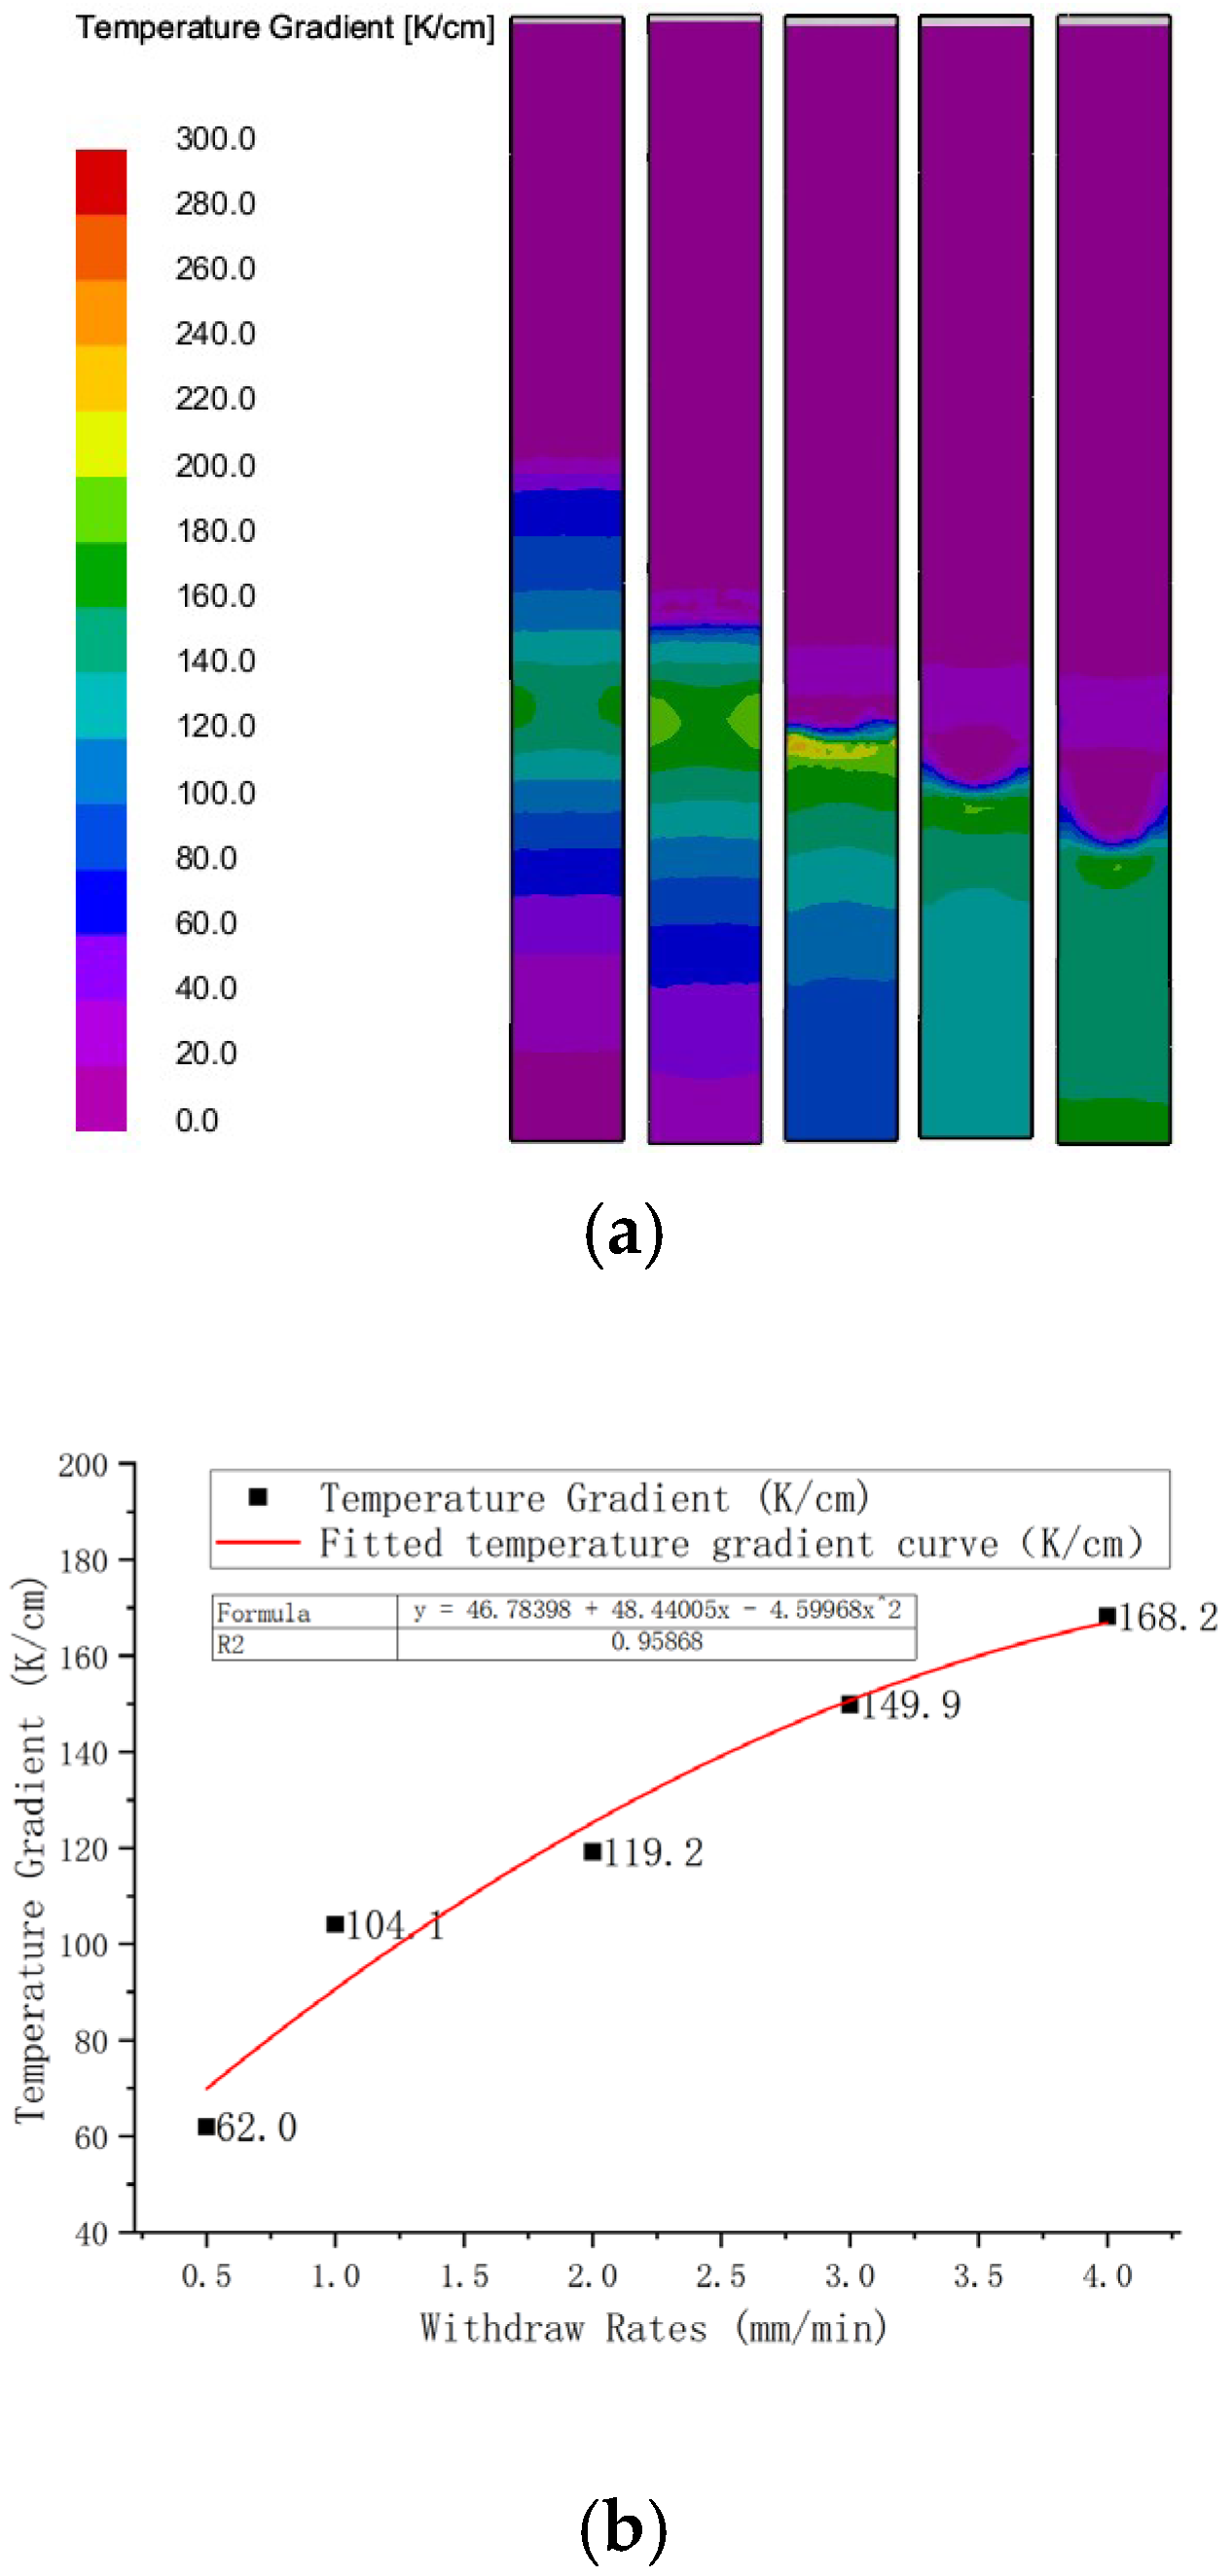
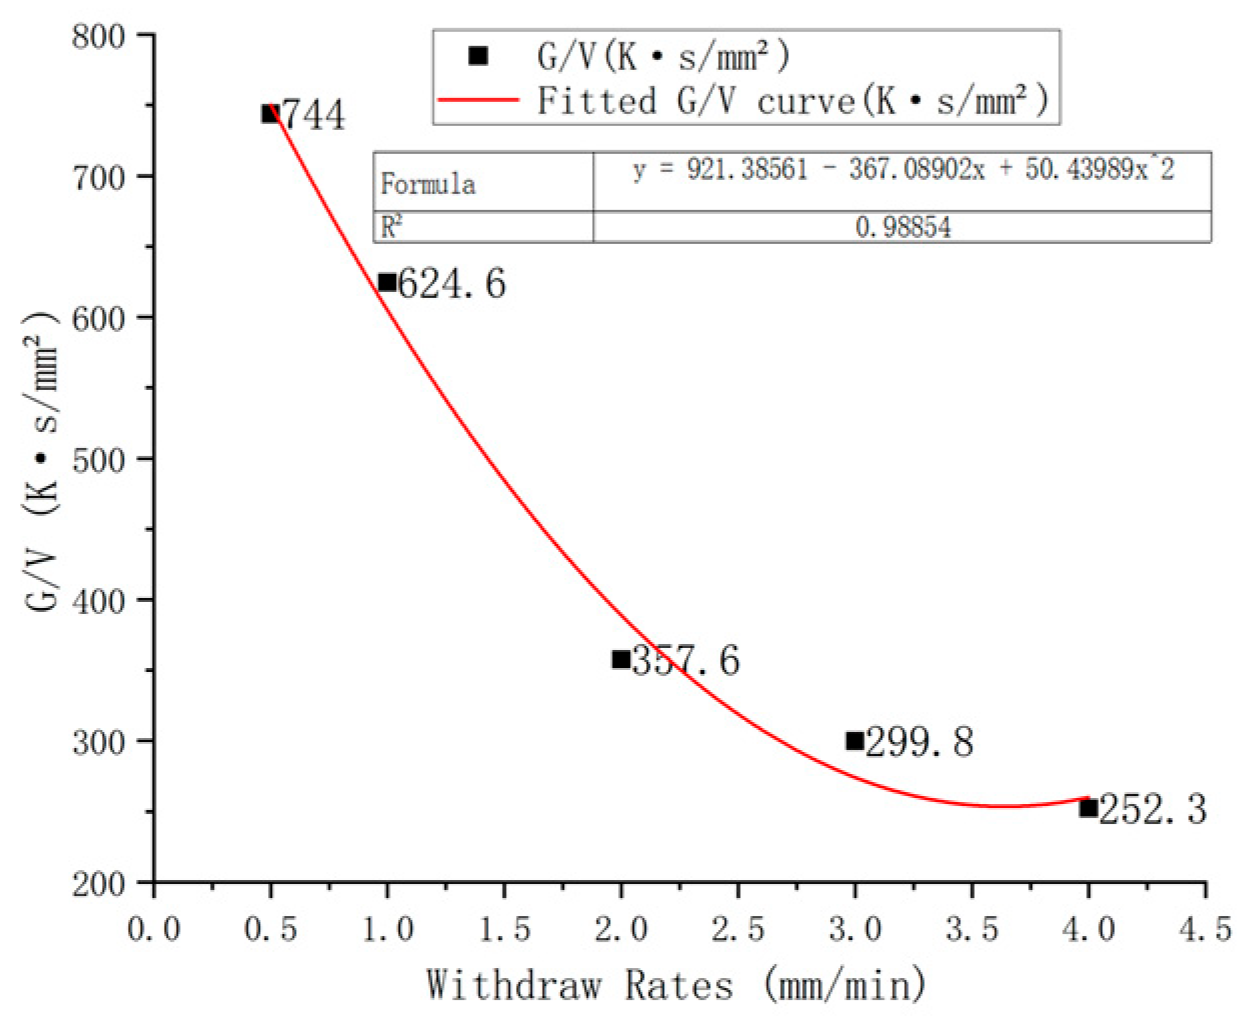
3.2. The Influence of Drawing Speed on the Temperature Gradient at the Solid–Liquid Interface of the Test Rods

The temperature gradient at the solid–liquid interface exhibited a dependence on the withdrawal rate. At a withdrawal rate of 0.5 mm/min, the two-phase (solid–liquid) zone became broader, resulting in a less distinct solid–liquid interface. As evident from Figure 6, increasing the withdrawal rate from 0.5 to 3.2 mm/min enhanced the interfacial temperature gradient from 62.0 K/cm to 168.2 K/cm, demonstrating a marked correlation between temperature gradient and withdrawal rate. A linear regression analysis yields the following empirical relationship:
G = 4.6 V 2 + 48.44 V + 46.78
where G represents the temperature gradient (K/cm) and v denotes the withdrawal rate (mm/min). This equation quantitatively establishes the proportional dependence of interfacial thermal conditions on withdrawal kinetics.
Figure 7 presents the CET (columnar-to-equiaxed transition) diagrams established for different alloy systems, where the CET line in the log(V)-log(G) coordinate system demarcates the equiaxed grain region (above the line) from the columnar grain zone (below the line). In this study, five sets of simulation experiments were conducted with limited data volume. Nevertheless, emerging trends from the existing data demonstrate that, under a specified temperature gradient, the critical withdrawal rate required to trigger CET transition in Ti-48Al-2Cr-2Nb surpasses those of both Ti-46Al-8Nb alloy and conventional superalloys, while approaching the values characteristic of the Al-Cu alloy system.
Figure 8a displays the longitudinal temperature gradient profile along the purple-dashed line position (see inset schematic) at a withdrawal rate of 1 mm/min. The dashed contour in Figure 8b demarcates the central baffle zone, which functions as a thermal transition region between the upper furnace hot zone and the lower liquid metal cold zone. A sharp gradient escalation to 168.2 K/cm is observed in this transition zone, representing a 215% increase compared to adjacent regions. This intensified gradient arises from compromised insulation efficiency (thermal conductivity: 8.7 W·m−1·K−1) within the baffle structure, driving lateral heat dissipation toward the specimen’s periphery. Consequently, dual gradient peaks emerge at ±2.5 mm off-axis positions, as quantified in Figure 8a.
The ratio of the temperature gradient to the solidification rate, G/V, serves as a critical parameter in determining the morphology of the solidification interface [23]. As shown in Figure 9, the G/V ratio (temperature gradient to growth velocity ratio) decreases with increasing withdrawal rate. Combined with the solid–liquid interface analysis in Section 2.1, the critical G/V value for Ti–Al alloys is determined to be 624.6 K·s/mm2. Below this threshold, the solid–liquid interface becomes unstable, transitioning from planar to non-planar morphology due to constitutional undercooling and breakdown of interfacial stability. This critical value serves as a key parameter for optimizing directional solidification processes to maintain planar solid–liquid interfaces.

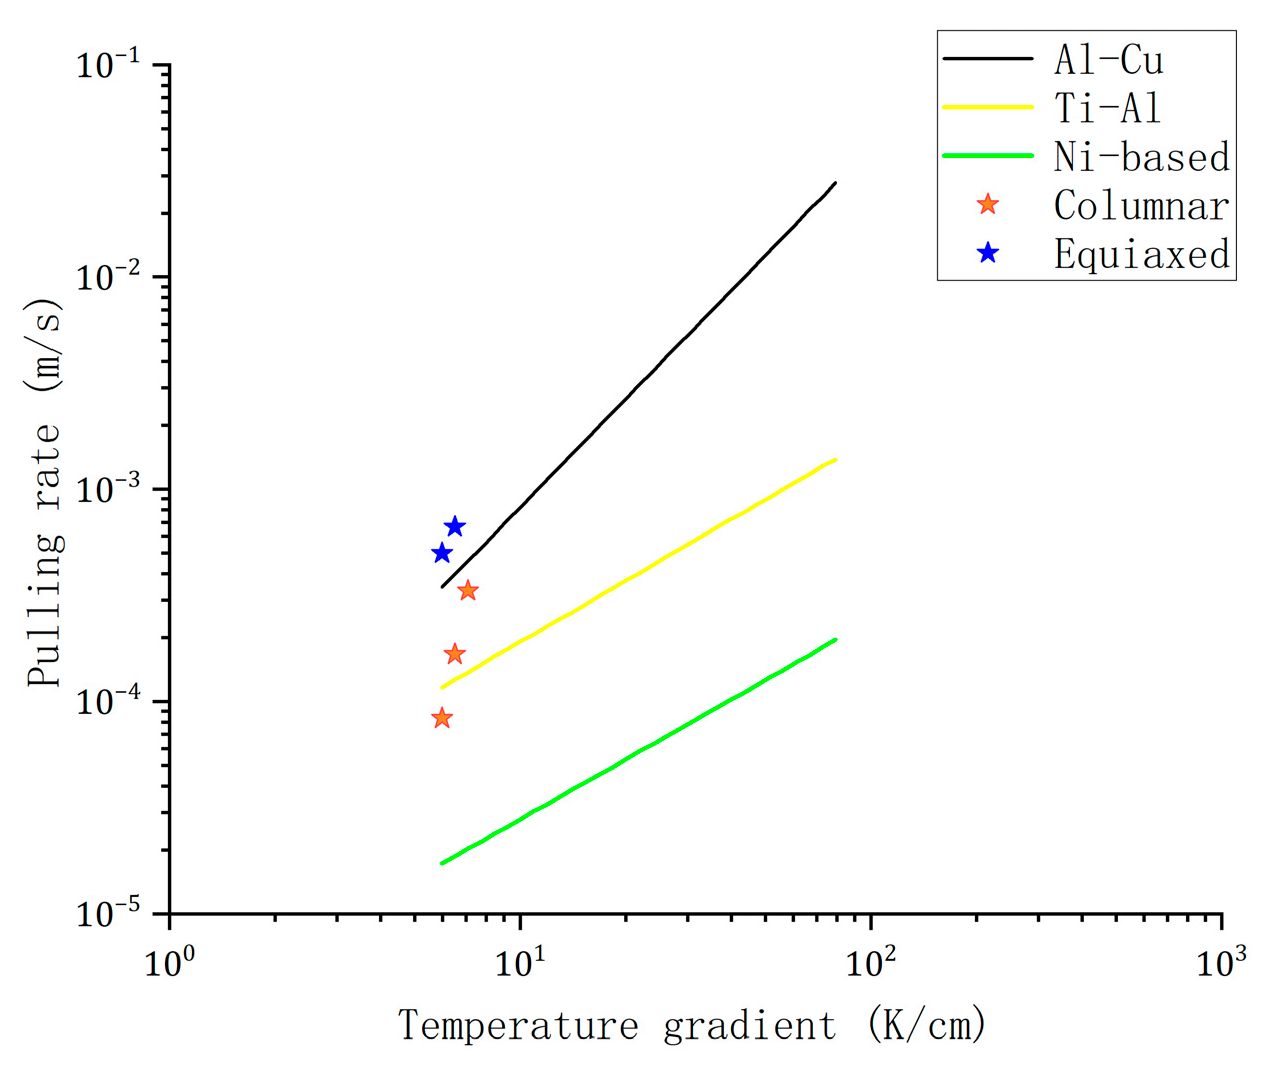
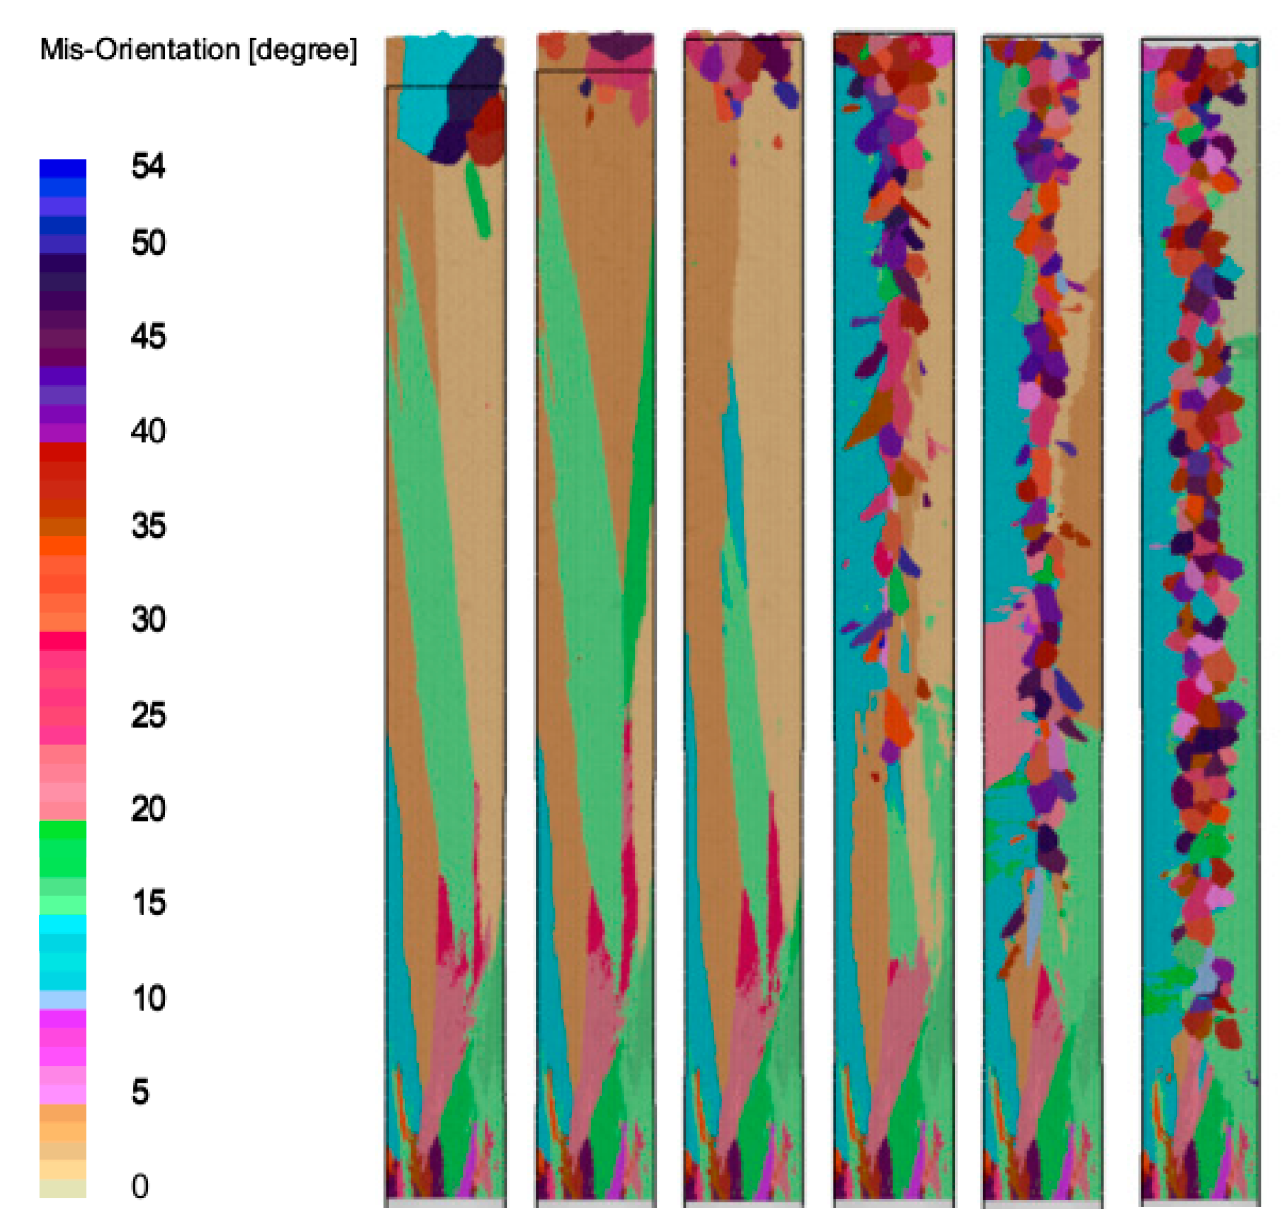
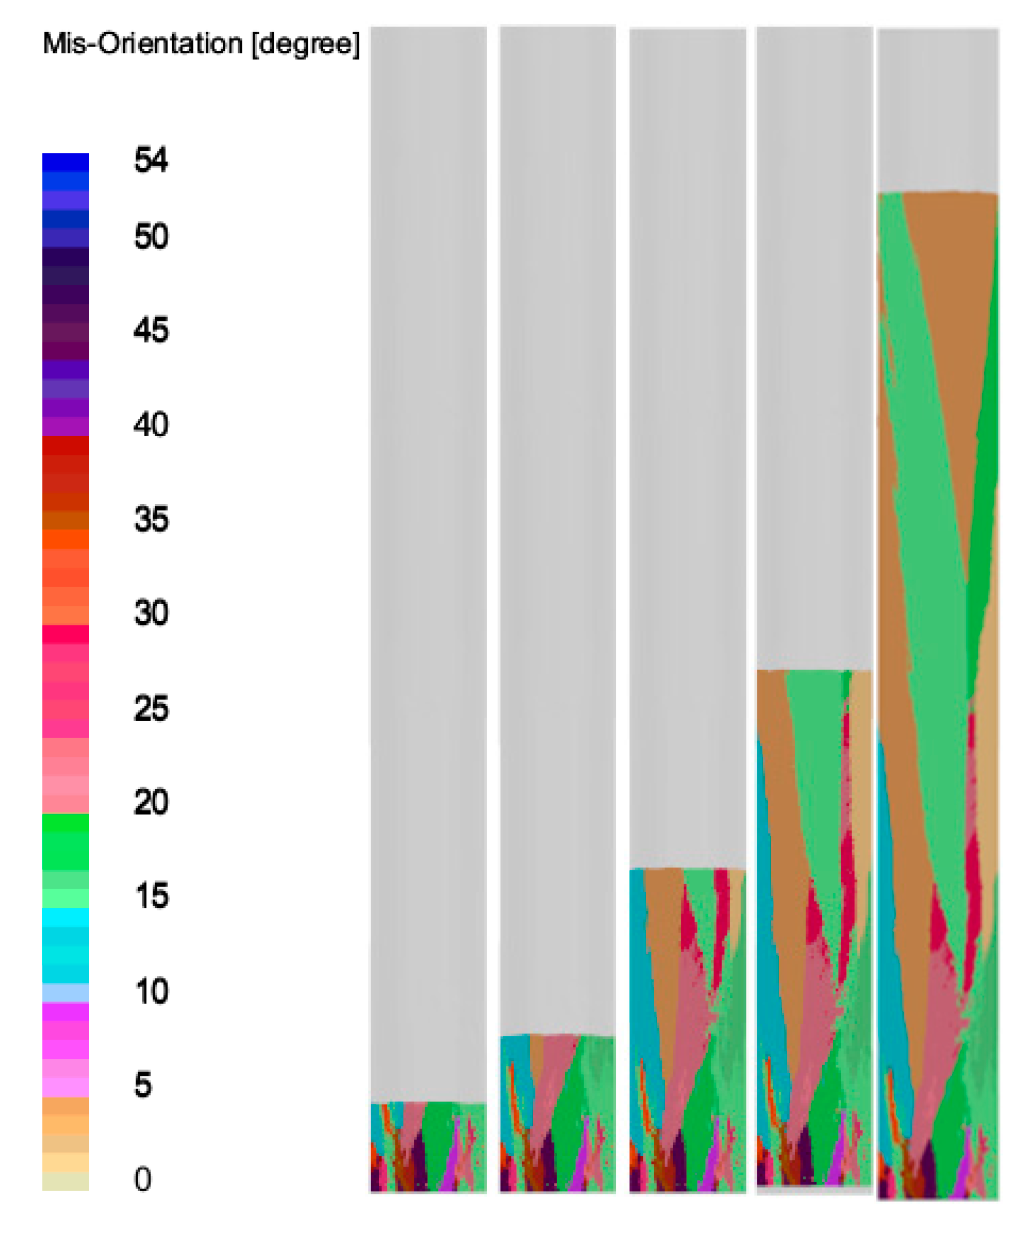
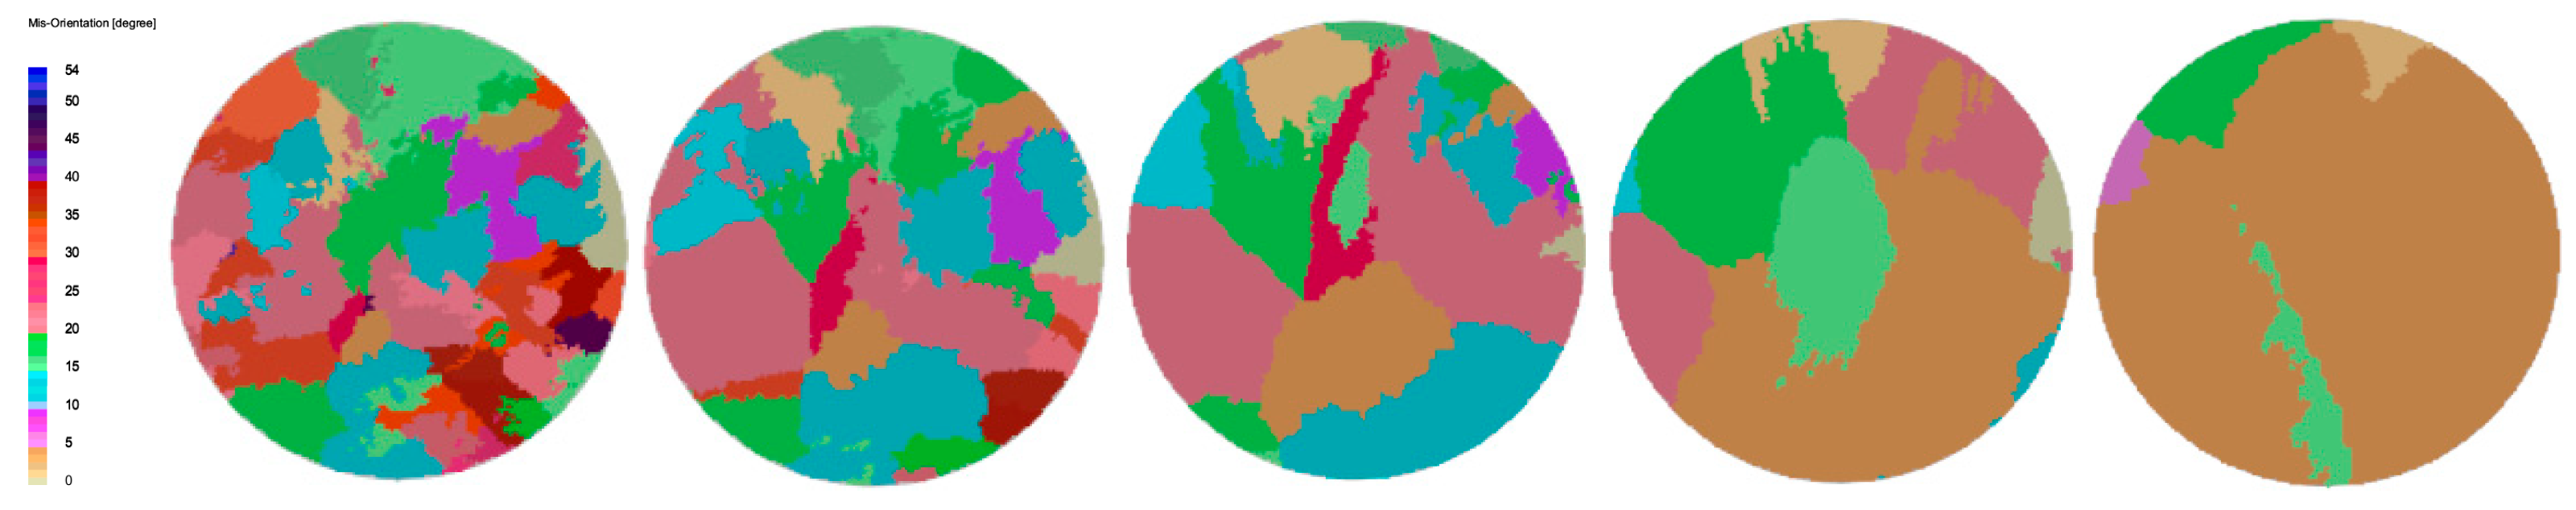
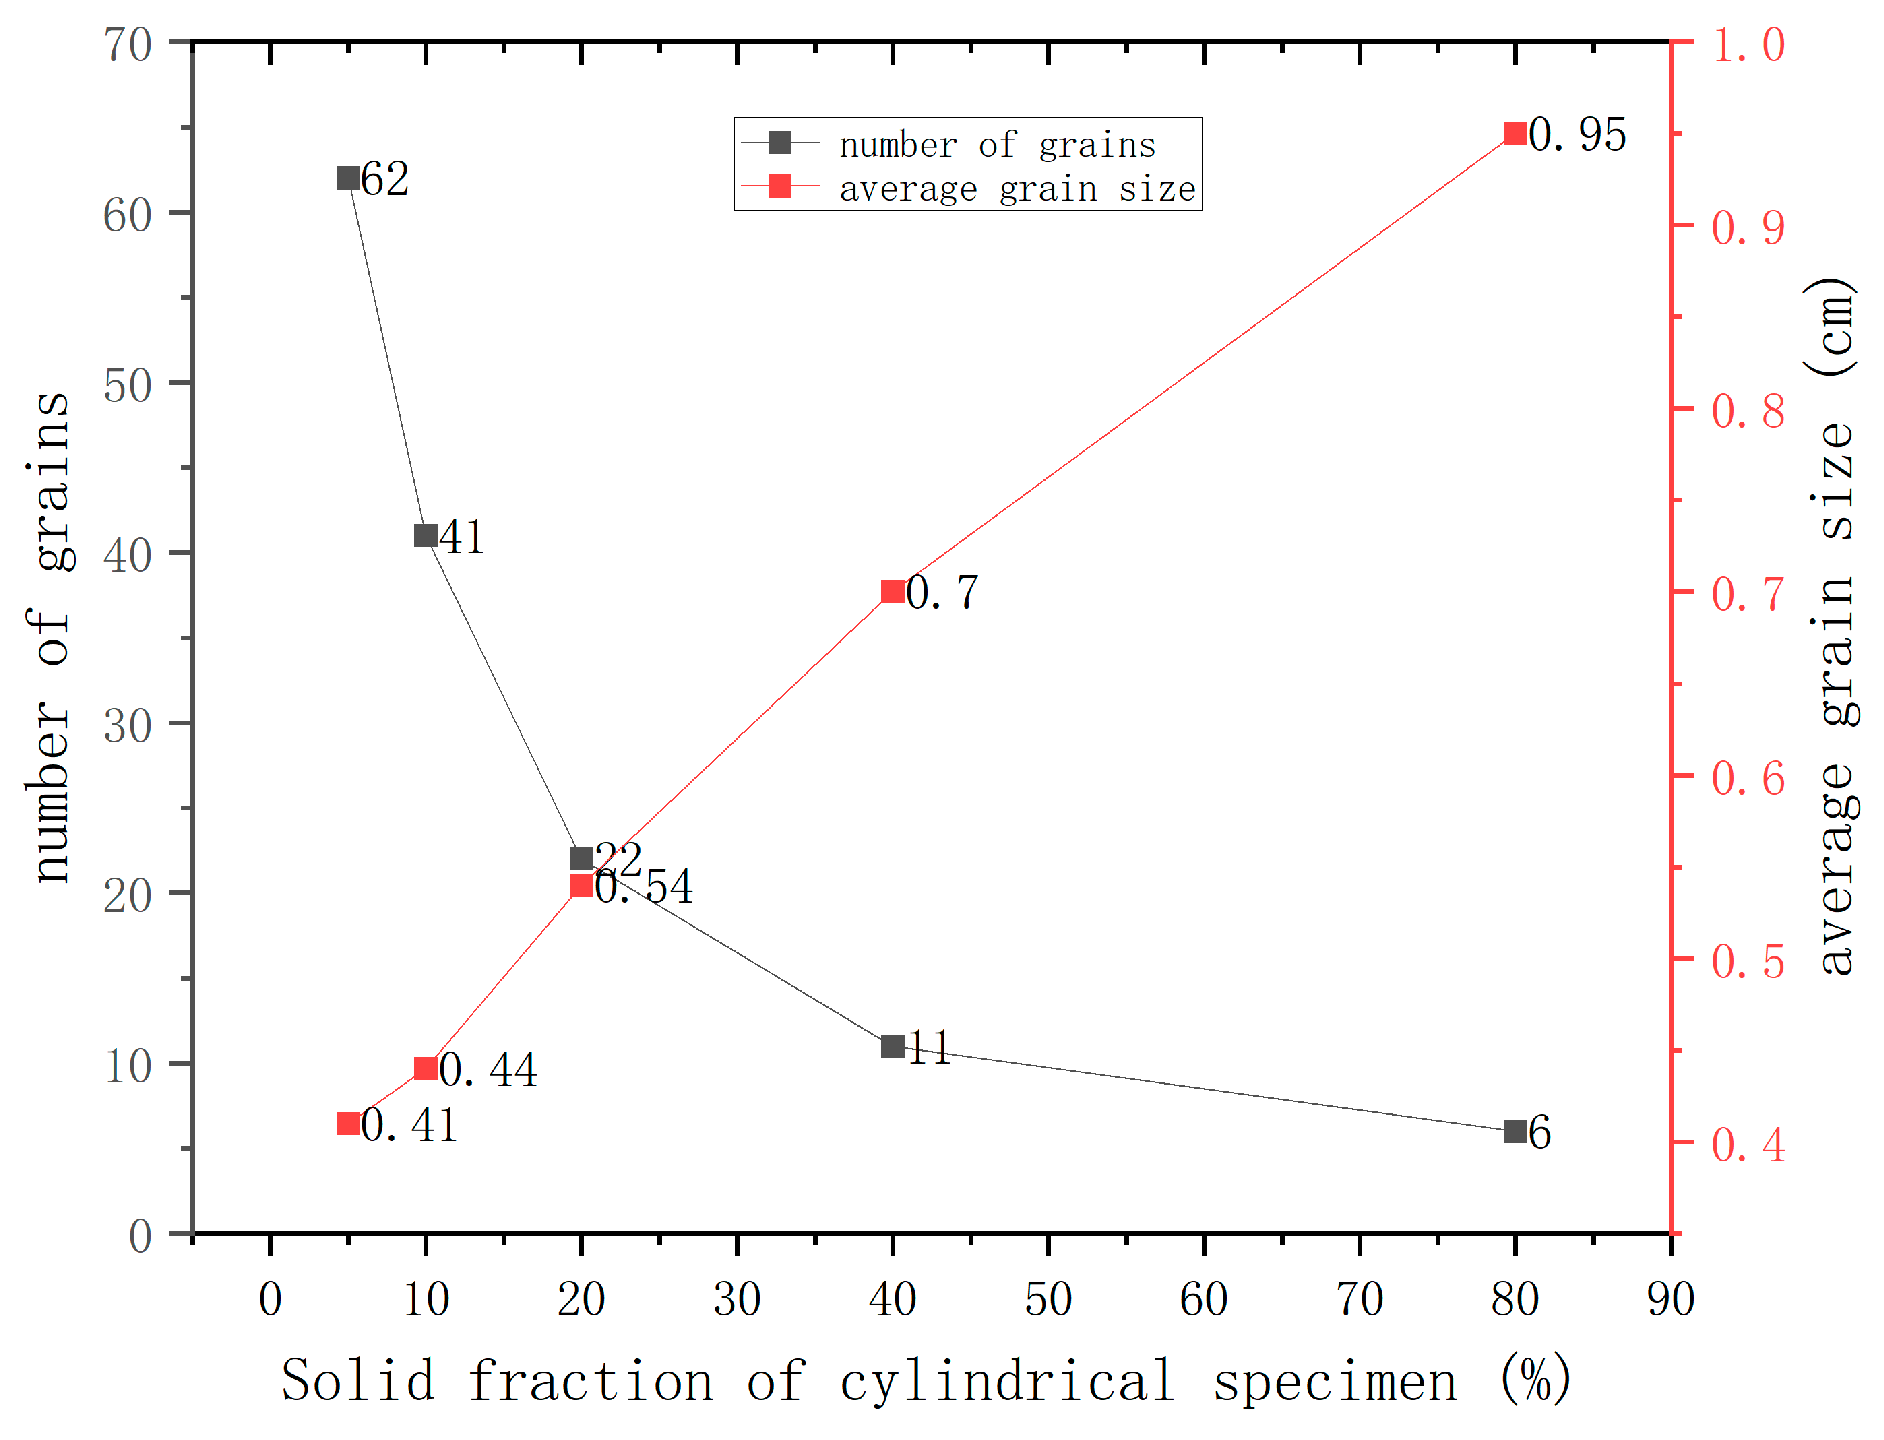
3.3. Influence of Drawing Speed on Grain Formation

The drawing rate is a critical parameter that significantly affects the nucleation undercooling during the solidification process. As the drawing speed rises sharply, the degree of undercooling increases, which augments the driving force for nucleation. Typically, this causes columnar crystals to develop in the regions aligned with the direction of heat flow, with equiaxed crystals observed in the peripheral areas of the casting.
Figure 10 presents a microstructural simulation of the test rod, with various grain orientations indicated by distinct colors. At the onset of solidification, a rapid cooling rate is achieved at the bottom of the test rod, which is in contact with the chill plate. This rapid cooling facilitates a prolific nucleation event at the base of the rod. As the drawing speed rises incrementally to 3 mm/min, equiaxed crystals emerge at the core of the test rod, suggesting the change in nucleation behavior.
Table 2 depicts the relationship between the drawing speed and the grain characteristics within the cross-section of the test rod. As the drawing speed rises, there is a progressive increase in the grain count across the cross-section. Meanwhile, the average grain size decreases. This is a trend underscoring the impact of drawing speed on nucleation and growth dynamics.
For the most stable solid–liquid interface, an in-depth analysis was conducted of the grain distribution across the cross-section of the test rod at a drawing speed of 1 mm/min and varying solid fractions of 5%, 10%, 20%, 40%, and 80%, as shown in Figure 11, Figure 12 and Figure 13. As can be seen in Figure 11 and Figure 12, certain oriented grains are outcompeted and eliminated during the competitive growth phase as drawing proceeds. As shown in Figure 13, the number of grains in the cross-section of the test rod gradually decreases with the advancement of drawing, from an initial count of 62 to just 6. In the meantime, the average grain size increases significantly, from 0.41 cm to 0.95 cm, which implies a transition from an initial equiaxed crystal structure to a columnar crystal structure. This highlights the substantial effect of drawing speed on the microstructural evolution of the material.

3.4. Analysis of Experimental Results

The raw materials used for melting the TiAl alloy were sponge titanium (>99.8 wt.%), high-purity aluminum (>99.99 wt.%), high-purity niobium (>99.99 wt.%), high-purity chromium (>99.99 wt.%), and high-purity carbon powder (>99.99 wt.%). These constituents were blended according to the designed composition ratios of the four components and subsequently melted in a 20 kg vacuum induction melting furnace to obtain the required TiAl master alloy ingot. Specimen rods for directional solidification experiments were then prepared from the master alloy ingot using electrical discharge wire-cutting technology. The specimen rods is placed in the ceramic rod as shown in Figure 14, followed by the subsequent directional solidification preparation process.
The directional solidification furnace for TiAl alloy casting, as shown in Figure 15, consists of a vacuum system, resistance heating system, inductive drip-feeding system, and directional withdrawal system. The Ga–In–Sn alloy coolant, which remains liquid at room temperature, is utilized for cooling. This apparatus is capable of producing directionally solidified TiAl alloys via both the standard Bridgman method and a modified Bridgman method integrated with drip-feeding technology. The system achieves an ultimate vacuum level exceeding 10−3 Pa and sustains a maximum operating temperature of 1700 °C under prolonged service conditions.
The thermal conductivity of Ga–In–Sn can be expressed by the following equation [24]:
λ ( T ) = λ 0 + 0.0614 ( T T m ) + 4.9 10 5 ( T T m ) 2
where λ0 = 23.4 W·m−1·K−1 is the thermal conductivity at the melting temperature.
A withdrawal rate of 1 mm/min was selected for experimental validation. As shown in Figure 16, the microstructure is distinctly partitioned into three regions: equiaxed grains dominate at both the bottom and top of the growth direction, while a columnar grain zone occupies the intermediate region. This trend aligns with the simulation results. However, the simulation predicted a significantly higher proportion of equiaxed grains at the top compared to experimental observations. This discrepancy suggests that the heat transfer coefficient defined in the simulation was overestimated, leading to accelerated heat dissipation through the mold shell and preferential grain growth in the central region of the specimen.
Dendrite fragmentation is considered a critical mechanism triggering the columnar-to-equiaxed transition (CET) [25]. The underlying mechanisms primarily include remelting-induced fragmentation [26], mechanical breakage [27], and pinch-off driven by coarsening/minimization of interfacial curvature [28]. However, previous studies have reported that mechanical breakage is unlikely to occur under non-forced convection conditions [29]. In this study, we propose that increasing the withdrawal velocity leads to a progressive reduction in dendrite arm spacing. This refinement results in smaller root curvature radii of secondary dendrite arms, which enhances localized remelting and subsequent fragmentation. The interplay between thermosolutal gradients and geometric instability at dendrite roots is identified as the dominant driver of fragmentation under these conditions.

4. Conclusions

In the present study, ProCast software, which incorporates the Cellular Automata-Finite Element (CAFE) model, was adopted to investigate the macroscopic temperature and solidification fields, along with the microstructural development in titanium–aluminium alloy cylindrical test rods at six different drawing speeds. The key findings of this study are summarized as follows.
1. The temperature and solidification fields at varying drawing speeds were analyzed to reveal a progressive transformation in morphology of the solid–liquid interface. As the drawing speed increased, the interface changed from a planar to a concave configuration, with stability reaching the optimal level at a drawing speed of 1 mm/min. This stabilization plays a crucial role in maintaining uniform solidification and preventing the formation of defects. The temperature gradient at the solid–liquid interface exhibits a proportional increase with withdrawal rate and The research established a critical G/V value of 624.6 K·s/mm2 for Ti–Al alloys; below this threshold, the solid–liquid interface becomes unstable.
2. Microstructural simulation was performed to indicate that the grain growth predominantly exhibited a columnar structure at lower drawing speeds of 0.5 mm/min and 1 mm/min. However, at higher drawing speeds, specifically from 3 mm/min, equiaxed crystals developed obviously in the test rod’s core. Concurrently, a rise in drawing speed led to an increase in the grain count and a decrease in grain size, highlighting the sensitivity of grain nucleation and growth to the changes in drawing speed.
3. By analyzing the cross-sectional grain distribution within the test bar at a controlled pulling speed of 1 mm/min and varying critical solid fractions of 5%, 10%, 20%, 40%, and 80%, it was deduced that the grain growth trajectory is selective. Specifically, the grains with certain crystallographic orientations were preferentially retained, with others systematically outcompeted and eliminated. This selective growth mechanism culminated in the development of those columnar crystals composed mainly of grains, aligned with the most favorable orientations for growth under the given solidification conditions. This finding demonstrates the significance of orientation-dependent growth kinetics to the evolution of microstructures during solidification processes. Experimental results demonstrate congruent trends with numerical simulations. However, the notably lower proportion of equiaxed grains observed at the top of experimental specimens compared to simulation predictions highlights the necessity for recalibration of thermal boundary conditions and heterogeneous nucleation parameters in the CAFE model.
4. The findings of this study underscore the significant impact of drawing speed on nucleation undercooling and grain growth. It was determined that a drawing speed of 1 mm/min is optimal for the development of a stable columnar grain structure, which is conducive to enhancing the mechanical properties of the titanium–aluminium alloy. By ensuring a balance between heat extraction and solidification kinetics, this optimal speed promotes the development of a uniform and structurally sound microstructure.
In conclusion, drawing speed is a critical parameter that affects the process of thermal and microstructural evolution during the directional solidification of titanium–aluminium alloys. The insights gained through this study provide scientific reference for the optimization of processing parameters in the production of these advanced materials, which is beneficial for improving the efficiency and quality of industrial casting processes.

Author Contributions

Conceptualization, H.H. and X.Z.; methodology, F.L.; software, F.L.; validation, H.H. and X.Z.; formal analysis, K.W. and H.L.; investigation, F.L.; resources, X.D.; data curation, F.L.; writing—original draft preparation, F.L.; writing—review and editing, X.L. and X.D.; visualization, K.W. and H.L.; supervision, X.D.; project administration, X.L.; funding acquisition, X.L. All authors have read and agreed to the published version of the manuscript.

Funding

This research was supported by National Natural Science Foundation (No. 52371015) and the National Science and Technology Major Project (No. J2019-VI-0003-0116).

Data Availability Statement

The original contributions presented in this study are included in the article. Further inquiries can be directed to the corresponding authors.

Acknowledgments

The authors would like to express their sincere gratitude to Hai Nan for his significant contributions to this research. Hai Nan played a pivotal role in project administration and was instrumental in securing the funding that made this study possible. His dedication to the research and his efforts in overseeing the project administration were invaluable. We also appreciate his collaboration in the funding acquisition process, which was crucial for the successful completion of this work. Hai Nan’s commitment to our research has been a driving force, and we are grateful for his unwavering support throughout the project.

Conflicts of Interest

The authors declare no conflicts of interest.

References

  1. Yang, R. Progress and challenges of titanium and aluminum intermetallics. J. Metals 2015, 51, 129–147. [Google Scholar]
  2. Bewlay, B.P.; Nag, S.; Suzuki, A.; Weimer, M.J. TiAl alloys in commercial aircraft engines. Mater. High Temp. 2016, 33, 549–559. [Google Scholar]
  3. Zhang, L.Q.; Ge, G.W.; Lin, J.P. Progress in hot working of TiAl alloys. Precis. Forg. 2022, 14, 1–9. [Google Scholar]
  4. Zhong, H.; Li, S.; Kou, H.; Li, J. The solidification path related columnar-to-equiaxed transition in Ti–Al alloys. Intermetallics 2015, 59, 81–86. [Google Scholar]
  5. Hunt, J.D. Steady state columnar and equiaxed growth of dendrites and eutectic. Mater. Sci. Eng. 1984, 65, 75–83. [Google Scholar]
  6. Wang, K.F.; Guo, J.J.; Mi, G.F.; Li, C.Y.; Fu, H.Z. Numerical simulation of columnar to equiaxed transition for directionally solidified Ti-44Al alloy. Acta Metall. Sin. (Engl. Lett.) 2008, 21, 146–156. [Google Scholar]
  7. Lapin, J.; Gabalcová, Z. Solidification behaviour of TiAl-based alloys studied by directional solidification technique. Intermetallics 2011, 19, 797–804. [Google Scholar]
  8. Wang, Q.; Ding, H.; Zhang, H.; Liu, S.; Chen, R.; Guo, J.; Fu, H. Growth rates dependence of macro/microstructures and mechanical properties of Ti-47Al-2Nb-2Cr-0.2 Er alloy directionally solidified by cold crucible. Mater. Des. 2017, 125, 146–157. [Google Scholar] [CrossRef]
  9. Lenart, R.; Eshraghi, M. Modeling columnar to equiaxed transition in directional solidification of Inconel 718 alloy. Comput. Mater. Sci. 2020, 172, 109374. [Google Scholar]
  10. Xu, X.; Ding, H.; Huang, H.; Liang, H.; Chen, R.; Guo, J.; Fu, H. Microstructure formation and columnar to equiaxed transition during cold crucible directional solidification of a high-Nb TiAl alloy. J. Mater. Res. Technol. 2021, 11, 2221–2234. [Google Scholar]
  11. Qu, L.; Wang, Y.; Ding, H.; Chen, R.; Guo, J.; Li, W. Equiaxed to Columnar Transition of Ti46Al8Nb0. 5B Intermetallics during Directional Solidification. Mater. Trans. 2024, 65, 616–620. [Google Scholar]
  12. Wang, Y.; Cui, C.J.; Zhang, K.; Deng, L.; Liu, W.; Liu, Y.; Zhao, Y.N.; Wu, C.Y. Research progress on directional solidification of intermetallic compounds. Mater. Guide 2022, 36, 135–142. [Google Scholar]
  13. Zhou, Y.H.; Hu, Z.Q.; Jie, W.Q. Solidification Technology; Mechanical Industry Press: Beijing, China, 1998. [Google Scholar]
  14. Xiong, W. Numerical Simulation of Directional Solidification Deformation of Nickel-Based Single Crystal Superalloys and Experimental Study of Recrystallization. Ph.D. Thesis, Central South University, Changsha, China, 2022. [Google Scholar]
  15. Ren, N.; Yang, L.W.; Li, J.; Zeng, L.; Xia, M.; Li, J. Research progress on numerical simulation of directional solidification of high-temperature alloys. Spec. Cast. Nonferrous Alloys 2023, 43, 1336–1350. [Google Scholar] [CrossRef]
  16. Zhou, Y.H.; Huang, Q.M.; Lin, R.C. Numerical simulation of directional solidification process of single crystal superalloy blades. Spec. Cast. Nonferrous Alloys 2021, 41, 1361–1365. [Google Scholar] [CrossRef]
  17. Zhang, H.H.; Zhang, H.; Zhang, L.; Liu, Y. Influence of drawing speed on directional solidification process of single crystal blades. Foundry 2023, 72, 130–134. [Google Scholar]
  18. Kurz, W.; Giovanola, B.; Trivedi, R. Theory of microstructural development during rapid solidification. Acta Metall. 1986, 34, 823–830. [Google Scholar]
  19. Yan, X.; Xu, Q.; Tian, G.; Liu, Q.; Hou, J.; Liu, B. Multi-scale modeling of liquid-metal cooling directional solidification and solidification behavior of nickel-based superalloy casting. J. Mater. Sci. Technol. 2021, 67, 36. [Google Scholar]
  20. Thevoz, P.; Desbiolles, J.L.; Rappaz, M. Modeling of equiaxed microstructure formation in casting. Metall. Trans. A 1989, 20, 311–322. [Google Scholar]
  21. Liu, Z.; Sun, H.; Xu, F.; Ma, D. Parameters determination of grain microstructure prediction for a single crystal casting simulation and its experimental validation. Int. J. Met. 2018, 12, 861–869. [Google Scholar]
  22. Quested, P.N.; McLean, M. Solidification morphologies in directionally solidified superalloys. Mater. Sci. Eng. 1984, 65, 171–180. [Google Scholar]
  23. Mullins, W.W.; Sekerka, R.F. Stability of a planar interface during solidification of a dilute binary alloy. J. Appl. Phys. 1964, 35, 444–451. [Google Scholar]
  24. Plevachuk, Y.; Sklyarchuk, V.; Eckert, S.; Gerbeth, G.; Novakovic, R. Thermophysical properties of the liquid Ga–In–Sn eutectic alloy. J. Chem. Eng. Data 2014, 59, 757–763. [Google Scholar]
  25. Hellawell, A.; Liu, S.; Lu, S.Z. Dendrite fragmentation and the effects of fluid flow in castings. Jom 1997, 49, 18–20. [Google Scholar]
  26. Hutt, J.; StJohn, D. The origins of the equiaxed zone—Review of theoretical and experimental work. Int. J. Cast Met. Res. 1998, 11, 13–22. [Google Scholar]
  27. Mullis, A.M.; Walker, D.J.; Battersby, S.E.; Cochrane, R.F. Deformation of dendrites by fluid flow during rapid solidification. Mater. Sci. Eng. A 2001, 304, 245–249. [Google Scholar]
  28. Neumann-Heyme, H.; Eckert, K.; Beckermann, C. Dendrite fragmentation in alloy solidification due to sidearm pinch-off. Phys. Rev. E 2015, 92, 060401. [Google Scholar]
  29. Ruvalcaba, D.; Mathiesen, R.; Eskin, D.; Arnberg, L.; Katgerman, L. In situ observations of dendritic fragmentation due to local solute-enrichment during directional solidification of an aluminum alloy. Acta Mater. 2007, 55, 4287–4292. [Google Scholar]
Figure 1. LMC Directional Solidification Computational Model.
Metals 15 00366 g001
Figure 2. Thermal Properties of Ti-48Al-2Cr-2Nb Material. (a) Thermal Conductivity. (b) Density. (c) Enthalpy. (d) Solid Fraction.
Metals 15 00366 g002
Figure 3. Temperature Field.
Metals 15 00366 g003
Figure 4. Solidification Field.
Metals 15 00366 g004
Figure 5. Test Rod Position.
Metals 15 00366 g005
Figure 6. Temperature gradient distribution at Different Drawing Speeds. (a) Contour map of temperature gradient distribution. (b)Temperature gradient at the solid–liquid interface.
Metals 15 00366 g006
Figure 7. Comparison of CET Curves between Al-Cu Alloy [5], Ni-Based Superalloy [22] Ti-46Al-8Nb Alloy [7], and Ti-48Al-2Cr-2Nb Alloy (this work) Prepared by Bridgman Directional Solidification.
Metals 15 00366 g007
Figure 8. Temperature Gradient Distribution Along the Withdrawal Direction (1 mm/min). (a) Selection of data acquisition locations. (b) Position-Dependent Temperature Gradient.
Metals 15 00366 g008
Figure 9. Variation of G/V ratio under different withdrawal rates.
Metals 15 00366 g009
Figure 10. Grain Distribution in the Longitudinal Section of the Test Rod at Different Drawing Speeds.
Metals 15 00366 g010
Figure 11. Grain Distribution of the Test Rod at Different Drawing Speeds.
Metals 15 00366 g011
Figure 12. Grain Distribution of the Test Rod at Different Times.
Metals 15 00366 g012
Figure 13. Grain Distribution on the Cross-Section of the Test Rod.
Metals 15 00366 g013
Figure 14. Ceramic rod for titanium aluminum alloy.
Metals 15 00366 g014
Figure 15. The directional solidification furnace for TiAl alloy casting.
Metals 15 00366 g015
Figure 16. Grain distribution in the experimental results.
Metals 15 00366 g016
Table 1. Composition of Ti-48Al-2Cr-2Nb alloy (at.%).
TiAlCrNb
484822
Table 2. Grain Distribution in the Longitudinal Section of the Test Rod at Different Drawing Speeds.
Drawing Rate (mm/min)Number of GrainsAverage Grain Size (mm)Max Surface of Grain (cm2)
0.5561624
15815.931.6
27011.827.9
31421017.8
4187716.8
8262520
Disclaimer/Publisher’s Note: The statements, opinions and data contained in all publications are solely those of the individual author(s) and contributor(s) and not of MDPI and/or the editor(s). MDPI and/or the editor(s) disclaim responsibility for any injury to people or property resulting from any ideas, methods, instructions or products referred to in the content.

