

Excessive Fe Contamination in Secondary Al Alloys: Microstructure, Porosity, and Corrosion Behaviour


Abstract

1. Introduction
2. Materials and Methods
2.1. Alloy Production
2.2. Thermodynamic Simulations
2.3. Materials Characterisation
2.4. Corrosion Test
3. Results
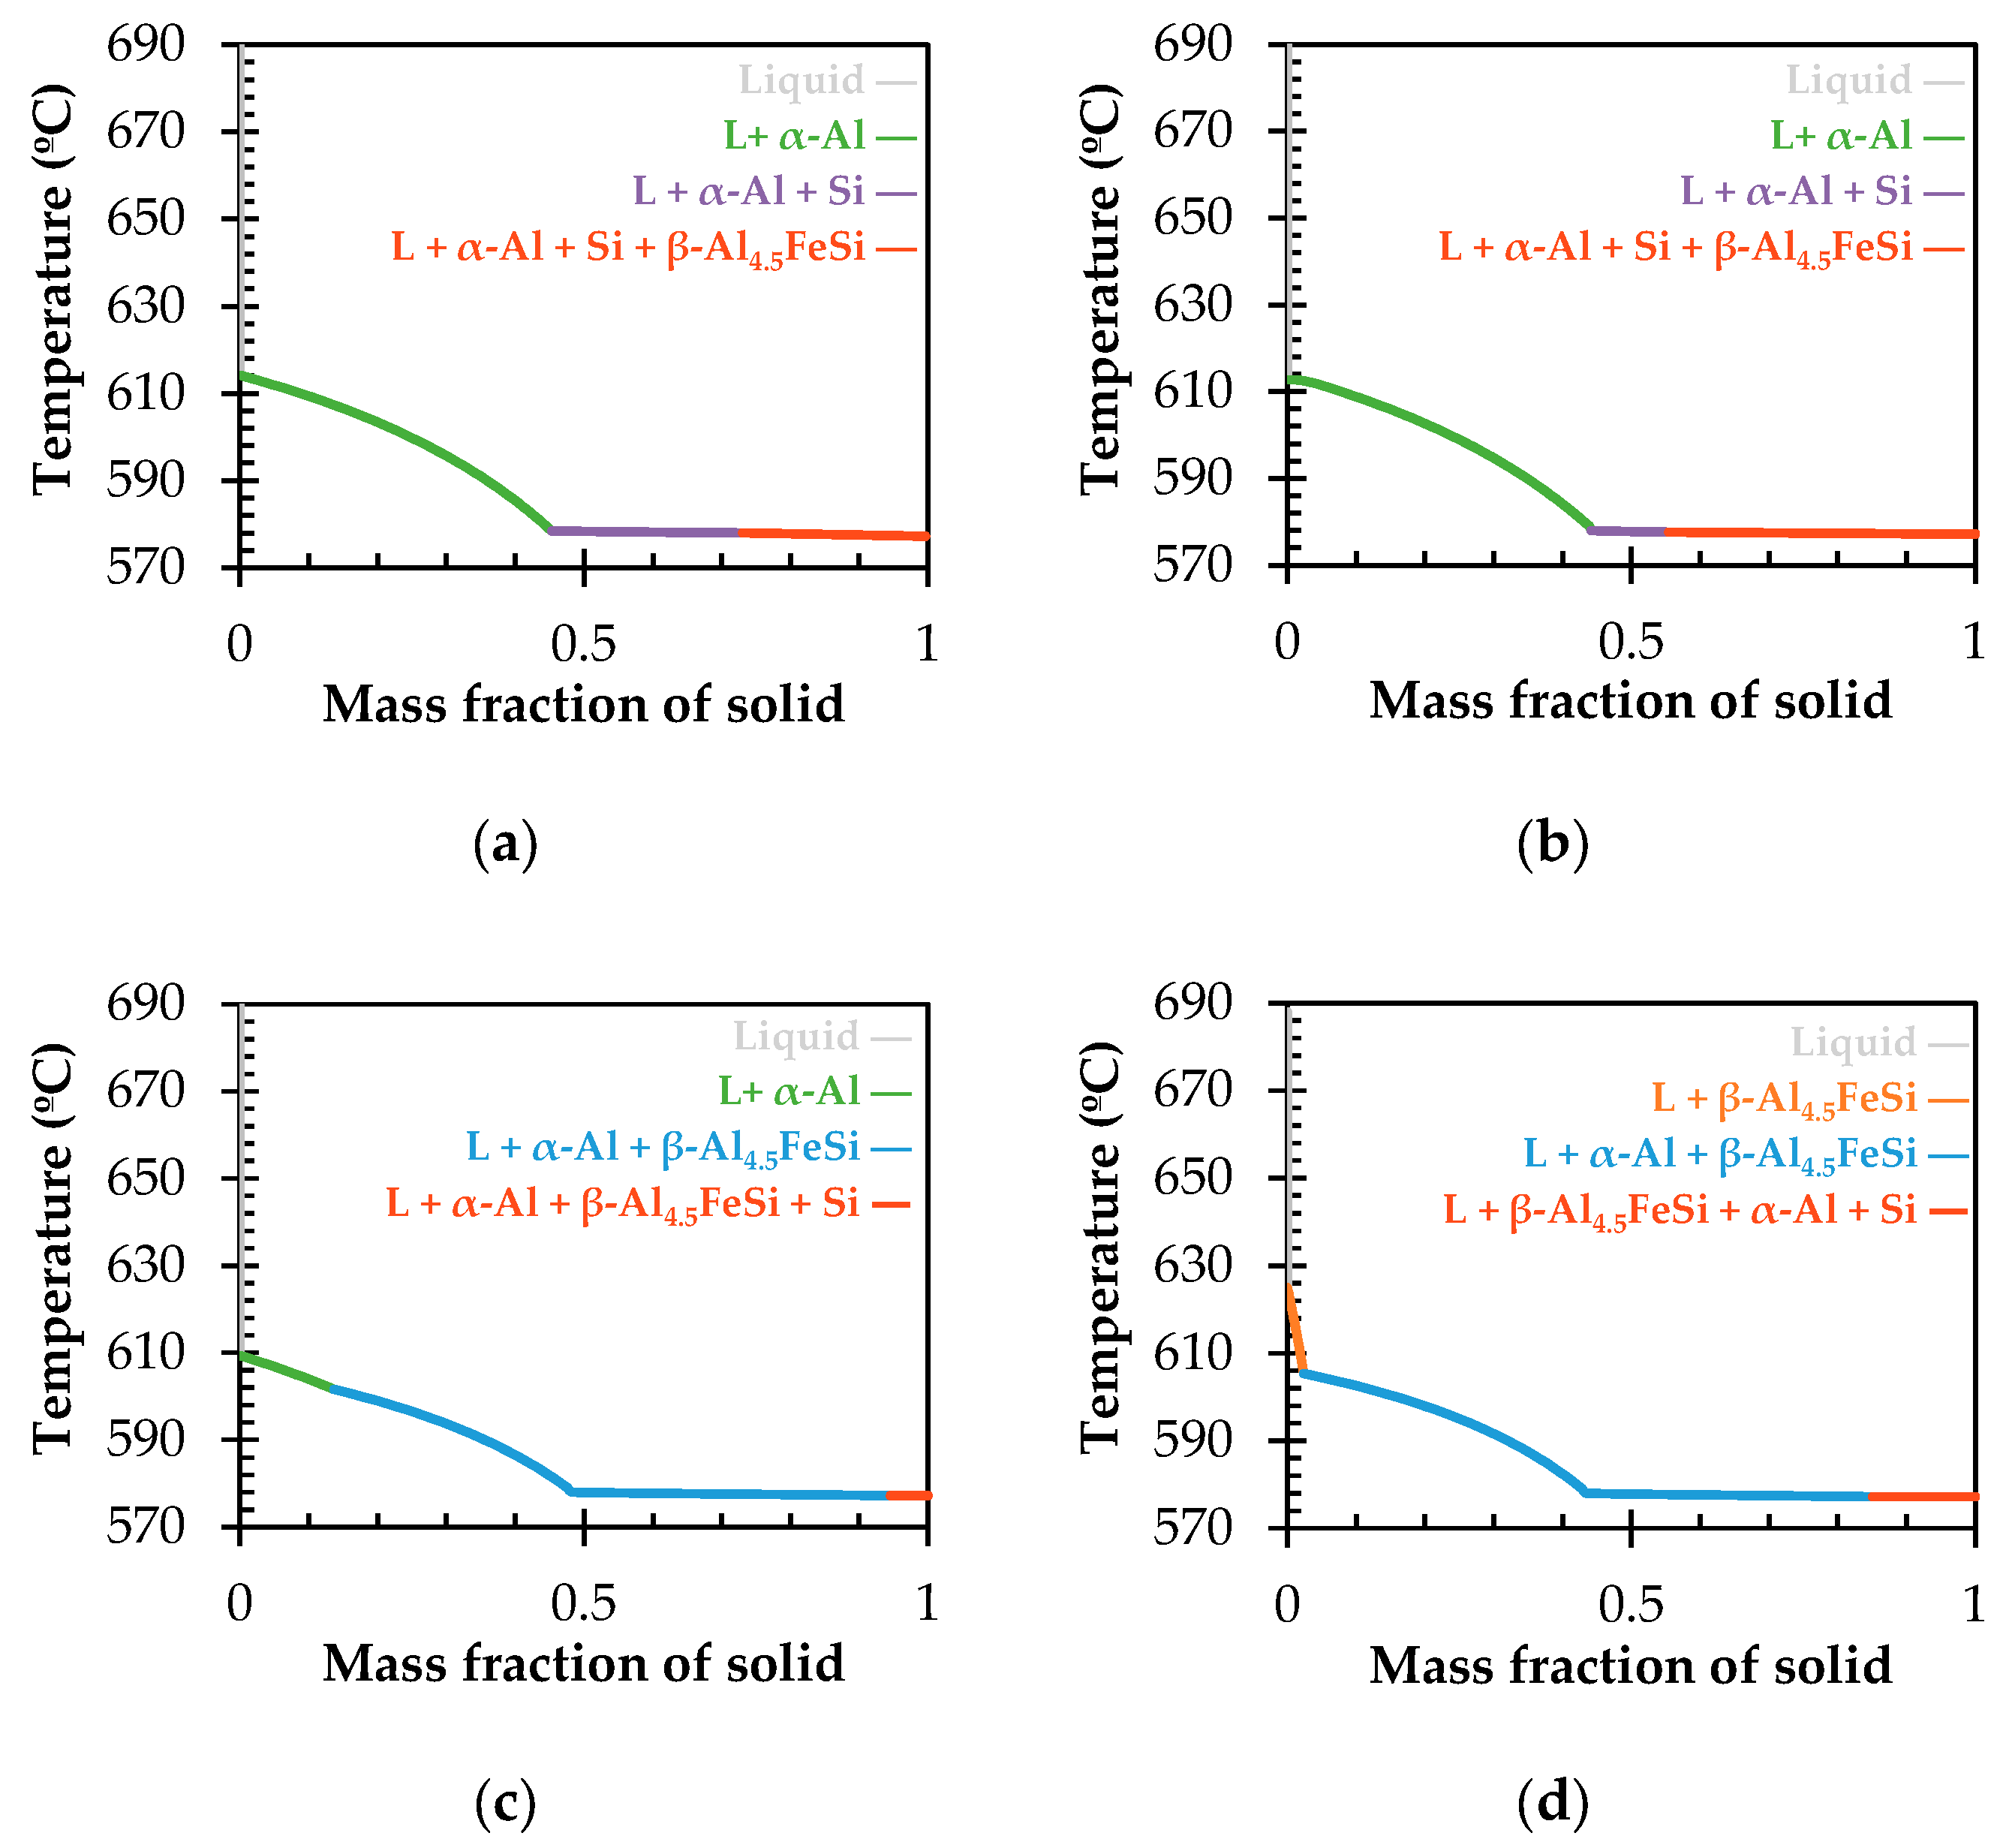
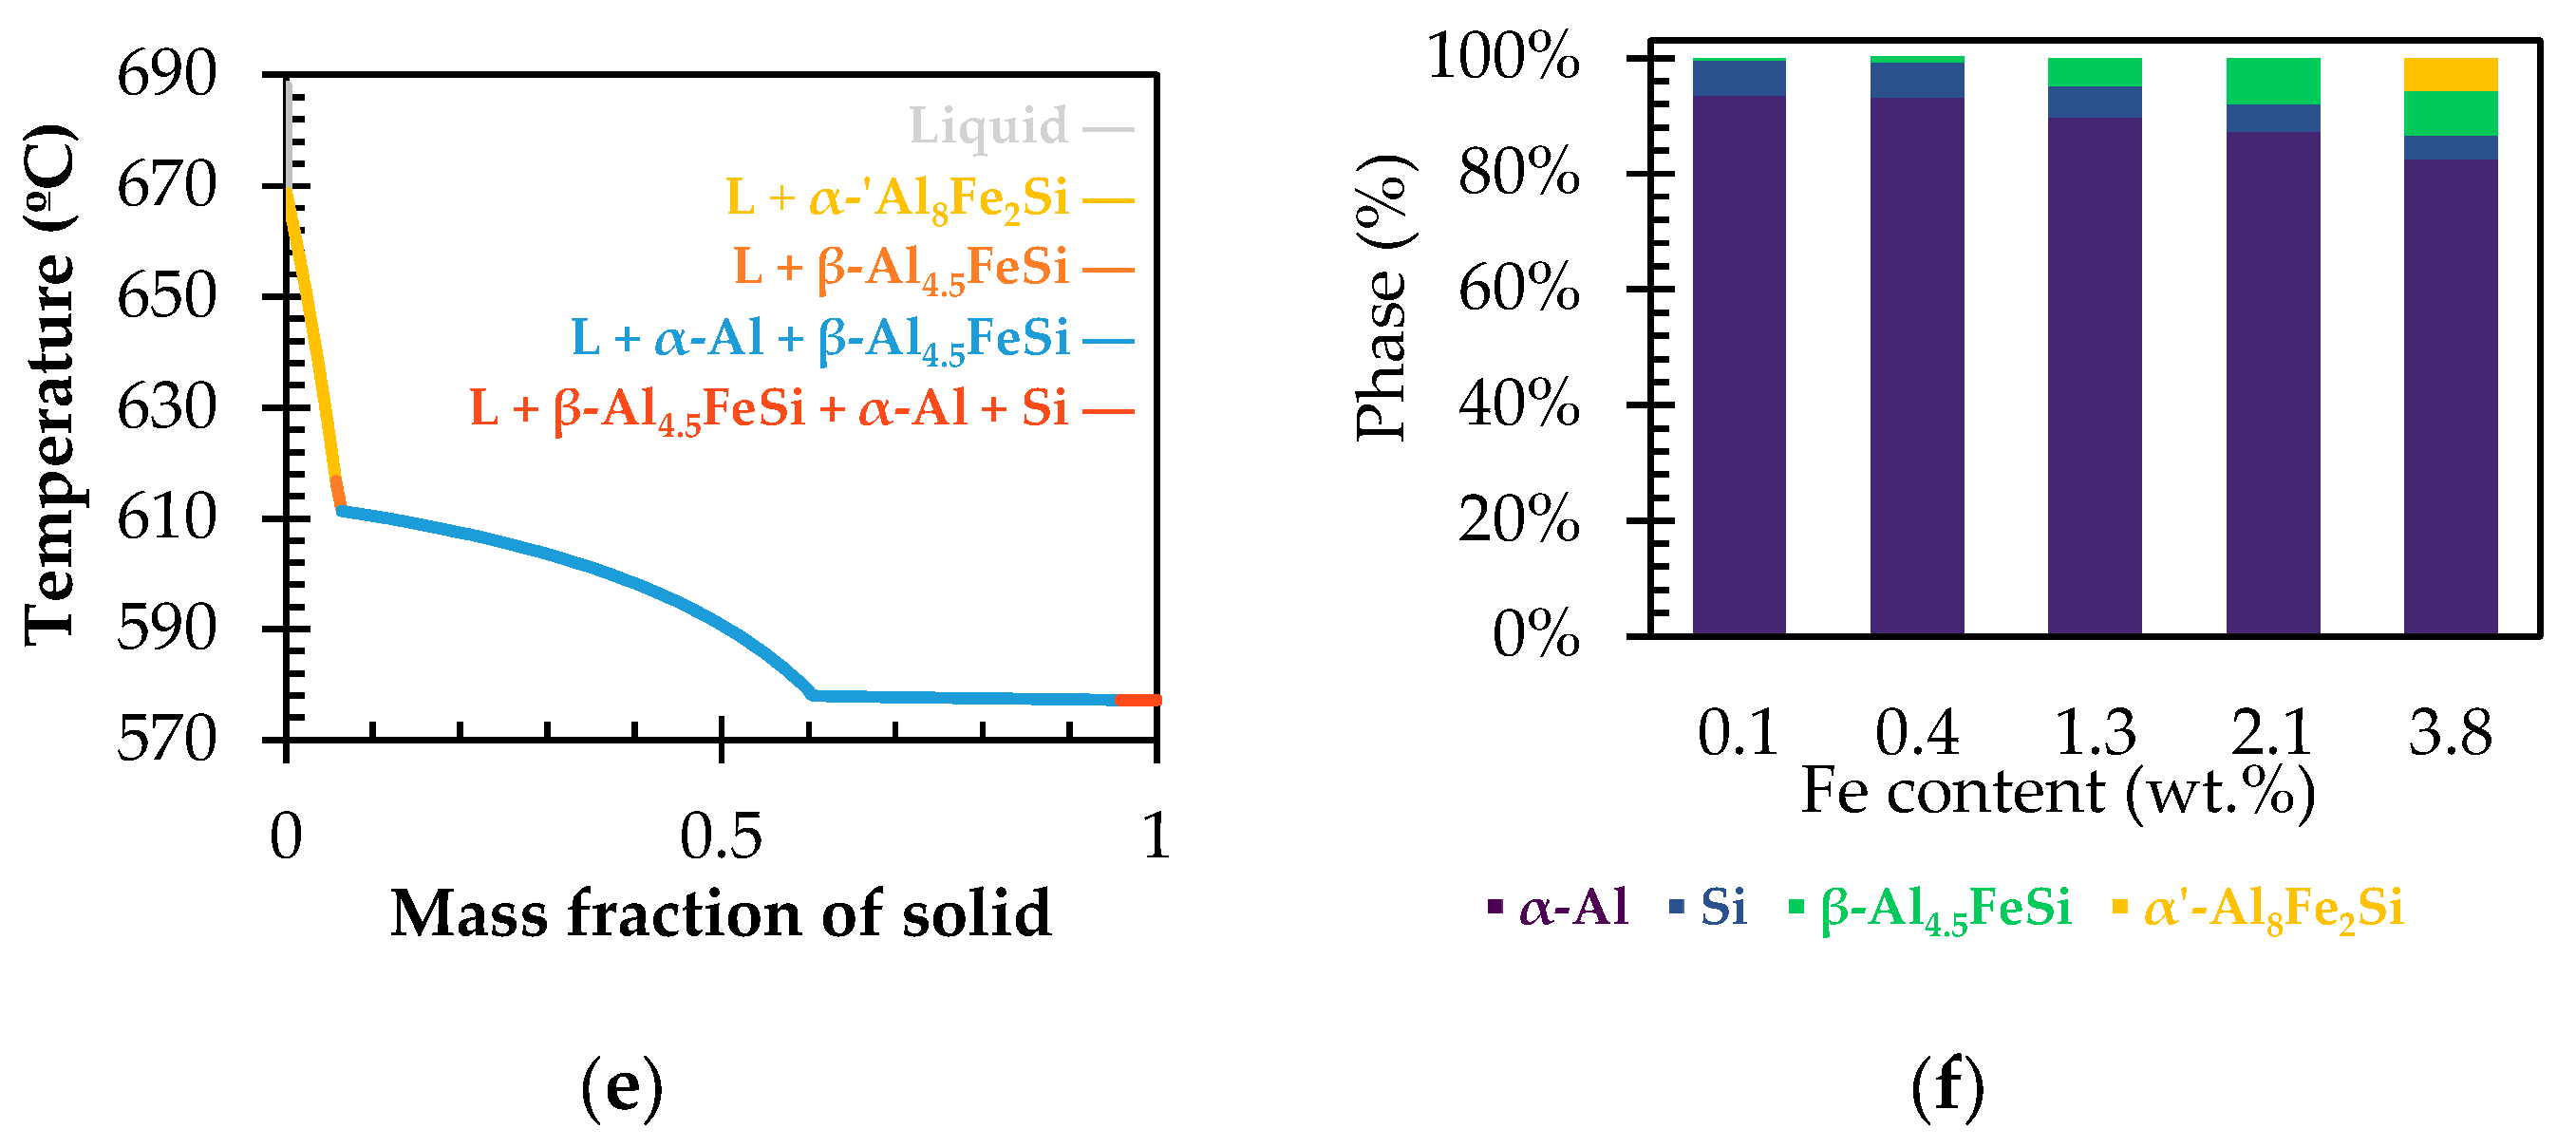
3.1. Solidification Simulation
3.2. Microstructural Characterisation
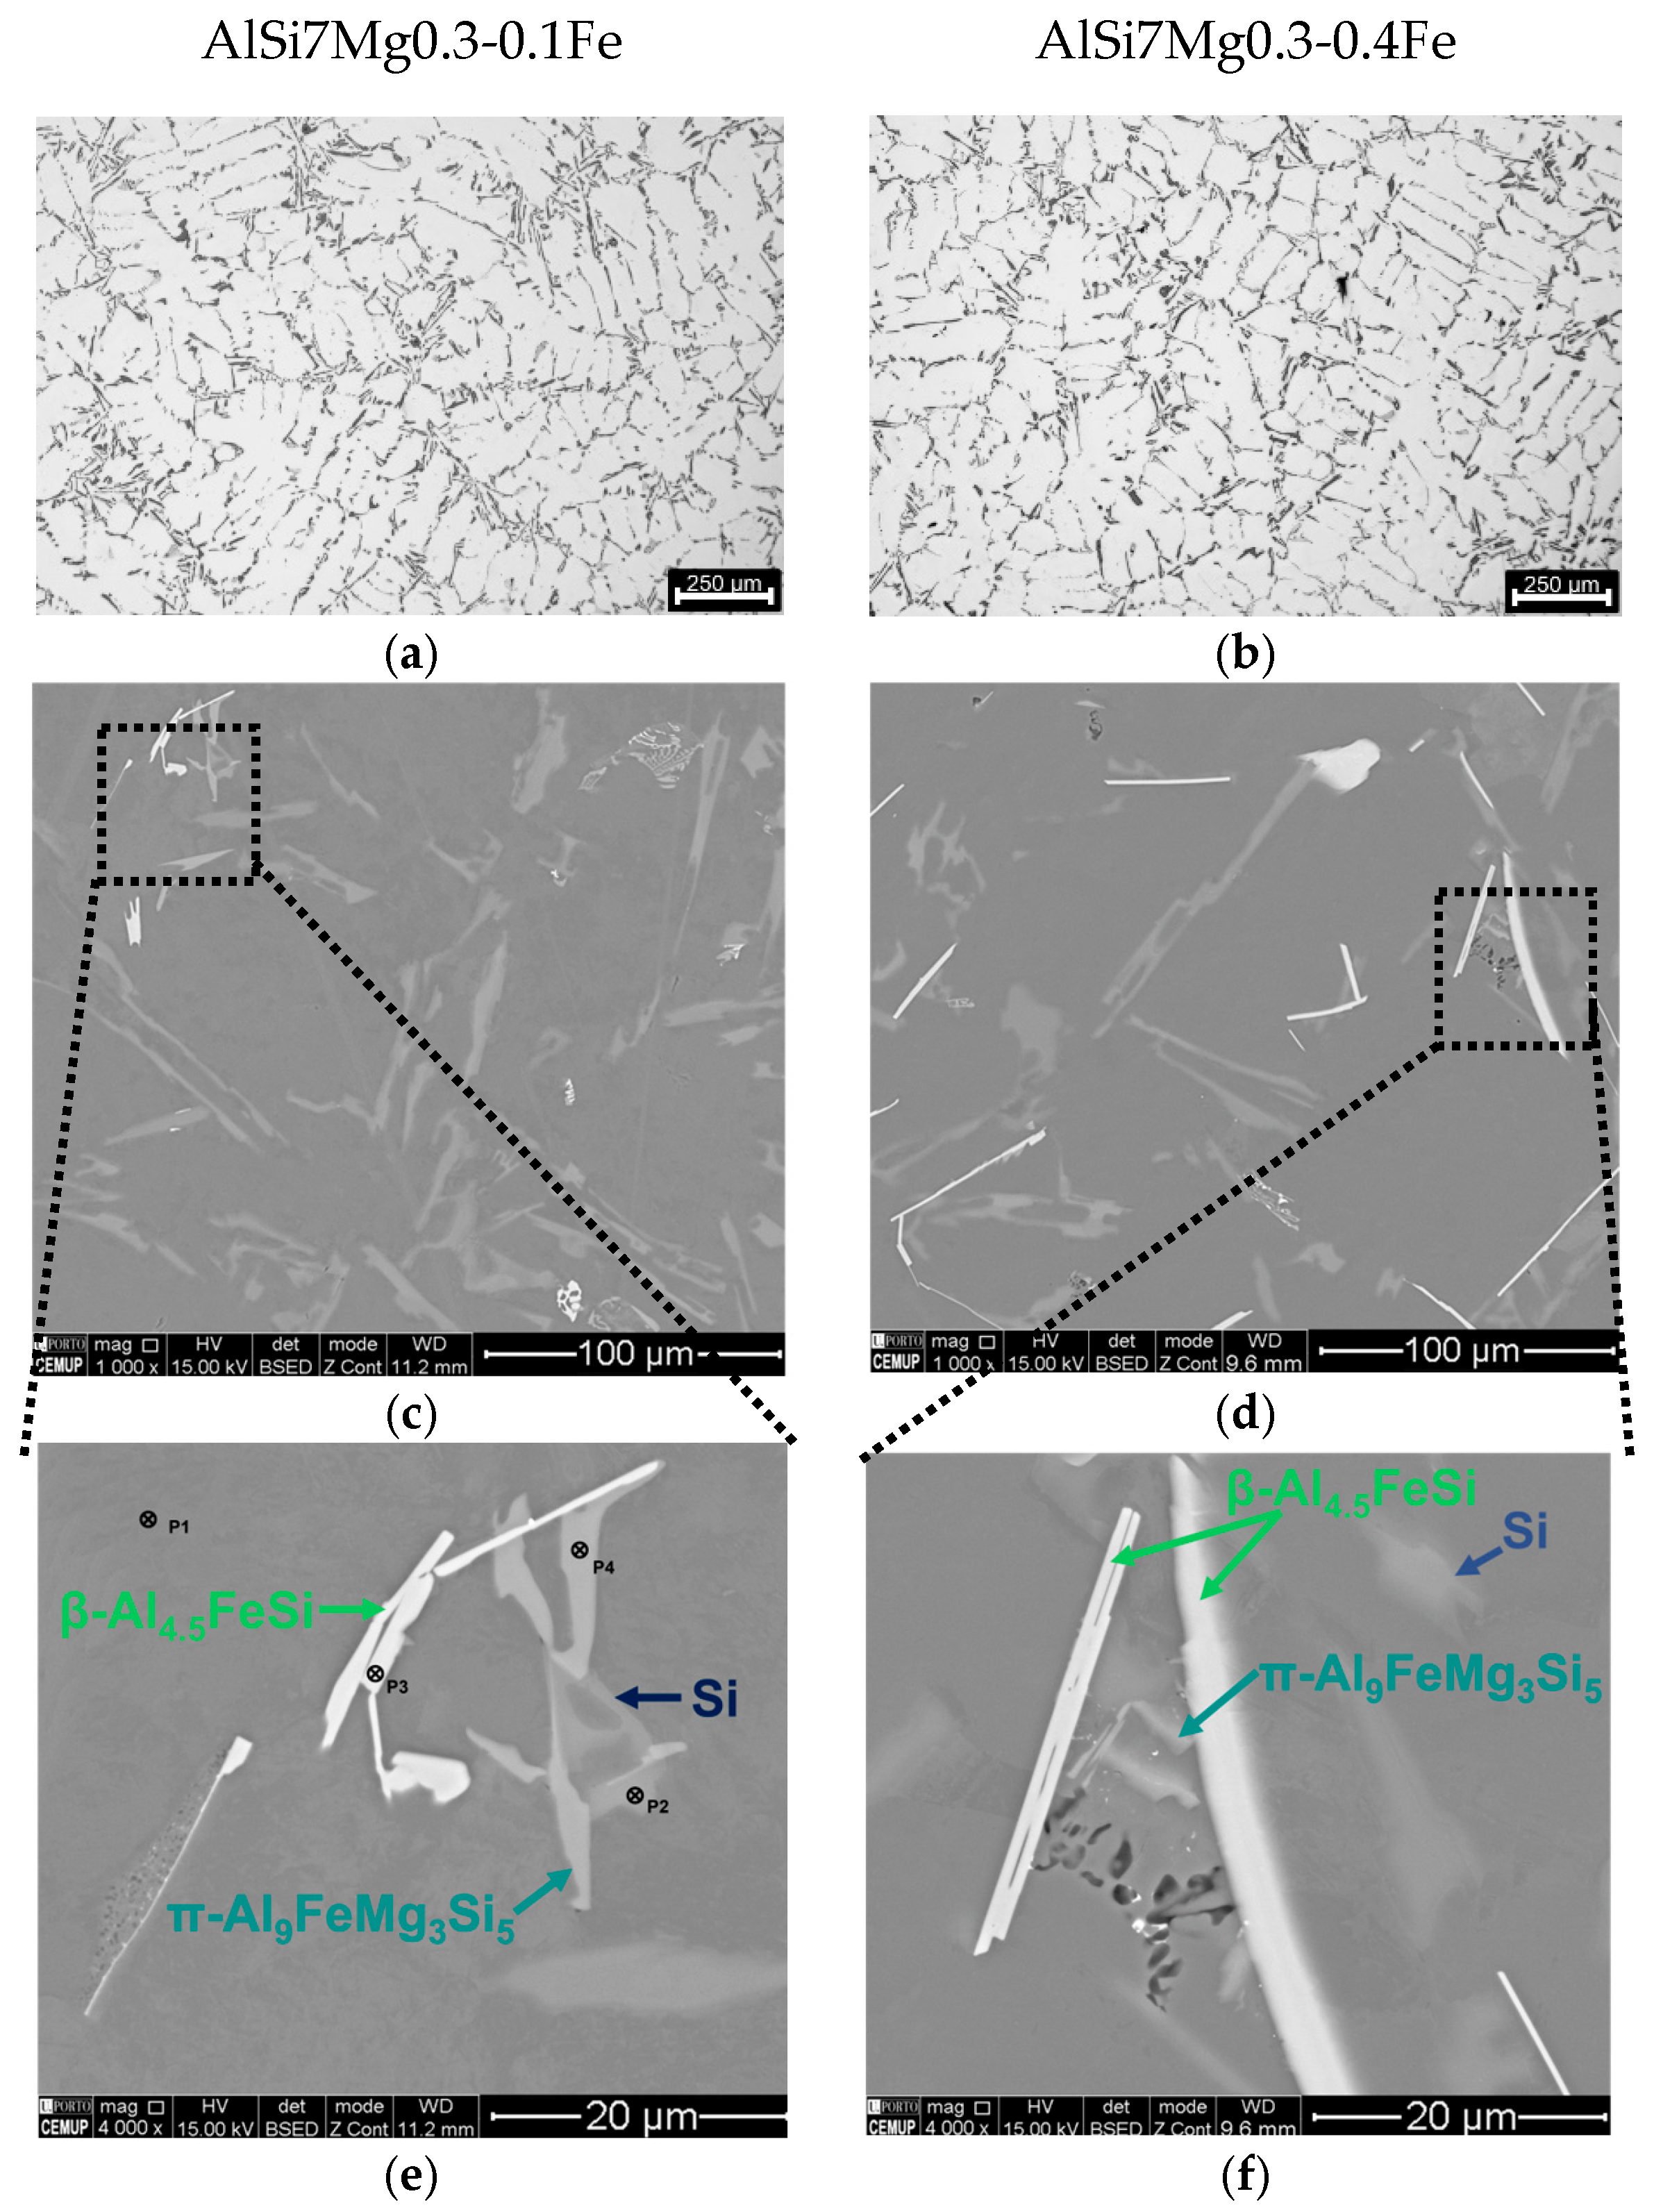
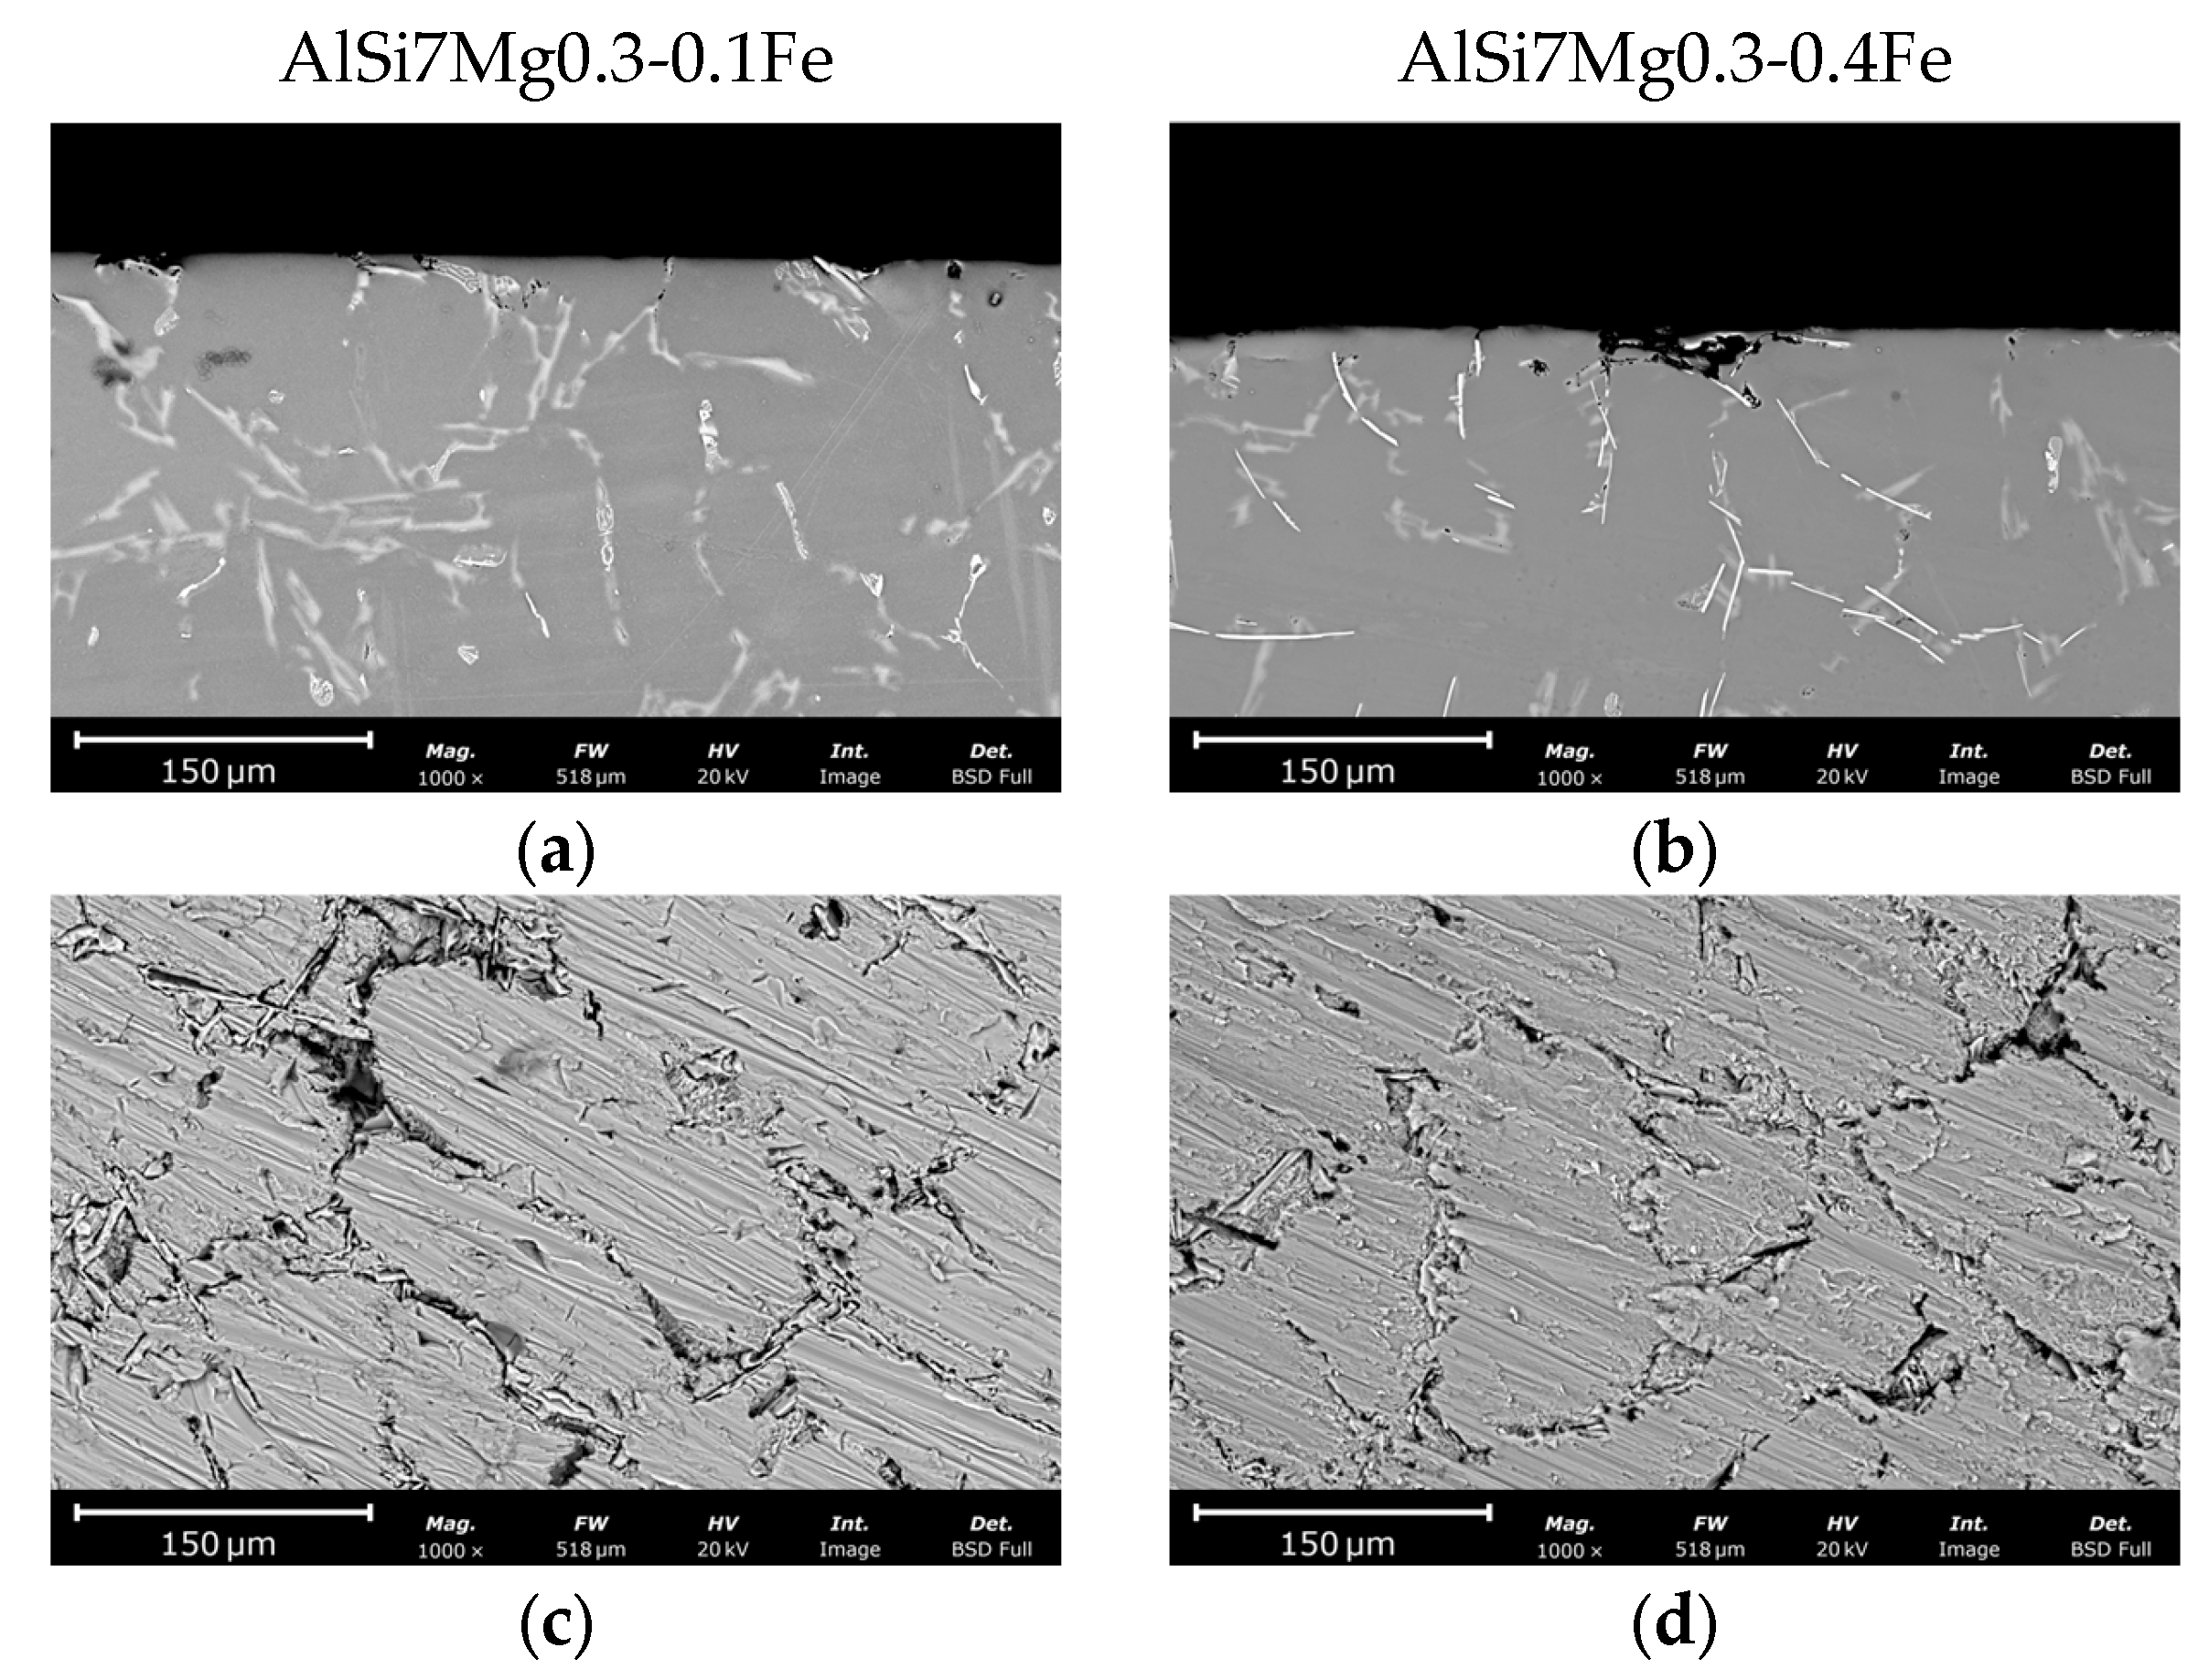
3.2.1. Low Fe Alloys
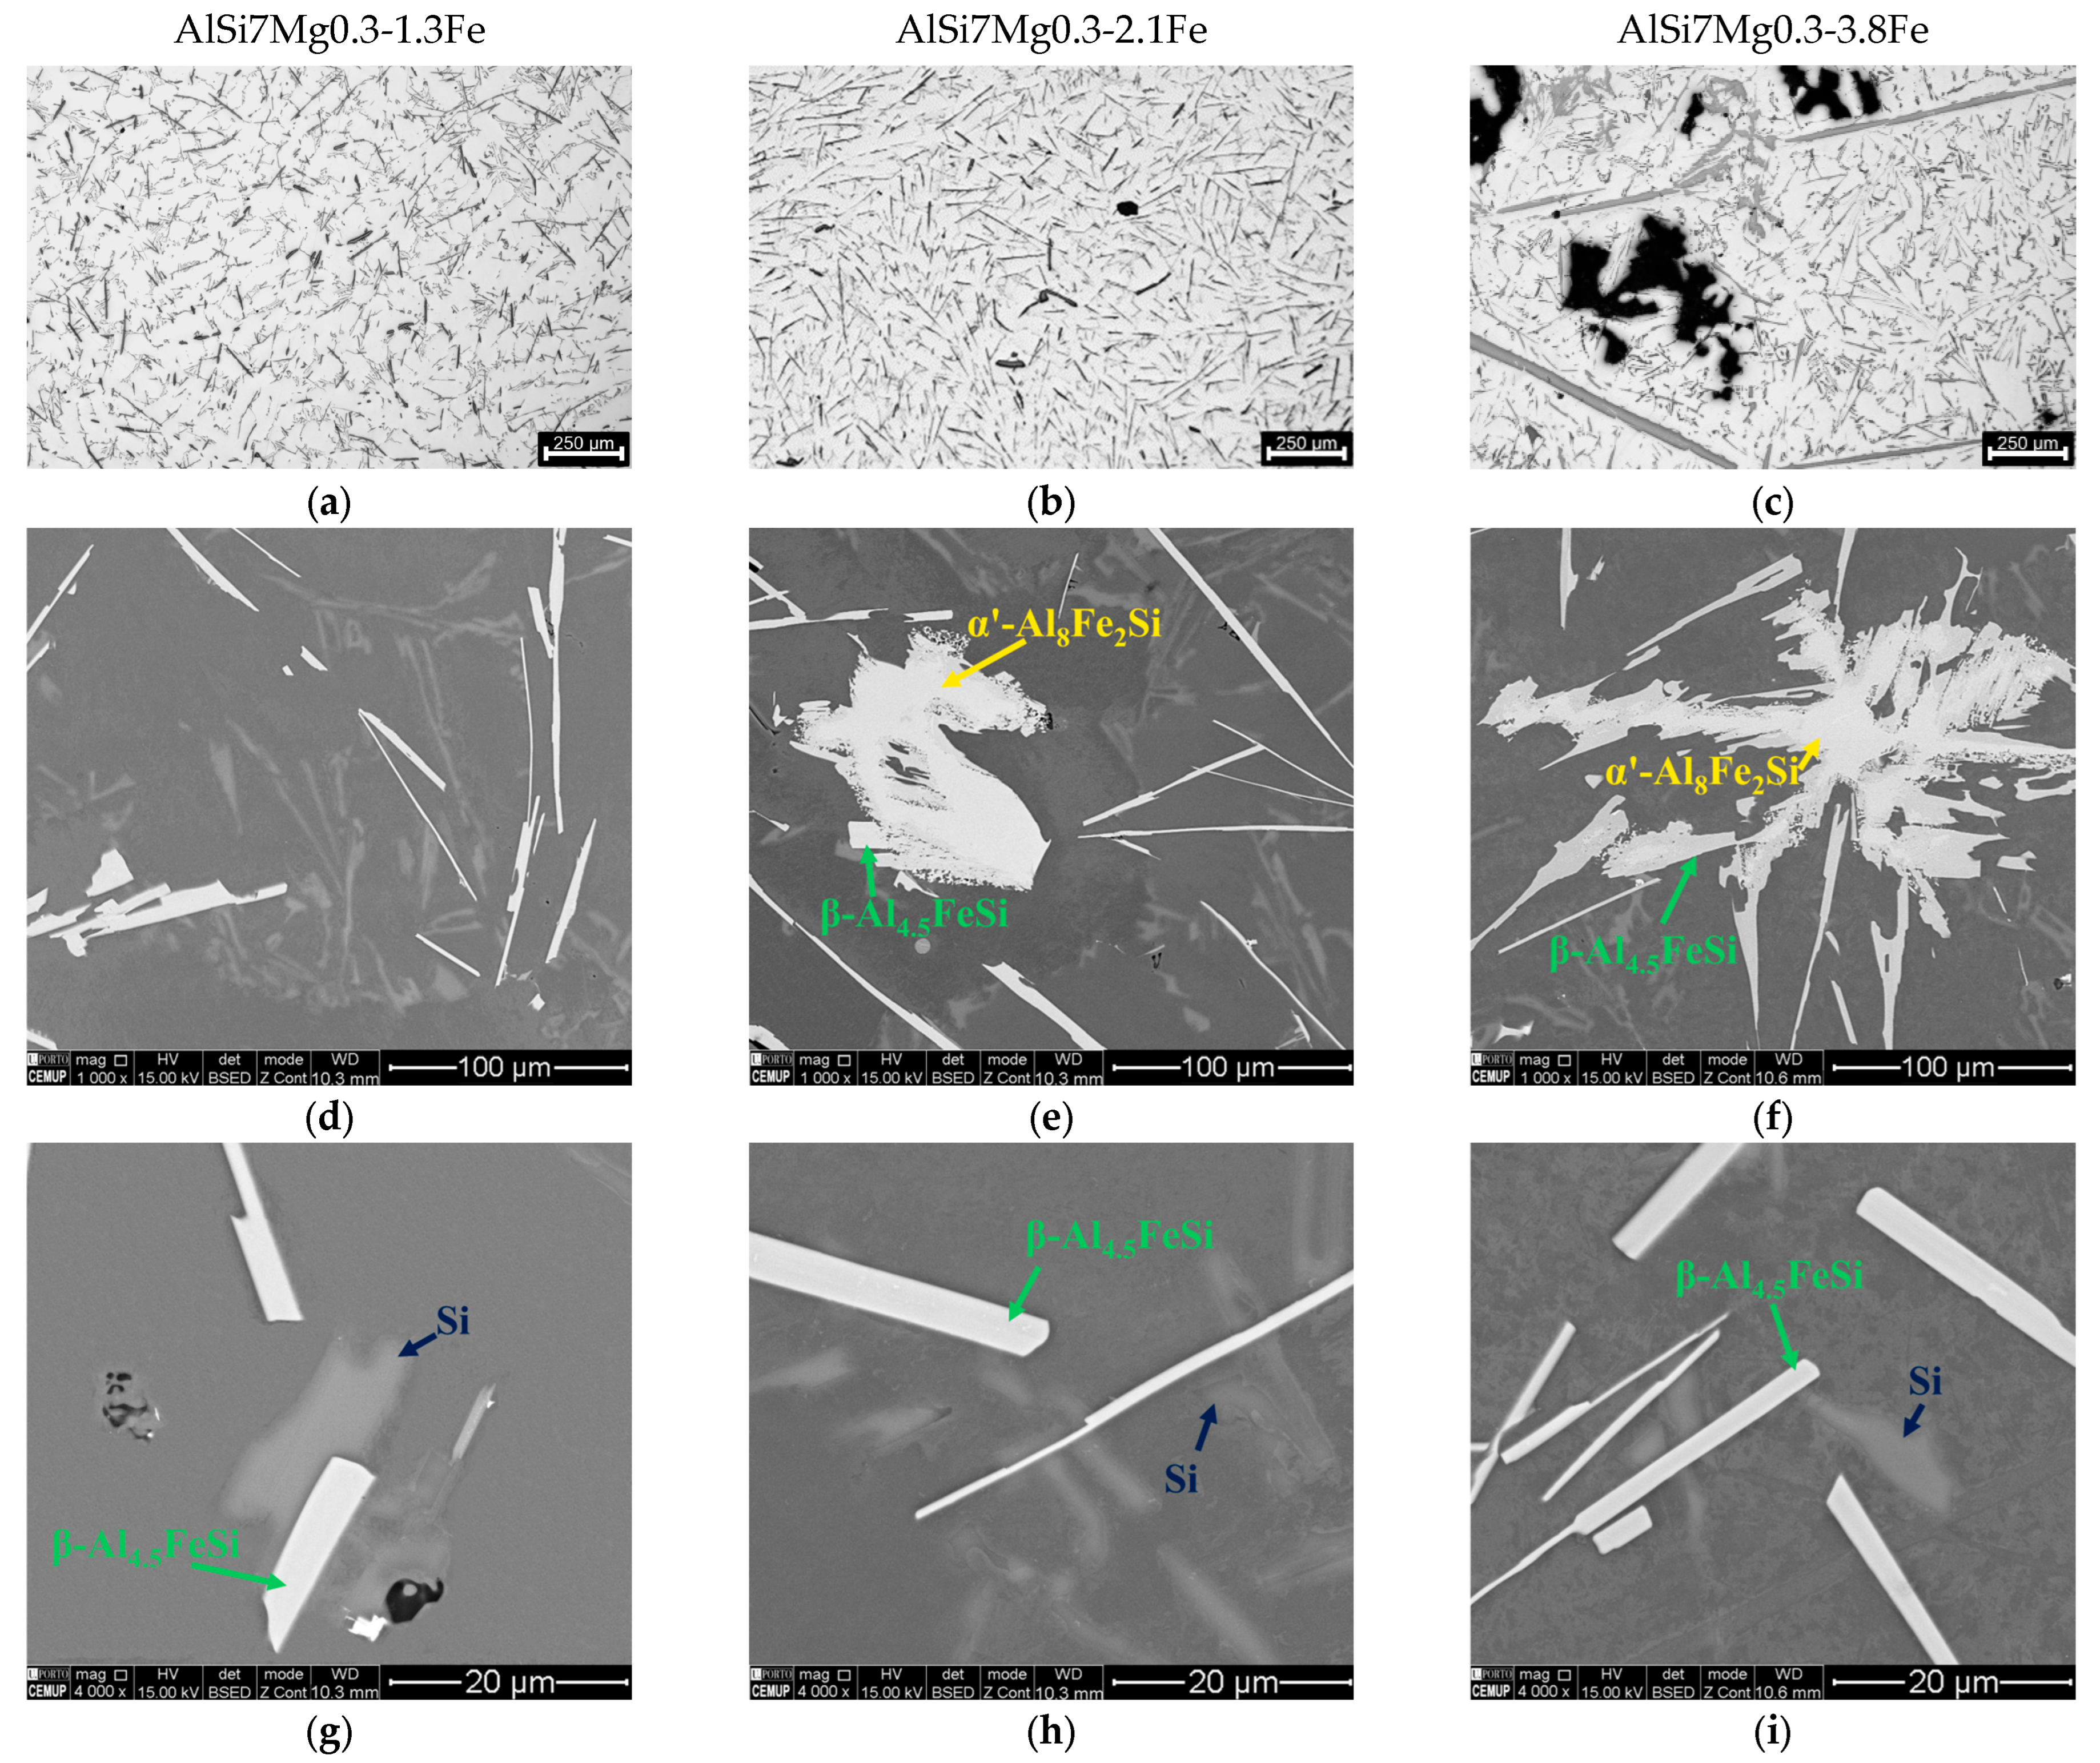
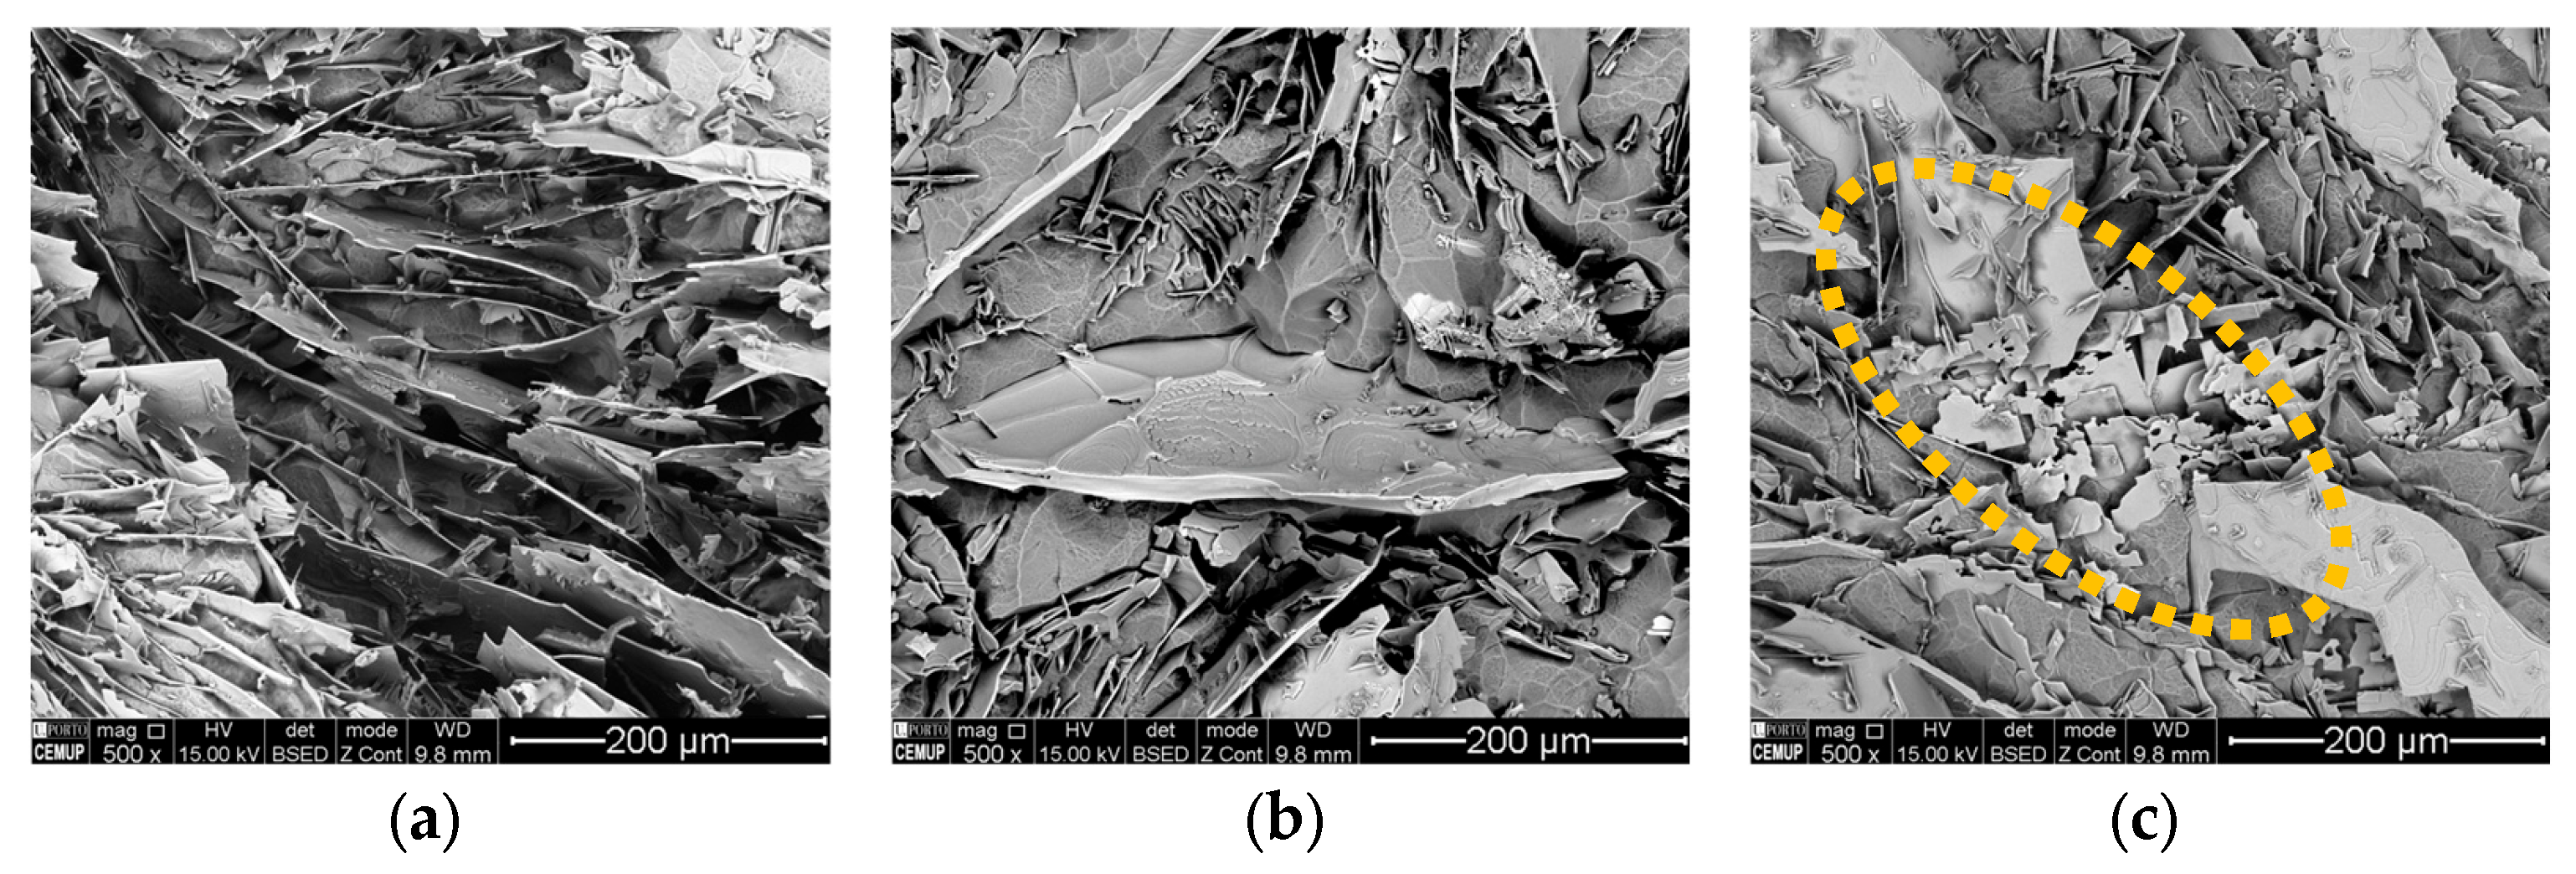
3.2.2. High Fe Alloys
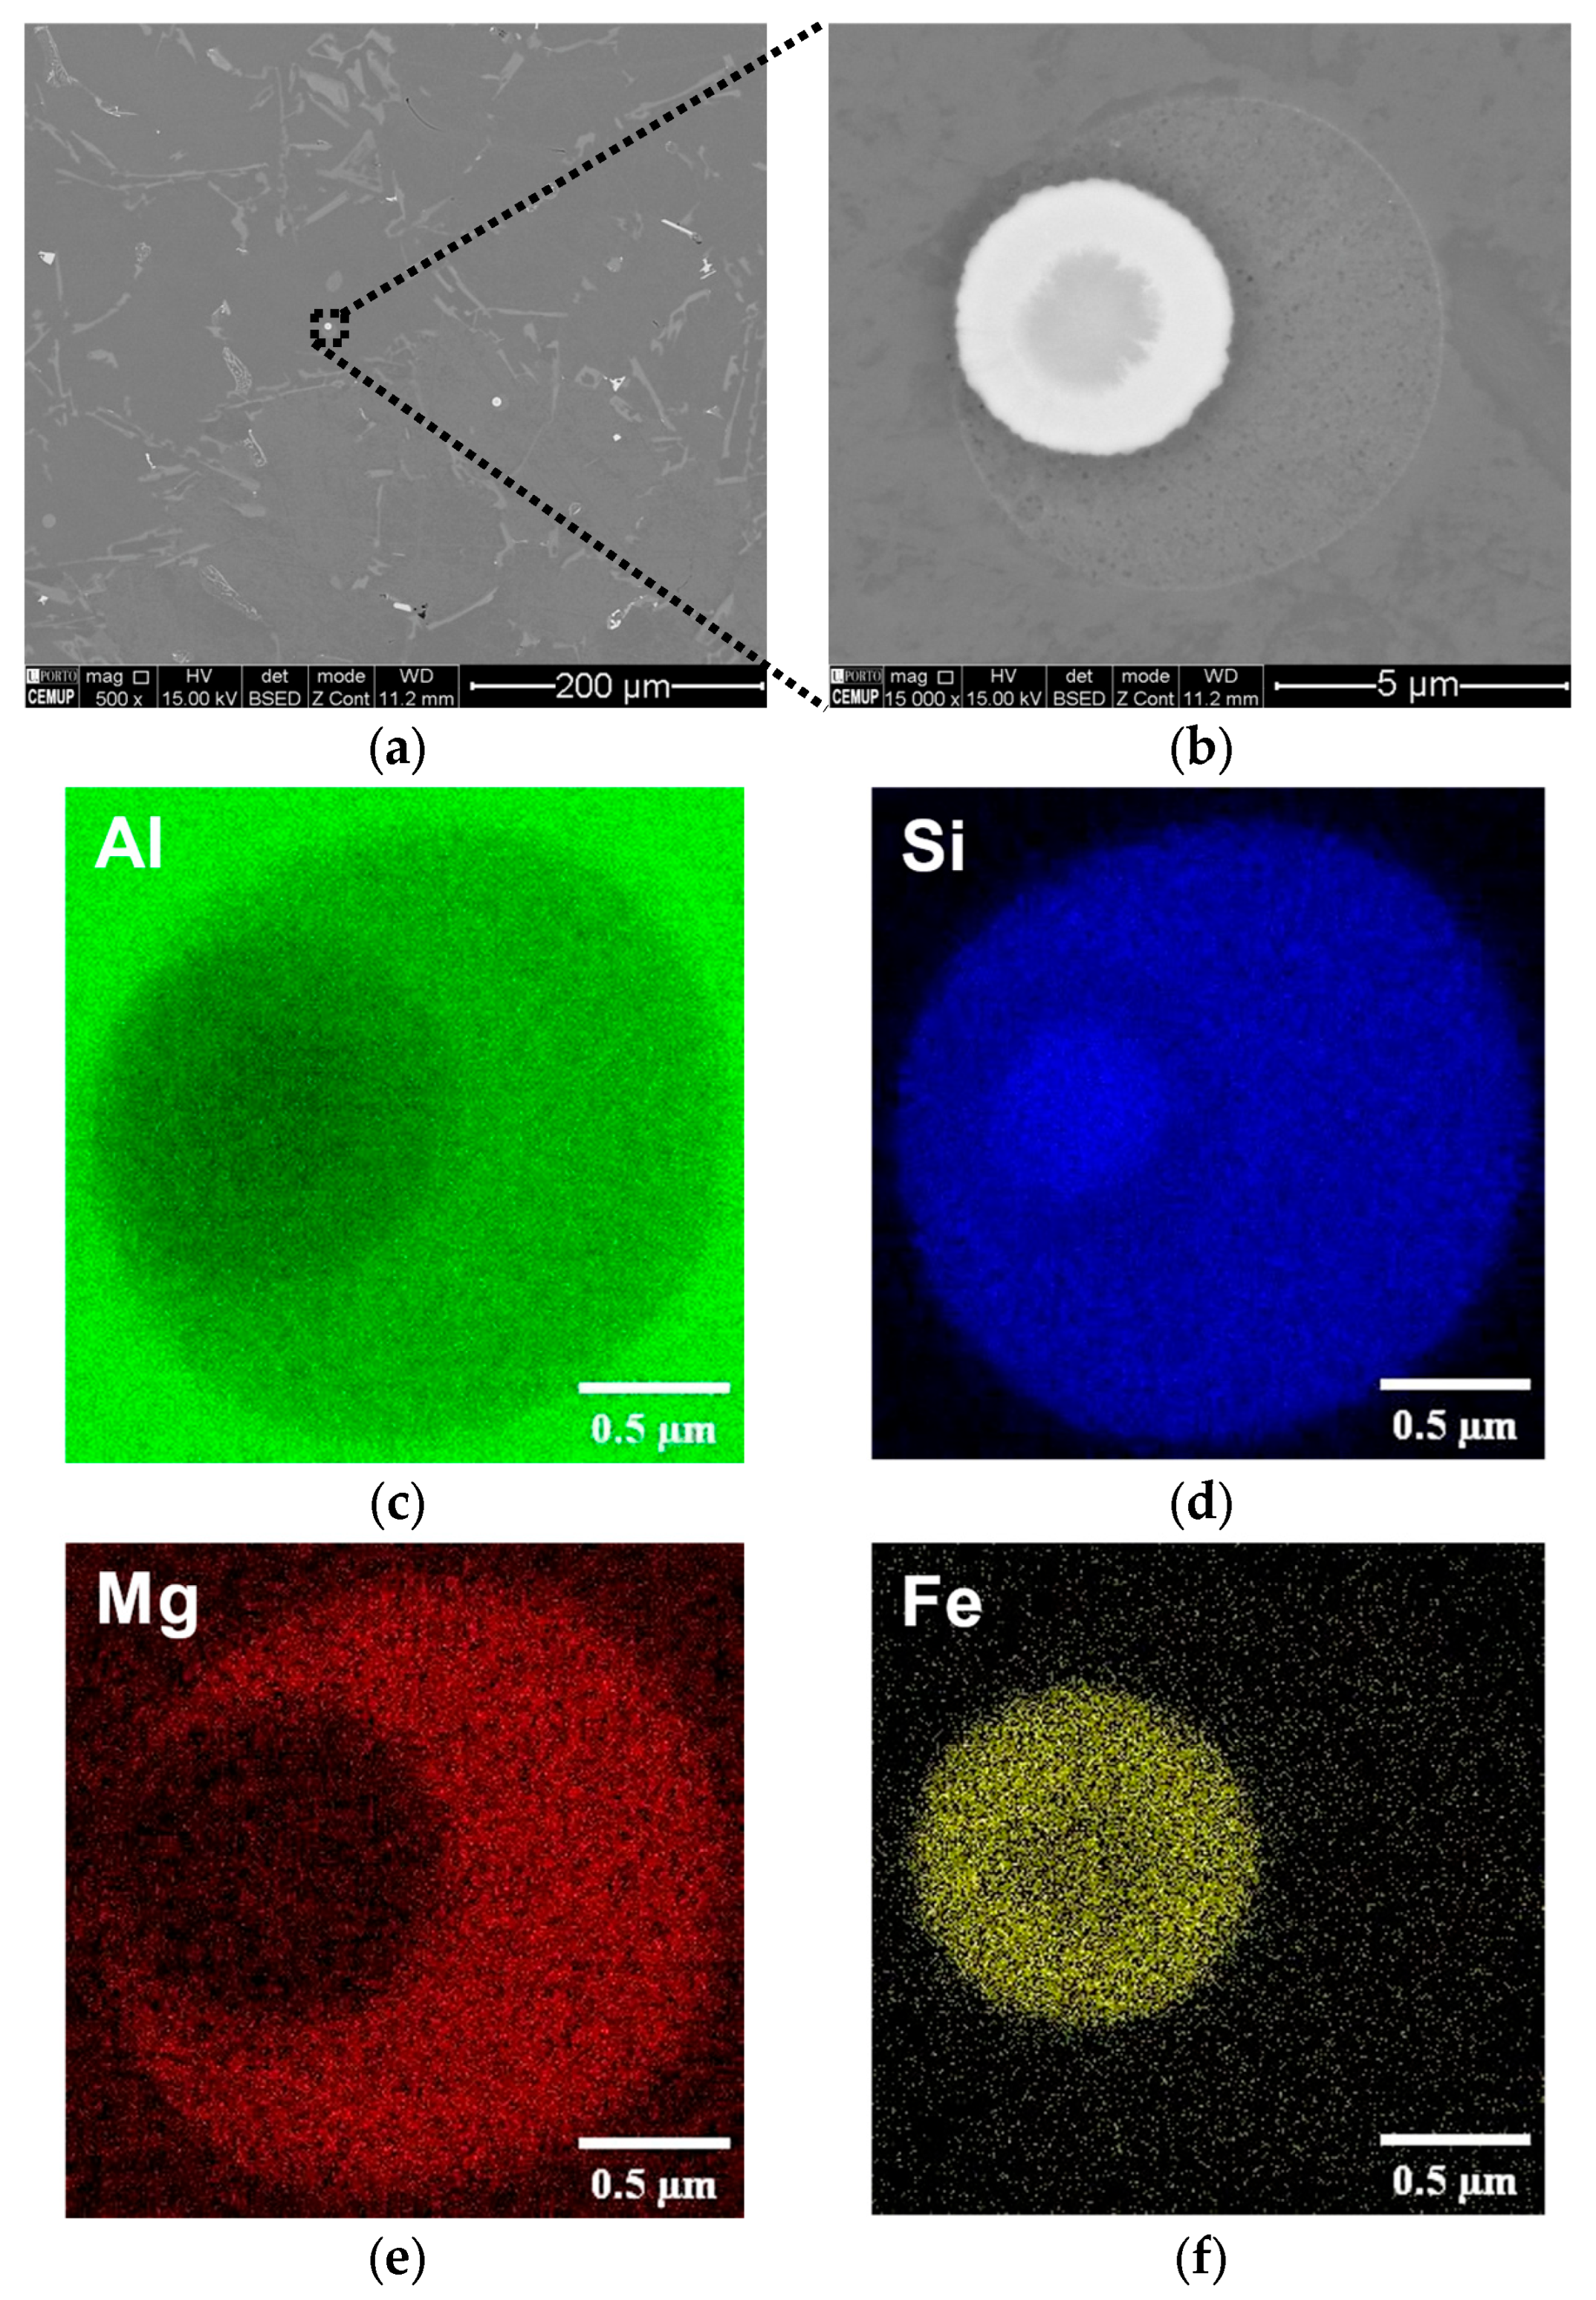
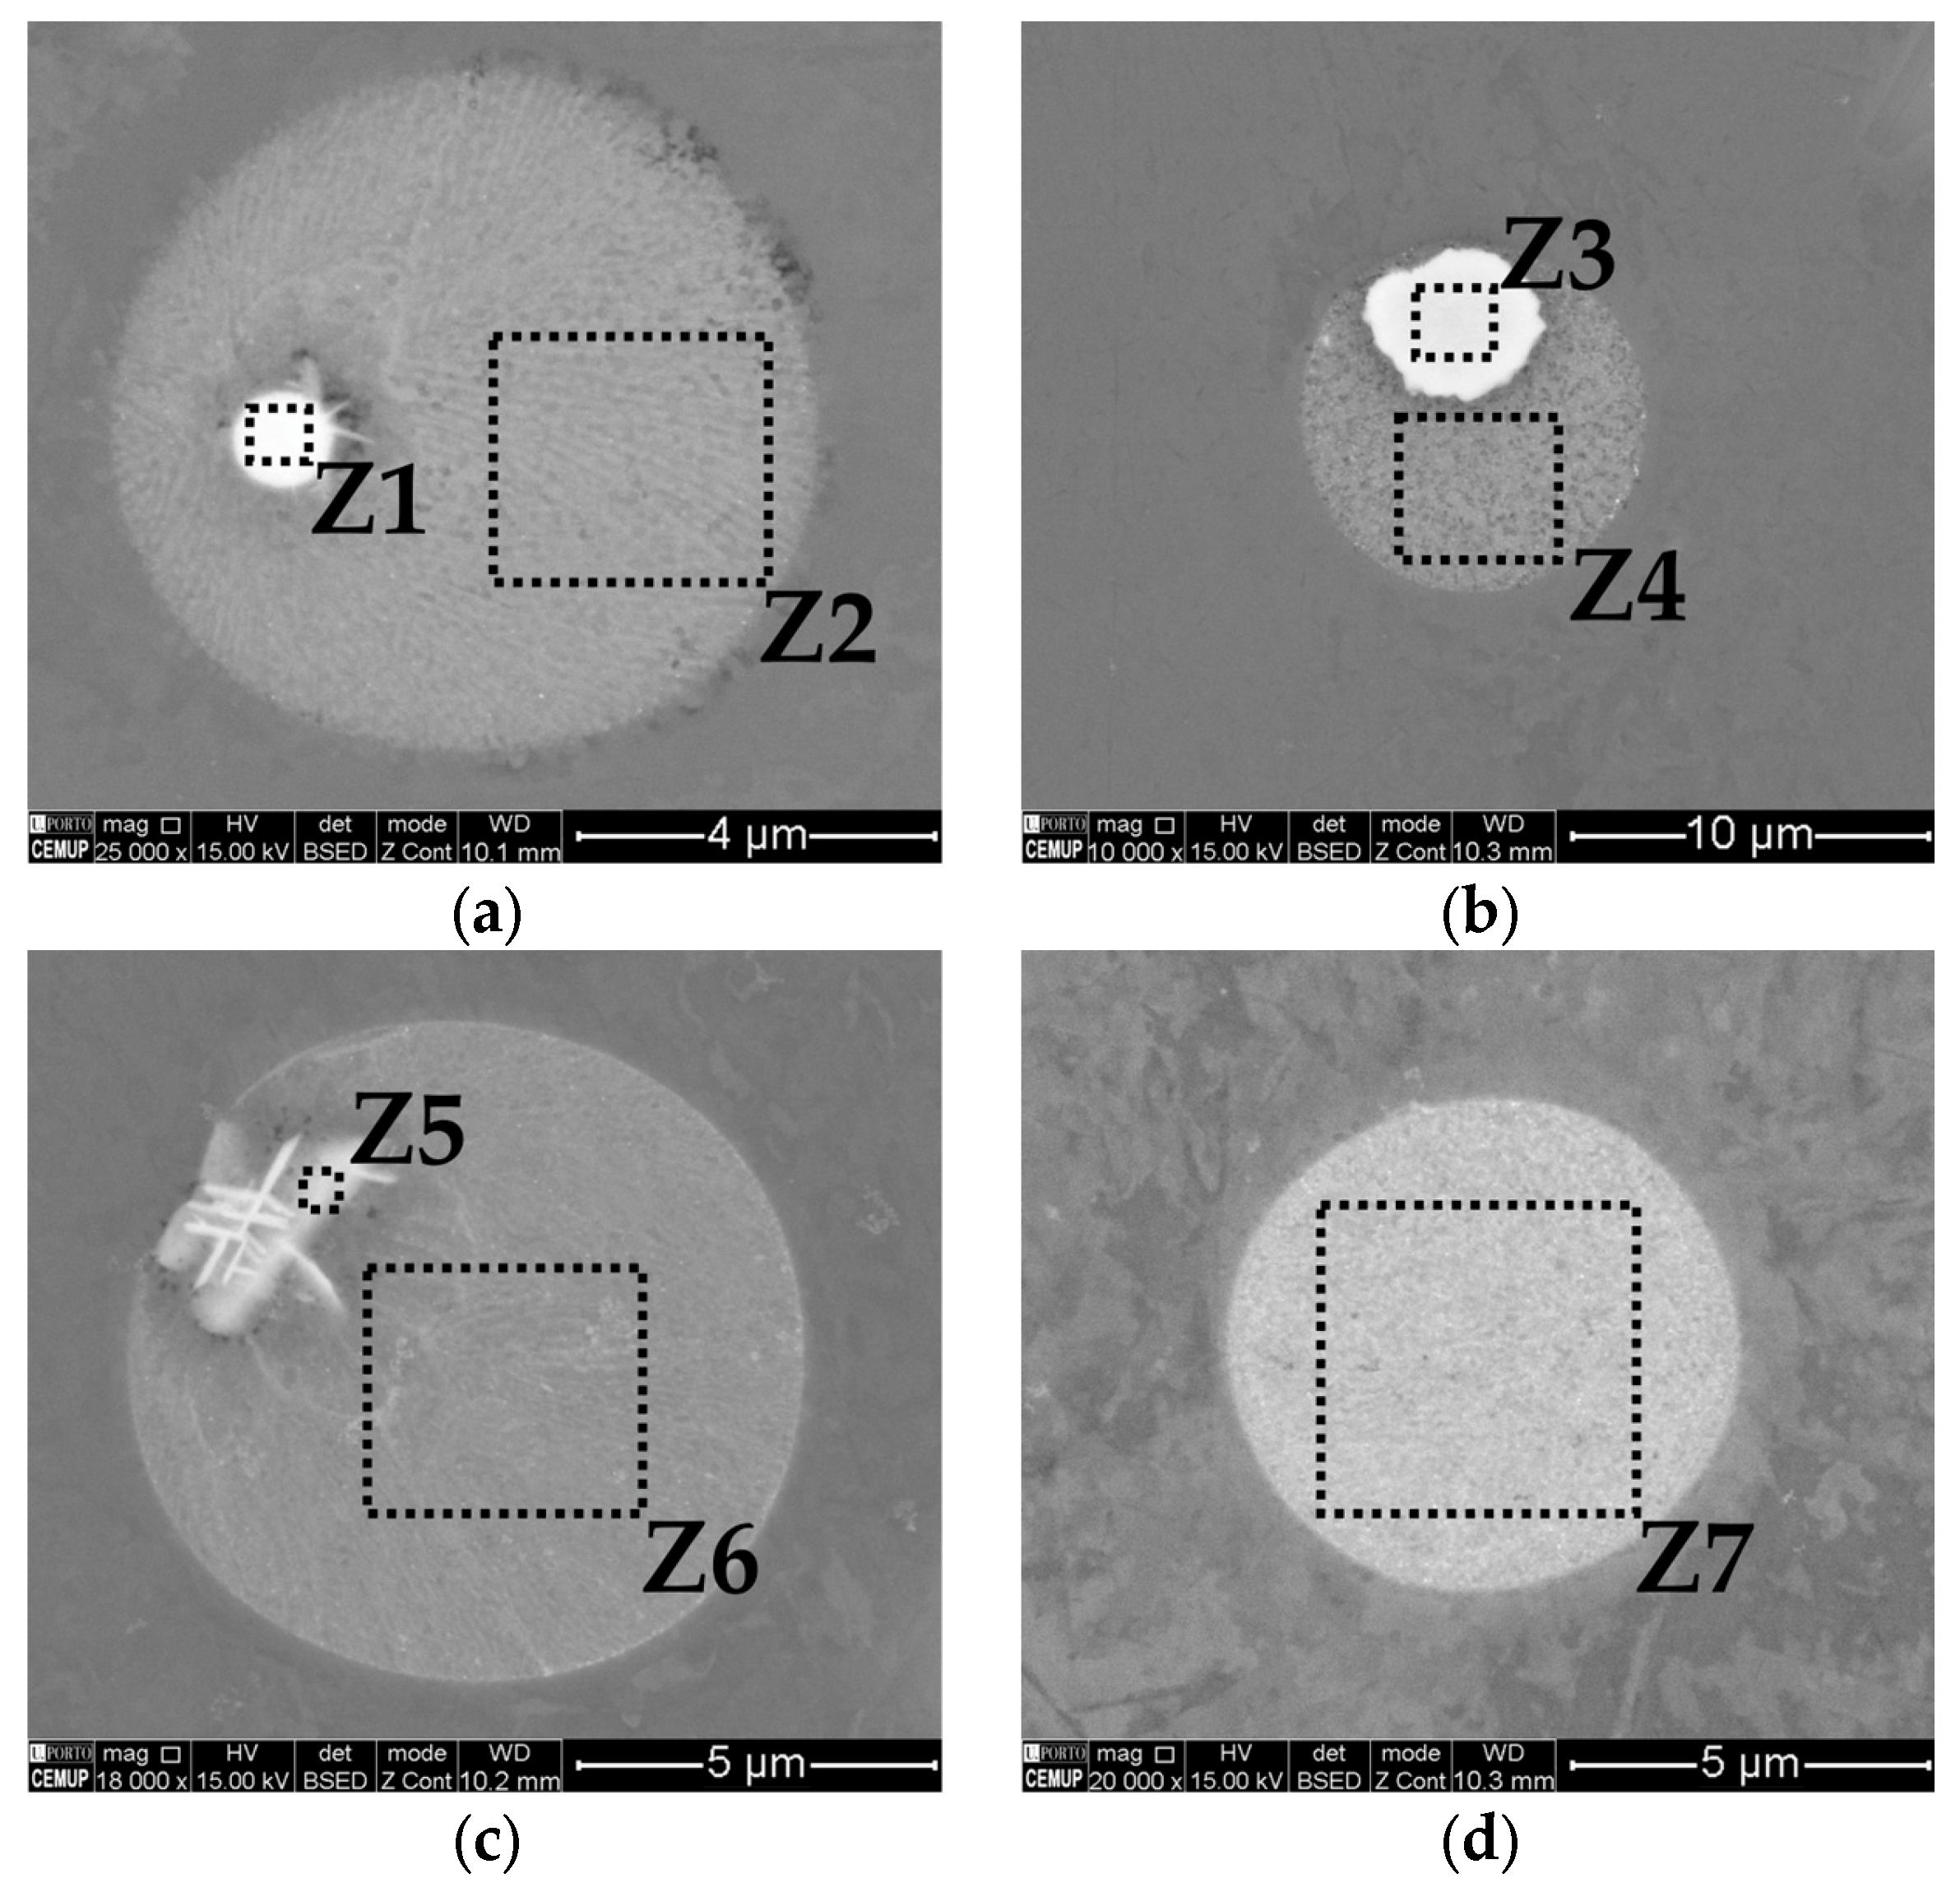
3.2.3. Rosettes
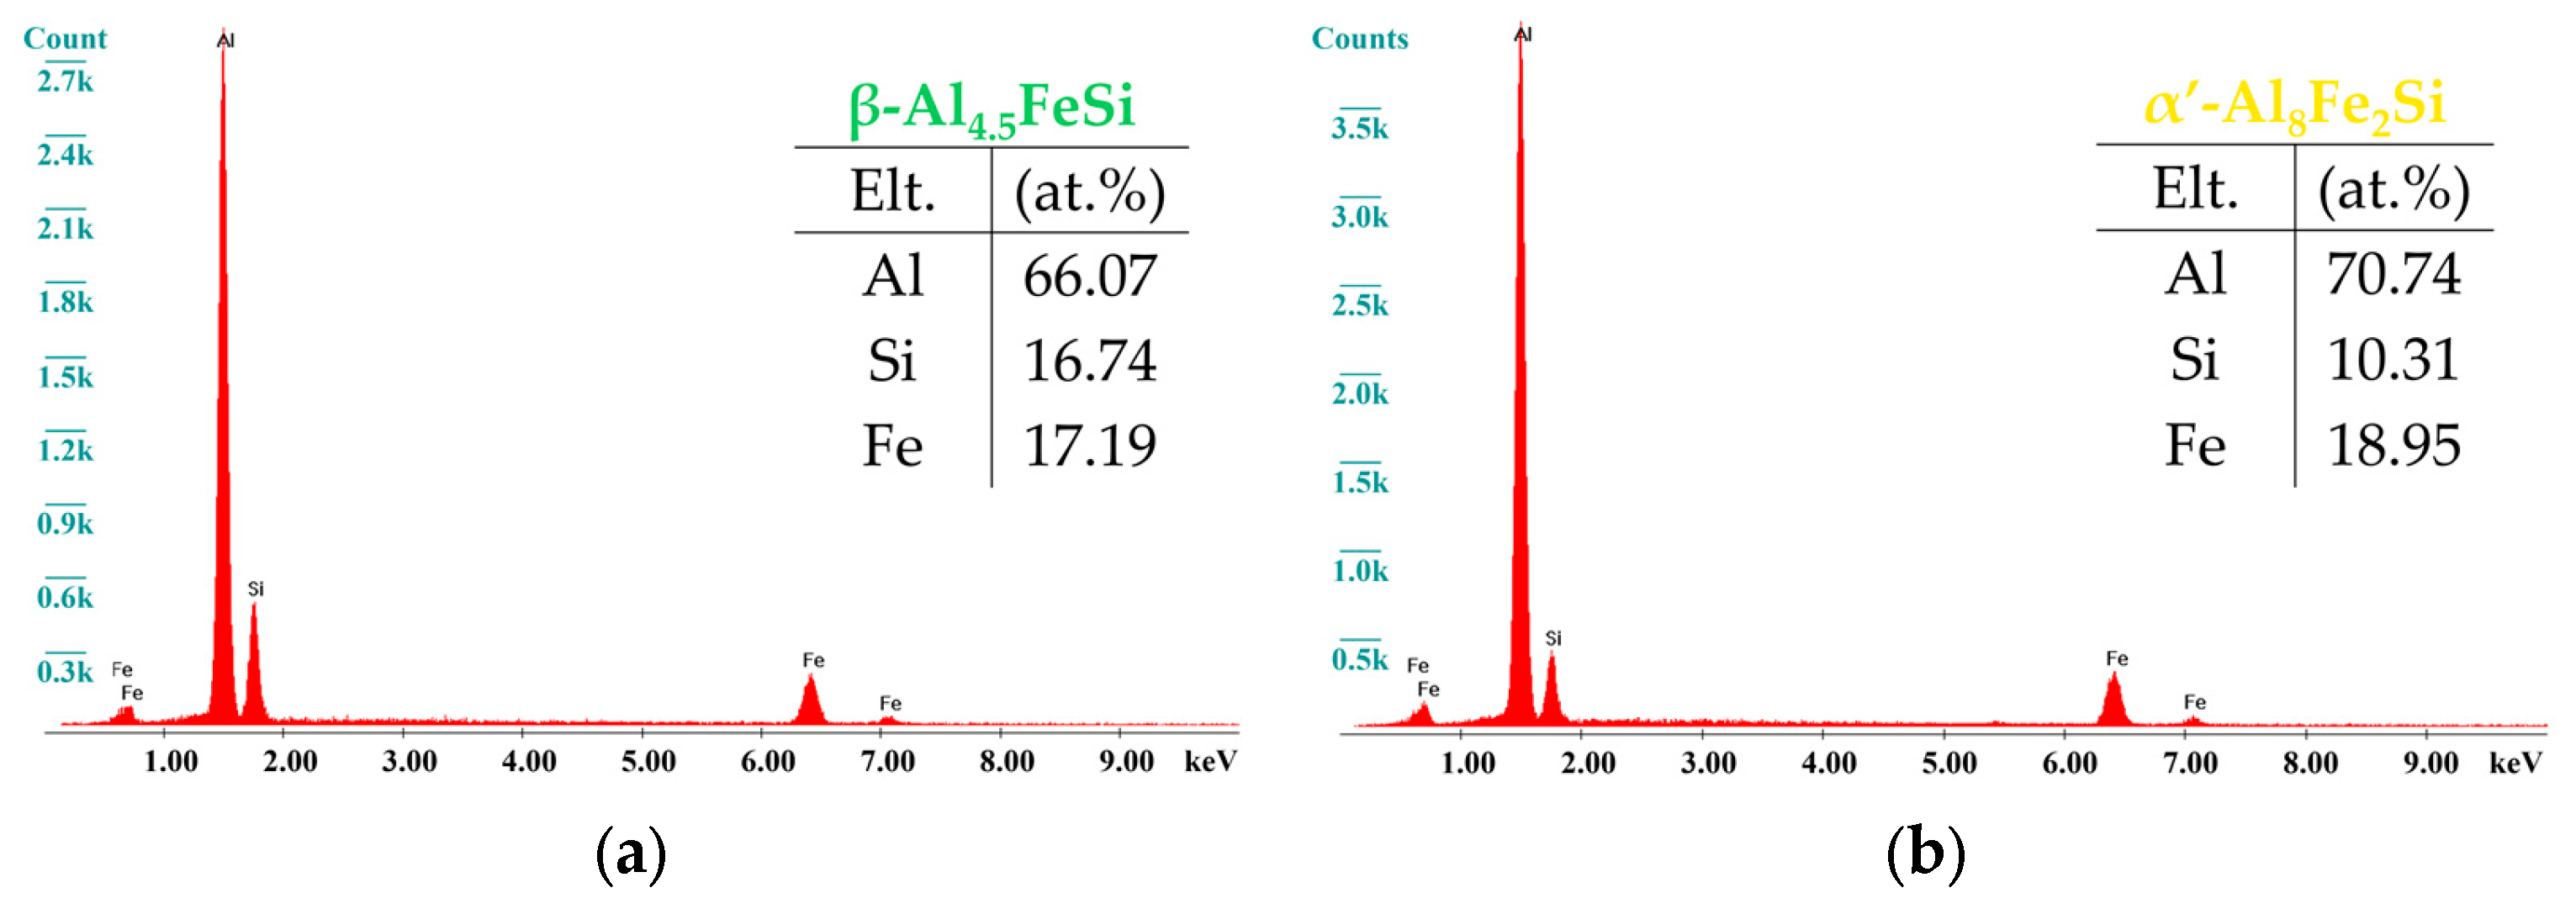
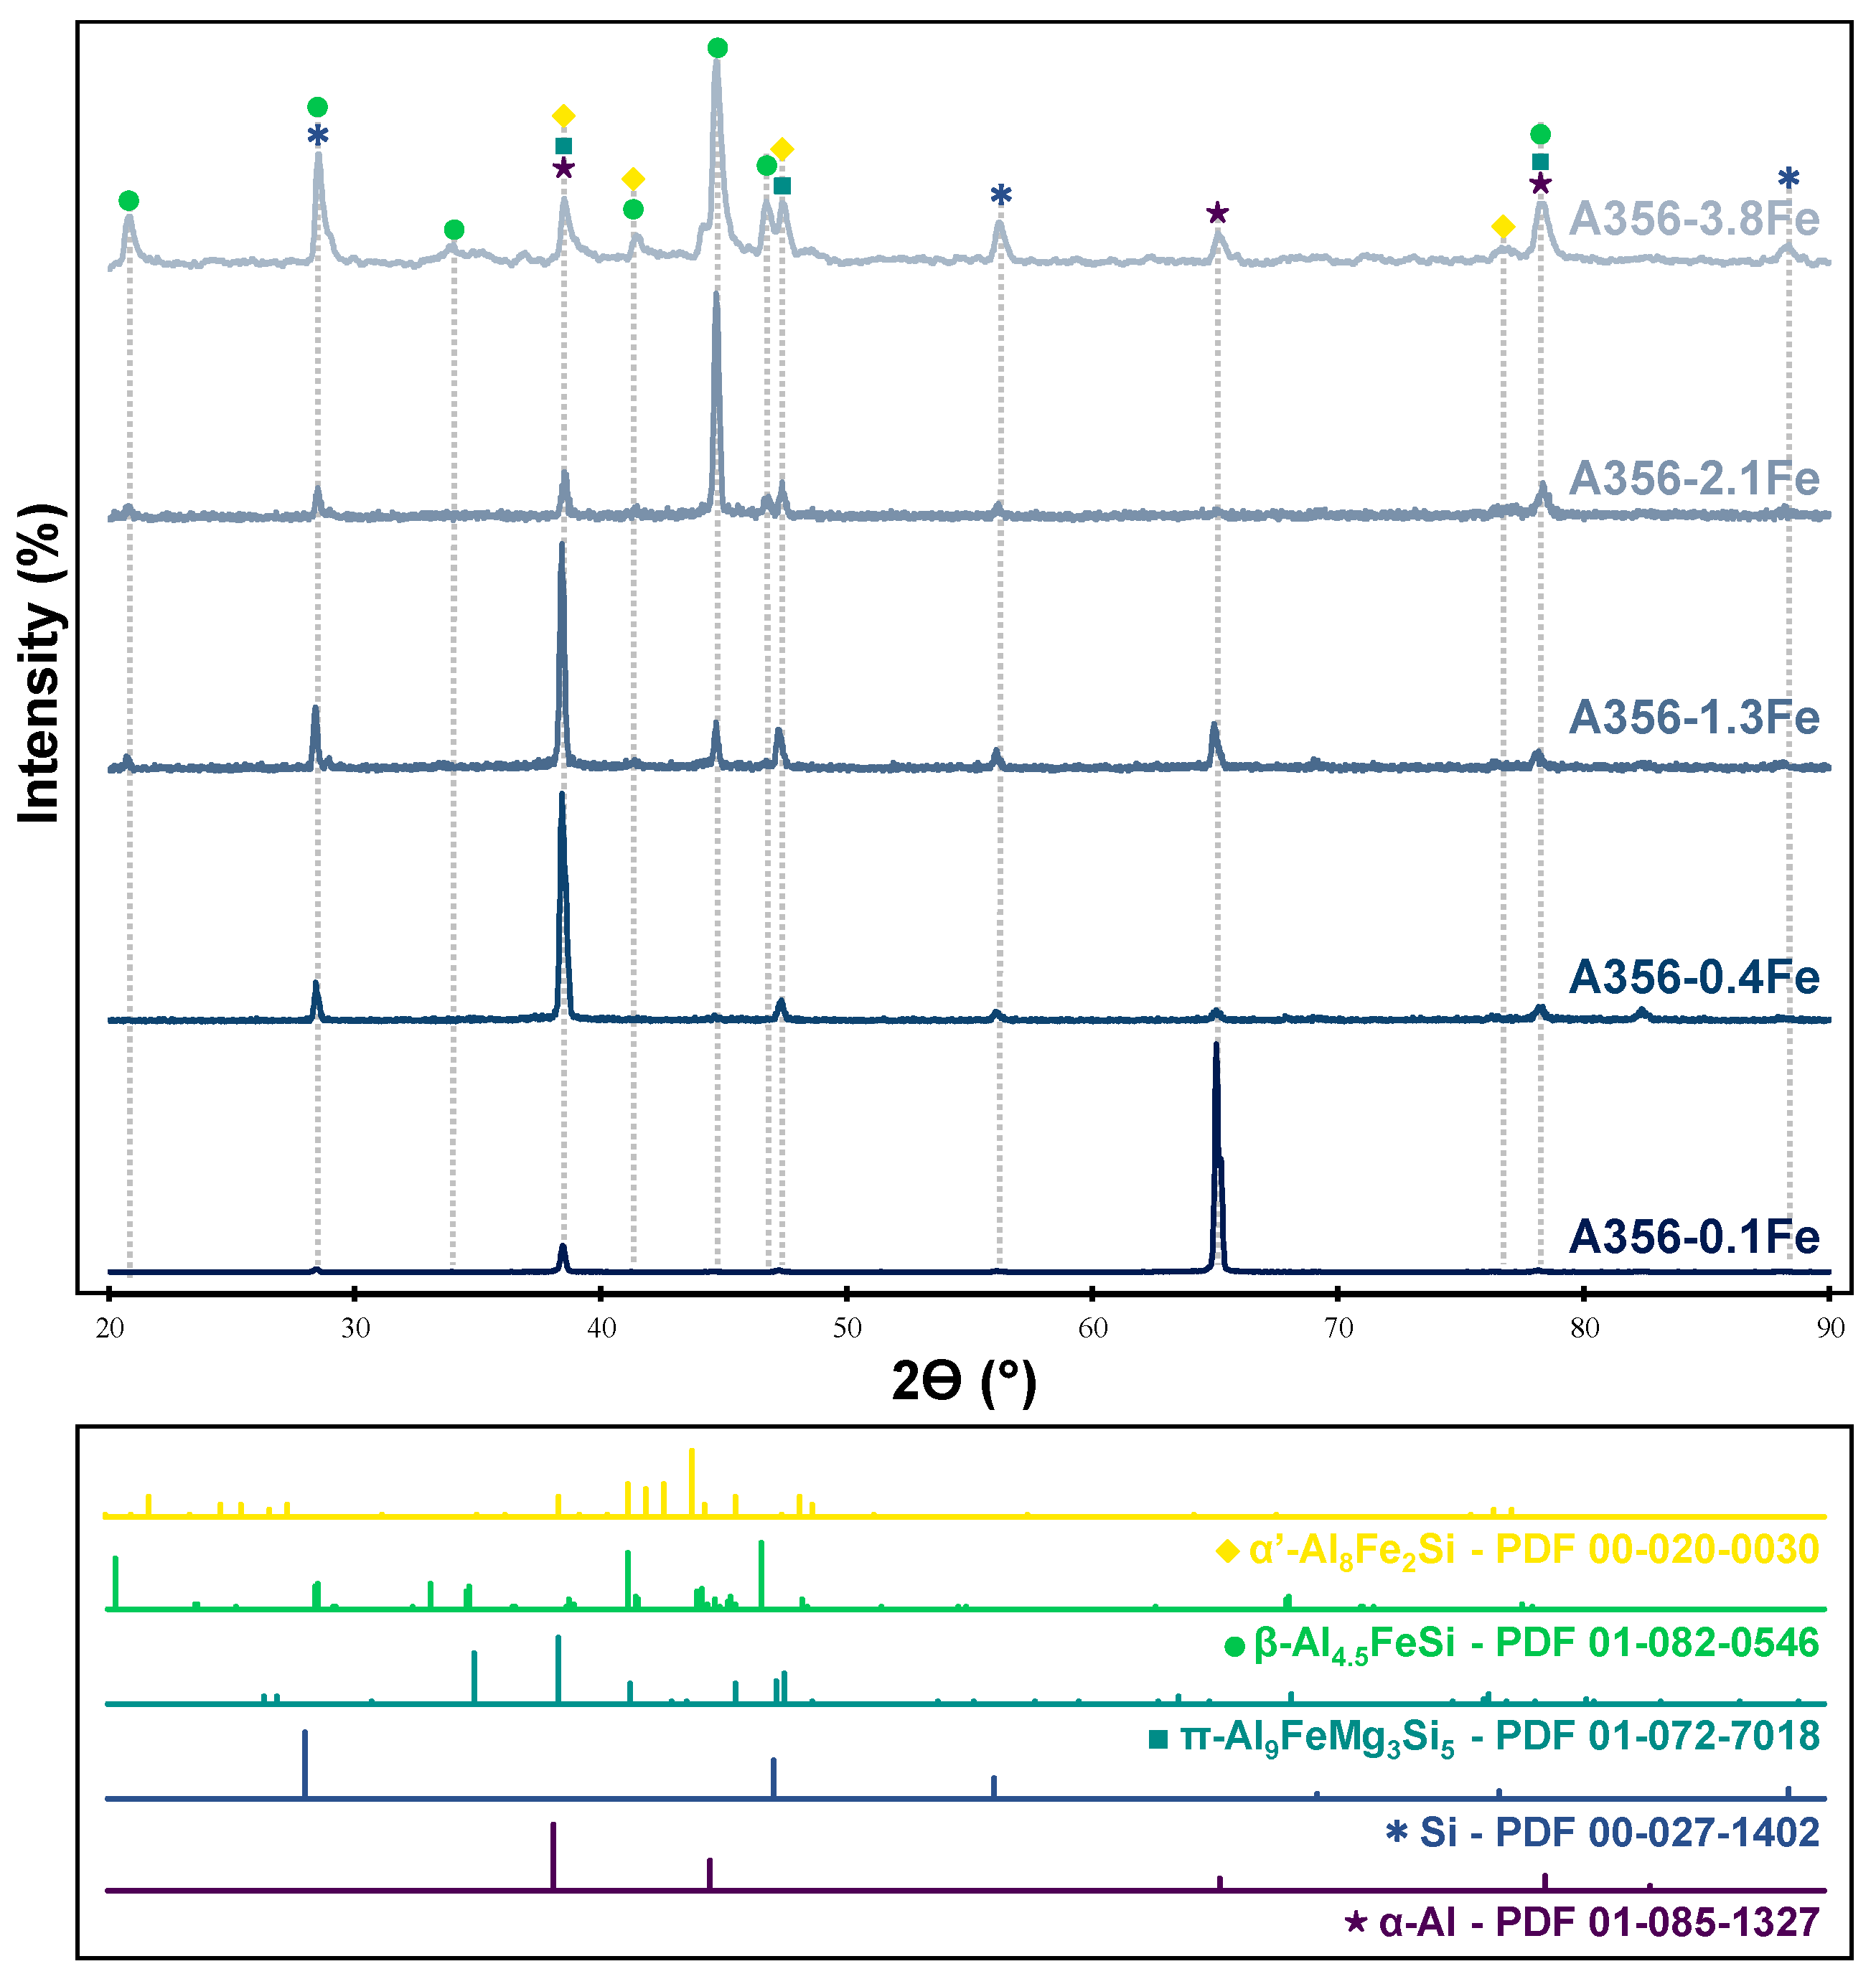
3.3. Phase Identification
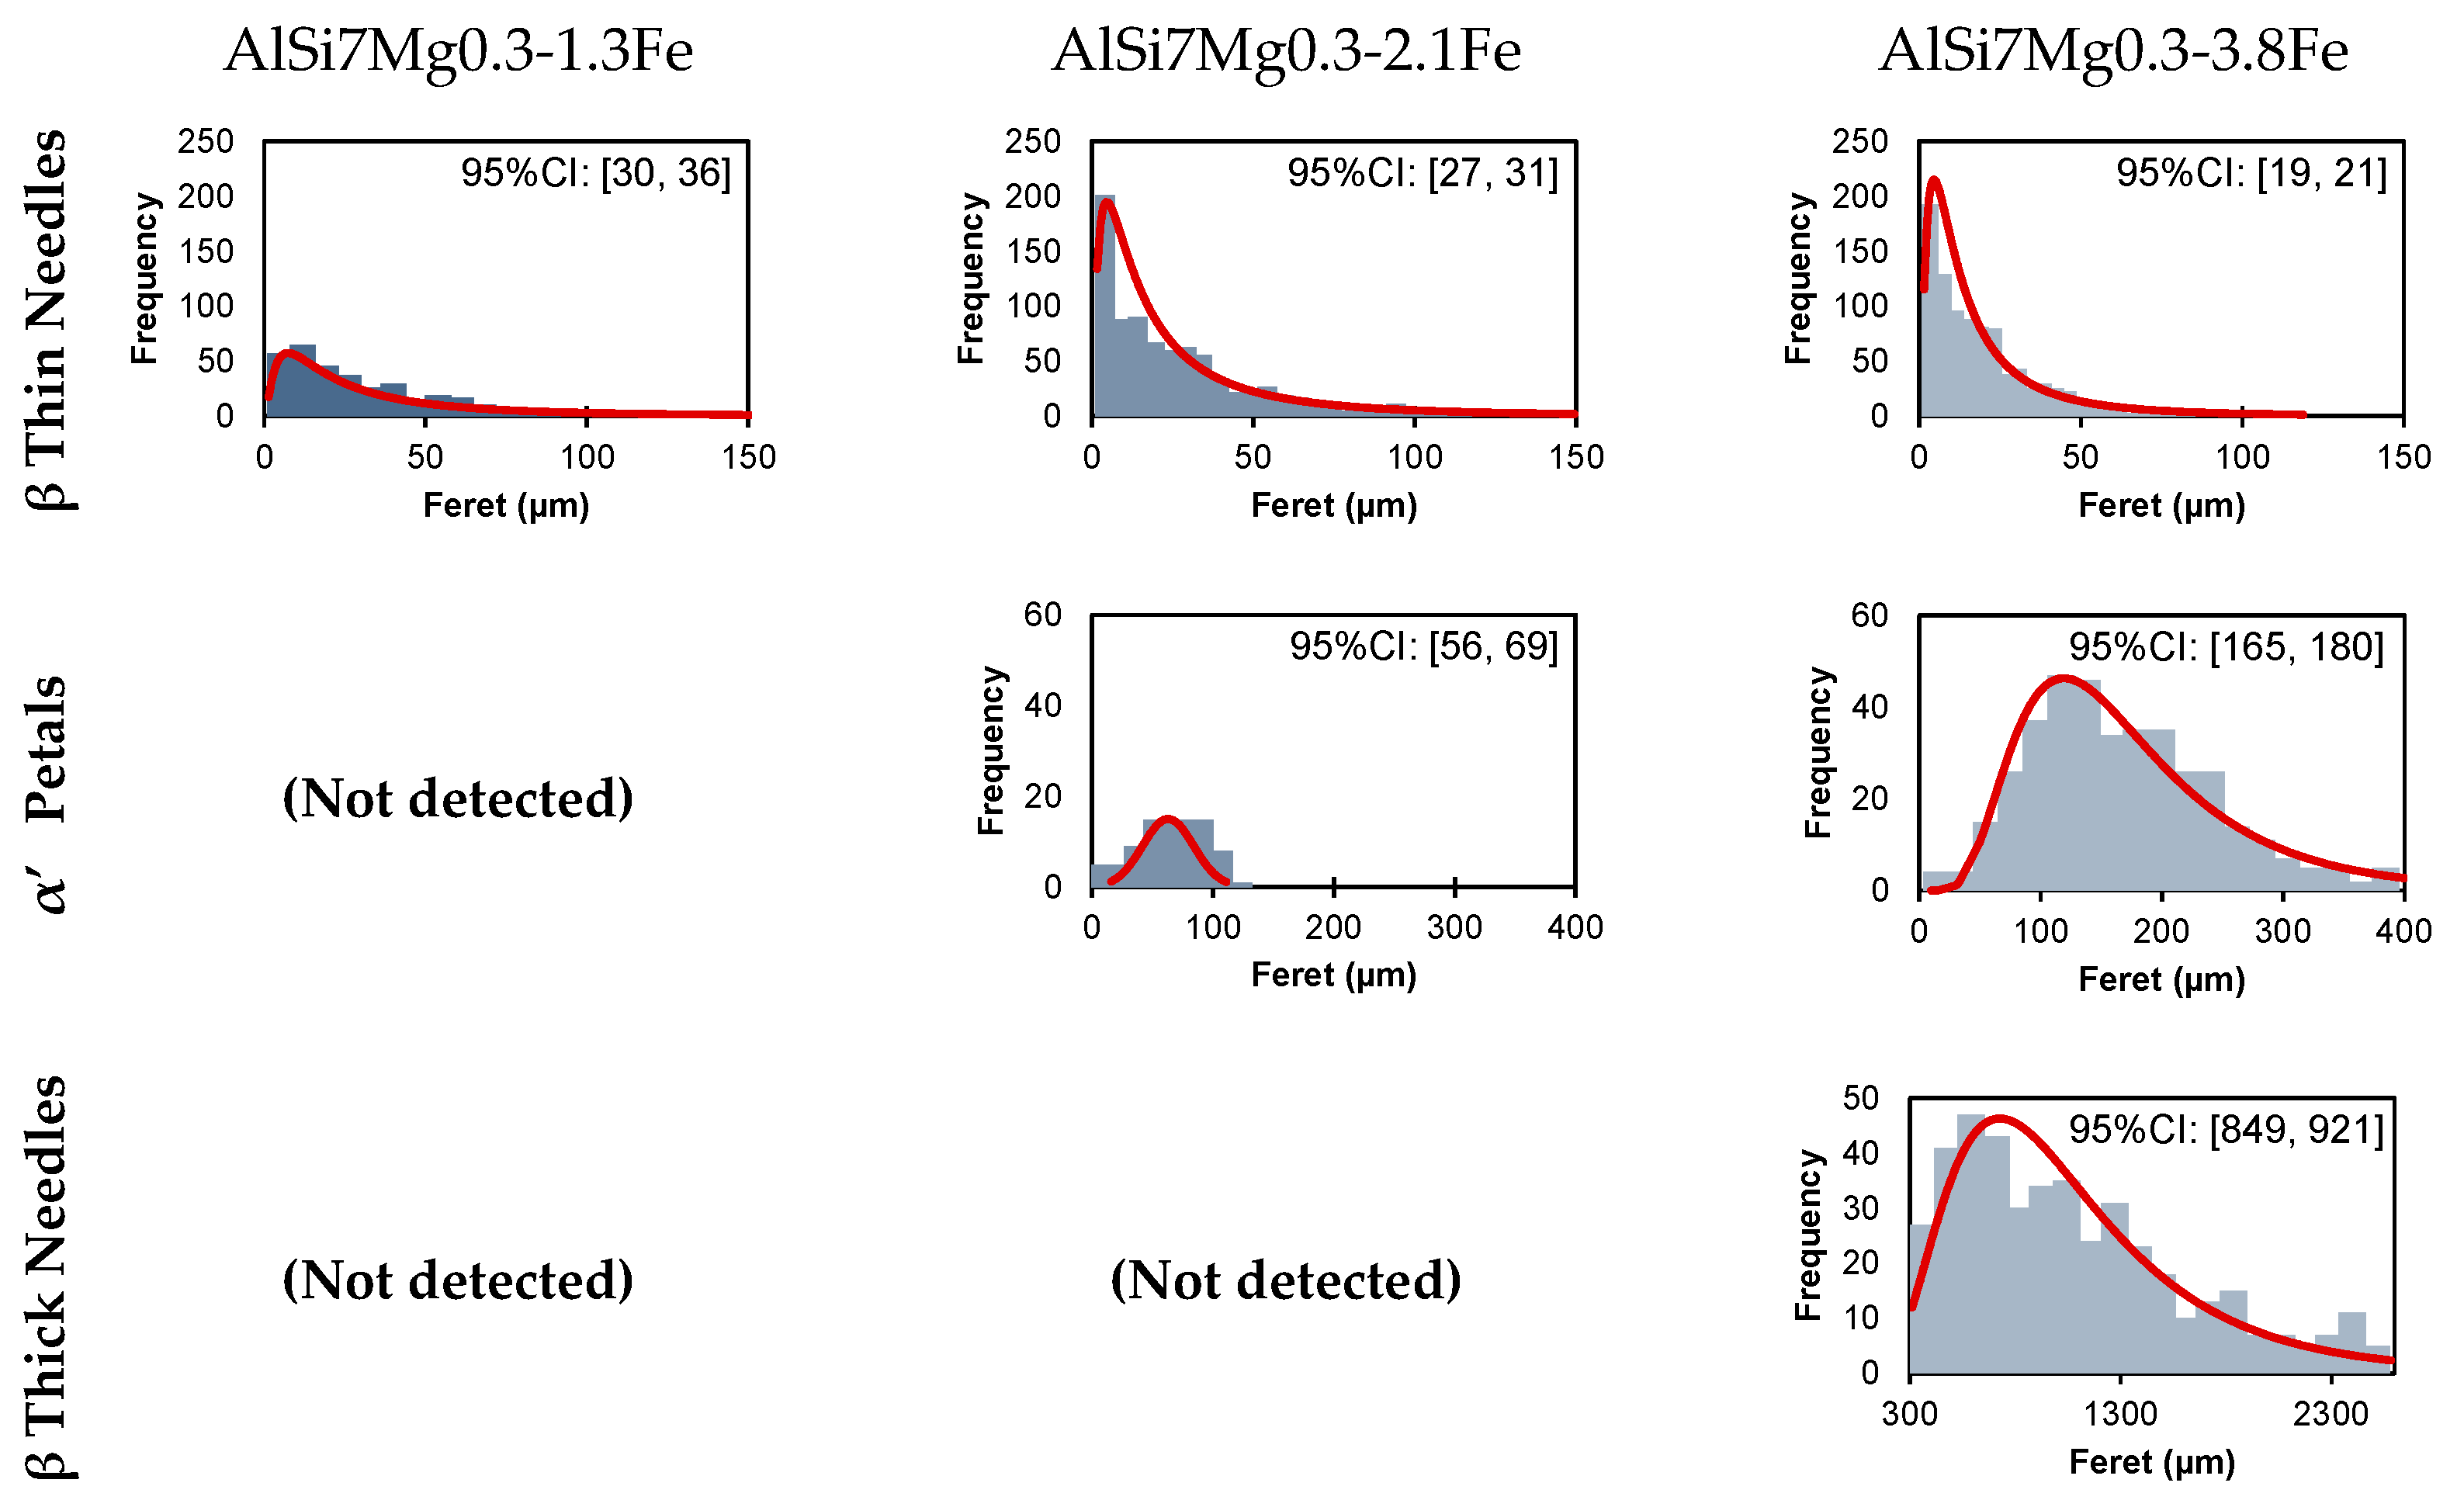
3.4. Quantitative Image Analysis
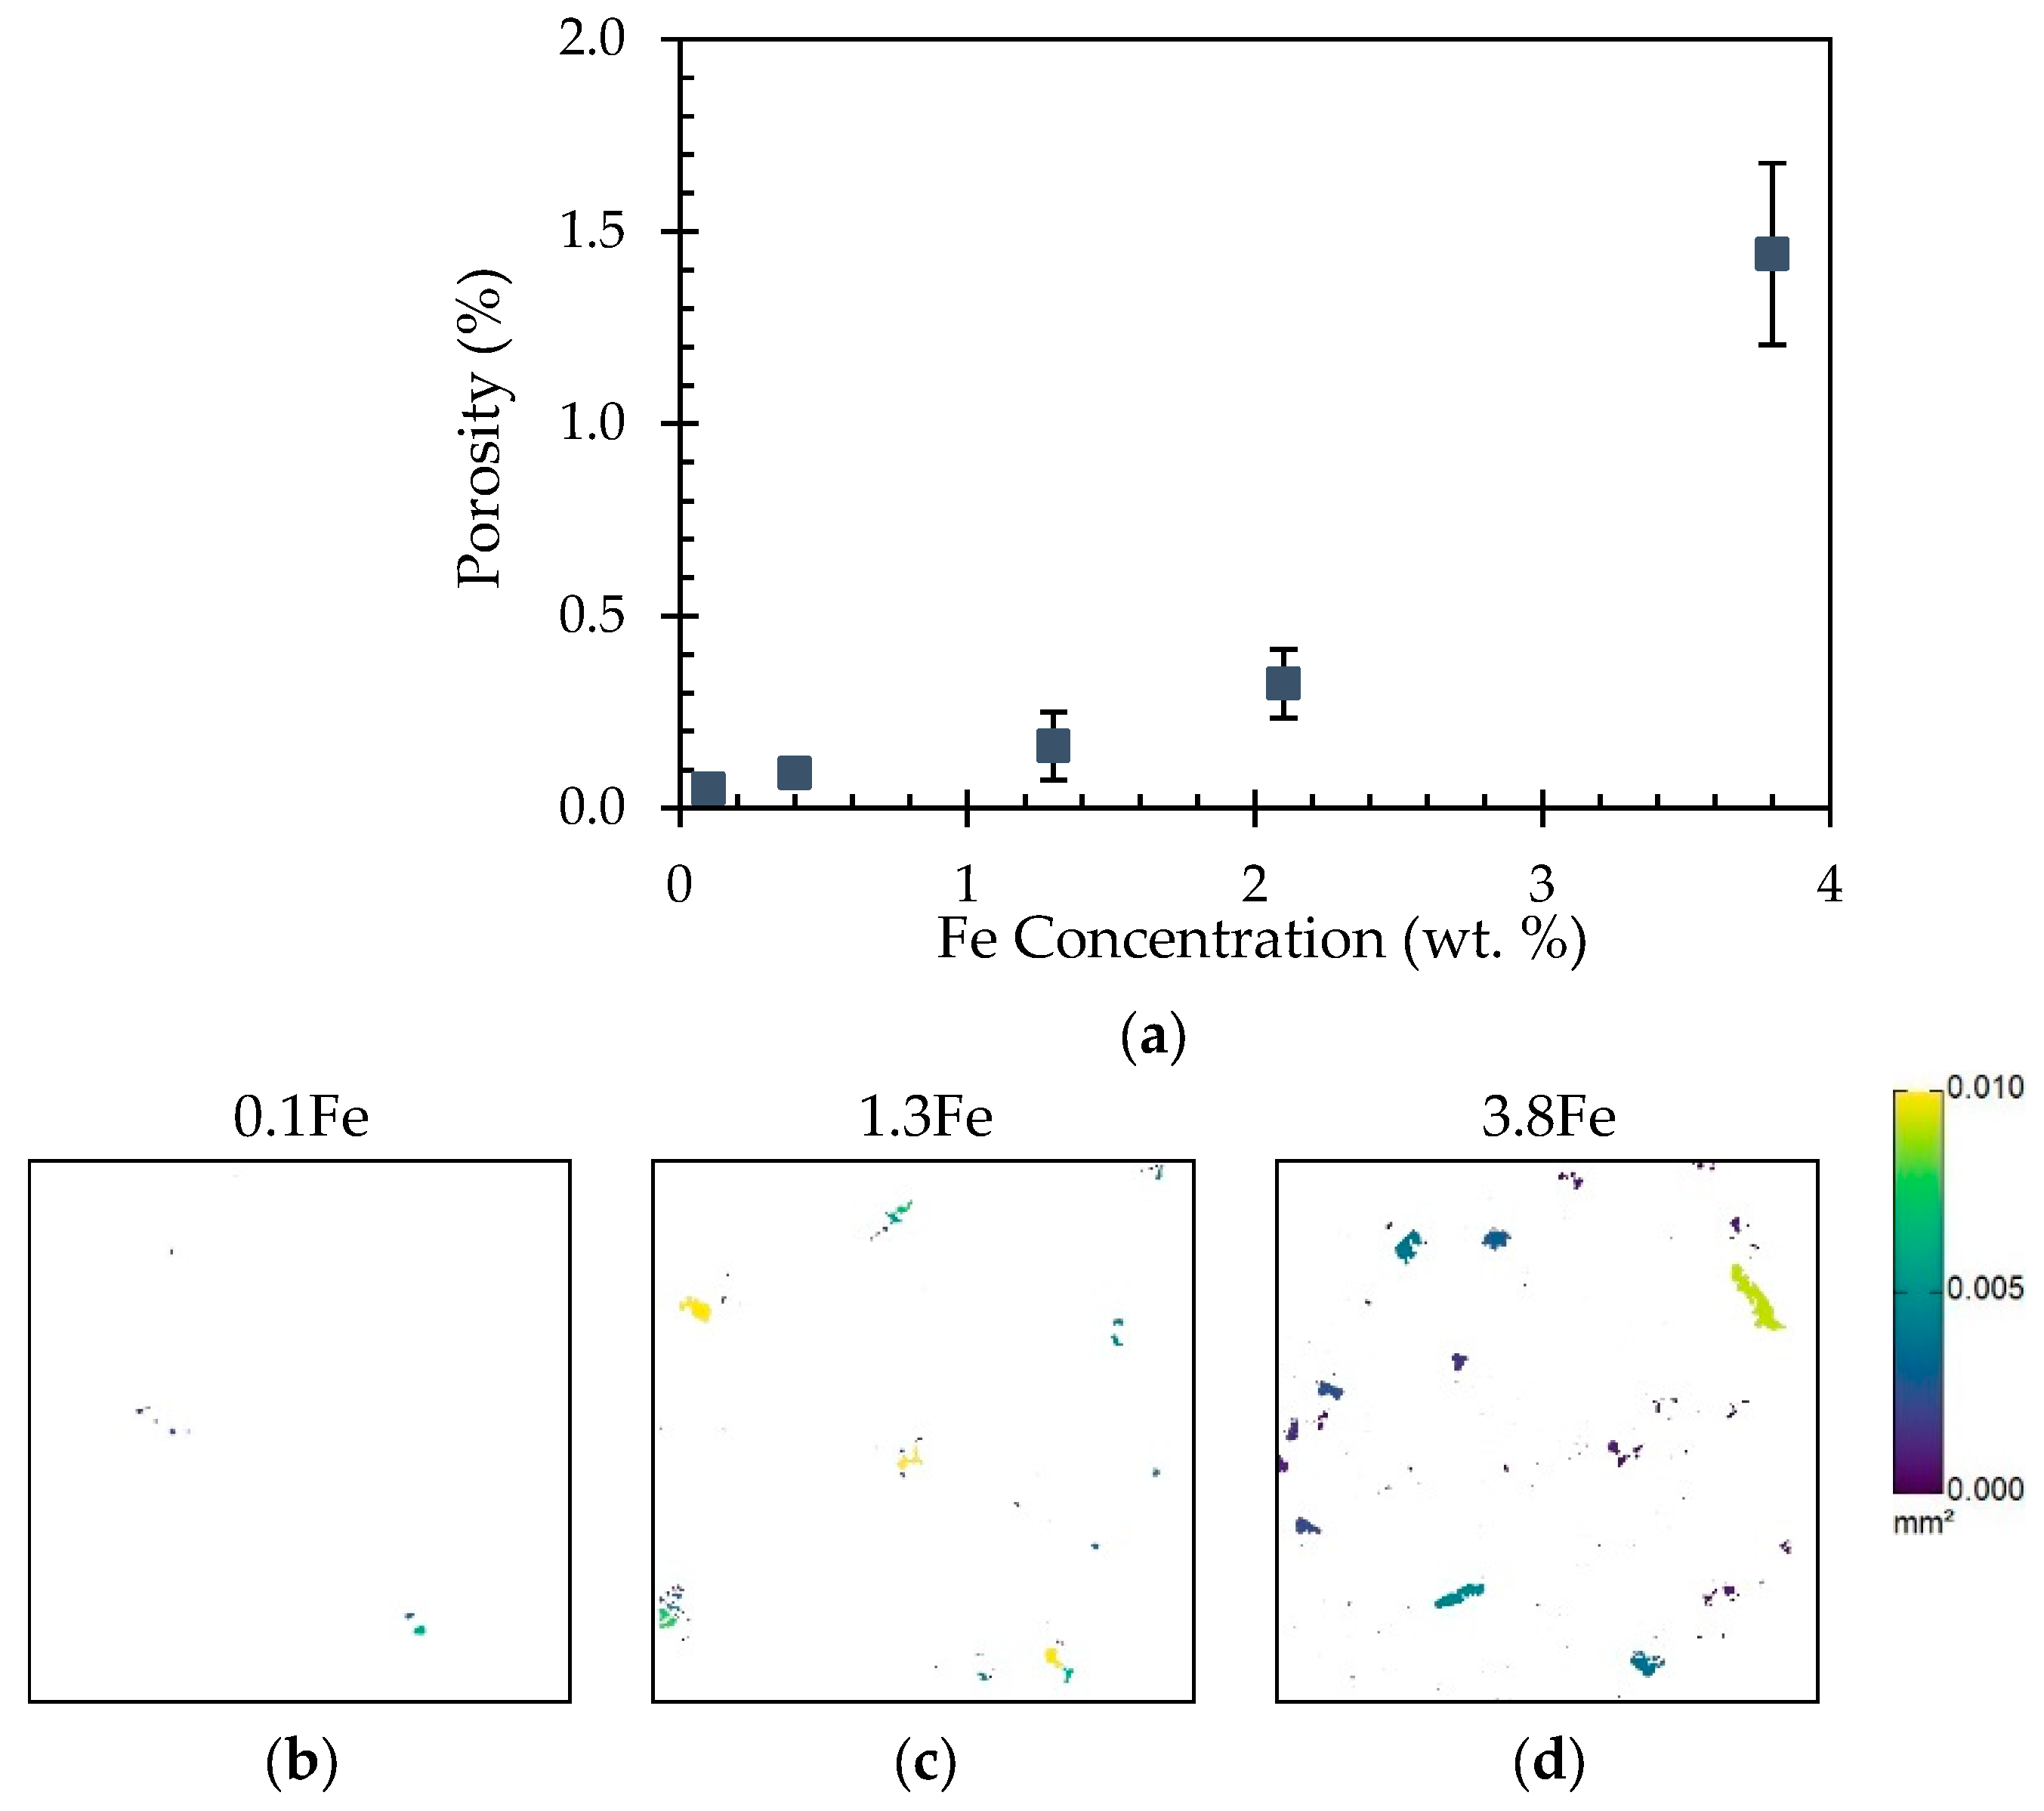
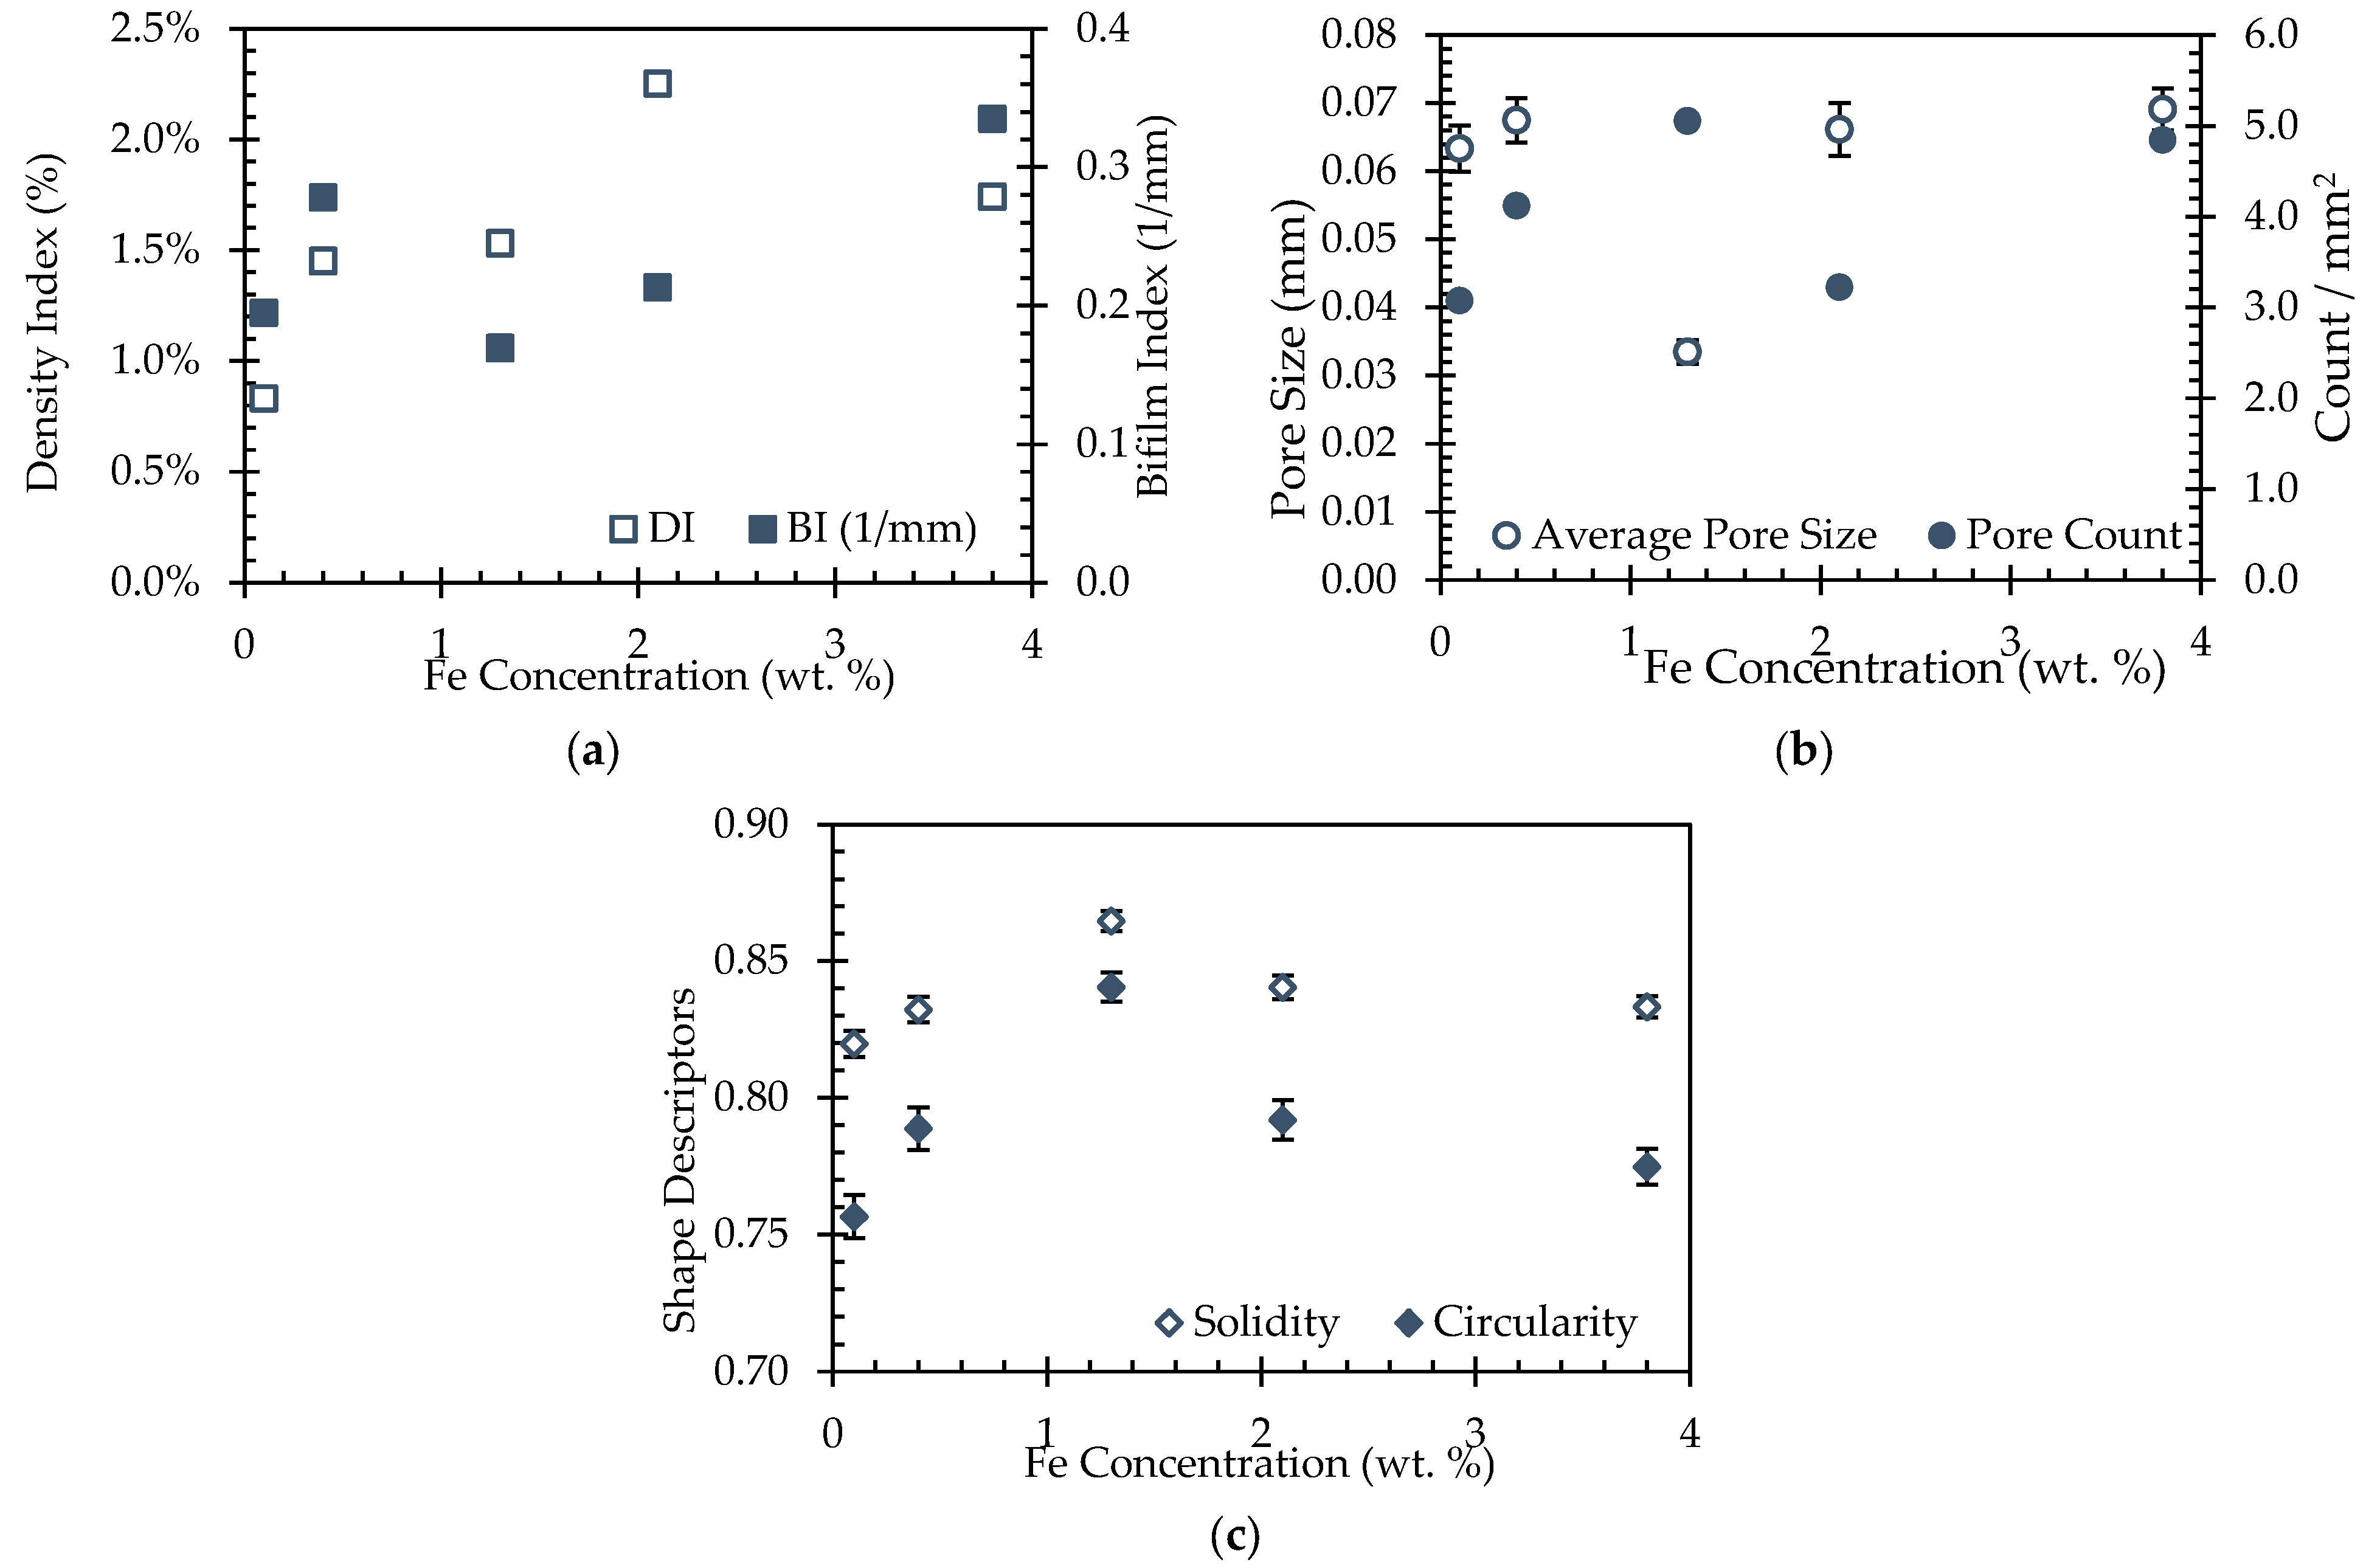
3.5. Porosity
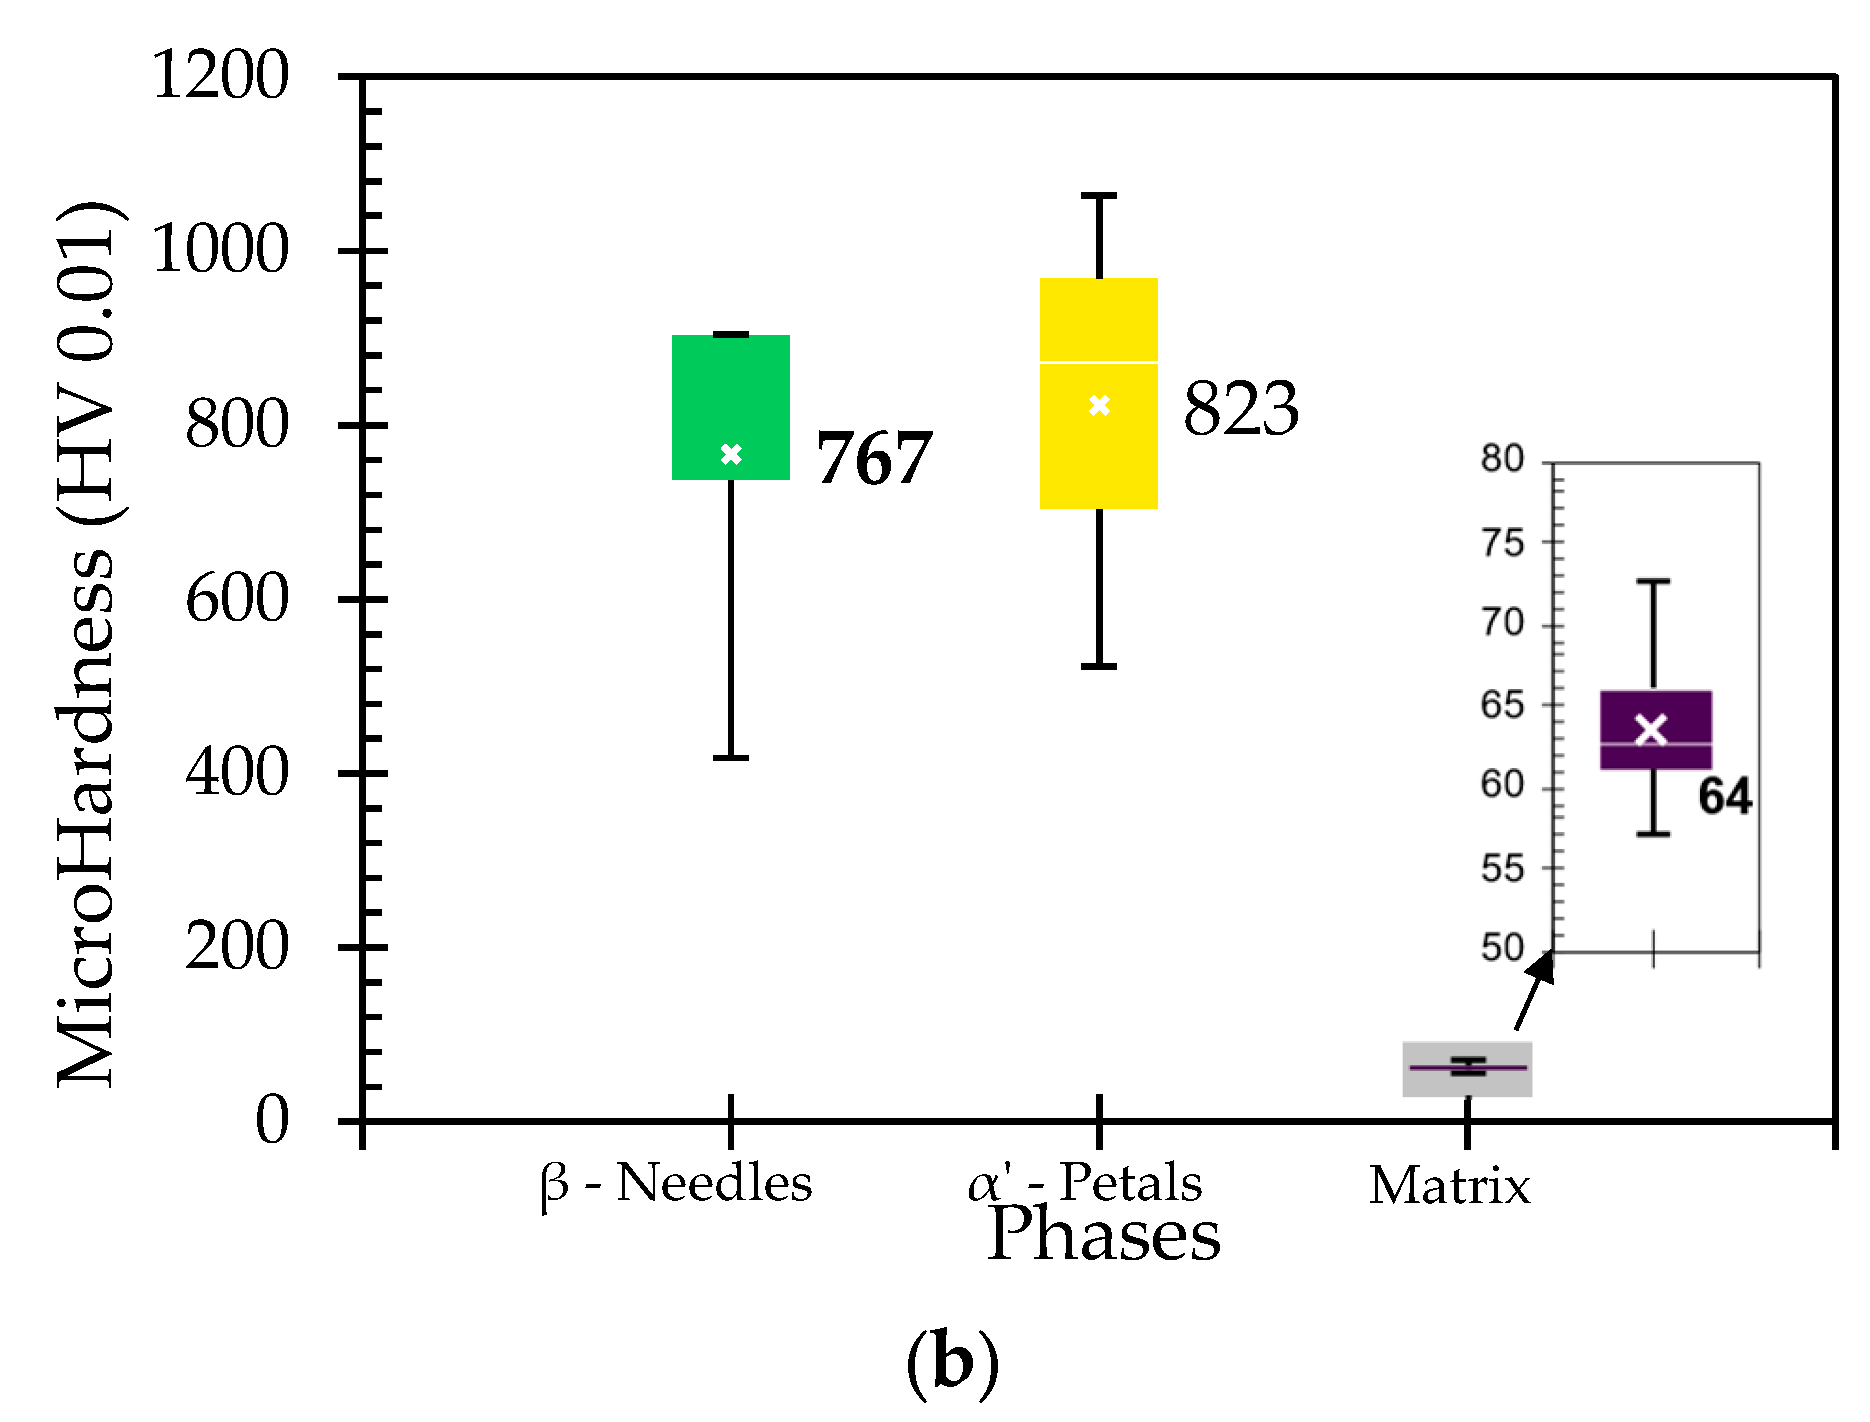
3.6. Hardness
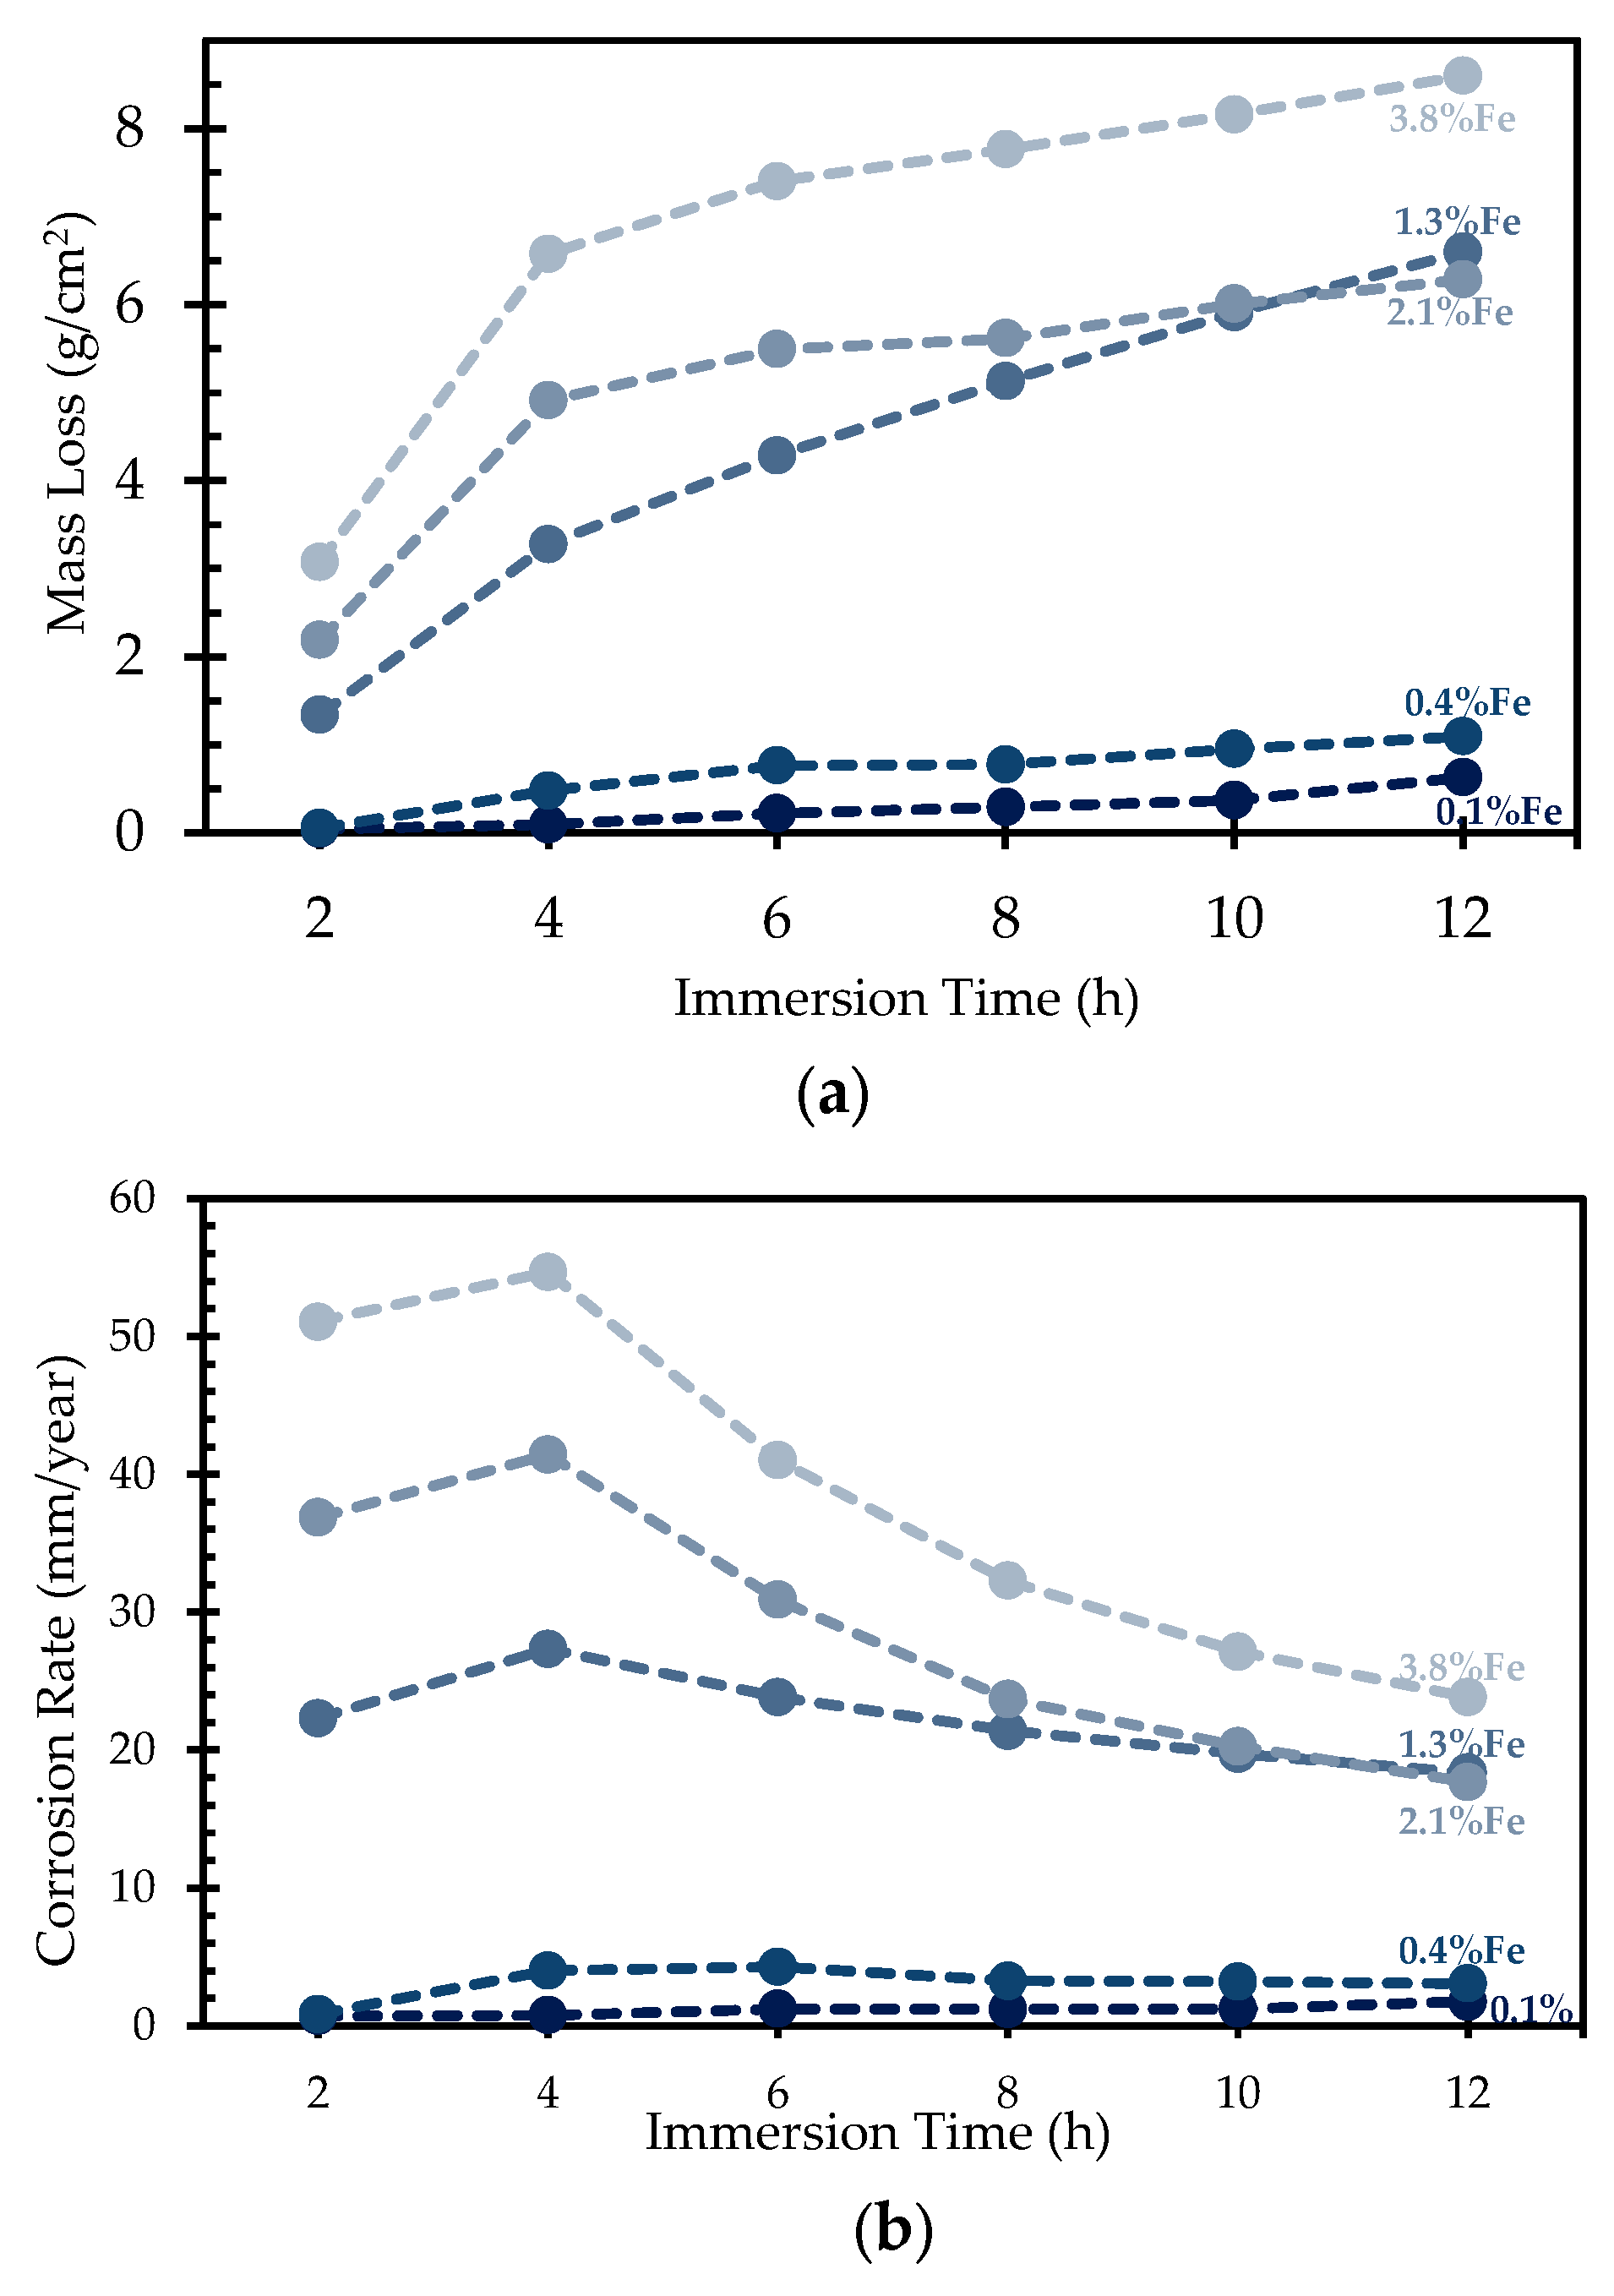
3.7. Corrosion Behaviour
4. Discussion
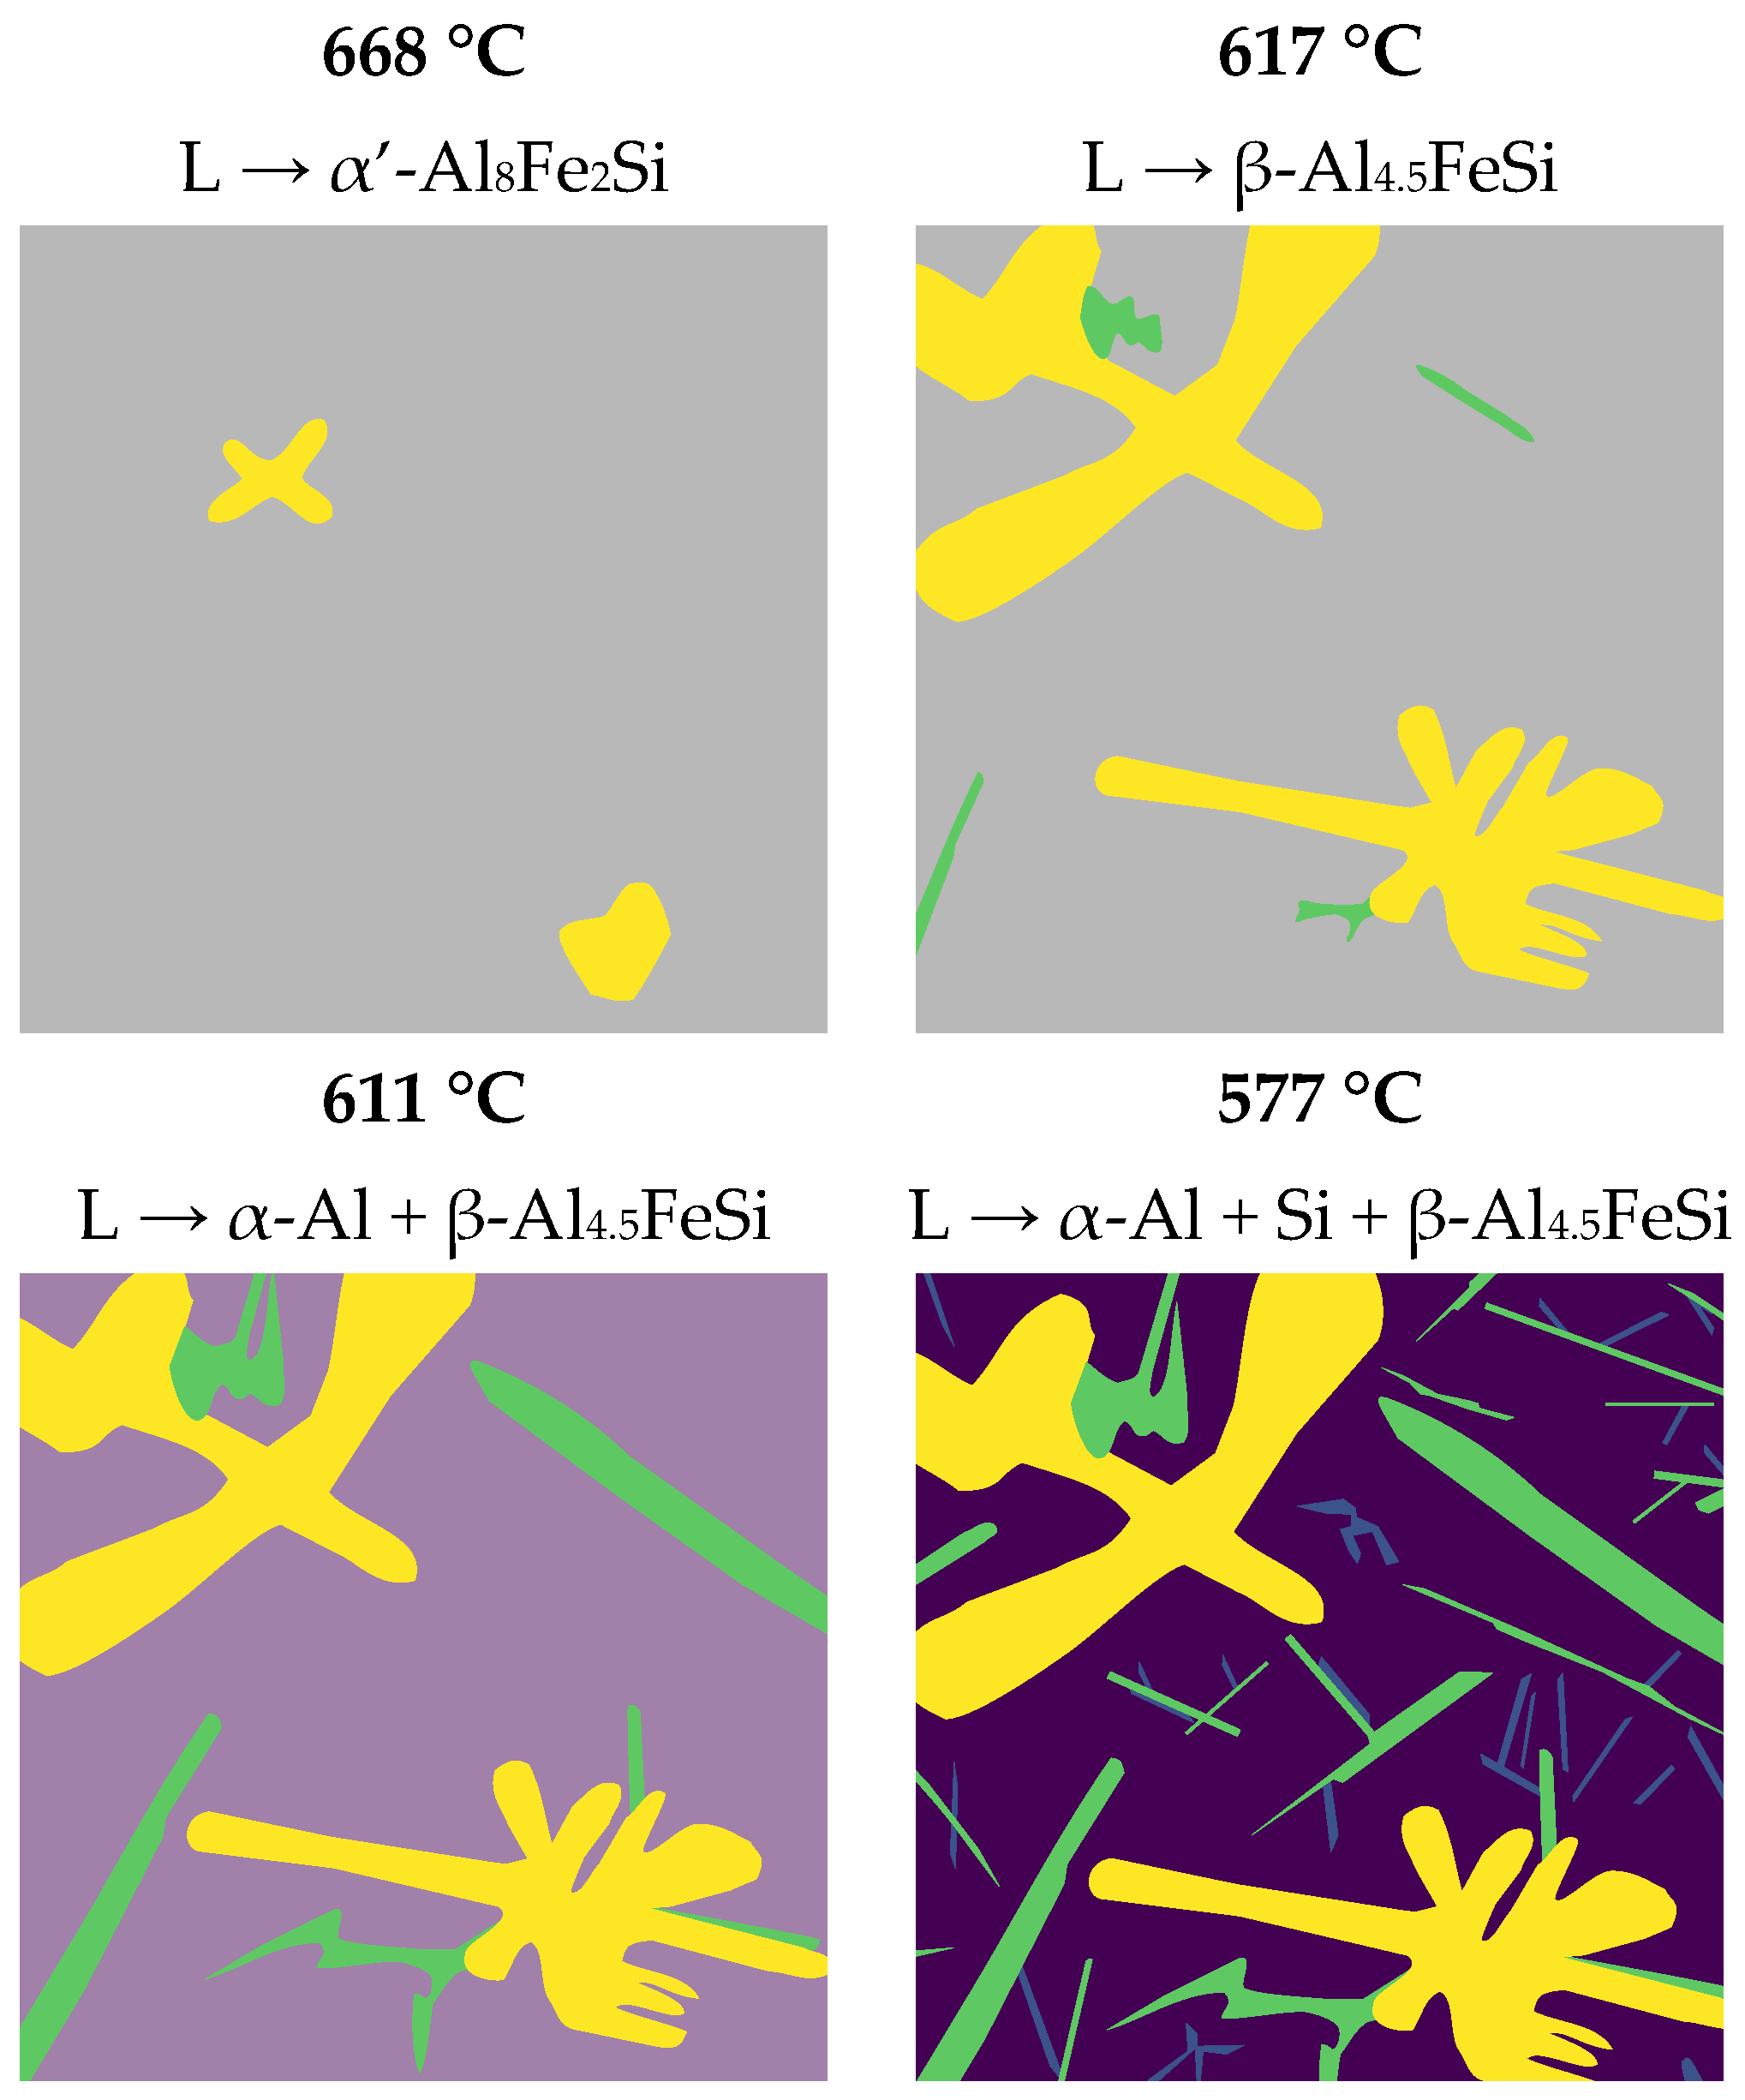
- At 668 °C, the α′-Al8Fe2Si phase begins to precipitate and grow.
- By reaching to 617 °C, the β-Al4.5FeSi begins to precipitate instead of α′-Al8Fe2Si. This phase precedes the ternary eutectic reaction, usually termed β-Al4.5FeSi pre-eutectic [33].
- At 611 °C, the liquid transforms into the matrix phase, α-Al, with the β-Al4.5FeSi pre-eutectic transforming into thick needles.
- Finally, at 577 °C, the final reaction occurs, with the last α-Al solidifying while the Si-eutectic and very thin β-Al4.5FeSi needles precipitate, denoted as the β-Al4.5FeSi eutectic. This previous reaction corresponds to a ternary eutectic reaction at 577 °C, L → α-Al + Si + β-Al4.5FeSi, occurring at similar temperatures as observed in other investigations [34].
5. Conclusions
5.1. Microstructure Variation with Fe Concentration
- Petal-shaped α′-Al8Fe2Si with an average length of 170 µm.
- Thick pre-eutectic β-Al4.5FeSi plaques with an average length of 890 µm.
- Thin eutectic β-Al4.5FeSi needles with an average length of 20 µm.
5.2. Porosity, Hardness, and Corrosion Variation with Fe Concentration
Author Contributions
Funding
Data Availability Statement
Acknowledgments
Conflicts of Interest
Abbreviations
| SAAs | Secondary Aluminium Alloys |
| UTS | Ultimate Tensile Strength |
| YS | Yield Strength |
| A% | Elongation at break |
| RPT | Reduce Pressure Test |
| CR | Corrosion Rate |
| OM | Optical Microscopy |
| SEM | Scanning Electron Microscopy |
| BSE | Backscattered Electrons |
| EDS | Energy-Dispersive Spectroscopy |
| EBSD | Electron Backscatter Diffraction |
| XRD | X-ray Diffraction |
| SDAS | Secondary Dendrite Arm Spacing |
References
- Wang, J.; Gao, J.; Yang, H.; Yang, F.; Wen, T.; Liu, Z.; Zhang, L.; Ji, S. High-strength Al–5Mg2Si–2Mg–2Fe alloy with extremely high Fe content for green industrial application through additive manufacturing. Virtual Phys. Prototyp. 2023, 18, e2235587. [Google Scholar] [CrossRef]
- Que, Z.; Wang, Y.; Mendis, C.L.; Fang, C.; Xia, J.; Zhou, X.; Fan, Z. Understanding Fe-Containing Intermetallic Compounds in Al Alloys: An Overview of Recent Advances from the LiME Research Hub. Metals 2022, 12, 1677. [Google Scholar] [CrossRef]
- Durmuş, M.; Dispinar, D.; Gavgali, M.; Uslu, E.; Çolak, M. Evaluation of Fe Content on the Fluidity of A356 Aluminum Alloy by New Fluidity Index. Int. J. Met. 2024. [Google Scholar] [CrossRef]
- Trink, B.; Weißensteiner, I.; Uggowitzer, P.J.; Strobel, K.; Pogatscher, S. High Fe content in Al-Mg-Si wrought alloys facilitates excellent mechanical properties. Scr. Mater. 2022, 215, 114701. [Google Scholar] [CrossRef]
- Shankar, S.; Gois, N.; Molstad, E.; Söderhjelm, C.; Apelian, D. Upcycling of Low Quality Aluminum Automotive Scrap: The DNA of Twitch. Int. J. Met. 2024. [Google Scholar] [CrossRef]
- Lazaro-Nebreda, J.; Patel, J.B.; Chang, I.T.H.; Stone, I.C.; Fan, Z. Solidification processing of scrap Al-alloys containing high levels of Fe. IOP Conf. Ser. Mater. Sci. Eng. 2019, 529, 012059. [Google Scholar] [CrossRef]
- Shankar, S.; Söderhjelm, C.; Apelian, D. Classification of Automotive Aluminum Scrap into Cast and Wrought Alloys via Particle Size Analysis. J. Sustain. Metall. 2024, 11, 472–484. [Google Scholar] [CrossRef]
- Taylor, J.A.; Schaffer, G.B.; StJohn, D.H. The role of iron in the formation of porosity in Al-Si-Cu-based casting alloys: Part III. A microstructural model. Metall. Mater. Trans. A 1999, 30, 1657–1662. [Google Scholar] [CrossRef]
- Mahta, M.; Emamy, M.; Daman, A.; Keyvani, A.; Campbell, J. Precipitation of Fe rich intermetallics in Cr- and Co-modified A413 alloy. Int. J. Cast Met. Res. 2005, 18, 73–79. [Google Scholar] [CrossRef]
- Taghiabadi, R.; Ghasemi, H.M.; Shabestari, S.G. Effect of iron-rich intermetallics on the sliding wear behavior of Al–Si alloys. Mater. Sci. Eng. A 2008, 490, 162–170. [Google Scholar] [CrossRef]
- Timpel, M.; Wanderka, N.; Grothausmann, R.; Banhart, J. Distribution of Fe-rich phases in eutectic grains of Sr-modified Al–10 wt.% Si–0.1 wt.% Fe casting alloy. J. Alloys Compd. 2013, 558, 18–25. [Google Scholar] [CrossRef]
- Tunçay, T.; Bayoğlu, S. The Effect of Iron Content on Microstructure and Mechanical Properties of A356 Cast Alloy. Metall. Mater. Trans. B 2017, 48, 794–804. [Google Scholar] [CrossRef]
- Kuchariková, L.; Medvecká, D.; Tillová, E.; Belan, J.; Kritikos, M.; Chalupová, M.; Uhríčik, M. The Effect of the β-Al5FeSi Phases on Microstructure, Mechanical and Fatigue Properties in A356.0 Cast Alloys with Higher Fe Content without Additional Alloying of Mn. Materials 2021, 14, 1943. [Google Scholar] [CrossRef]
- Gan, J.; Du, J.; Wen, C.; Zhang, G.; Shi, M.; Yuan, Z. The Effect of Fe Content on the Solidification Pathway, Microstructure and Thermal Conductivity of Hypoeutectic Al–Si Alloys. Int. J. Met. 2022, 16, 178–190. [Google Scholar] [CrossRef]
- Lu, X.; Zhang, Z.; Hiraki, T.; Takeda, O.; Zhu, H.; Matsubae, K.; Nagasaka, T. A solid-state electrolysis process for upcycling aluminium scrap. Nature 2022, 606, 511–515. [Google Scholar] [CrossRef]
- Kakitani, R.; Rodrigues, A.V.; Silva, C.; Garcia, A.; Cheung, N. The roles of solidification cooling rate and (Mn,Cr) alloying elements in the modification of β-AlFeSi and hardness evolvements in near-eutectic Al-Si alloys. J. Alloys Metall. Syst. 2023, 1, 100005. [Google Scholar] [CrossRef]
- Kishor, M.; Ram, K.Y.P.; Nahid, S.A.G.; Ramavajjala, A.K.; Prasada Rao, A.K. Synergistic Effect of Mo and V Addition on Al–Si Alloys Containing High Iron Impurity. Int. J. Met. 2024, 18, 3538–3548. [Google Scholar] [CrossRef]
- Li, Q.; Wang, J.; Xue, C.; Miao, Y.; Hou, Q.; Yang, X.; Meng, Y.; Yang, Z.; Tian, G.; Su, H.; et al. Effects of Sr on Fe-rich intermetallics in recycled Al–Si–Cu alloys. J. Mater. Sci. 2024, 59, 11572–11595. [Google Scholar] [CrossRef]
- Van den Eynde, S.; Bracquené, E.; Diaz-Romero, D.; Zaplana, I.; Engelen, B.; Duflou, J.R.; Peeters, J.R. Forecasting global aluminium flows to demonstrate the need for improved sorting and recycling methods. Waste Manag. 2022, 137, 231–240. [Google Scholar] [CrossRef]
- Modaresi, R.; Müller, D.B. The Role of Automobiles for the Future of Aluminum Recycling. Environ. Sci. Technol. 2012, 46, 8587–8594. [Google Scholar] [CrossRef]
- Løvik, A.N.; Modaresi, R.; Müller, D.B. Long-term strategies for increased recycling of automotive aluminum and its alloying elements. Environ. Sci. Technol. 2014, 48, 4257–4265. [Google Scholar] [CrossRef] [PubMed]
- Taylor, J.A. Iron-Containing Intermetallic Phases in Al-Si Based Casting Alloys. Procedia Mater. Sci. 2012, 1, 19–33. [Google Scholar] [CrossRef]
- NP EN 1706 2000; Alumínio e Ligas de Alumínio: Produtos Vazados: Composição Química e Características Mecânicas. Instituto Português da Qualidade: Caparica, Portugal, 2000.
- Karabulut, C.; Malkoç, G.; Kaya, A.Y.; Özaydin, O.; Yayla, P. Influence of Different Fe Levels on Mechanical Properties of AlSi7Mg0.3 Aluminum Casting Alloys. Int. J. Met. 2023, 18, 3081–3094. [Google Scholar] [CrossRef]
- Zhao, J.; Guo, Y.; Xu, B.; Gu, C.; Wang, Y.; Tang, Q. Effect of Microstructure Evolution of Iron-Rich Intermetallic Compounds on Mechanical Property of Al–7Si–0.3Mg Casting Alloy with Low Iron Content. Metall. Mater. Trans. B 2022, 53, 548–560. [Google Scholar] [CrossRef]
- Bale, C.W.; Bélisle, E.; Chartrand, P.; Decterov, S.A.; Eriksson, G.; Gheribi, A.E.; Hack, K.; Jung, I.H.; Kang, Y.B.; Melançon, J.; et al. FactSage thermochemical software and databases, 2010–2016. Calphad 2016, 54, 35–53. [Google Scholar] [CrossRef]
- Schindelin, J.; Arganda-Carreras, I.; Frise, E.; Kaynig, V.; Longair, M.; Pietzsch, T.; Preibisch, S.; Rueden, C.; Saalfeld, S.; Schmid, B.; et al. Fiji: An open-source platform for biological-image analysis. Nat. Methods 2012, 9, 676–682. [Google Scholar] [CrossRef]
- Ferreira, T.; Hiner, M.; Rueden, C.; Miura, K.; Eglinger, J.; Che, B. tferr/Scripts: BAR 1.5.1, Version 1.51; Zenodo: Geneva, Switzerland, 2017. [Google Scholar] [CrossRef]
- NP EN ISO 6506-1:2015; Materiais metálicos Ensaios de dureza Brinell Parte 1: Método de ensaio. Instituto Português da Qualidade: Caparica, Portugal, 2015.
- ISO 6507-1:2023; Metallic materials—Vickers hardness test—Part 1: Test method. International Organization for Standardization: Geneva, Switzerland, 2023.
- ASTM G1-03(2017)e1; Standard Practice for Preparing, Cleaning, and Evaluating Corrosion Test Specimens. ASTM International: West Conshohocken, PA, USA, 2017.
- Alexander, D.T.L.; Greer, A.L. Formation of eutectic intermetallic rosettes by entrapment of liquid droplets during cellular columnar growth. Acta Mater. 2004, 52, 5853–5861. [Google Scholar] [CrossRef]
- Jin, L.; Liu, K.; Chen, X.G. Evolution of Fe-Rich Intermetallics in Al-Si-Cu 319 Cast Alloy with Various Fe, Mo, and Mn Contents. Metall. Mater. Trans. B 2019, 50, 1896–1907. [Google Scholar] [CrossRef]
- Mikolajczak, P. Distribution and Morphology of α-Al, Si and Fe-Rich Phases in Al–Si–Fe Alloys under an Electromagnetic Field. Materials 2023, 16, 3304. [Google Scholar] [CrossRef]
- Berlanga-Labari, C.; Biezma-Moraleda, M.V.; Rivero, P.J. Corrosion of Cast Aluminum Alloys: A Review. Metals 2020, 10, 1384. [Google Scholar] [CrossRef]
- Osório, W.R.; Moutinho, D.J.; Peixoto, L.C.; Ferreira, I.L.; Garcia, A. Macrosegregation and microstructure dendritic array affecting the electrochemical behaviour of ternary Al–Cu–Si alloys. Electrochim. Acta 2011, 56, 8412–8421. [Google Scholar] [CrossRef]
- Ferdian, D.; Thebault, Y.; Freulon, A.; Lacaze, J. Characterisation of rosette formation in an aluminium–silicon alloy. Int. J. Cast Met. Res. 2015, 28, 290–294. [Google Scholar] [CrossRef]


| Sample | Alloy | Si | Mg | Fe | Mn | Cr | Ti | Ni | Zn | Al |
|---|---|---|---|---|---|---|---|---|---|---|
| Master | 6.41 | 0.27 | 6.41 | 0.06 | 0.06 | 0.09 | 0.04 | 0.03 | Bal. | |
| 1 | AlSi7Mg0.3-0.1Fe | 7.44 | 0.34 | 0.14 | - | - | 0.11 | 0.01 | - | Bal. |
| 2 | AlSi7Mg0.3-0.4Fe | 7.49 | 0.33 | 0.36 | - | 0.01 | 0.11 | 0.01 | - | Bal. |
| 3 | AlSi7Mg0.3-1.3Fe | 7.32 | 0.31 | 1.30 | 0.01 | 0.01 | 0.11 | 0.02 | - | Bal. |
| 4 | AlSi7Mg0.3-2.1Fe | 7.00 | 0.29 | 2.07 | 0.02 | 0.02 | 0.12 | 0.02 | 0.01 | Bal. |
| 5 | AlSi7Mg0.3-3.8Fe | 6.74 | 0.26 | 3.80 | 0.04 | 0.04 | 0.12 | 0.03 | 0.03 | Bal. |
| Point | Si | Fe | Mg | Al |
|---|---|---|---|---|
| P1 | 1.37 | - | - | 98.63 |
| P2 | 70.43 | - | - | 29.57 |
| P3 | 19.52 | 15.85 | - | 64.62 |
| P4 | 28.70 | 6.29 | 15.95 | 49.06 |
| Zones | Al | Si | Fe | Mg | O | Ni | Cr |
|---|---|---|---|---|---|---|---|
| Z1 | 59.19 | 28.93 | 8.32 | 3.55 | - | - | - |
| Z2 | 59.48 | 33.36 | 1.6 | 5.56 | - | - | - |
| Z3 | 65.59 | 15.96 | 13.1 | - | - | 3.13 | 2.22 |
| Z4 | 53.3 | 33.03 | 0.7 | 7.14 | 3.61 | 2.22 | 53.3 |
| Z5 | 48.78 | 29.07 | 14.09 | 1.84 | - | 4.88 | 1.34 |
| Z6 | 57.59 | 31.87 | 4.81 | 3.55 | - | 2.18 | 57.59 |
| Z7 | 53.3 | 33.03 | 0.7 | 7.14 | 3.61 | 2.22 | 53.3 |
| Phase | Lattice | Space Group | Lattice Parameters | ||||
|---|---|---|---|---|---|---|---|
| a (Å) | b (Å) | c (Å) | Angles | ||||
| Al | 00-004-0787 | Cubic | Fm-3m (225) | 4.04940 | 4.04940 | 4.04940 | α = β = γ = 90° |
| Si | 00-027-1402 | Cubic | Fd-3m (227) | 5.43088 | 5.43088 | 5.43088 | α = β = γ = 90° |
| π-Al9FeMg3Si5 | 01-082-7018 | Hexagonal | P-62m (189) | 6.64000 | 6.64000 | 7.92000 | α = β = 90°, γ = 120° |
| β-Al4.5FeSi | 01-082-0546 | Monoclinic | A2/a (15) | 6.16100 | 6.17500 | 20.81300 | α = γ = 90°, β = 90.42° |
| α′-Al8Fe2Si | 00-020-0030 | Hexagonal | P63/mmc | 12.4000 | 12.4000 | 26.100 | α = β = 90°, γ = 120° |
Disclaimer/Publisher’s Note: The statements, opinions and data contained in all publications are solely those of the individual author(s) and contributor(s) and not of MDPI and/or the editor(s). MDPI and/or the editor(s) disclaim responsibility for any injury to people or property resulting from any ideas, methods, instructions or products referred to in the content. |
© 2025 by the authors. Licensee MDPI, Basel, Switzerland. This article is an open access article distributed under the terms and conditions of the Creative Commons Attribution (CC BY) license (https://creativecommons.org/licenses/by/4.0/).
Share and Cite
Nunes, H.; Madureira, R.; Vieira, M.F.; Reis, A.; Emadinia, O. Excessive Fe Contamination in Secondary Al Alloys: Microstructure, Porosity, and Corrosion Behaviour. Metals 2025, 15, 451. https://doi.org/10.3390/met15040451
Nunes H, Madureira R, Vieira MF, Reis A, Emadinia O. Excessive Fe Contamination in Secondary Al Alloys: Microstructure, Porosity, and Corrosion Behaviour. Metals. 2025; 15(4):451. https://doi.org/10.3390/met15040451
Chicago/Turabian StyleNunes, Helder, Rui Madureira, Manuel F. Vieira, Ana Reis, and Omid Emadinia. 2025. "Excessive Fe Contamination in Secondary Al Alloys: Microstructure, Porosity, and Corrosion Behaviour" Metals 15, no. 4: 451. https://doi.org/10.3390/met15040451
APA StyleNunes, H., Madureira, R., Vieira, M. F., Reis, A., & Emadinia, O. (2025). Excessive Fe Contamination in Secondary Al Alloys: Microstructure, Porosity, and Corrosion Behaviour. Metals, 15(4), 451. https://doi.org/10.3390/met15040451