Article

Prediction and Prevention of Edge Waves in Continuous Cold Forming of Thick-Wall High-Strength Welded Pipe

1
Faculty of Materials, Wuhan University of Science and Technology, Wuhan 430081, China
2
State Key Laboratory of Materials Processing and Die & Mould Technology, Huazhong University of Science and Technology, Wuhan 430074, China
*
Author to whom correspondence should be addressed.
Metals 2025, 15(4), 455; https://doi.org/10.3390/met15040455
Submission received: 4 March 2025 / Revised: 28 March 2025 / Accepted: 8 April 2025 / Published: 18 April 2025

Abstract

:
In order to reduce the edge waves and defects of the strip in the forming process and obtain better properties of the strip, it is urgent to establish a better flexible cold forming process. In this paper, a finite element model of the production line was established to simulate the forming process, and the effective stress distribution at the corner of the strip was simulated. The effect of cold working hardening was basically consistent with that calculated by the analytical method and tensile test results. A mathematical model of the maximum normal strain along the tangent direction of the strip’s outer edge of each pass was established. With the constraint conditions that the maximum value of the normal strain value of each pass is less than the critical value and the upper and lower limit of the horizontal value of each test factor, and the maximum value of the normal strain of each pass as the goal, the number of cold forming passes, the bending angle of each pass and the working roll diameter of the roll have been determined. The optimized process parameters were used in the simulations. No edge wave at the strip edge and no “Bauschinger effect” in forming before high-frequency induction welding was found. The method proposed in this paper can optimize the key process parameters before the production line is put into operation, minimize the possible buckling of the strip edge during the forming process, and reduce the possible loss caused by design defects.

1. Introduction

A flexible cold forming process can use a set of rolls to produce steel products with different section specifications or even variable sections, which greatly improves the production efficiency and automation degree, and thus attracts the attention of developers and researchers of new cold forming technology [1,2,3,4,5]. Around 70% of the quality problems of cold-formed welded pipe products come from welding production. The factors affecting the induction welding quality of thick-wall tubes are complex. In addition to welding techniques, the wave shape and groove of the edge to be welded have a great influence on the quality of welded joints [6,7,8]. The edge wave, which results from edge buckling at the strip edge, is a frequent defect in the cold-rolled forming production. The generation of edge wave is related to the forming history and forming method.
During the strip deformation in each pass, the edge portion moves along spatial paths that are longer than those for the center portions, resulting in elongation more than other portions. After exiting the stand, the edge is compressed in the longitudinal direction because the deformed strip is a whole and its cross section attempts to remain the same length [9]. The circumferential compression also produces extension in the longitudinal and thickness directions, while maintaining a constant volume. Therefore, during cold forming, the edge of the strip is stretched more than the other parts. As the deformation process progresses, the edge deformation will gradually change from tension to compression. The stability of the edge is poor, making it easy to form defects. Controlling the maximum stretch of the edge during forming is an effective measure to avoid the defects of cold-formed welded pipe products [9,10,11].
Safdarian R et al. [12] investigated the effect of various roll forming parameters on the edge longitudinal strain and bow defect of channel section products. Their findings indicate that the bending angle increment is a major factor influencing the longitudinal bow defect, with the bow increasing as the bending angle increases. Additionally, the study reveals that the edge longitudinal strain increases with both the bending angle and strip thickness, while it decreases with a larger flange width, web width, and greater distance between roll stands. The study also shows that friction in the roll–strip contact and roll speed have no significant impact on the edge longitudinal strain. Dian jie Li et al. [13] investigated the straight-edge lineal roll forming (SLF) technology, focusing on the deformation behavior of steel strips during high-frequency welding pipe production. The study analyses the variation of equivalent plastic strain in each section and the distribution of rolling force across the stands. Results show that significant plastic deformation occurs at both the center and edges of the strip, with the SLF section playing a crucial role in smoothly transitioning between the pre-forming and fin-pass forming sections. M. Salmani Tehrani et al. [14] investigated the issue of local edge buckling in the cold roll forming of circular tube sections using finite element simulation. It highlights the importance of edge buckling as a potential limiting factor and examines how increasing the profile angle in the first station affects the straightness of the strip edge between the first and second stations. The simulation results indicate that if the profile angle in the first station exceeds a certain threshold, reverse bending from the second station’s rolls may cause local edge buckling. Luo Zhongyi et al. [15] presented a novel finite element model for circle-to-rectangle roll forming of thick-walled rectangular tubes. The model, based on the elastic–plastic finite element method, is used to predict von Mises stress and equivalent plastic strain, particularly at the rounded corners of tubes with small rounded corners (outer corner radius-to-thickness ratio less than 1.5). The simulation results were validated by experimental data, and the model successfully predicted potential crack locations during the forming process.
In this paper, a flexible continuous cold forming process designed by the first author and engineers in the design institute was optimized, which can be used for continuous cold forming of high-strength rectangular steel pipe and can realize the sharing of rolls. Taking the minimum normal strain in the forming direction of the strip edge as the optimization objective, the bending angle and work roll diameter of each pass of strip cold forming were determined. The specific scheme was as follows: first, the number of pass n of cold forming was set, the bending angle of each pass and the work roll diameter of each pass were selected as the test factors, and the horizontal values of each test factor were preselected, and a virtual test scheme was designed for each test factor and the corresponding level values. Then the strip–strain distribution of each virtual test scheme was calculated, and the mathematical model of the maximum normal strain along the tangential direction of the outer edge of each pass strip was established. Then, with the maximum value of normal strain of each pass less than or equal to 0.9% and the upper and lower limits of the horizontal values of each test factor as the constraint conditions, and the minimum value of the maximum value of normal strain of each pass as the pursuit goal, the number of cold forming passes, the bending angle of each cold bending strip and the working roll diameter of the roll were optimized and determined [9]. The optimization process is shown in Figure 1. The optimization results can give full play to the equipment capacity of the cold forming unit, avoiding strip warping and overcoming strip edge wave shape defects.

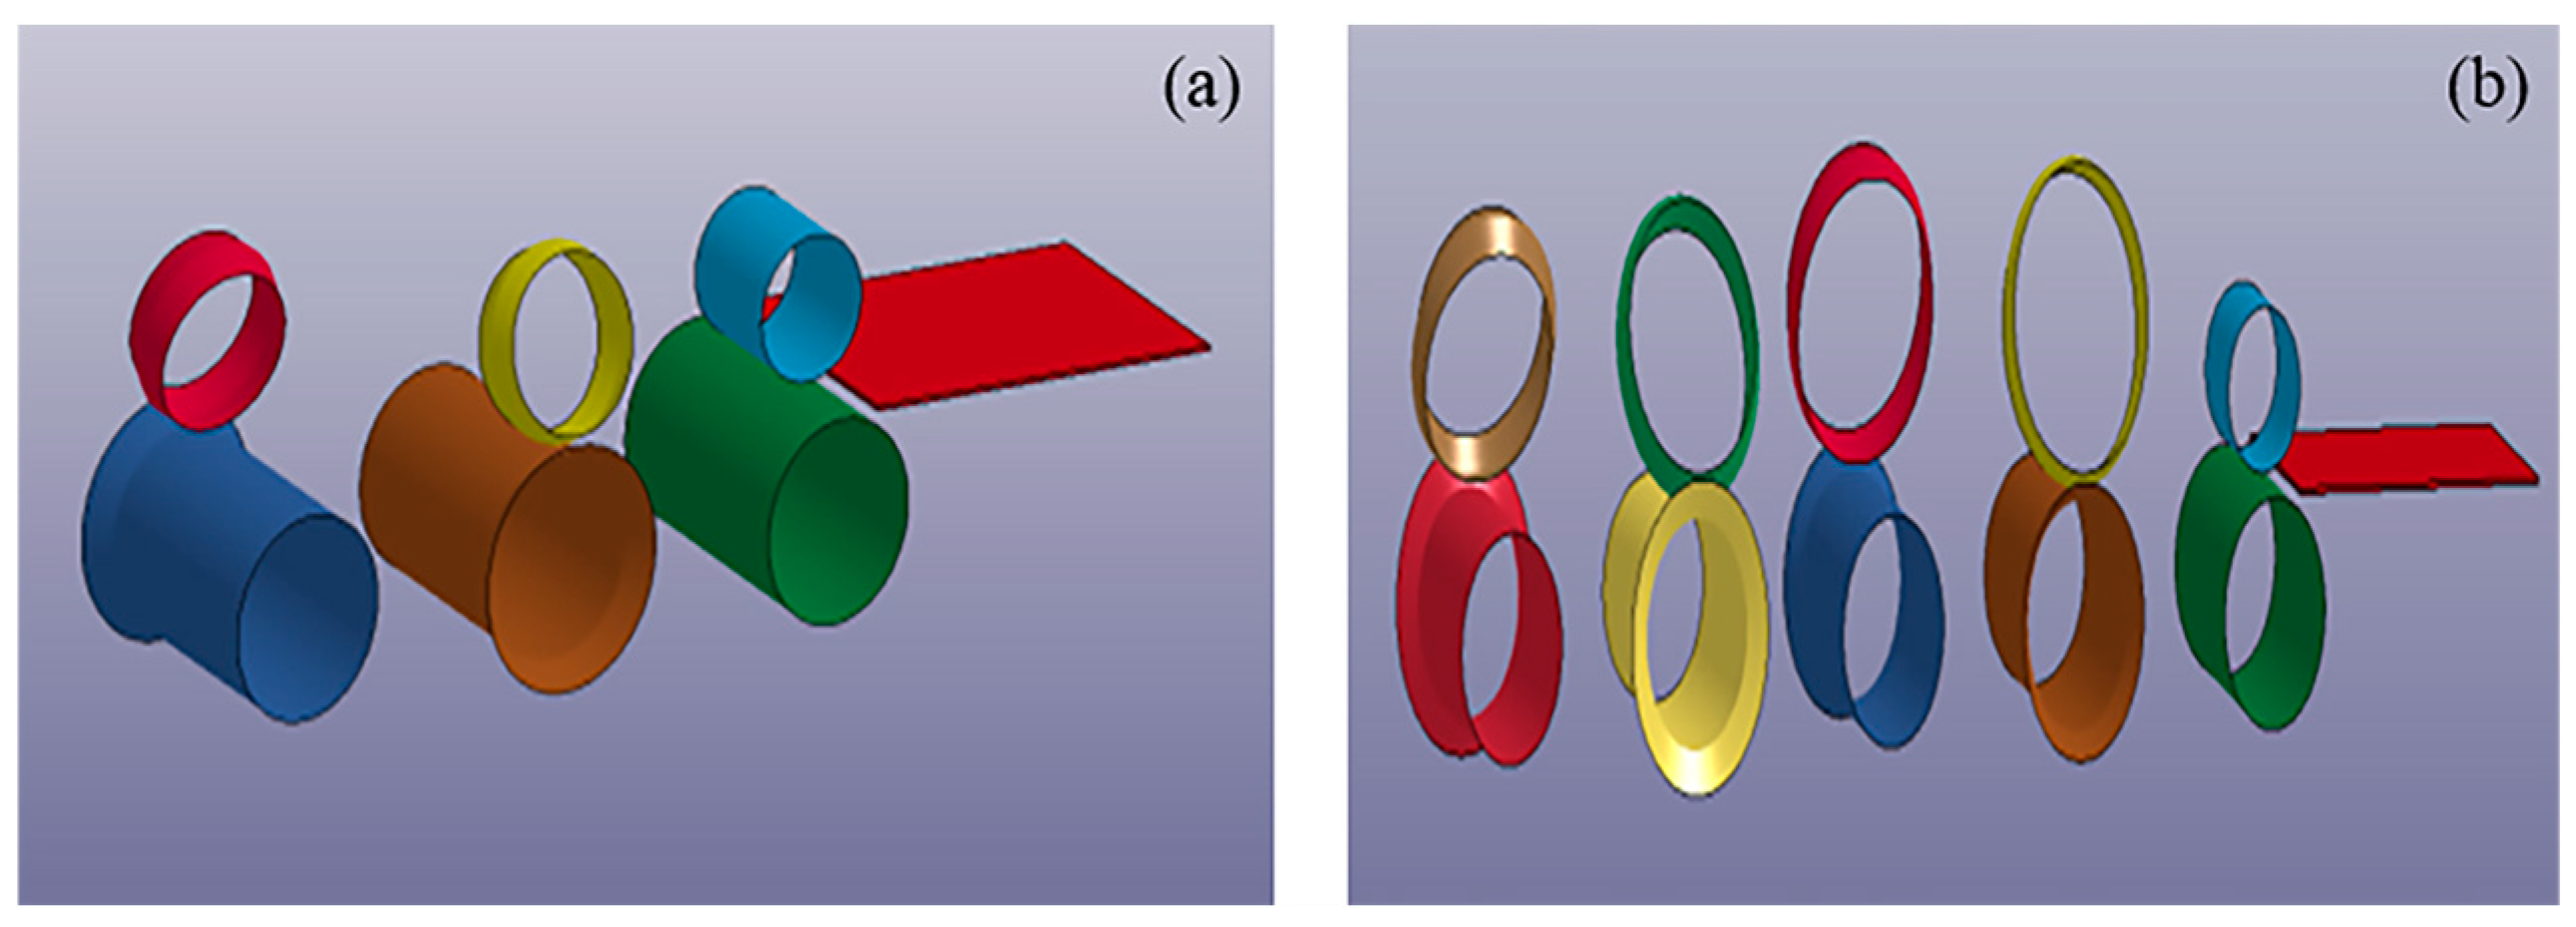
2. Technology Design

The example product for the process design is a high-strength thick-wall rectangular tube with a cross-section of 170 × 170 × 10 mm and an inner fillet radius of 9.5 mm in WYS700 high-strength steel, as shown in Figure 2. In order to facilitate the description of the cross-section of the strip during design, simulation and optimization, the strip cross-sectional shape features are defined, from bottom to top, as the first bending side, the first bending angle, the second bending side, the second bending angle and the third bending side, as shown in Figure 3.
The width of the raw material was selected according to the width of the neutral layer in the tube strip forming. The width of the neutral layer of the sheet is calculated according to Equations (1) and (2).
B = L i + R i
R i = 2 π ( r + k t ) θ i 360
In the formula, L i —the length of the straight part of the product on the neutral layer; R i —the arc length of the curved part of the product on the neutral layer; r—the radius of the internal fillet of the product; t—the thickness of the product sheet; k—the neutral layer factor, also called the bending angle factor, which is mainly used to determine the position of the central layer present; θ i — the angle of the product bend. The neutral layer factor k is calculated using the German DIN 6935 standard [16], as shown in Equation (3).
k = 0.5 0.65 + 0.5 log r / t r / t 5 0.5 r / t > 5
According to the change in the shape of the strip section, forming in the first solid-bending, followed by air-bending, as shown in Figure 4. The two sides of the strip are alternately bent, while the air-bending is carried out simultaneously. The original distribution of the bending angle is shown in Table 1, and forming flower patterns as shown in Figure 5.
In the actual forming, in addition to the above-mentioned bending of the corners, there are also the initial strip delivery passes and several centering passes to avoid deviations in the forming of the sheet.

3. The FEM Modeling and Simulation

3.1. Finite Element Modeling

Ansys APDL command flow is used for model building, meshing and boundary condition setting, and a human–machine interface is created to allow for the input and modification of process parameters such as material properties, sheet thickness and width, bending inner and outer diameter, neutral layer radius, stand spacing, roll diameter and bending angle, greatly increasing the general usability of the program.
When building the finite element model, in order to save simulation time, but also to accurately simulate the main deformation characteristics of the material forming process, the length of the slab was selected between the stand spacing and twice the stand spacing, and the mill is simplified into a roll shell. The rolls and slabs were divided into cells using shell163 and solid164 cells, respectively. The mill–roll contact was set up as a face-to-face automatic contact method, using an elastic penalty factor to prevent the slab from penetrating the roll and to reduce mesh distortion during simulation. A Coulomb friction model was used for the contact surfaces. The coefficient of static friction, the coefficient of dynamic friction, and the decay index are set at 0.2, 0.1, and 0.05, respectively, and the forming upper roll and the alignment roll are driven by friction without any load being applied to their passive rotation [17,18,19,20,21]. All rolls were set up in independent coordinate systems and have rotational degrees of freedom only in their respective directions of rotation. The finite element model developed is shown in Figure 6. It is important to mention that even with the many simplifications used to save computational time, the simulation is still computationally intensive for a PC, so mass scaling is used to save computational time. This simulation uses mass scaling to achieve a 50% saving in computation time with only a 0.5% increase in mass, without affecting the engineering use [22,23,24,25,26].

3.2. Validity of the Simulation

Figure 7 shows the strip effective stress cloud in the first stage of forming, where the unit is kPa. The roll diameter is too large, the strip in the front to observe the cold bending situation and stress will be blocked from view, so in the stress cloud hidden roll, observe the back of the strip. The radial area of the equivalent stress cloud, soon after the strip has been bitten into, is larger than the radial area when it has entered stable cold bending.
Figure 8 shows the effective stress of the pipe strip of three air-bending forming sections in the third stage. It can be seen from Figure 7 and Figure 8 that the effective stress at the bending angle of the strip continues to grow with the increase in the bending angle, and the final stress peak reaches 1016 MPa.
To verify the validity of the model developed, a cold work-hardening mathematical model was used to calculate the bending corner yield stress of this simulated product [15], as shown in Equation (4).
σ y c = k 1.0 1.3 n a t 0.855 n + 0.035
In the formula, n —work-hardening index; k —strength coefficient of the strip; a —inner diameter of the bending angle after forming of the strip (mm); t —the thickness of the bending angle of the strip after forming (mm); σ y c —the average yield stress of the bending angle (MPa).
n and k can be obtained by fitting a true stress–strain curve. The stress–strain values for WYS700 high-strength steel are taken logarithmically and fitted using least squares to obtain the true stress–strain linear relationship in Equation (5), giving a work-hardening index n of 0.0554 and a strength factor k of 1068.9. The average thickness and internal diameter of the bend angle of the strip were read using ls-prepost, and all parameters are substituted into Equation (4) to obtain an average strength of 989.1 MPa at the bend angle. The maximum value of Mises stress at the bend angle obtained by finite element simulation was 1016 MPa, with a relative error of 2.7%.
l n σ = n l n ε + l n k
In the formula, σ —the true stress at the stage of uniform plastic deformation of the strip (MPa), ε —the true strain at the stage of uniform plastic deformation of the strip.
In order to further verify the reliability of the simulation model, bending experiments were carried out on the base material steel plate used for forming. The mechanical properties and dimensions of the numerical simulation of the cold formed slab raw materials were taken from the experimental base material, and the mechanical behavior of the base material is shown in Figure 9; the elemental composition of the substrate is shown in Table 2. The bending experiments with bending angles of about 84° and 86° were carried out. Three parallel samples were taken along the steel plate longitudinally for the bending angle, as shown in Figure 10. The sample shown in Figure 10 was subjected to a tensile test, and the measured results are shown in Table 3. The results indicate that the average yield strength measured by tensile tests for the specimen with a bending angle of 86° is 985.4 MPa, which is slightly lower than the simulation result, and the relative error between the simulation result and the experimental value is about 3.1%.
Compared to the properties of the base material, the strength of the bend corner after cold work hardening is increased by approximately 21.4%, which is much lower than the effect of cold work hardening of the carbon structural steel. With almost equal wall thicknesses, the mean values of the ratios of the yield stress of the corner coupons to that of the virgin material are 1.47 for the structural steel Q345 [8], but the mean values of the ratios of the yield stress of the corner coupons to that of the virgin material are about 1.2 for the high-strength steel WYS700.

3.3. Process Optimization

3.3.1. The Goal of Optimization

As already mentioned, the wave shape of the two sides of the pipe strip to be welded has an important impact on the quality of the welded joint of the cold-bent welded pipe. Observe a part of the pipe strip after forming, as shown in Figure 11; the edge is not straight longitudinally and locally wavy.
Figure 12 shows the calculated results for the right edge of the longitudinal strain at the strip edge. It shows that the longitudinal strain at the strip edge increases severely once the deformed strip enters the forming stand and decreases suddenly when the strip exits the forming stand. The longitudinal strain has some fluctuations along the forming direction of the strip when the strip exits the forming stand. The maximum strain of about 1.35% is observed at the edge of the strip. There exists a number of calculated points whose strain values are more than 0.9%; these parts may produce a wave shape, and must be designed to optimize the process parameters according to Figure 1.

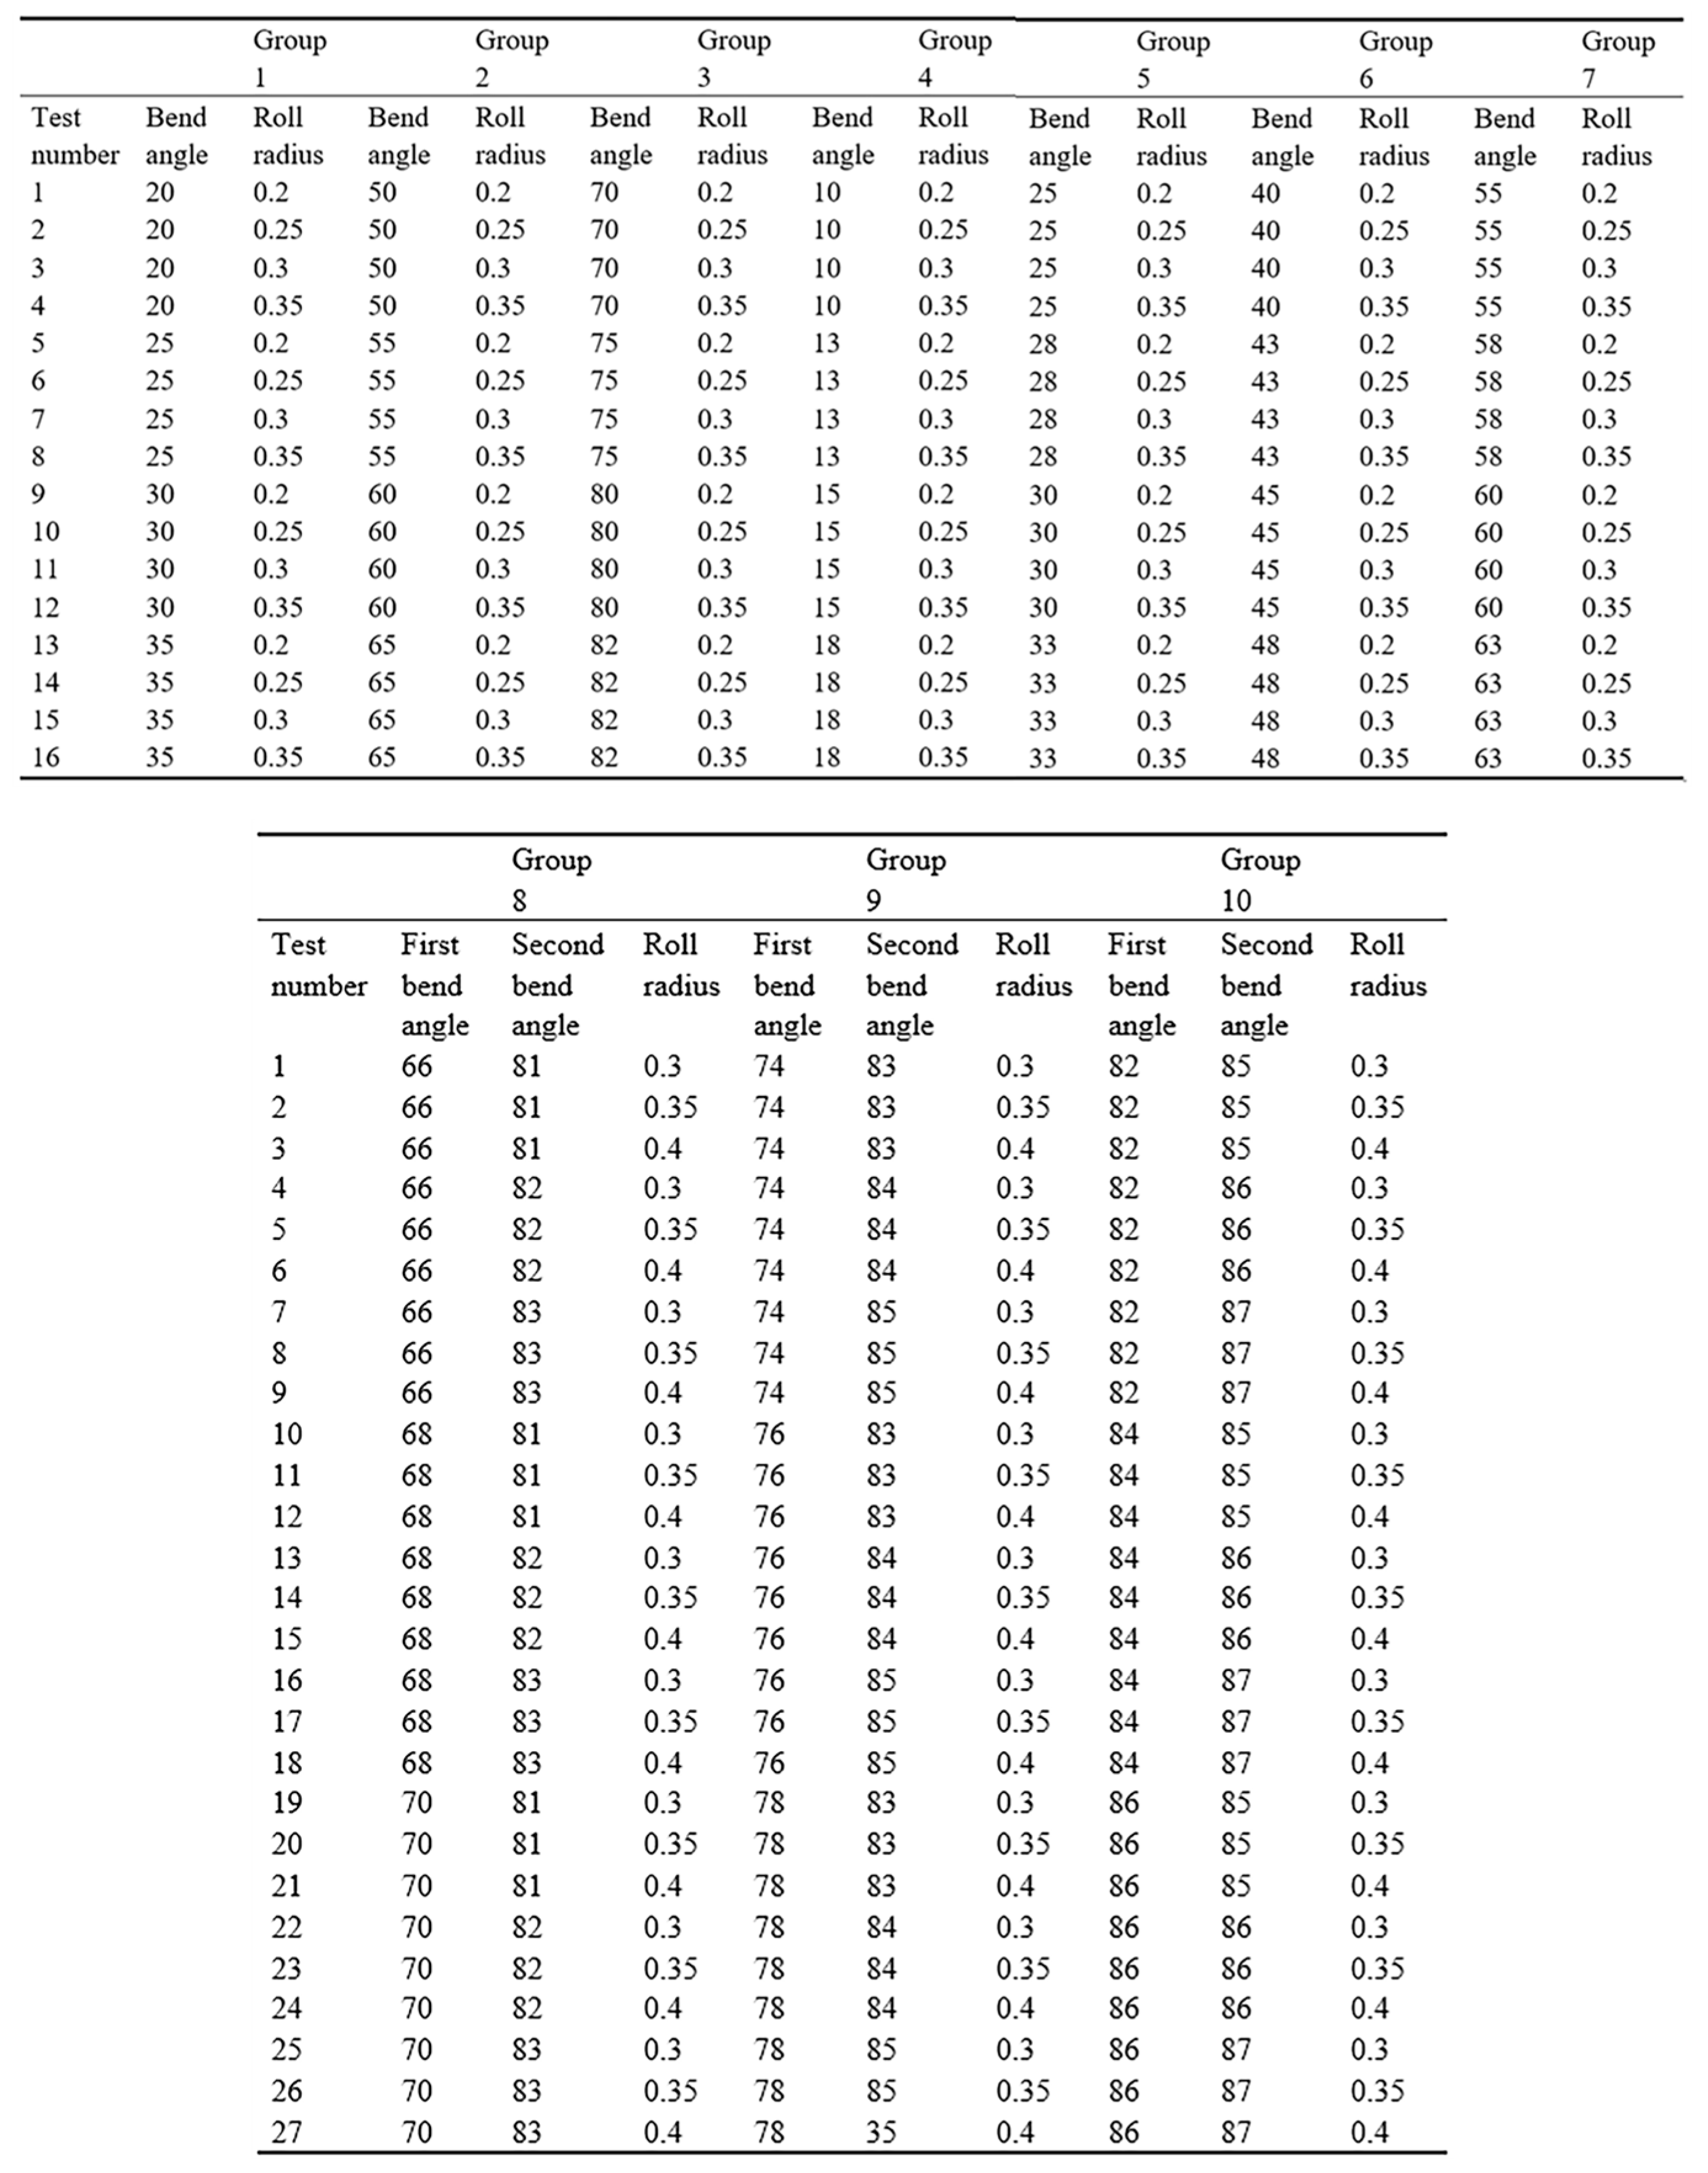
3.3.2. Optimization Design

The main factors affecting the shape of the strip are as follows: the number of forming passes, the pitch of the frame, the distribution of the bending angle, the thickness of the strip, the material properties (yield strength, modulus of elasticity, hardening properties), the shape of the product section and the diameter of the working roll. The frame spacing is not considered as it is much greater than the length of the deformation zone and has less influence on the edge deformation when designing. The thickness of the strip, the material properties, and the shape of the product section are part of the product requirements [27,28,29,30,31]. Therefore, the process parameters selected for optimization in the thesis are as follows: number of forming passes, bending angle distribution, and work roll diameter. In order to optimize the effect of each forming pass and to facilitate the extraction of the strain data on the strip edge after the completion of that pass, the model shown in Figure 6 was split so that the pass to be optimized becomes the final pass. The first group of tests was carried out from the beginning of the bite into the strip until the first forming of the second bend on the right side was completed, as shown in Figure 13a; the second group of tests was carried out from the beginning of the bite into the strip until the second forming of the second bend on the right side was completed, as shown in Figure 13b, and so on, with the total forming process in Table 1 being split into ten sub-groups of forming processes. In groups 1–7, there are two variables to be optimized, i.e., the bending angle and roll diameter, and in groups 8–10, there are three variables to be optimized, i.e., two bending angles and one roll diameter. The parallel quantities were selected with reference to Table 1, and the final design of the test program is shown in Figure 14.

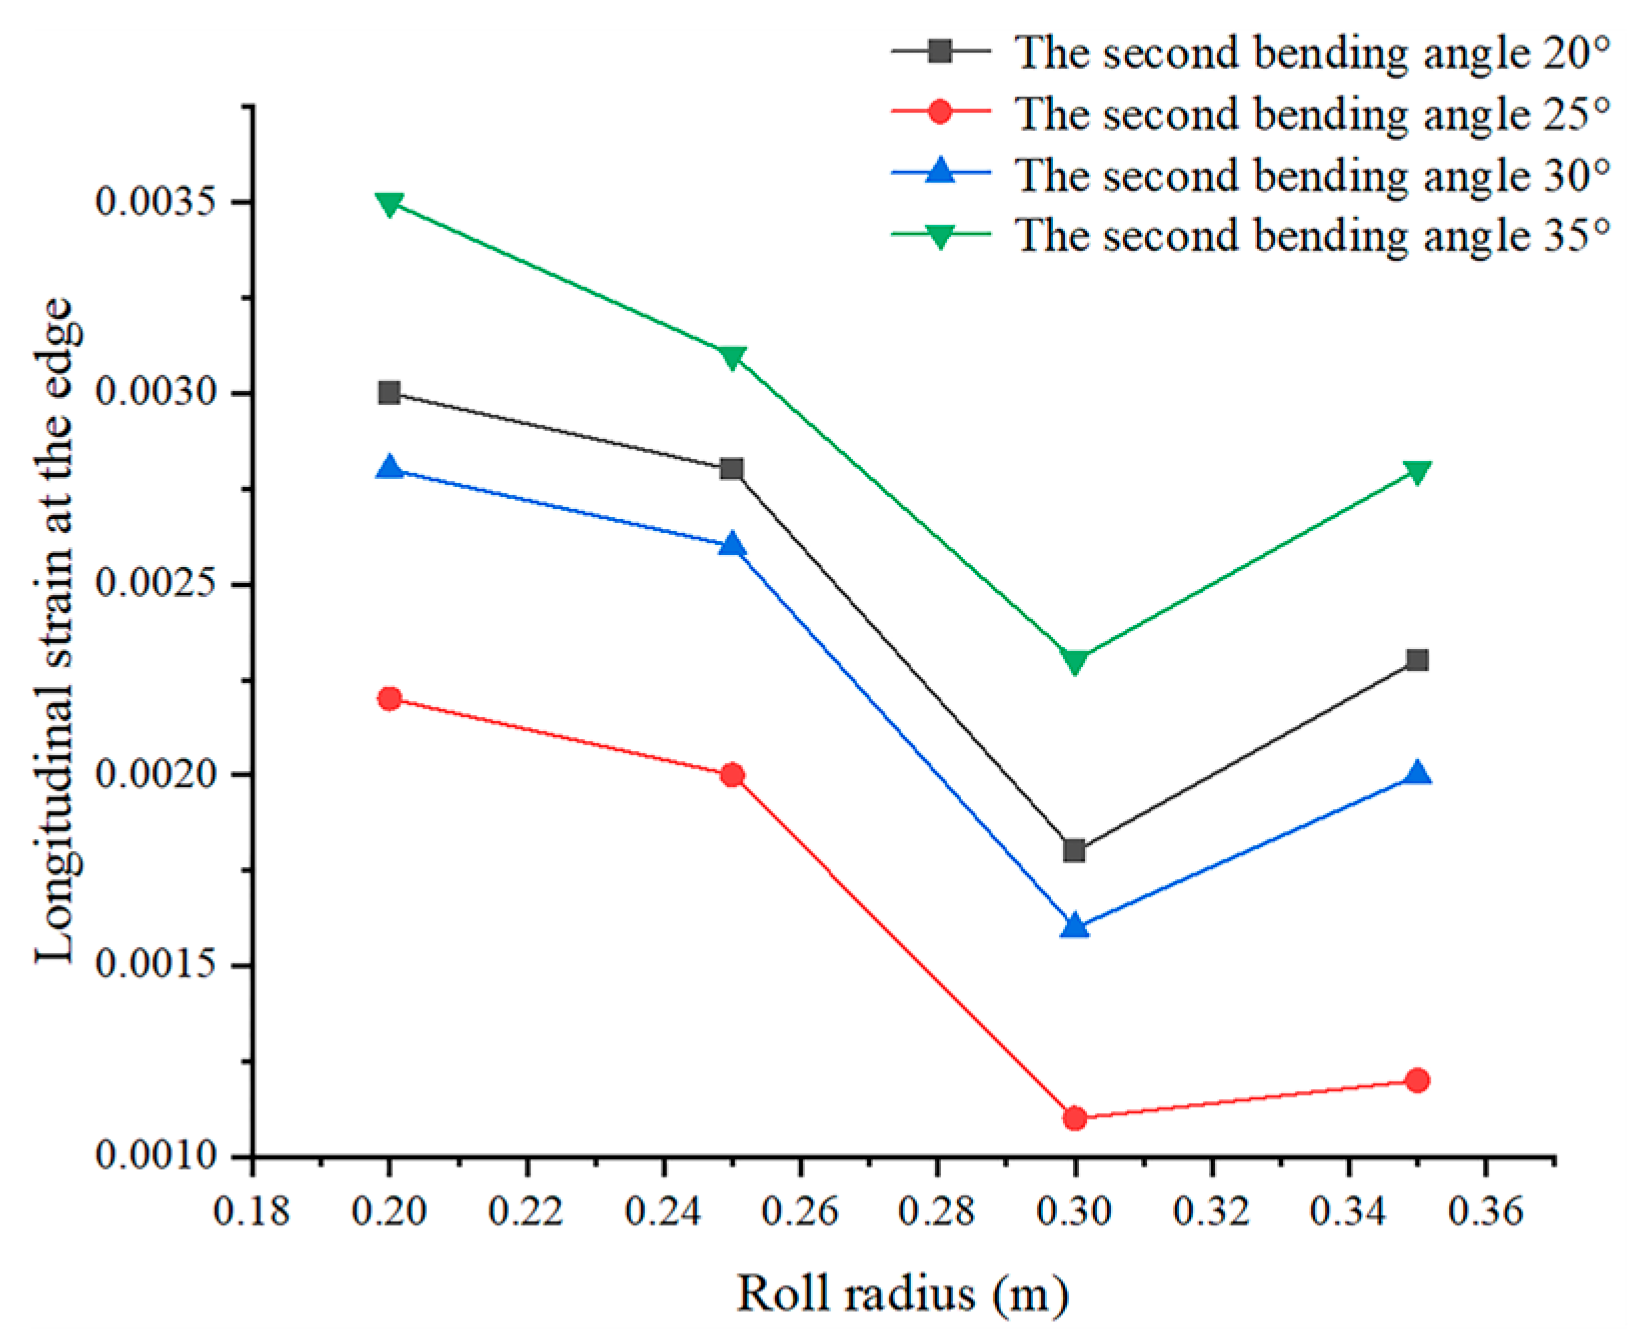
3.3.3. Simulation and Optimization Results

The results of the finite element simulations, based on the first set of test scenarios developed, were obtained for the maximum longitudinal strain ε at the edge of the strip, as shown in Table 4. The variation of the longitudinal strain at the strip edge with bending angle and roll diameter is shown in Figure 15.
The extreme difference in the mean value of ε for different second bending angles is 0.12%, and the extreme difference in the mean value of ε for different roll diameters is 0.11%, so the effect of roll diameter on the edge quality of the strip is lower than the effect of bending angle.
As can be seen from Figure 15, within the current process parameters, the longitudinal strain at the edge of the strip first decreases as the roll diameter increases when the bend angle remains constant, reaching a minimum at 600 mm and then rising again. The longitudinal strain is slightly more sensitive to changes in bend angle than changes in roll diameter, and is at its lowest at a bend angle of 30°. Considering the cross influence of roll diameter and bend angle on the average longitudinal strain at the edge of the strip, a regression model is required to analyze the effect of the two parameters, which is set as a binary quadratic polynomial model as shown in Equation (6).
ε 1 = a 1 + a 2 β 1 + a 3 D 1 + a 4 β 1 2 + a 5 β 1 D 1 + a 6 D 1 2 + a 7 β 1 3 + a 8 β 1 2 D 1 + a 9 D 1 2 β 1 + a 10 D 1 3 + a 11 β 1 4 + a 12 β 1 3 D 1 + a 13 β 1 2 D 1 2 + a 14 β 1 D 1 3 + a 15 D 1 4
In the formula, ε 1 —the maximum longitudinal strain at the edge of the strip after test group1; a 1 a 15 —the regression coefficient; β 1 —the second bending angle in the first set of tests; D 1 —the diameter of the work roll in the first set of tests.
The correlation analysis of each term was conducted using SPSS 26.0 to find out the terms with good correlation were D 1 , β 1 2 , β 1 2 D 1 , D 1 2 β 1 , β 1 3 D 1 , β 1 D 1 3 , and D 1 4 . The correlations of these terms were less than 0.05, showing a significance of 0.05. The correlations of the other terms were greater than 0.05, so in order to improve computational efficiency and ensure accuracy, only the above terms were considered in the regression analysis, and the results of the regression analysis are shown in Table 5.
From this, the regression equation can be obtained as:
ε 1 = 0.007 0.019 D 1 6.122 E 6 β 1 2 + 5.474 E 5 β 1 2 D 1 0.003 D 1 2 β 1 1.2 E 5 β 1 2 D 1 2 0.005 D 1 3 β 1 + 0.065 D 1 4
A value of 0.863 for R2 means that D 1 , β 1 2 , β 1 2 D 1 , D 1 2 β 1 , β 1 3 D 1 , β 1 D 1 3 , and D 1 4 can explain 86.3% of the variation in edge strain.
Express this regression equation in EXCEL and use the planning solver function in EXCEL to solve it. Find the value of ε that minimizes when 20 < β 1 < 35 and 0.2 < D 1 < 0.35. The result is a minimum ε of 0.119% for β 1 of 26.75° and D 1 of 0.3345 m.
Following a similar process, simulations and regressions can be carried out for the other processes in Figure 14. In particular, the optimized first bend angle is 83.81°, the second bend angle is 85.68°, the optimized roll diameter is 742 mm and the optimized longitudinal edge strain is 0.846% for the tenth set of tests.

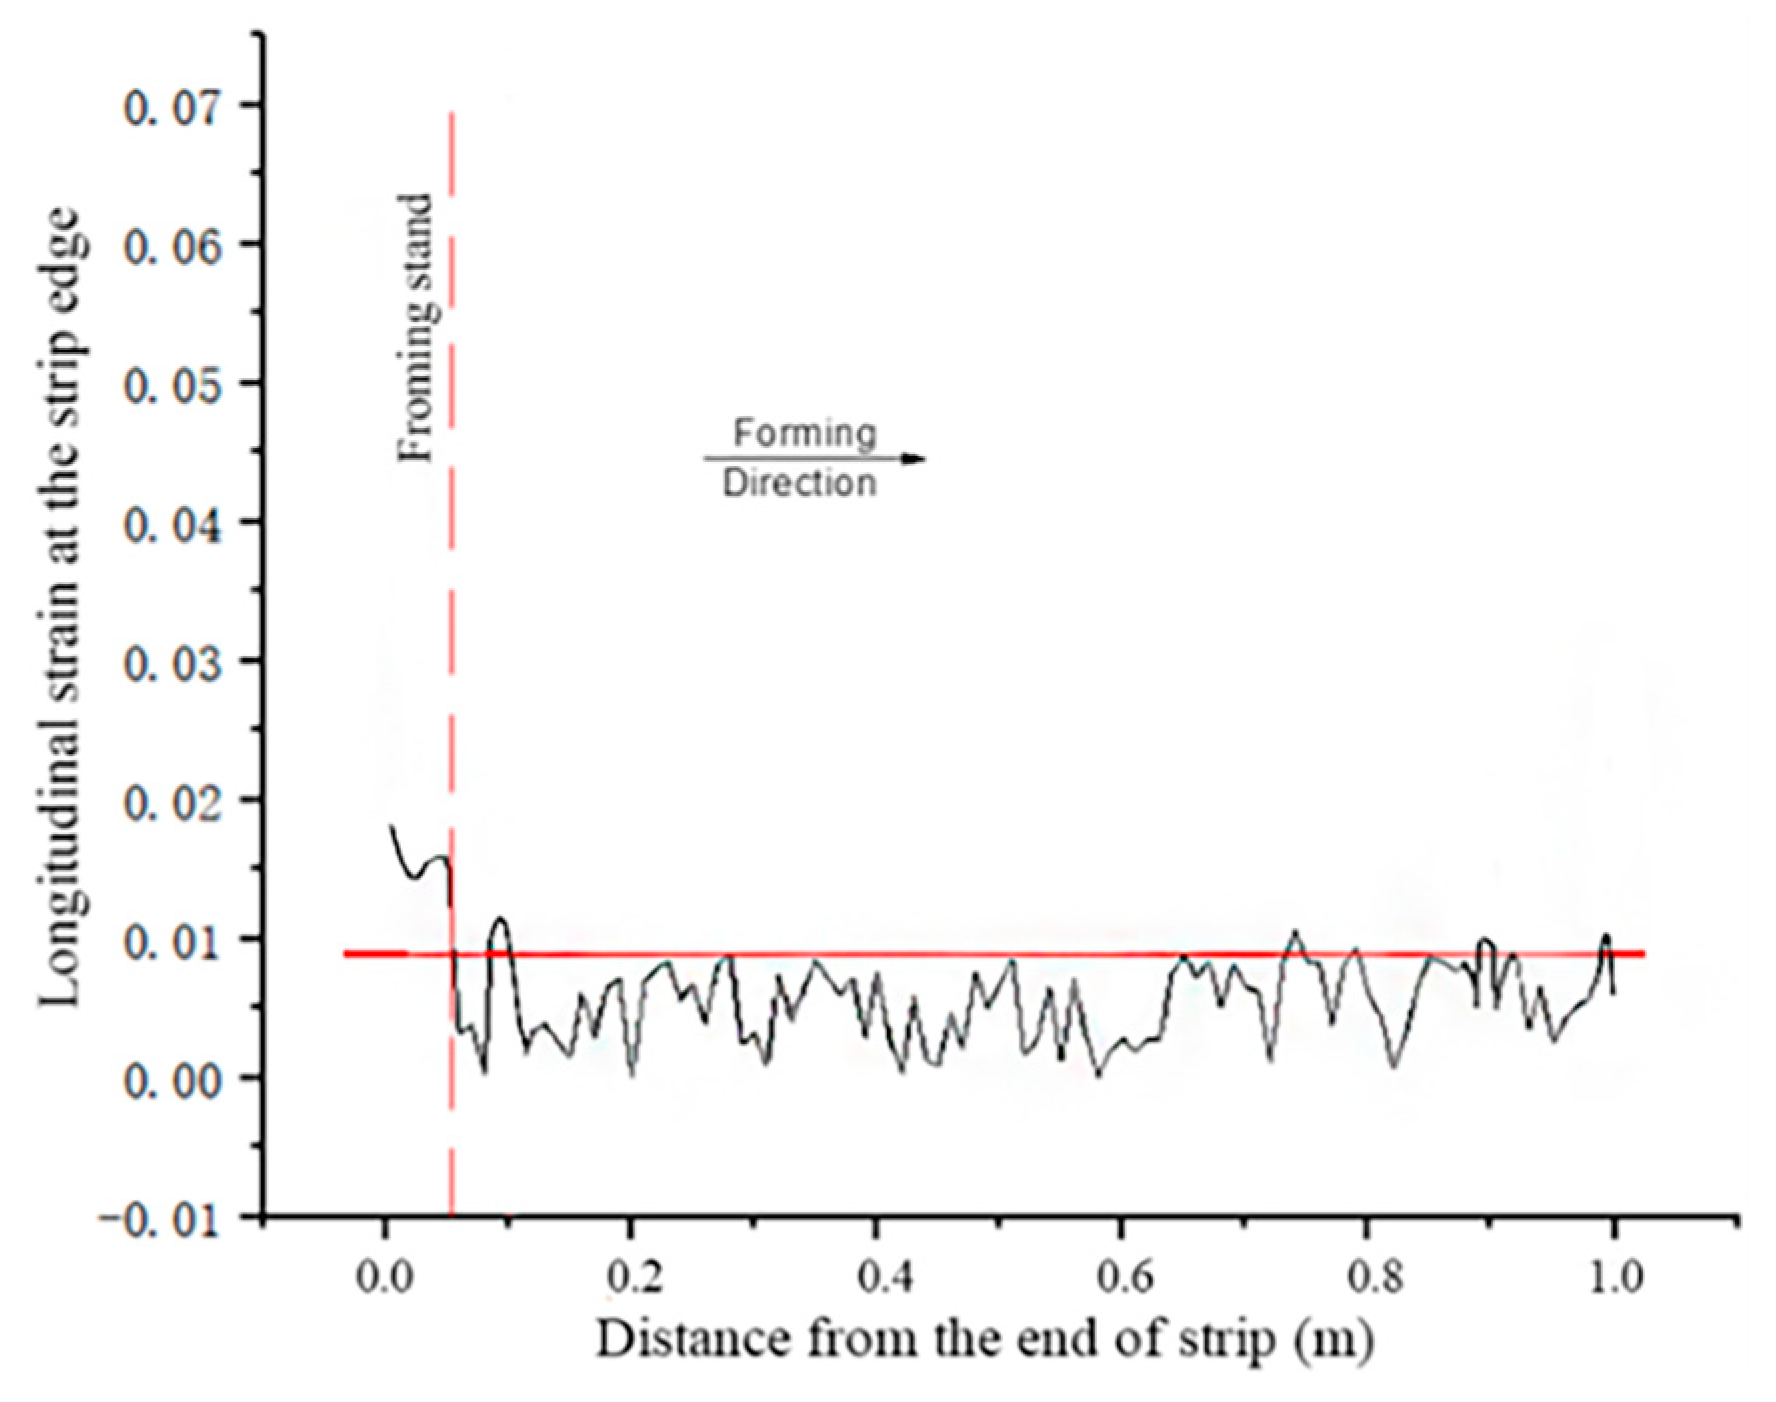
3.3.4. Results of the Full Simulation of Cold Roll Forming Using Optimized Data

According to the optimization process, the optimized maximum ε is 0.846%, which is less than 0.9% and greater than 0.5%, so there is no need to optimize the rolling passes. The optimization results are rounded to obtain the values of the bending angle and roll diameter for each pass of the process, as shown in Table 6.
The bending angle and roll diameter for each pass in Table 6 were input into the APDL command stream of the complete flexible continuous cold bending process finite element simulation. The longitudinal strain distribution at the edge of the strip obtained after the simulation is shown in Figure 16, which can be compared with Figure 13. The results show that the longitudinal strain of the strip edge is only a few points greater than 0.9% in the simulation using the optimized process parameters, which is significantly reduced compared with the longitudinal strain before optimization. Comparing Table 6 with Table 1 shows that the total amount of bending angles in the solid bending passes decreased after optimization, while the total amount of bending angles in the air-bending passes increased. Generally speaking, the forming effect of air bending is not as good as that of solid bending, and sometimes there are multiple serious “reverse bends” (Figure 17), i.e., the local bending direction is opposite to the overall bending direction and the center of the circle is located outside the strip. This phenomenon not only makes the production process consume excess energy, resulting in roll surface wear, but also leads to the so-called “Bauschinger effect” in the forming of the strip, so that the local material properties of the strip is lower than the parent material, resulting in product inspection failures. For this reason, the original design was conservative in the amount of bending angle allocated to the air-bending pass. In particular, the first bending angle, in the three air bending sub-times only increased by 6°, while the solid bending sub-times carried out 80° of the bending, which does not give full play to the rolling capacity of the air bending sub-times; at the same time, the solid bending sub-times of the bending ration are too high, leading to poor edge quality of the product.
In order to check whether serious “reverse bending” occurs in the strip during forming using the optimized process parameters, the curvature of the arc with the center of the circle inside the strip is specified as positive and the curvature of the arc bending in the opposite direction is negative; the less negative the curvature, the less reverse bending occurs. The relative curvature of the strip cross-section at key locations in the forming is extracted, and the area of negative curvature on the strip cross-section is integrated to obtain the amount of reverse bending, as shown in Figure 18. As can be seen from the figure, the most serious reverse bending is located between corner 1 and corner 2, and the reverse bending phenomenon is not aggravated after adjusting the bending angle and the roll diameter.

4. Conclusions

(1)
In the current data range, the influence of the bending angle on the possible buckling of the strip edge in forming is higher than the influence of the roll diameter. A suitable distribution of the bending angles and roll diameter for each forming pass in cold bending can avoid the “Bauschinger effect” in forming and prevent edge buckling, which seriously affects the quality of welded joints.
(2)
This paper presents a combined numerical simulation and mathematical modeling method that, based on predicting edge buckling in strip forming, has the capability to optimize key process parameters before the production line is put into operation, minimizing the possible buckling of the strip edges in forming and reducing the losses that may be caused by design defects. The method can give full play to the capabilities of the cold bending unit and can also be applied to the optimization of multiple process parameters for other forming processes.

Author Contributions

S.H.: Conceptualization; Formal analysis; Funding acquisition; Investigation; Methodology; Resources; Writing—original draft; Validation. J.Z.: Validation; Visualization; Writing—original draft; Data curation; Writing—review & editing; Y.L.: Project administration; Supervision; Writing—review & editing; Visualization All authors have read and agreed to the published version of the manuscript.

Funding

Partial financial support was received from State Key Laboratory of Materials Processing and Die & Mould Technology, Huazhong University of Science and Technology (P2023-018).

Data Availability Statement

The original contributions presented in this study are included in the article. Further inquiries can be directed to the corresponding author.

Acknowledgments

Thanks to the experimental aid by Analytical Testing and Instrument Sharing Center in Wuhan University of Science and Technology.

Conflicts of Interest

The authors declare that they have no known competing financial interests or personal relationships that could have appeared to influence the work reported in this paper.

References

  1. Cheng, J.J.; Cao, J.G.; Zhao, J.W.; Liu, J.; Zhao, R.G.; Liu, S.Q. The flower pattern and rolls design for ERW pipes with the different specification in the flexible roll forming process. Thin-Wall Struct. 2020, 154, 106–809. [Google Scholar] [CrossRef]
  2. Ghiabakloo, H.; Kim, J.; Kang, B.S. An efficient finite element approach for shape prediction in flexibly-reconfigurable roll forming process. Int. J. Mech. Sci. 2018, 142–143, 339–358. [Google Scholar] [CrossRef]
  3. Park, J.W.; Kil, M.G.; Kim, J.; Kang, B.S. A Predictive Model of Flexibly-reconfigurable Roll Forming Process using Regression Analysis. Procedia Eng. 2017, 207, 1266–1271. [Google Scholar] [CrossRef]
  4. Sreenivas, A.; Abeyrathna, B.; Rolfe, B.; Weiss, M. Longitudinal strain and wrinkling analysis of variable depth flexible roll forming. J. Manuf. Process. 2022, 81, 414–432. [Google Scholar] [CrossRef]
  5. Sheu, J.J.; Liang, C.F.; Yu, C.H.; Hsu, W.C.; Lee, P.K. Flexible roll forming of U-section product with curved bending profile using advanced high strength steel. Procedia Manuf. 2018, 15, 782–787. [Google Scholar] [CrossRef]
  6. Kasaei, M.M.; Moslemi Naeini, H.; Azizi Tafti, R.; Salmani Tehrani, M. Prediction of maximum initial strip width in the cage roll forming process of ERW pipes using edge buckling criterion. J. Mater. Process. Technol. 2014, 214, 190–199. [Google Scholar] [CrossRef]
  7. Hu, S.D.; Pi, D.G.; Li, L.X. Influence of Technology on Deformation Behavior of Cold-formed High Frequency Induction Welded Steel Pipes. Adv. Mater. Res. 2013, 631–632, 704–707. [Google Scholar] [CrossRef]
  8. Hu, S.D.; Ye, B.; Li, L.X. Materials properties of thick-wall cold-rolled welded tube with a rectangular or square hollow section. Construction and Building. Materials 2011, 25, 2683–2689. [Google Scholar]
  9. Farzin, M.; Salmani Tehrani, M.; Shalemi, E. Determination of buckling limit strain in cold roll forming by the finite element analysis. J. Mater. Process. Technol. 2002, 125–126, 626–632. [Google Scholar] [CrossRef]
  10. Bhattacharyya, D.; Smith, P.D. The Development of Longitudinal Strain in Cold Roll Forming and its influence of Product Straightness. In Proceedings of the 1984 Advanced Tech of Plasticity, ATP, Tokyo, Japan, 3–5 September 1984; pp. 422–427. [Google Scholar]
  11. Woo, Y.Y.; Han, S.W.; Hwang, T.W.; Park, J.Y.; Moon, Y.H. Characterization of the longitudinal bow during flexible roll forming of steel sheets. J. Mater. Process. Technol. 2018, 252, 782–794. [Google Scholar] [CrossRef]
  12. Safdarian, R.; MoslemiNaeini, H. The effects of forming parameters on the cold roll forming of channel section. Thin-Wall Struct. 2015, 92, 130–136. [Google Scholar] [CrossRef]
  13. Li, D.J.; Xu, L.Q.; Li, L.J.; Yue, C.F.; Zhou, W.J.; Zhang, C.L. Finite element simulation for straightedge lineal roll forming process of high frequency welding pipe. Int. J. Interact. Des. Manuf. IJIDeM 2023, 19, 743–751. [Google Scholar] [CrossRef]
  14. Tehrani, M.S.; Naeini, H.M.; Hartley, P.; Khademizadeh, H. Localized edge buckling in cold roll-forming of circular tube section. J. Mater. Process. Tech. 2006, 177, 617–620. [Google Scholar] [CrossRef]
  15. Luo, Z.; Sun, M.; Zhang, Z.; Lu, C.; Zhang, G.; Fan, X. Finite element analysis of circle-to-rectangle roll forming of thick-walled rectangular tubes with small rounded corners. Int. J. Mater. Form. 2022, 15, 73. [Google Scholar] [CrossRef]
  16. DIN 6935:1975; Cold Bending of Flat Rolled Steel Products (FOREIGN STANDARD). Deutsches Institut für Normung: Berlin, Germany, 1975.
  17. Abeyrathna, B.; Ghanei, S.; Rolfe, B.; Taube, R.; Weiss, M. Optimising part quality in the flexible roll forming of an automotive component. Int. J. Adv. Manuf. Technol. 2021, 118, 3361–3373. [Google Scholar] [CrossRef]
  18. Cao, J.; Wang, X.; Ruan, K.; Cheng, J.; Wei, Z.; Zhao, R. Numerical simulation research on UDF flexible roll forming of multi-specification thin-walled circular tubes. Int. J. Adv. Manuf. Technol. 2023, 127, 4503–4517. [Google Scholar] [CrossRef]
  19. Gardner, L.; Saari, N.; Wang, F. Comparative experimental study of hot-rolled and cold-formed rectangular hollow sections. Thin-Walled Struct. 2010, 48, 495–507. [Google Scholar] [CrossRef]
  20. Yoon, J.S.; Kim, J.; Kim, H.H.; Kang, B.S. Feasibility study on flexibly reconfigurable roll forming process for sheet metal and its implementation. Adv. Mech. Eng. 2014, 6, 958925. [Google Scholar] [CrossRef]
  21. Chen, J.; Jin, W.L. Corner strength enhancement of high strength cold-formed steel at normal room and elevated temperatures. J. Zhejiang Univ. Sci. A 2008, 9, 1251–1257. [Google Scholar] [CrossRef]
  22. Wang, Y.; Xu, X.; Liu, H.; Liu, J.; Zhao, R. Optimization of the Forming Method on Torsion Defect in Cold-Roll Forming of Z Section Steel. ACS Omega 2022, 7, 4804–4811. [Google Scholar] [CrossRef]
  23. Shirani Bidabadi, B.; Moslemi Naeini, H.; Safdarian, R.; Barghikar, H. Investigation of over-bending defect in the cold roll forming of U-channel section using experimental and numerical methods. Proc. Inst. Mech. Eng. 2022, 236, 1380–1392. [Google Scholar] [CrossRef]
  24. Liu, M.; Liu, Y.; Li, H. Deformation analysis of double wall brazed tube in the multi-pass roll forming: Cross-sectional variation, stress-strain evolution and roundness assessment. J. Manuf. Process. 2023, 85, 479–491. [Google Scholar] [CrossRef]
  25. Sreenivas, A.; Abeyrathna, B.; Rolfe, B.; Weiss, M. Analysing the reduction in buckling limit of a flexible roll formed flange due to shape imperfection. J. Mater. Process. Tech. 2025, 338, 118767. [Google Scholar] [CrossRef]
  26. Liu, H.; Chen, J.; Chan, T.M. Mechanical properties of corner material in cold-formed steel structure: From normal strength to high strength. Structures 2024, 59, 105651. [Google Scholar] [CrossRef]
  27. Lee, H.; Park, N.; Kim, M.; Lee, M.G.; Song, J.H. Recent Developments and Trends in Flexible Forming Technology. Int. J. Automot. Technol. 2022, 23, 741–763. [Google Scholar] [CrossRef]
  28. Du, F.S.; Fu, Z.Q.; Yu, H. Roll Flower Design and forming mechanism of rectangular tubes in cold roll forming processes. China Mech. Eng. 2016, 27, 2841–2845. [Google Scholar]
  29. Díaz, A.; Cuesta, I.I.; Alegre, J.M.; de Jesus, A.M.P.; Manso, J.M. Residual stresses in cold-formed steel members: Review of measurement methods and numerical modelling. Thin-Walled Struct. 2021, 159, 107335. [Google Scholar] [CrossRef]
  30. Xiao, L.H.; Li, Y.; Cao, Y.X.; Cao, Y.F. Mechanisms and influences of edge-wave in roll-forming for thin-walled channel steel parts. J. Plast. Eng. 2016, 23, 32–39. [Google Scholar]
  31. Abeyrathna, B.; Rolfe, B.; Taube, R.; Oxley, B.; Weiss, M. Part quality improvement in flexible roll forming of a combined variable width and depth component. IOP Conf. Ser. Mater. Sci. Eng. 2023, 1284, 012010. [Google Scholar] [CrossRef]
Figure 1. Flow chart of cold forming process optimization.
Metals 15 00455 g001
Figure 2. Cross-section of the final product.
Metals 15 00455 g002
Figure 3. Cross-sectional shape of strip.
Metals 15 00455 g003
Figure 4. Sketch of (a) air-bending and (b) solid-bending.
Metals 15 00455 g004
Figure 5. The flower pattern.
Metals 15 00455 g005
Figure 6. Finite element model of cold forming.
Metals 15 00455 g006
Figure 7. Effective stress in the strip for the first forming stage. (a) Pass 1 or pass 2, (b) pass 3 or pass 4, (c) pass 5 or pass 6.
Metals 15 00455 g007
Figure 8. Effective stresses in the strip for three air-bending passes. (a) Pass 15, (b) pass 16, (c) pass 17.
Metals 15 00455 g008
Figure 9. Parent material stress–strain curve.
Metals 15 00455 g009
Figure 10. Tensile coupons before testing.
Metals 15 00455 g010
Figure 11. Wave shape of the strip edge.
Metals 15 00455 g011
Figure 12. Longitudinal strain at the strip edge.
Metals 15 00455 g012
Figure 13. Test model (a) group 1 (b) group 2.
Metals 15 00455 g013
Figure 14. Test designs for groups 1–7 and 8–10.
Metals 15 00455 g014
Figure 15. Effect of bending angle and roll diameter on edge strain.
Metals 15 00455 g015
Figure 16. The optimized longitudinal strain distribution at the edge.
Metals 15 00455 g016
Figure 17. Sketch of reverse bending.
Metals 15 00455 g017
Figure 18. Negative curvature integral of skelp.
Metals 15 00455 g018
Table 1. The initial allocation of bending angle.
PassBending AngleDegree
Pass 1Second bend angle for left30°
Pass 2Second bend angle for right30°
Pass 3Second bend angle for left60°
Pass 4Second bend angle for right60°
Pass 5Second bend angle for left80°
Pass 6Second bend angle for right80°
Pass 7First bend angle for left15°
Pass 8First bend angle for right15°
Pass 9First bend angle for left30°
Pass 10First bend angle for right30°
Pass 11First bend angle for left45°
Pass 12First bend angle for right45°
Pass 13First bend angle for left60°
Pass 14First bend angle for right60°
Pass 15First and second bend angle68° and 82°
Pass 16First and second bend angle76° and 84°
Pass 17First and second bend angle84° and 86°
Table 2. WYS700 high-strength steel element composition.
ElementCMnSiCrNiMoAlPSCuV
Content (%)0.21.50.50.91.00.250.04≤0.02≤0.01≤0.30.05
Table 3. Tensile test results of corner coupons.
SpecimenYield Stress/MPaMean/MPaStandard Deviation/MPa
84°-1975.7
84°-2965.4
84°-31001.3980.818.5
86°-1965.2
86°-2999.4
86°-3991.5985.417.9
Table 4. The maximum longitudinal strain at the edge of the strip for test group 1.
Number12345678
ε0.31%0.27%0.18%0.24%0.22%0.20%0.12%0.14%
Number910111213141516
ε0.28%0.26%0.17%0.21%0.35%0.31%0.22%0.28%
Table 5. Results of regression analysis.
Non-Standardized CoefficientsRR2Adjustment of R2Model ErrorDW Value
BStandard Error
Constants0.0070.0030.9290.8630.7420.033%2.455
D 1 −0.0190.013
β 1 2 −6.122 × 10−60.000
β 1 2 D 1 5.474 × 10−50.000
D 1 2 β 1 −0.0030.003
β 1 3 D 1 −1.02 × 10−50.000
β 1 D 1 3 −0.0050.008
D 1 4 0.6500.258
Table 6. Bending angle and roll diameter after rounding of optimization results.
First Bend AngleSecond Bend AngleRoll Diameter
Pass 1, Pass 227°669 mm
Pass 3, Pass 457°636 mm
Pass 5, Pass 674°578 mm
Pass 7, Pass 813°74°608 mm
Pass 9, Pass 1029°74°572 mm
Pass 11, Pass 1243°74°642 mm
Pass 13, Pass 1459°74°552 mm
Pass 1568°82°714 mm
Pass 1675°84°672 mm
Pass 1784°85°742 mm
Disclaimer/Publisher’s Note: The statements, opinions and data contained in all publications are solely those of the individual author(s) and contributor(s) and not of MDPI and/or the editor(s). MDPI and/or the editor(s) disclaim responsibility for any injury to people or property resulting from any ideas, methods, instructions or products referred to in the content.

