Article

Investigation on the Influence of Vacancy and Alloying Element Content on the Performance of Fe/NbN Interface

1
Technology Center, Jiuquan Iron and Steel (Group) Co., Ltd., Jiayuguan 735100, China
2
State Key Laboratory of Advanced Processing and Recycling of Nonferrous Metals, Lanzhou 730050, China
*
Author to whom correspondence should be addressed.
Metals 2025, 15(7), 759; https://doi.org/10.3390/met15070759 (registering DOI)
Submission received: 5 June 2025 / Revised: 1 July 2025 / Accepted: 2 July 2025 / Published: 5 July 2025

Abstract

The alloying elements usually lead to the precipitation of second phases in steel, readily forming at grain boundaries, and the type and distribution of these phases significantly influence the mechanical properties of the matrix. In the present contribution, the austenitic matrix fcc-Fe, the precipitate NbN, and the interface properties between them are investigated by first-principles calculations in detail. The effects of vacancy and alloying element content on the interface performance are examined. The results indicate that the density of states (DOS) of the former is primarily contributed by the Fe d-orbitals, and both exhibit elastic anisotropy. Under a tensile strain of 20%, the maximum tensile strength of fcc-Fe reaches 32.6 GPa. For NbN, the maximum tensile strength comes to 29 GPa at a strain of 10%, after which the stress rapidly decreases with the increasing of strain. In the meantime, the uneven distribution of electron cloud density increases in both. Regarding the interface, the introduction of vacancies enhances atomic interaction and improves interface stability by altering electron cloud distribution. As the Co doping content increases, the covalent interactions between atoms strengthen at the interface, enhancing interface stability. However, excessive V doping may reduce the interface stability. Furthermore, when the vacancies coexist with alloying elements, the stronger covalent characteristics are observed due to shortened bond lengths and positive bond population values. These insights provide a data foundation and theoretical basis for designing high-performance austenitic stainless steels.

1. Introduction

Austenitic stainless steel with its excellent corrosion resistance, oxidation resistance, excellent comprehensive mechanical properties, favorable machinability, and welding performance has been widely used in many fields, such as thermal power, nuclear power, and aerospace [1,2,3]. It maintains a face-centered cubic structure at both high and room temperatures without tissue transformation, resulting in higher structural stability. Austenitic stainless steel is more expensive than other steel materials due to the addition of various alloying elements such as Cr and Ni that expand the austenite content [4,5,6,7,8]. Traditional stainless steel is an alloy steel containing Cr, Ni, and other elements. However, due to the high price of Ni, scholars at home and abroad have begun to explore the use of N and Mn elements to reduce or even replace Ni [9,10]. Nitrogen, as one of the most effective solid solution strengthening elements in austenitic stainless steel, can react with Al, Ti, Nb, and other elements in steel to form nitrite, which significantly improves the high-temperature strength and creep performance of grain boundaries. The research shows that the addition of an appropriate amount of N element to austenitic stainless steel can effectively improve the strength without significantly reducing the plasticity and toughness of steel. Among various nitride precipitating phases, NbN has attracted wide attention due to its excellent high temperature stability, high hardness, and low specific gravity. Importantly, it has a better stable structure than those of other transition metal nitrides (ScN, VN, ZrN, MoN, HfN, TaN, etc.) [11]. For instance, Ivashchenko et al. [12] simulated δ(Fm-3m)NbN under high temperature and pressure conditions by first-principles molecular dynamics, revealing the excellent high-temperature stability of the structure. Ren et al. [13] calculated the adsorption of Nb, Si, and N on NbN and determined that Nb-Si-N nanocomposites can achieve grain refinement and excellent hardness, which is due to the regulation of microstructure and properties by NbN.
With the growing demand for new material performance in industry, austenitic stainless steel, as a critical material, has received widespread attention and application in industrial production and scientific research [14,15,16,17,18,19,20,21,22,23]. The research focuses on the precise regulation and addition of alloying elements, as well as the preparation process and property characterization of materials. The introduction of alloying elements may change the microstructure and chemical composition of austenitic stainless steel, which can profoundly affect its physical, chemical, and mechanical performance. The mechanisms by which different alloying elements act on austenitic steels are different, and their influence mechanisms include multiple pathways, such as crystal structure adjustment, solid solution formation, precipitation of reinforcing phases, and construction of corrosion-resistant layers [24,25,26]. The synergistic effect of these mechanisms enables austenitic steels to present a diverse range of performance characteristics and endows them with a wide range of applications. Therefore, it is necessary to study the influence of different alloying elements on the properties of austenite. For example, Achmad et al. [27] systematically investigated the effects of different alloying elements (Cr, W, Mo, Ni, Mn, Al, and Fe) and their contents (0 to 20 at.%) on the stacking fault energy (SFE) of binary Co-based alloys by thermodynamic methods with first-principles density-functional theory (DFT). The results show that SFE increases with the increasing of temperature, Ni, Mn, Al, and Fe contents, and decreases with the rising of Cr, W, and Mo contents. Keke Song et al. [28] studied the effects of segregation of 16 alloying elements with different contents at α-Fe ∑3(111)[110] grain boundary (GB) on grain boundary strength, H atom capture, and hydrogen embrittlement of GB. It is found that alloying element segregation is regulated by grain boundary structure and atomic radii, and the electron localization function (ELF) is a key factor for evaluating grain boundary strengthening, which can provide guidance for the design of hydrogen embrittlement-resistant high-strength steels. Materials or components in the actual service process are usually subjected to monotonous or cyclic loads, and due to the different types of materials and preparation processes, the different hardening phenomena are present. In experiments, austenitic stainless steels with better properties can be obtained by laser melting, and there are also many studies on material defects and hardening phenomena of this austenitic type of laser melting [29,30]. Thus, defects are widely present in austenitic stainless steels. However, it is difficult to study the effect of defects on austenite experimentally due to the diversity of defects. Among them, vacancy, as one of the common defects, has an important influence on the interface between austenite and precipitated phases.
In this contribution, the electronic characterization of the fcc-Fe and NbN bulk phases was first investigated by means of first-principles calculations, and the density of states and differential charge densities of both of crystal structures are analyzed under different strains in order to elucidate the effect of stretching on the structural stability of the fcc-Fe and NbN bulk phases. Then, the fcc-Fe(111)/NbN(111) interface was built and the vacancies were introduced at the interface. The influence of doping different contents of alloy elements and vacancies on interfacial properties were explored by analyzing their density of states and differential charge electron properties.

2. Computational Details

The CASTEP software package (Materials studio 2020), which combines density functional theory with plane wave pseudopotential method, was used for all calculations. The ultra-soft pseudopotential mode is employed to research the interaction between the nucleus and the electron, the Perdew–Burke–Ernzerhof (PBE) functional within the generalized gradient approximation (GGA) was chosen as the exchange-correlation action of the electron [31], and a special k-point method in the form of Monkhorst–Pack was used for the first Brillouin zone integral. The cutoff energy was set to 380 eV and the k-points mesh were selected as 4 × 4 × 4 and 4 × 4 × 1 for the bulk sample and interface, respectively. When full relaxation was performed on the atoms, the self-consistent convergence conditions of the iteration were that the total energy was less than 1.0 × 10⁻⁵ eV/atom, the average atom force was under 0.03 eV/Å, the tolerance shift was not exceeding 0.01 nm, and the maximum stress deviation was 0.05 GPa. The valence electron states of the atoms involved in the calculation are Fe3d64s2, N2s22p3, and Nb4s24p64d45s1, respectively.

3. Results and Discussion

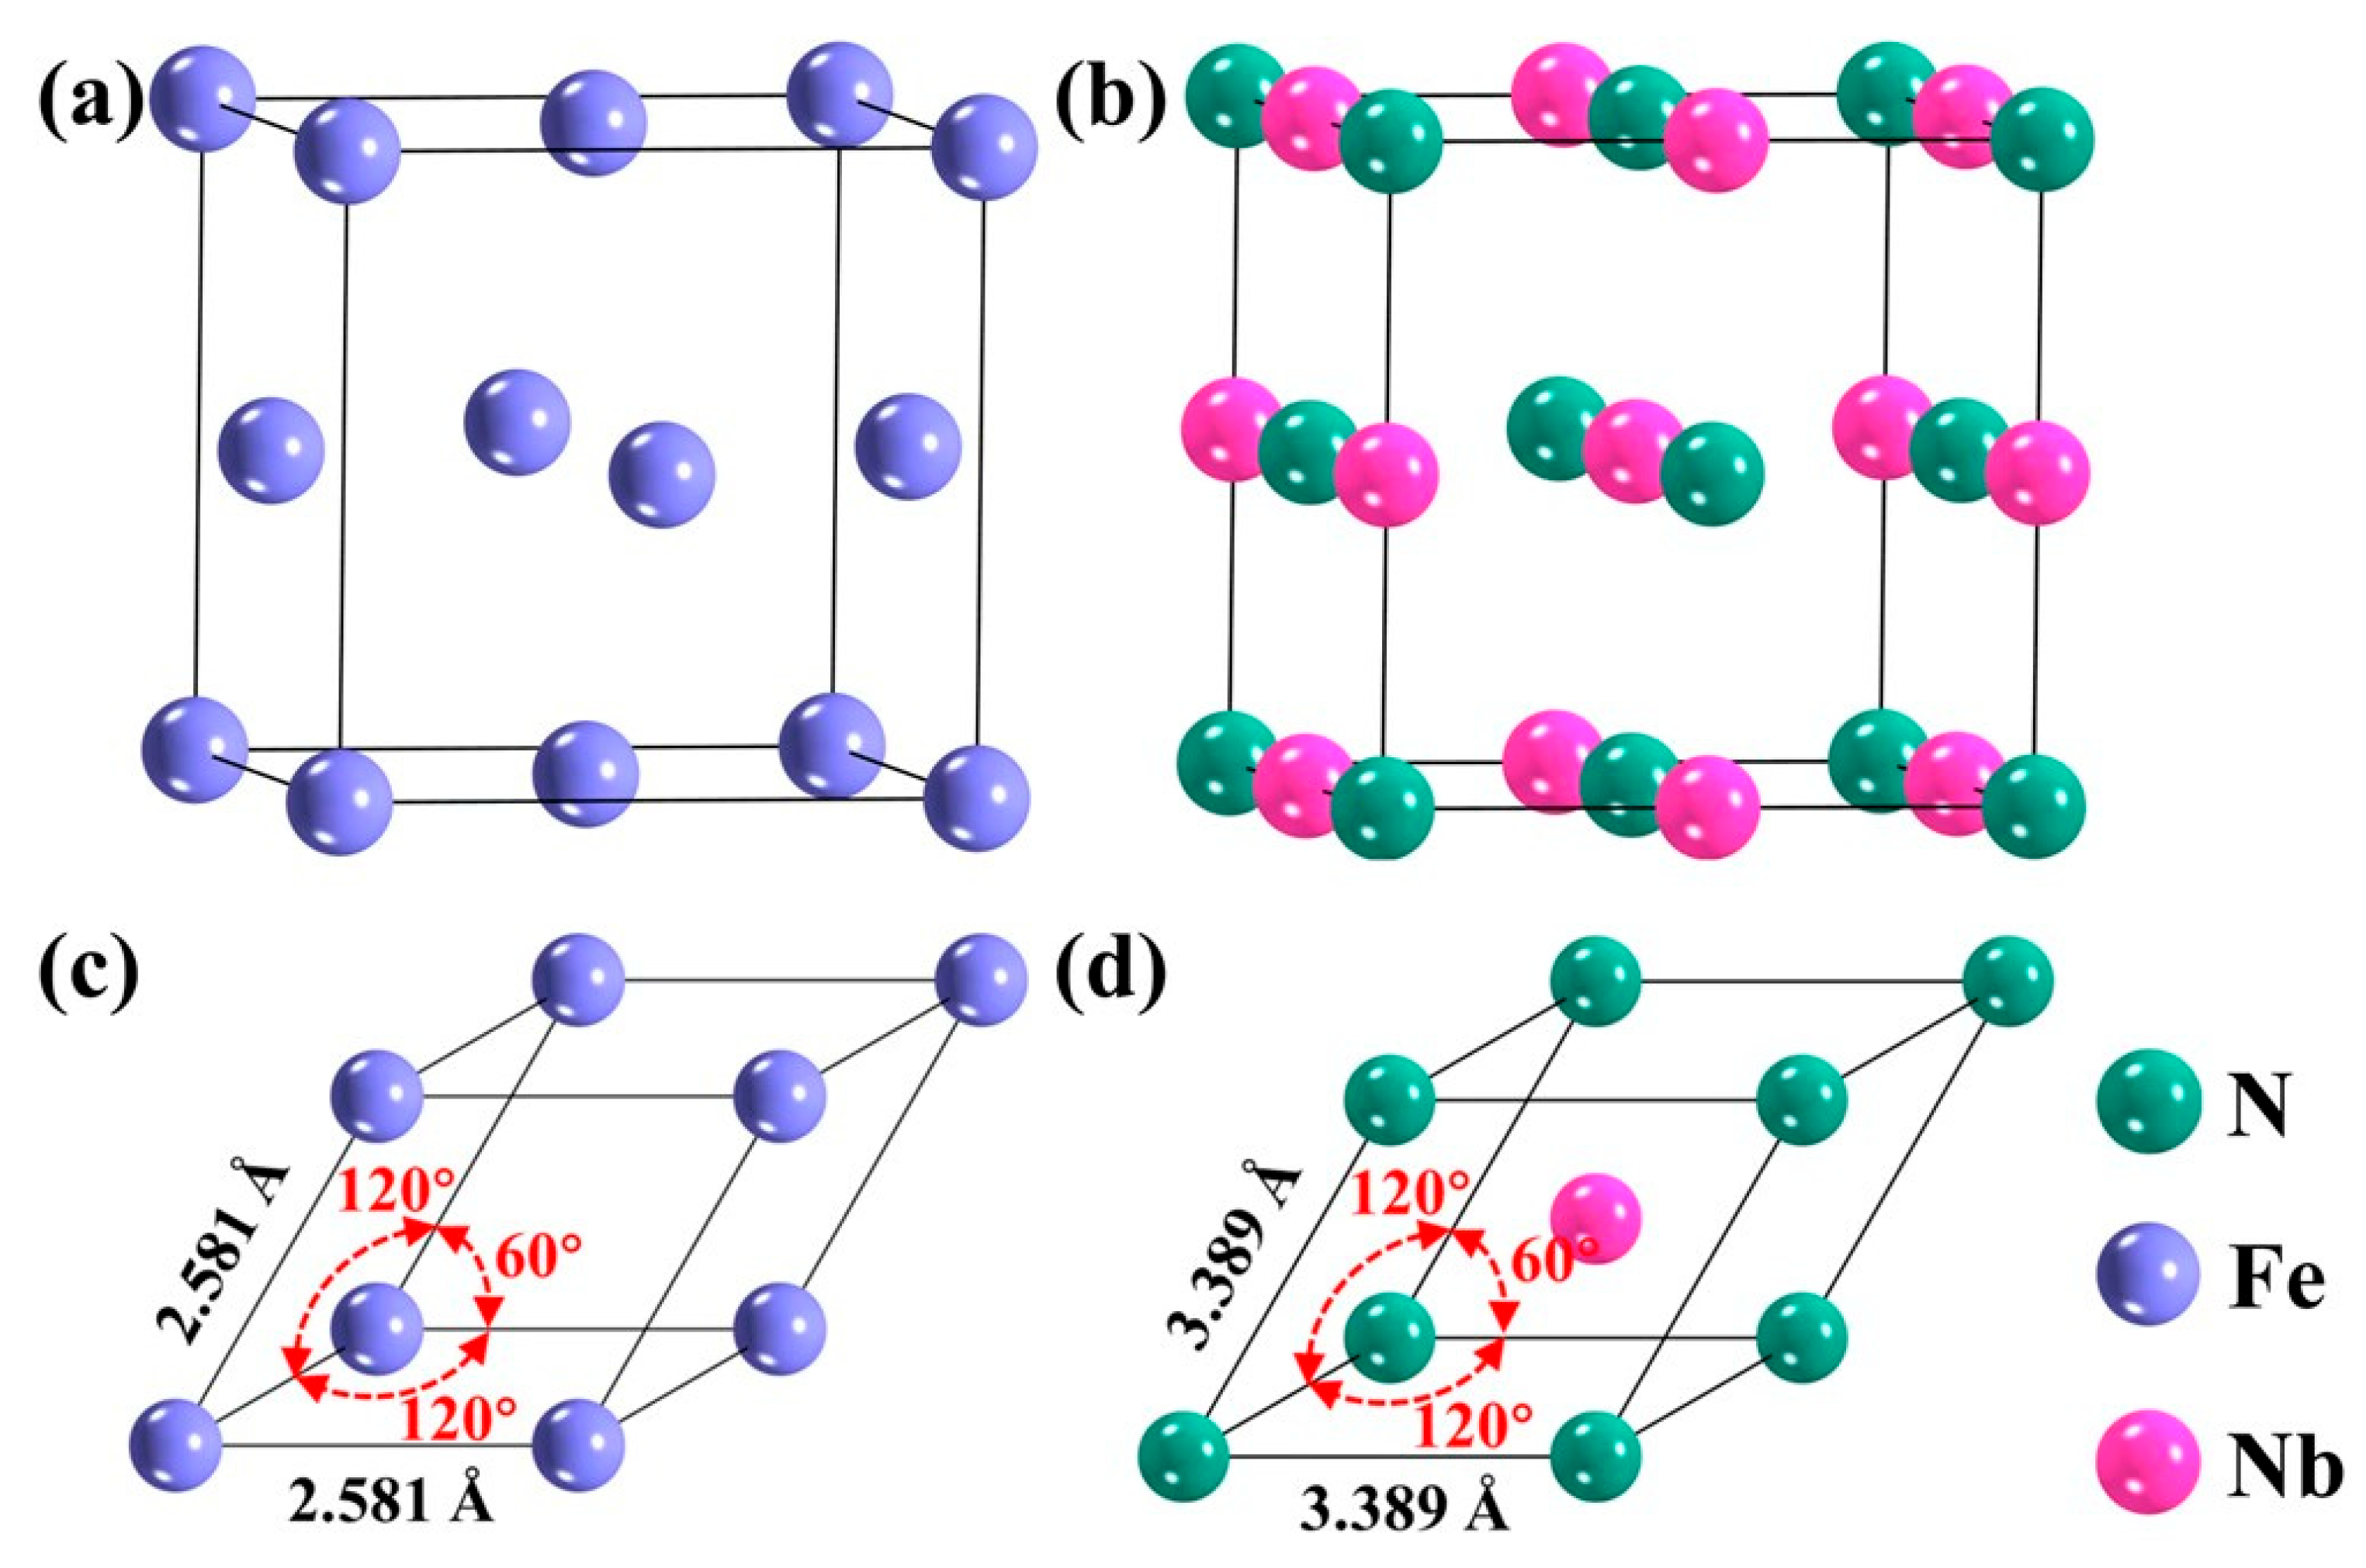
3.1. Bulk Phase fcc-Fe and NbN Model

The crystal structures of fcc-Fe and NbN are shown in Figure 1. The austenite consists of a face-centered cubic structure with a spatial point group of Fm-3m and the individual cell contains four Fe atoms, with a lattice constant of a = b = c = 3.65 Å. It can be seen that for NbN with NaCl-type crystal structure, the space point group is Fm-3m, the 4 Nb atoms and 4 N atoms are in each cell, with the lattice constants a = b = c = 4.45 Å and α = β = γ = 90°.

3.2. Characterization of Bulk Phase fcc-Fe and NbN

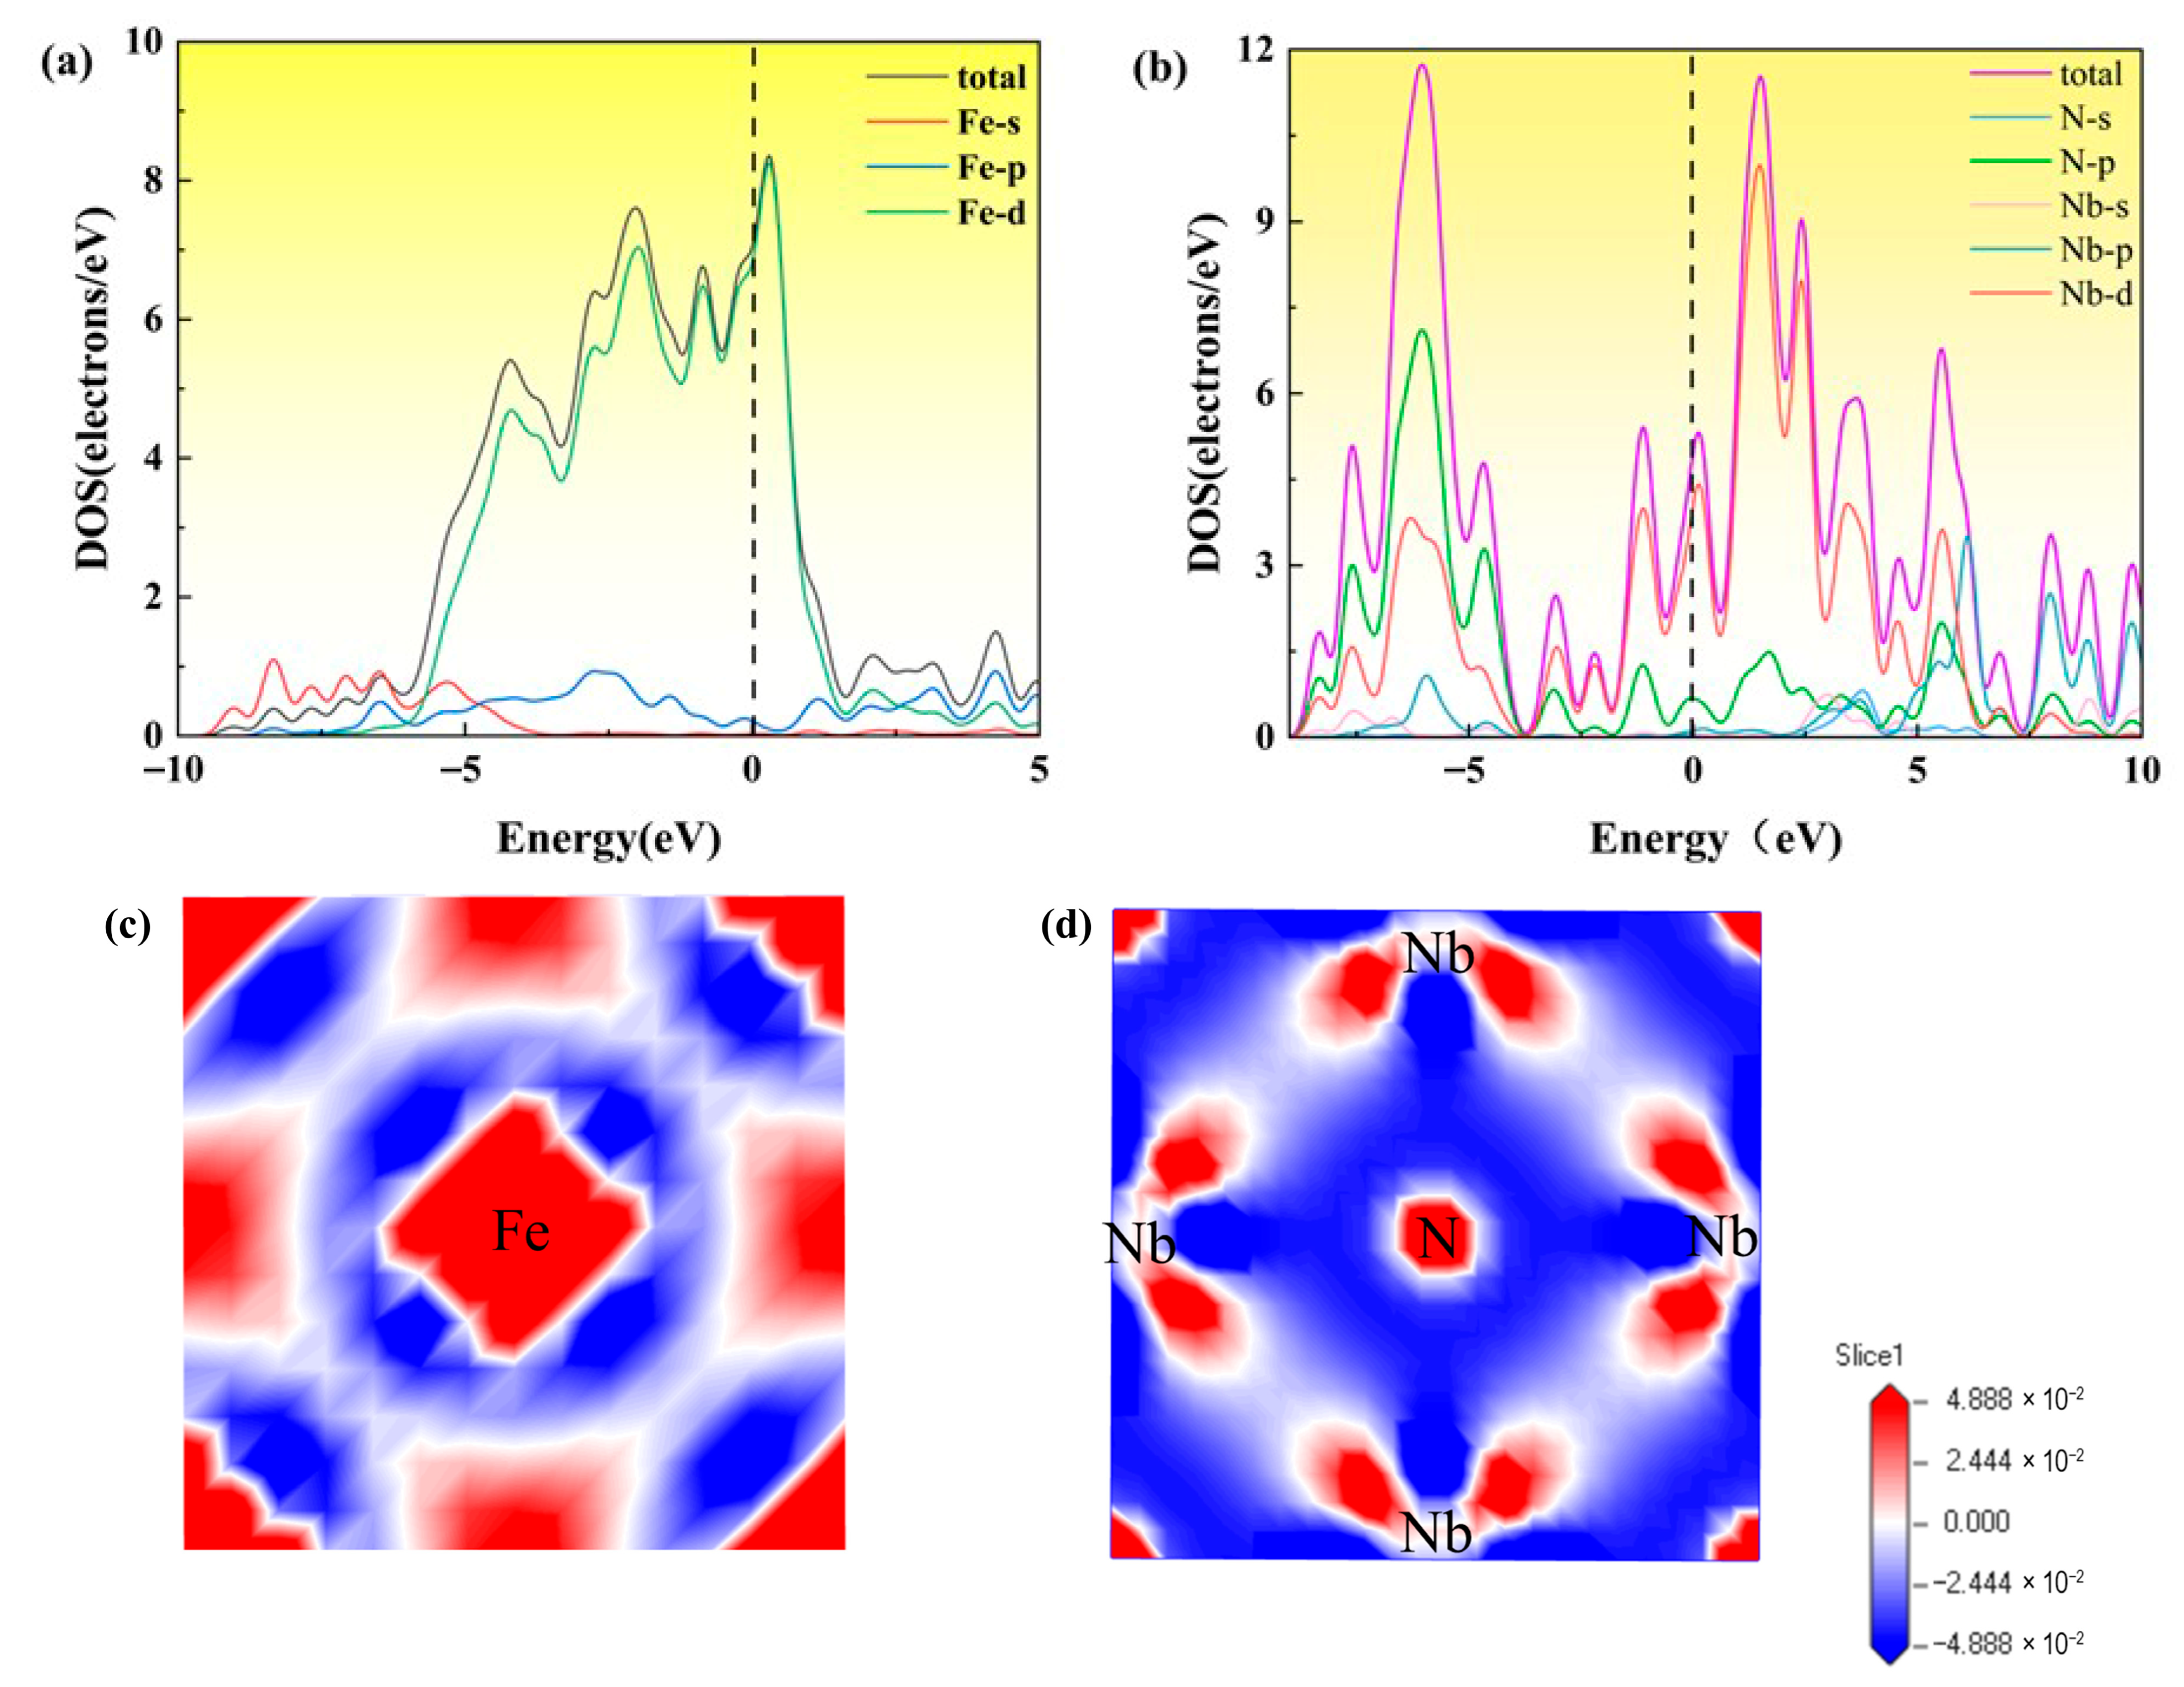
3.2.1. Electronic Property

Figure 2 presents the density of states of fcc-Fe versus NbN, with the black vertical dashed line representing the Fermi level. As seen in Figure 2a, the value of the density of states at the Fermi level is not zero, indicating that fcc-Fe is metallic. For fcc-Fe, the total state density mainly comes from the contribution of Fe-d orbitals, while the contribution of s and p-orbital electrons to the total state density is relatively limited. The density of states curves of different orbitals are not completely independent; in some energy regions there are crossovers and overlaps between the density of states of different orbitals, suggesting that there may be some interactions between the orbitals. The density of states shows there are significant peaks in the energy range from −5 eV to 5 eV and even wider, indicating that the electrons are highly delocalized, which fully demonstrates the characteristic of metals relying on free electrons for electrical conductivity. Figure 2b plots the density of states for the bulk phase structure of NbN, which is also not zero at the Fermi level, which indicates that NbN also possesses part metallic characteristics. In the energy range from −10 eV to −5 eV, the total density of states is mainly contributed by the p-orbitals of N atoms and the d-orbitals of Nb atoms, while near the Fermi level, it is mainly contributed by the d-orbitals of N atoms, and the p-orbitals of N atoms also have some contribution. Additionally, there is hybridization between the different orbitals, indicating a strong interaction between the atoms.
The differential charge density can reveal the interatomic interaction and the charge distribution at the interface. Figure 2c,d plots the differential charge densities of fcc-Fe and NbN, with blue and red colors representing electron dissipation and aggregation, respectively. As shown in Figure 2c, the region around Fe in the center is covered by a large area of red color, which suggests that there is a significant electron aggregation around the Fe atoms in this system. The blue parts surrounding the red Fe region show electron dissipation, meaning that the density of electrons in these regions is reduced compared to the rest of the region. Electron aggregation causes the electron clouds around the Fe atoms to interact, helping to maintain the order and stability of the crystal structure. For the NbN, it can be seen from Figure 2d that there is a red region around the N atom in the center, indicating that there is a concentration of charges in this region. The certain charge accumulation is also storage at the surrounding Nb atoms, while there is a certain blue region between Nb and N. This means that there is a strong interaction between Nb atoms, and that the interaction between Nb-N is weak. It can be seen that the overall distribution between atoms features a certain symmetry, which facilitates the stable existence of the NbN bulk phase to some extent.
The strength of the elastic anisotropy of the material can be expressed by the value of the anisotropy. When the value is equal to 1, the corresponding material presents complete elastic isotropy, otherwise, it corresponds to elastic anisotropy. Simultaneously, the anisotropy value is positively correlated with the degree of elastic anisotropy, with larger values indicating a higher degree of material anisotropy. Table 1 and Figure 3 represent the elastic anisotropy of fcc-Fe and NbN. As shown in Figure 3a, the anisotropic distribution of the Young’s modulus of fcc-Fe is the same in the three-dimensional direction, with the maximum and minimum values of 616.36 GPa and 322.53 GPa, respectively, and an anisotropy value of 1.88, which indicates that there is a relatively small difference in the ability of fcc-Fe to resist tensile or compressive deformation in different directions. As shown in Figure 3e, the maximum and minimum values of Young’s modulus of NbN are 599.25 GPa and 66.63 GPa, respectively, and the anisotropy value is as high as 8.993. The difference in the ability of NbN to resist tensile or compressive deformation in different directions is extremely significant compared to fcc-Fe. From Figure 3b,f, the linear coefficients of fcc-Fe do not exhibit anisotropic behavior in the X, Y, and Z directions, indicating that fcc-Fe is isotropic, whereas the linear coefficients of NbN with the maximum value of 1.28 TPa−1 and the minimum value of 1.16 TPa−1 indicate that the value of anisotropy is close to one. Shear modulus is a measure of the ability of materials to resist shear deformation. From Figure 3c,g, the shear modulus of fcc-Fe displays the same distribution in X, Y, and Z directions, with the maximum, minimum, and anisotropic values of 269.98 GPa, 122.80 GPa, and 2.09, respectively, which shows that there are some differences in the ability of fcc-Fe to resist shear deformation in different directions. Accordingly, the values of NbN are 263.44 GPa, 22.92 GPa, and 11.49, respectively. Compared to fcc-Fe, there is a large difference in the ability of NbN to resist shear deformation in different directions. It can be seen from Figure 3d,g that the distribution of Poisson’s ratio anisotropy of fcc-Fe is relatively complex, with a maximum value of 0.48 and its anisotropy value approaching ∞. Poisson’s ratio of NbN also has an obvious anisotropic distribution, with the maximum and minimum values of 0.88 and 0.02, respectively. Overall, elastic anisotropy is present in both fcc-Fe and NbN; however, the degree of anisotropy in Young’s modulus, shear modulus, and Poisson’s ratio is more significant in NbN than those in fcc-Fe. For the linear coefficients, both exhibit a relatively small difference, and thus display anisotropy.

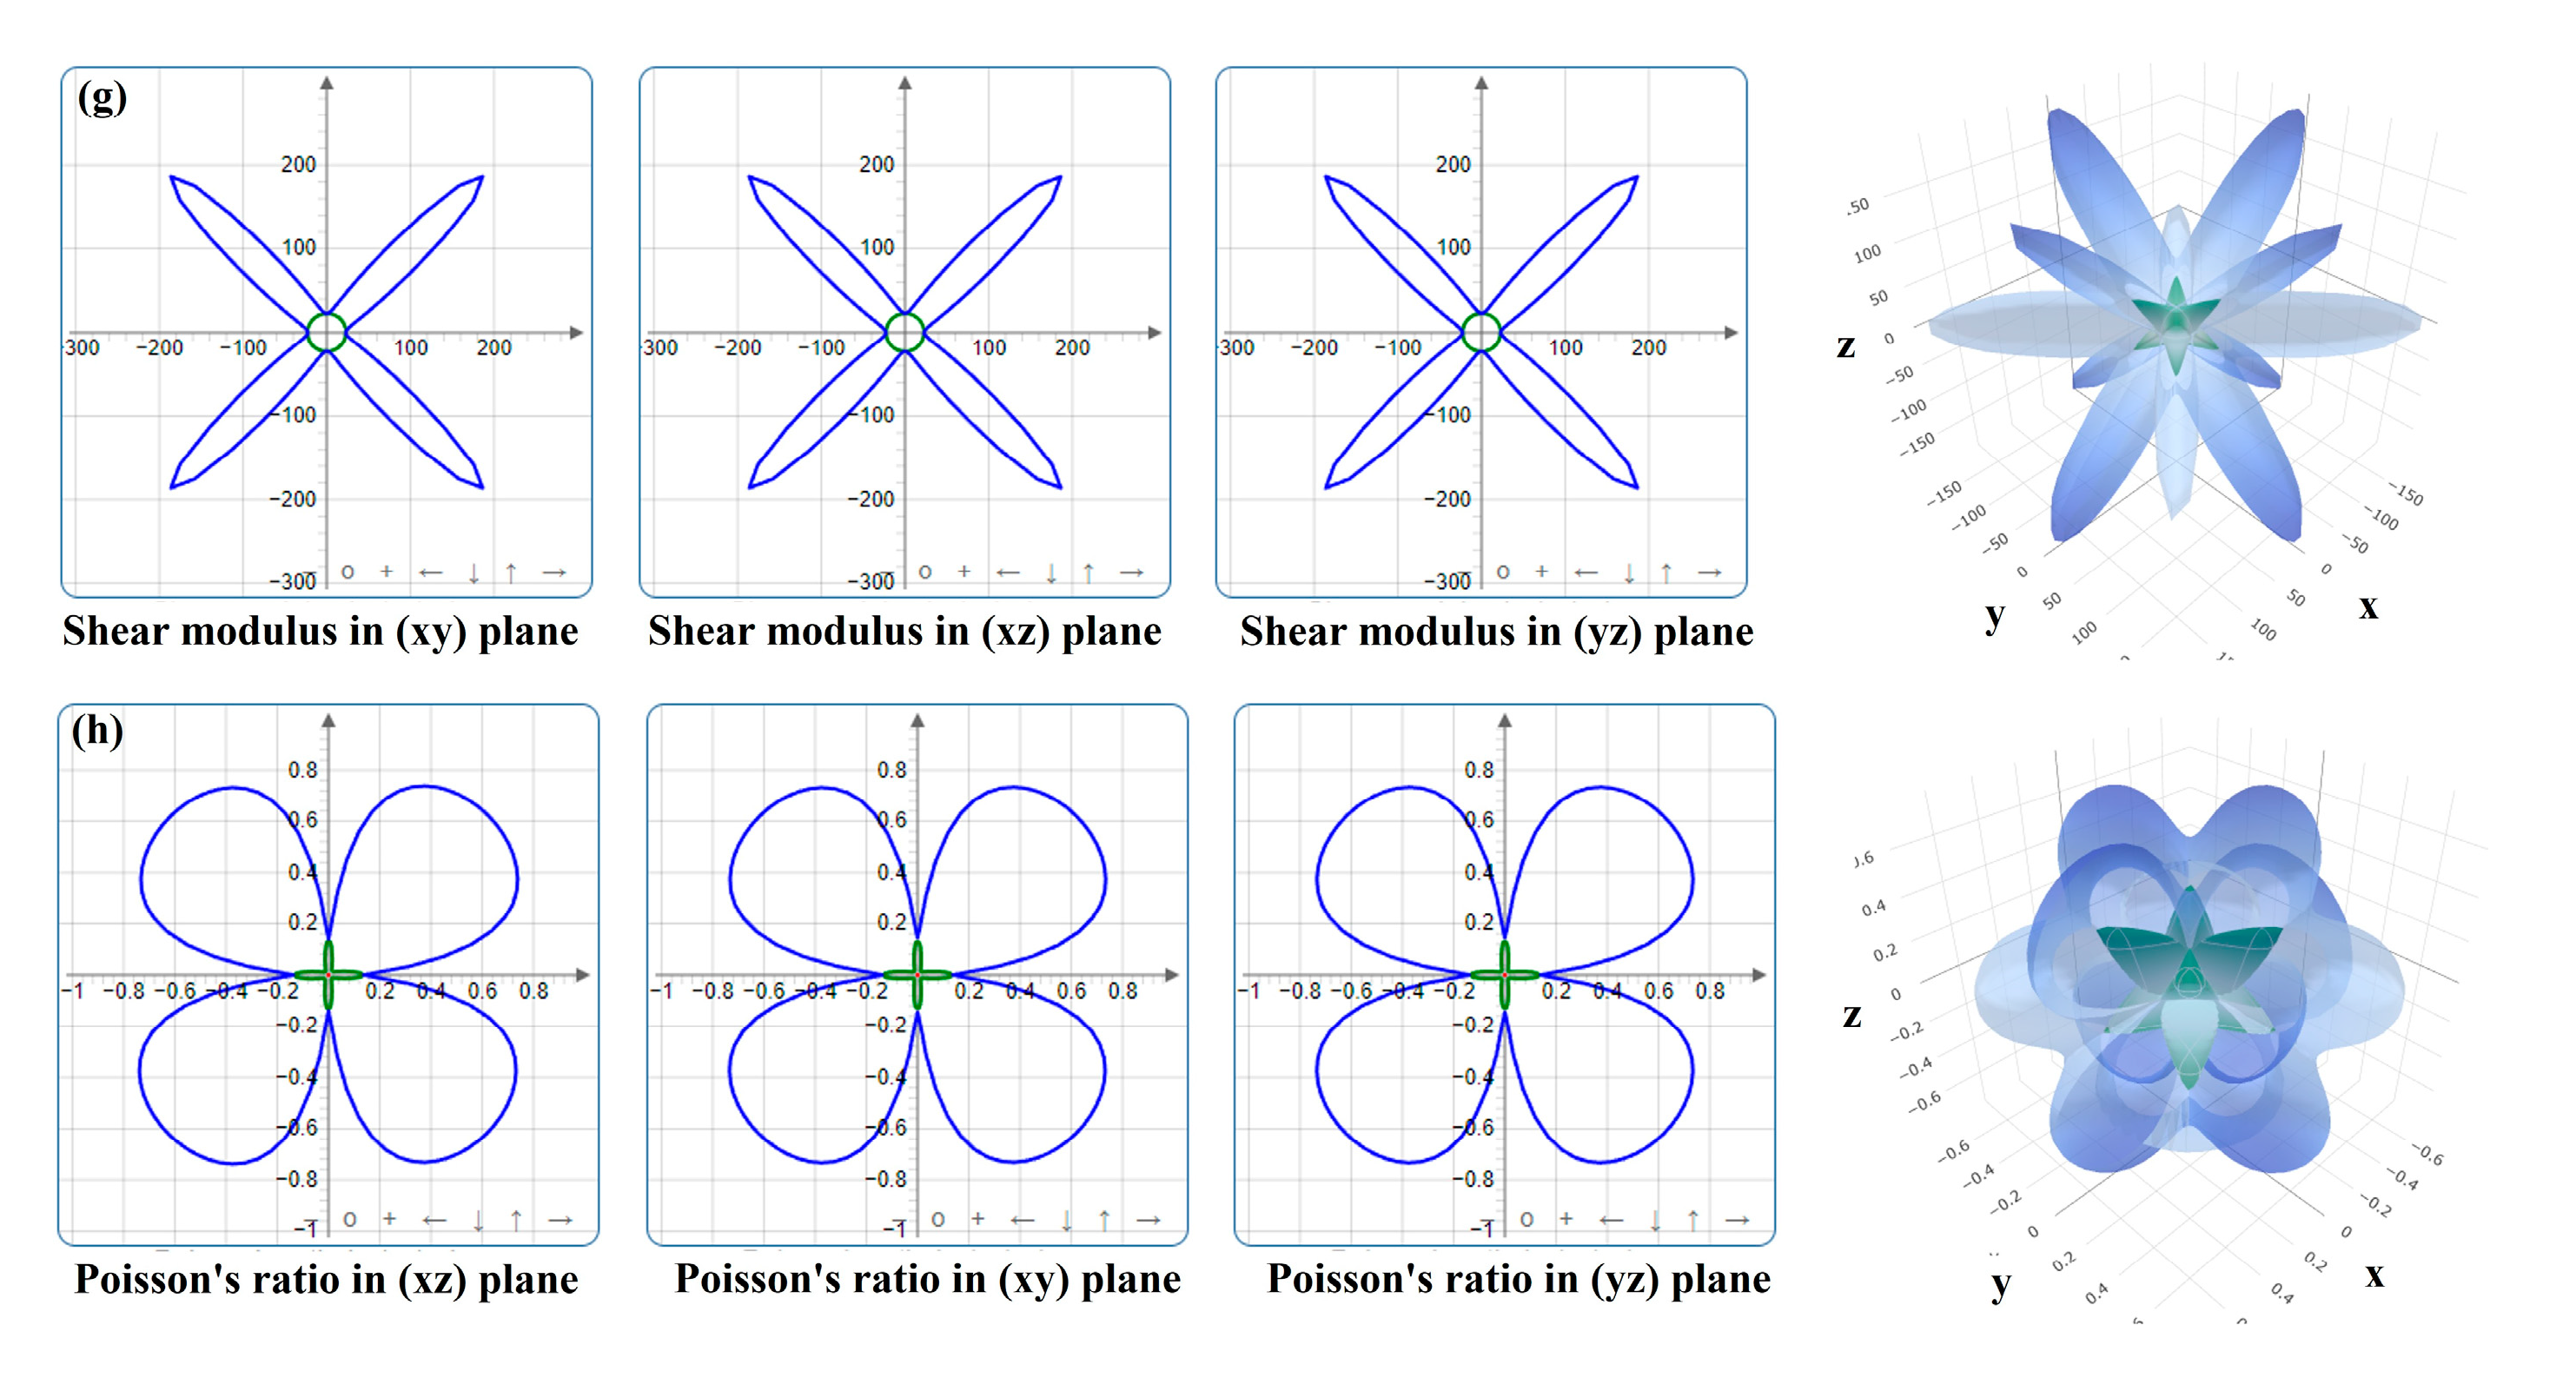
3.2.2. Stretching Property

The effect of stretching on the bulk phases of fcc-Fe and NbN is investigated using tensile tests, i.e., a uniaxial tensile strain δ is introduced along the a-axis direction, which is obtained from Equation (1):
δ = L δ L 0 / L 0
where, L 0 is the a-axis lattice constant of fcc-Fe or NbN crystals, as well as L δ is the a-axis lattice constant when the strain is δ. Figure 4a,b presents the tensile model of fcc-Fe with NbN, i.e., the strain is gradually applied along the a-axis. To eliminate the interference of structural internal stresses during stretching, the a-axis orientation of individual atoms is fixed, and the lattice constants b and c of the model are allowed to undergo free relaxation during the optimization of the fcc-Fe and NbN configurations.

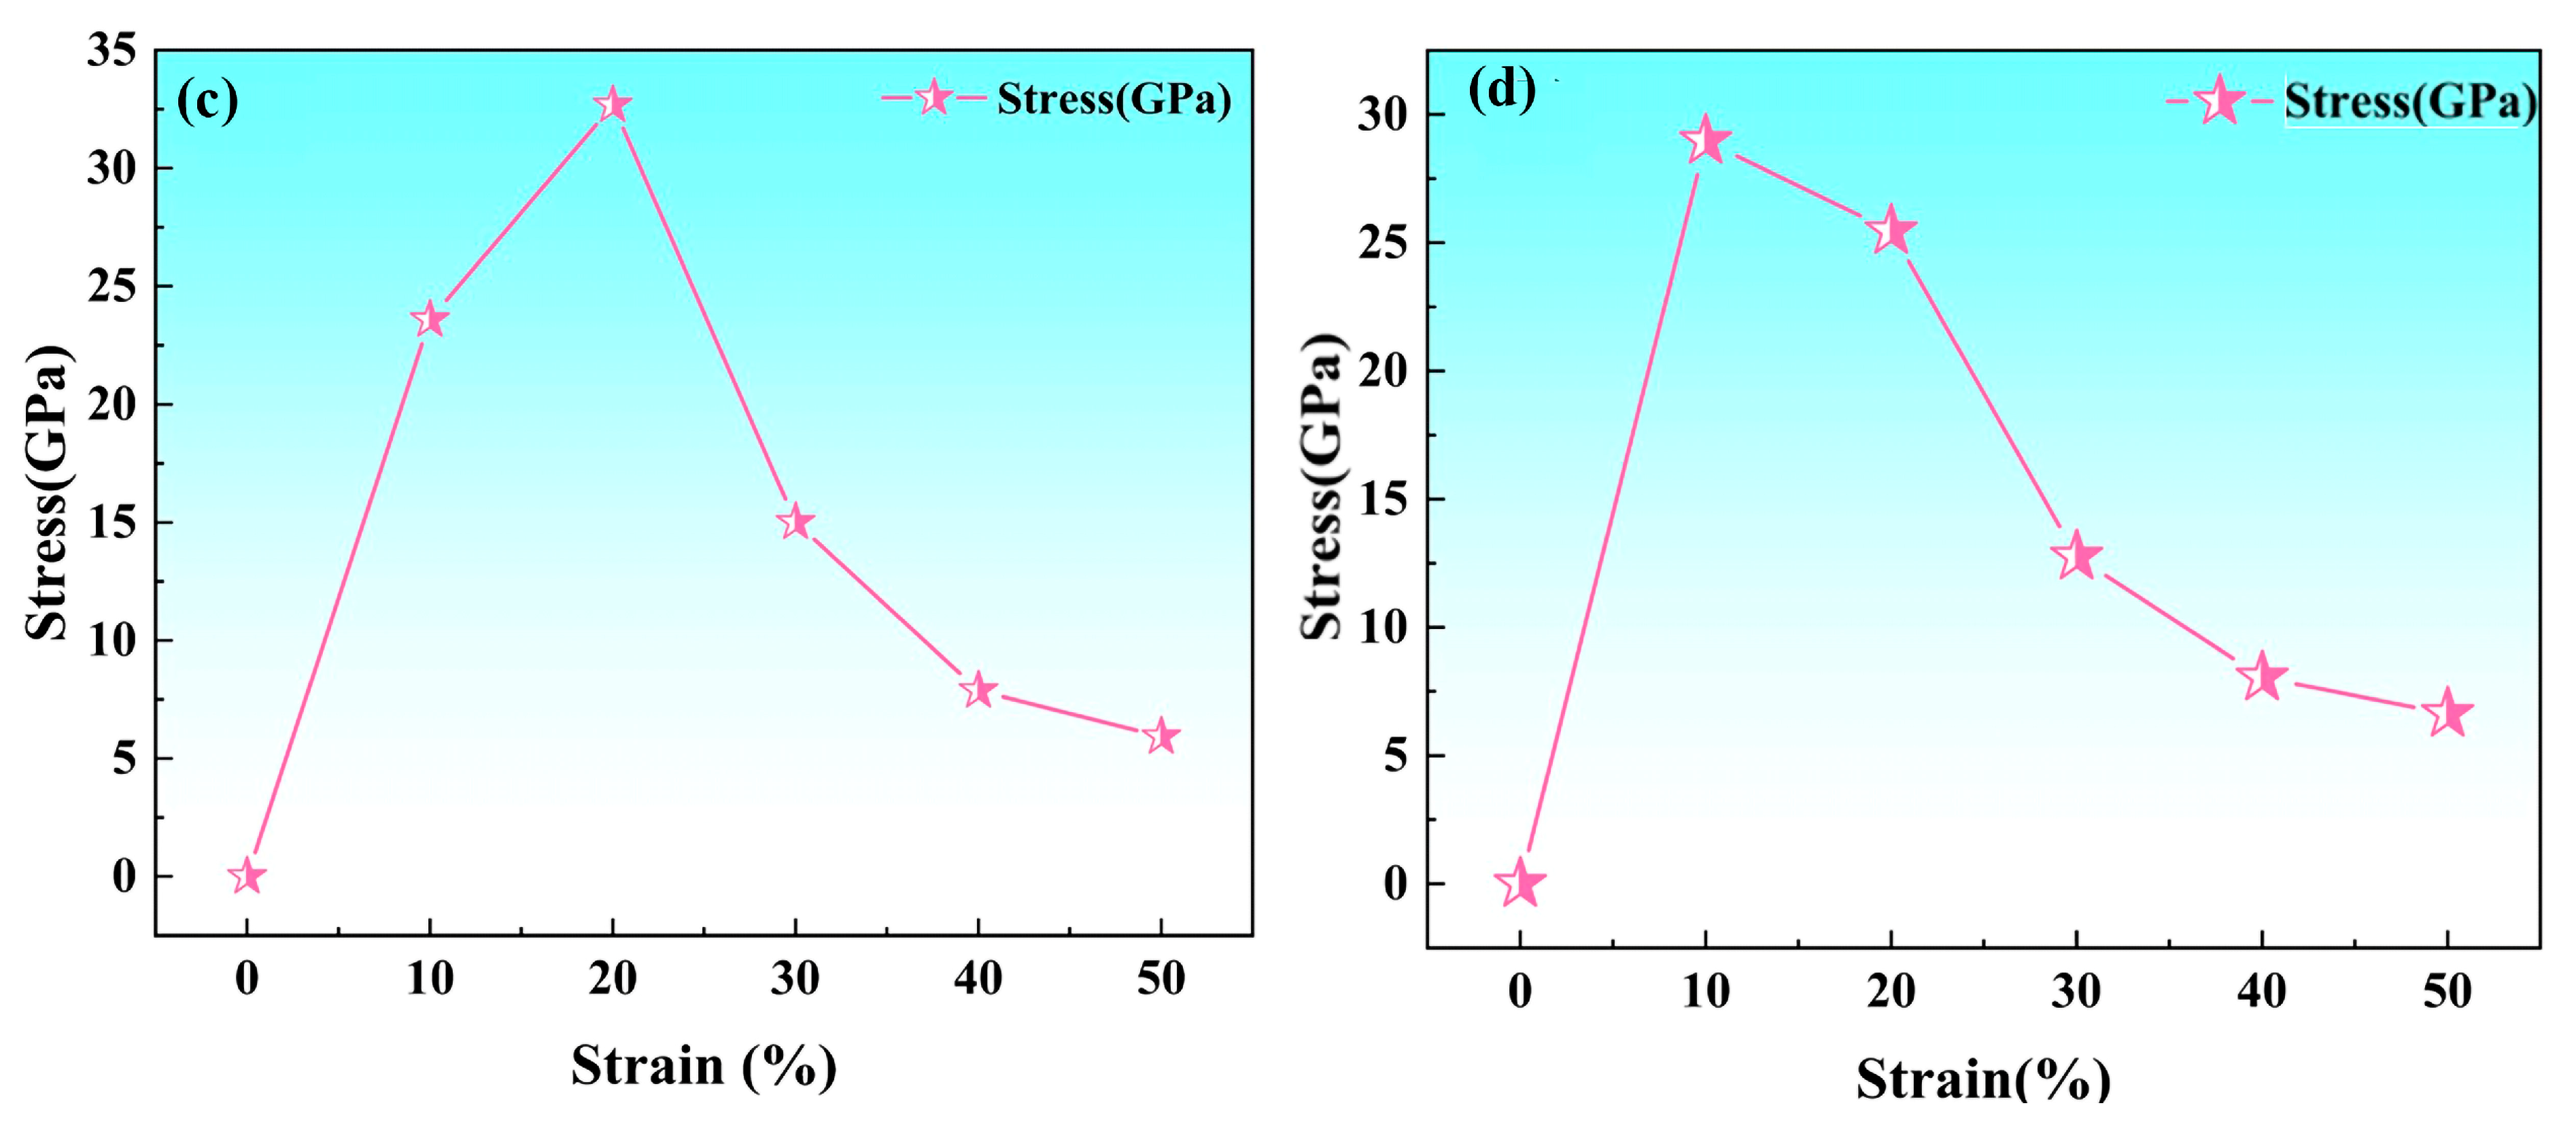
3.2.3. Stress-Strain Relationship

The stress-strain curves for simulated fcc-Fe with NbN bulk phase stretching are displayed in Figure 4c,d. Overall, two different materials offer a degree of resistance to deformation. As seen in Figure 4c, during the stretching of fcc-Fe, the stress change is divided into two stages, and the first stage is when the stress is 0–20%. When the strain is increased from 0% to 10%, the stress increases with the increase of strain and the stress-strain curve increases in a linear relationship. As the strain increases from 10% to 20%, the rate of stress increase slows down although the stress also increases, and it reaches a maximum tensile strength of 32.6 GPa when the strain reaches 20%. The second stage is the decline stage, that is, the strain is located in the 20–50% interval. When the strain continues to increase, the stress gradually decreases, indicating that the ability of the material to carry external forces is gradually destroyed with the destruction of the material structure. From Figure 4d, the stress-strain curve of NbN is similar to that of fcc-Fe, i.e., when the strain increases from 0% to 10%, the stress increases rapidly and reaches the maximum tensile strength of 29 GPa at 10%. The rapid decrease in stress with the increase in strain after the peak stress is reached indicates that NbN has poor plasticity, and it is difficult to carry out plastic deformation between its internal atoms through deformation mechanisms.

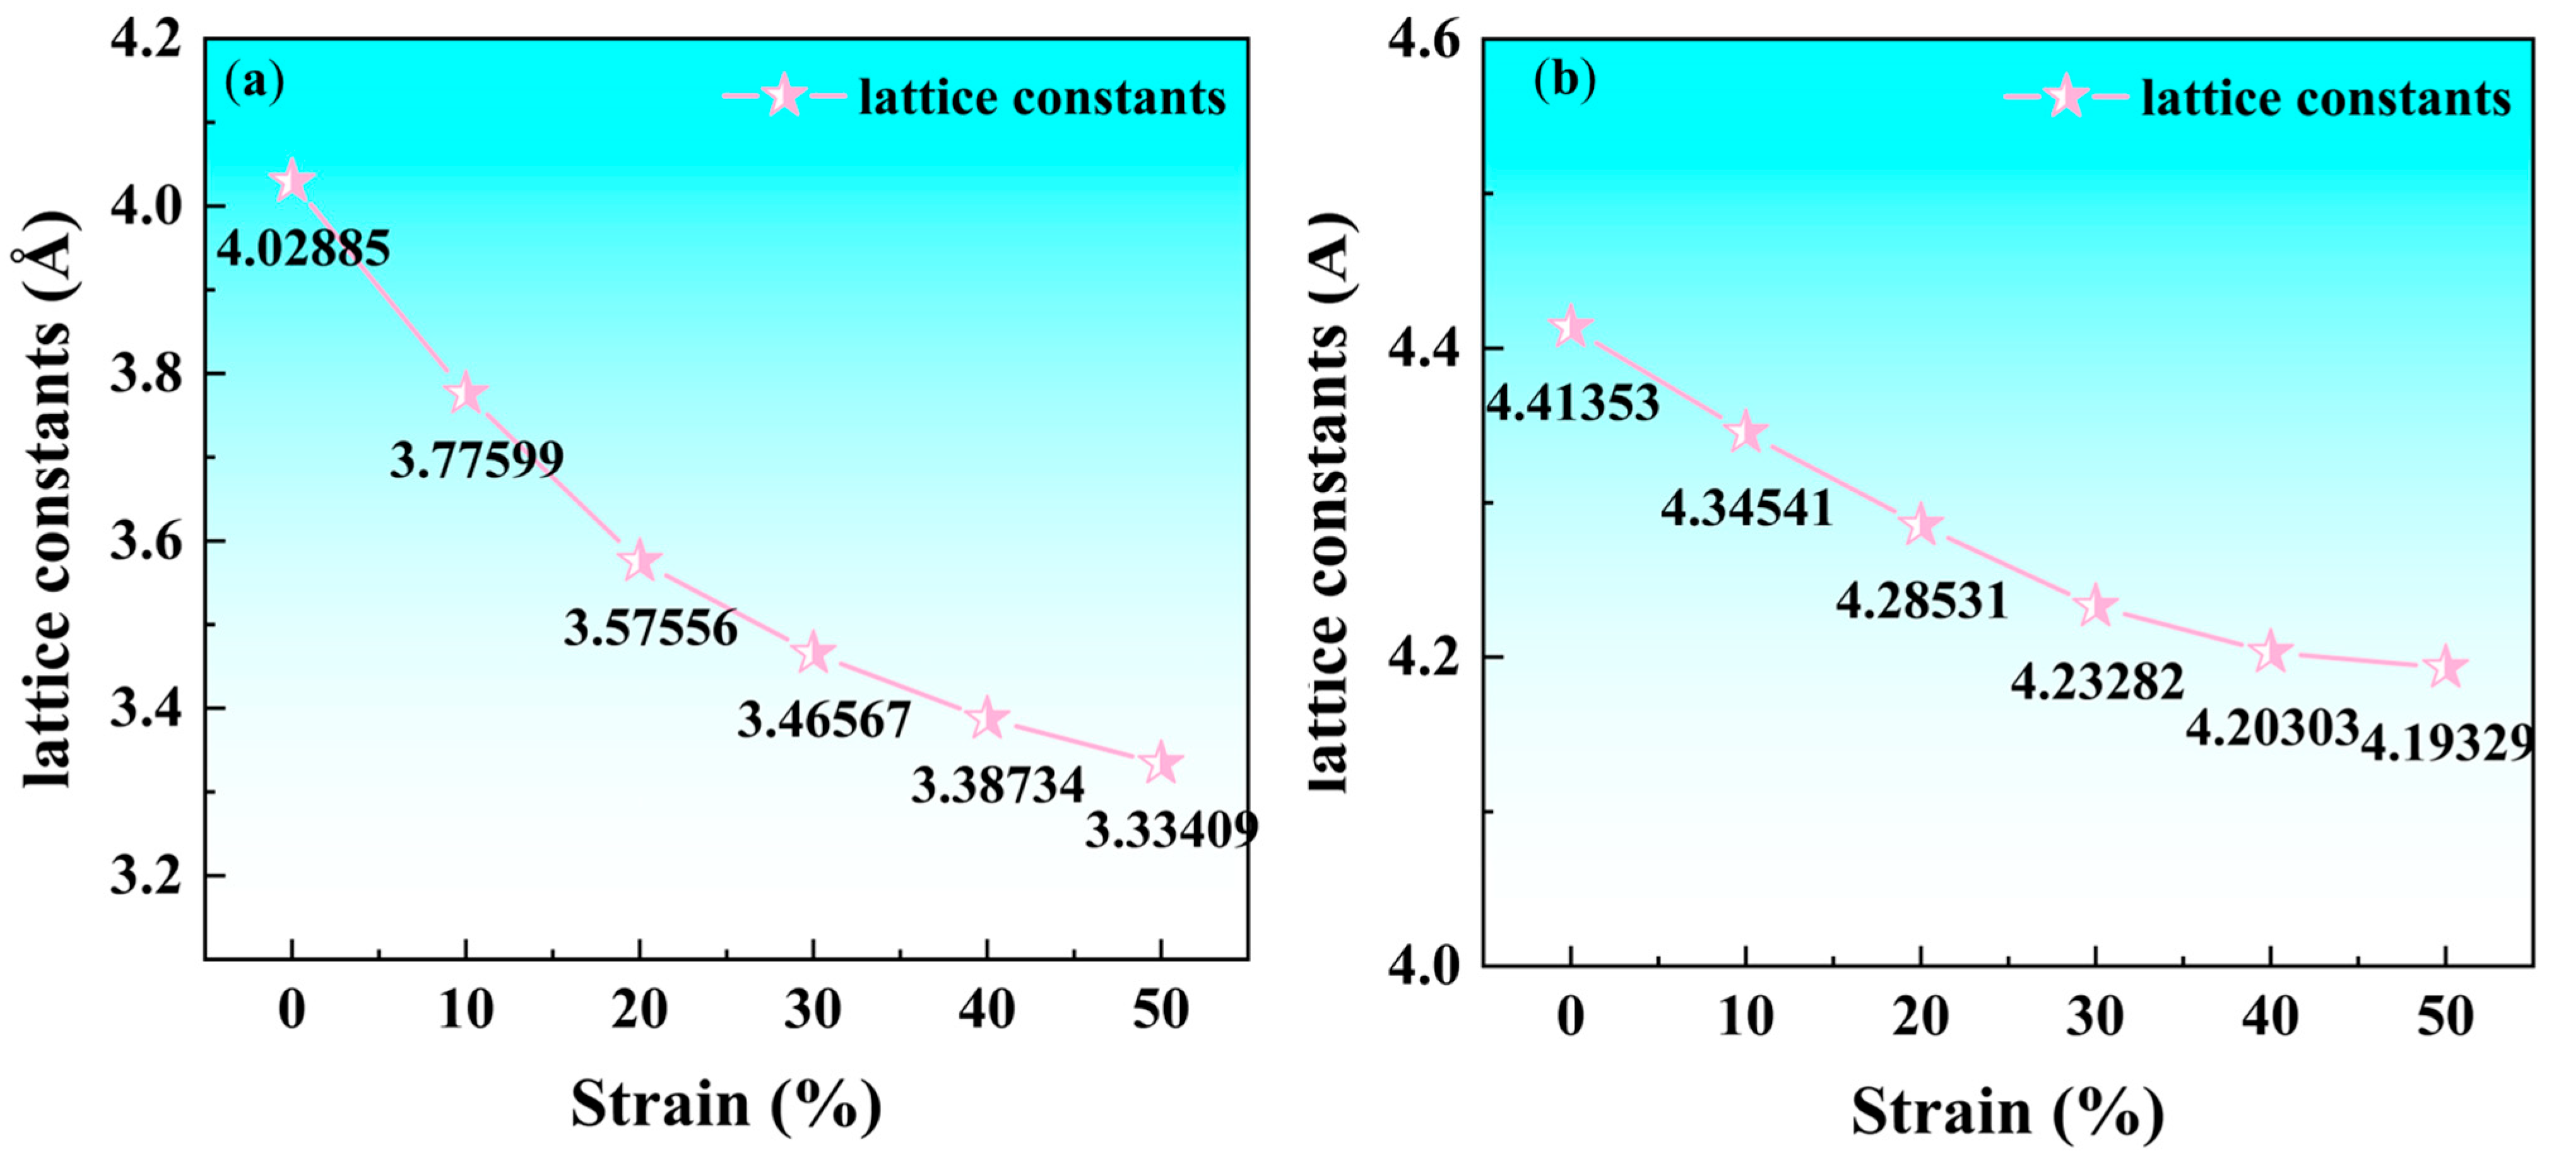
3.2.4. Lattice Constant

Figure 5 shows the lattice constant (b,c) changes of fcc-Fe and NbN bulk phases. From Figure 5a, the lattice constant of fcc-Fe is 4.029 Å at a strain of 0%. The lattice constants (b,c) tend to decrease continuously as the strain increases from 0% to 50%, and the lattice constant decreases to 3.334 Å when the strain reaches 50%. This indicates a continuous reduction of the atomic spacing in the fcc-Fe bulk phase as the external tensile strain increases. This may be explained by the fact that during the stretching process, the atoms inside the crystal are subjected to external forces and the equilibrium between the atoms is broken, and the interaction forces between the atoms induce the atoms to rearrange themselves, resulting in a decrease in the lattice constants, which is responsible for the disruption of the fcc-Fe structural model to a certain extent. It can be observed from Figure 5b that the lattice constant of NbN is 4.414 Å at the initial state (strain of 0%), and the lattice constants (b,c) likewise continue to decrease during the increase in strain from 0% to 50%; the lattice constant becomes 4.193 Å at 50% strain. Similar to fcc-Fe, the NbN lattice constant decreases with increasing strain, indicating that the positions of the atoms within the NbN crystal are changed and the interatomic distances are shortened under tensile strain. Comparing the both initial lattice constants, the initial lattice constant of the latter is larger than that of the former, and the decrease degree of the lattice constant of NbN under 50% strain is slightly smaller than that of fcc-Fe, which indicates that under external force, the internal atomic forces within NbN are relatively strong, and its ability to resist deformation is also relatively high.

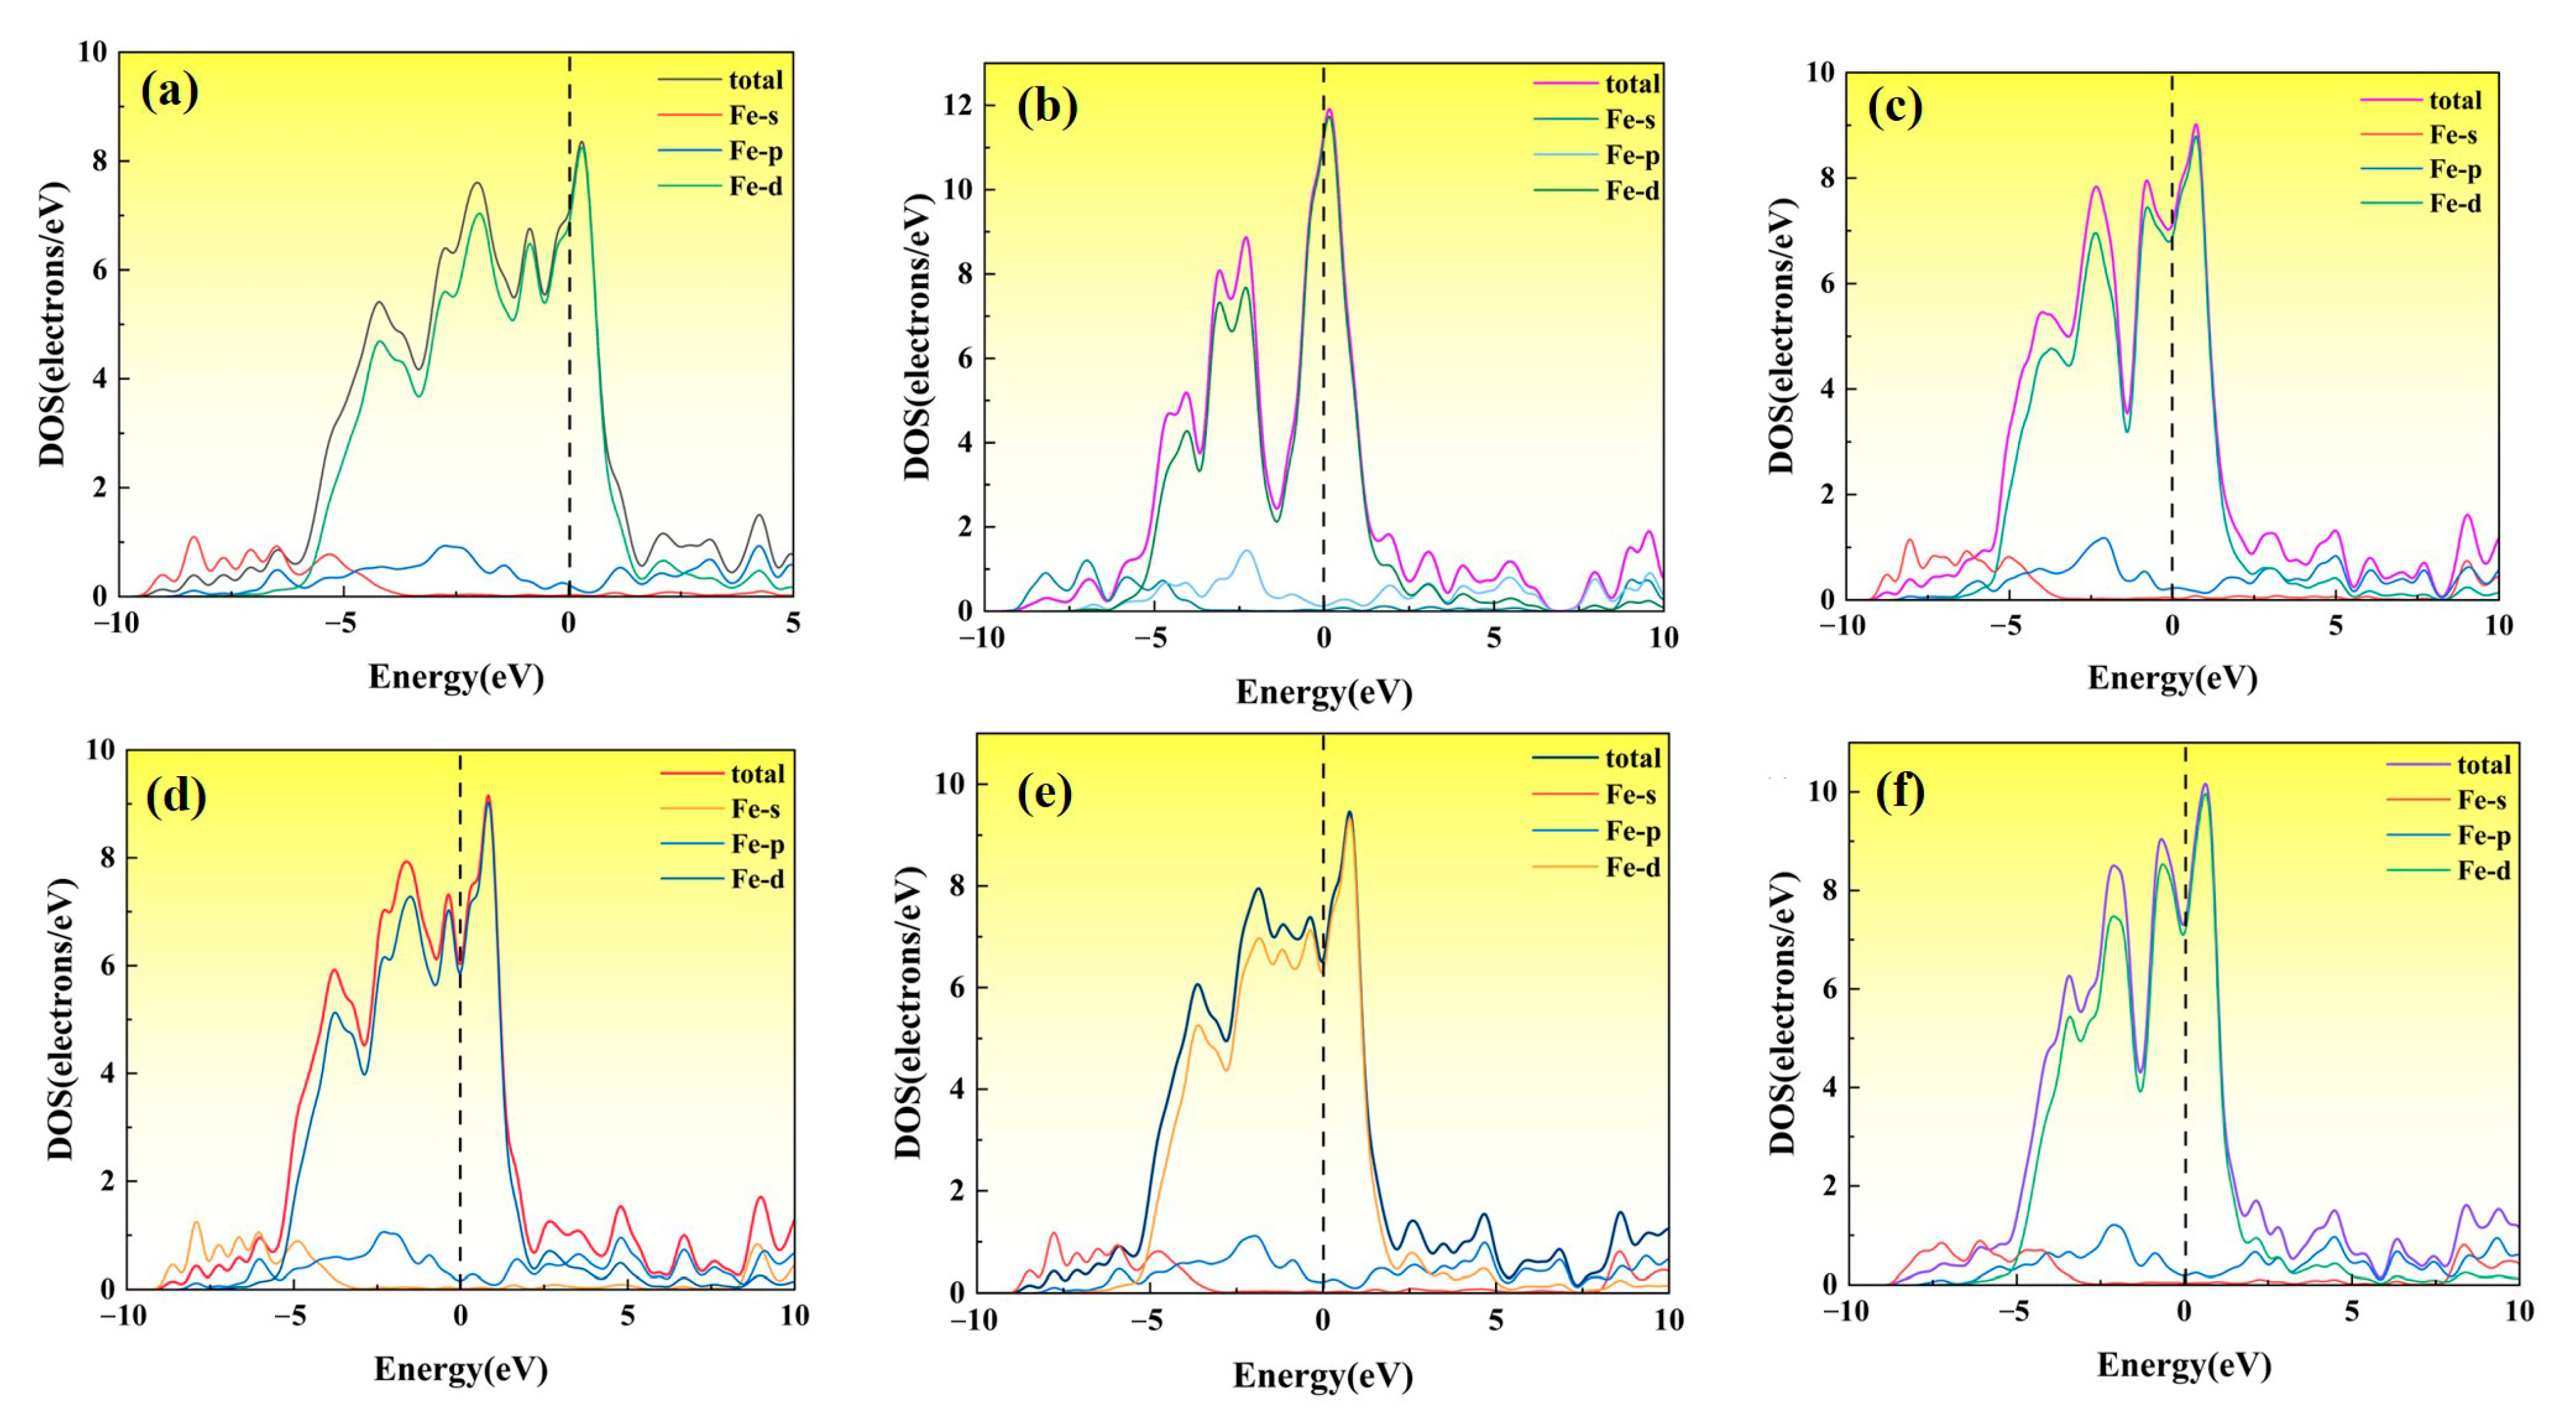
3.2.5. Density of States Under Strain

Figure 6 illustrates the density of states of the fcc-Fe bulk phase with different tensile strains applied, i.e., 0%, 10%, 20%, 30%, 40%, and 50%, and the black vertical dashed lines represent the Fermi levels. It can be seen that the density of states at the Fermi level increases significantly when the strain is increased from 0% to 10%. In the energy range of 0–5 eV, the change of the shape, the position, and the peak strength by tensile stress is negligible. Whereas near the Fermi energy level, the strength of the bonding peaks decreases significantly around −2 eV, implying a weakening of the bonding strength between the atoms of the fcc-Fe bulk phase. When the strain is increased to 20%, compared with the initial state, the density of states at the Fermi energy level changes less, yet the bonding peaks near the Fermi energy level are gradually shifted to the right, and at the same time the pseudo-energy gaps on both sides of the Fermi energy level show a tendency to narrow gradually. This reveals that the tensile behavior can have a significant effect on the interactions between the atoms in the model structure, which in turn leads to a decrease in the stability of the bulk phase. A certain change in the density of states occurs when the strain is continuously increased up to 30%, while the bonding peak near the Fermi energy level is flatter when the strain is then increased up to 40%. When the strain is increased to 50%, the bonding peak decreases slightly in the −5 eV to 0 eV energy range, indicating a decrease in the bonding strength between the Fe atoms. It can also be seen that the total density of states near the Fermi energy level is still mainly contributed by the d-orbitals of Fe atoms, regardless of the applied strain.
The density of states of NbN at strains of 0%, 10%, 20%, 30%, 40%, and 50% is shown in Figure 7. The pseudo energy gap refers to two peaks on both sides of the Fermi level, and the DOS between the two peaks is not zero, which directly reflects the strength of the bond covalence of the system. The wider the pseudo energy gap, the stronger the covalent interaction between the bonds and the more stable the matrix. When the tensile strain gradually increases, the peaks gradually move to the left and the pseudo energy gap becomes narrower, i.e., the covalent interaction between the bonds decreases, and the internal structure of the NbN crystals is damaged to some extent. Compared with the state density at the strain of 0%, the state density at the Fermi level increases when the strain is 10%. Meanwhile, the bonding peak tends to stabilize in the energy range of 2.5–5 eV, and the intensity of the bonding peak at −6 eV increases significantly, which indicates that the stability of NbN is affected. The peak at the Fermi energy level increases when the strain is increased to 30% and this also occurs at −2 eV of about 11.5 eV. A new bonding peak appears near the Fermi level when the strain increases to 40%. It is also found that the densities of states in different orbitals overlap to a certain extent, and the total density of states in the energy range from −10 eV to −4 eV are mainly contributed by the p-orbitals of N atoms, with part contribution from the d orbitals of Nb atoms. While in the range from −2.5 eV to 5 eV, the total density of states is mainly contributed by the d orbitals of Nb atoms. Based on the above, the intensity of the peaks out of the Fermi level changed while the position of the bonding peaks shifted, verifying that the structural stability of fcc-Fe and NbN is affected under strain. Corresponding to the previous stress-strain curves and changes in lattice constants, i.e., with the increase in strain, the lattice constant a gradually increases, while b,c gradually decreases. The interatomic distance changes with the increase of strain, and the interaction of the electrons outside the nucleus changes accordingly, which is manifested in the overlap of the density of states, the intensity evolution of the bonding peaks, and the change of the peak position.

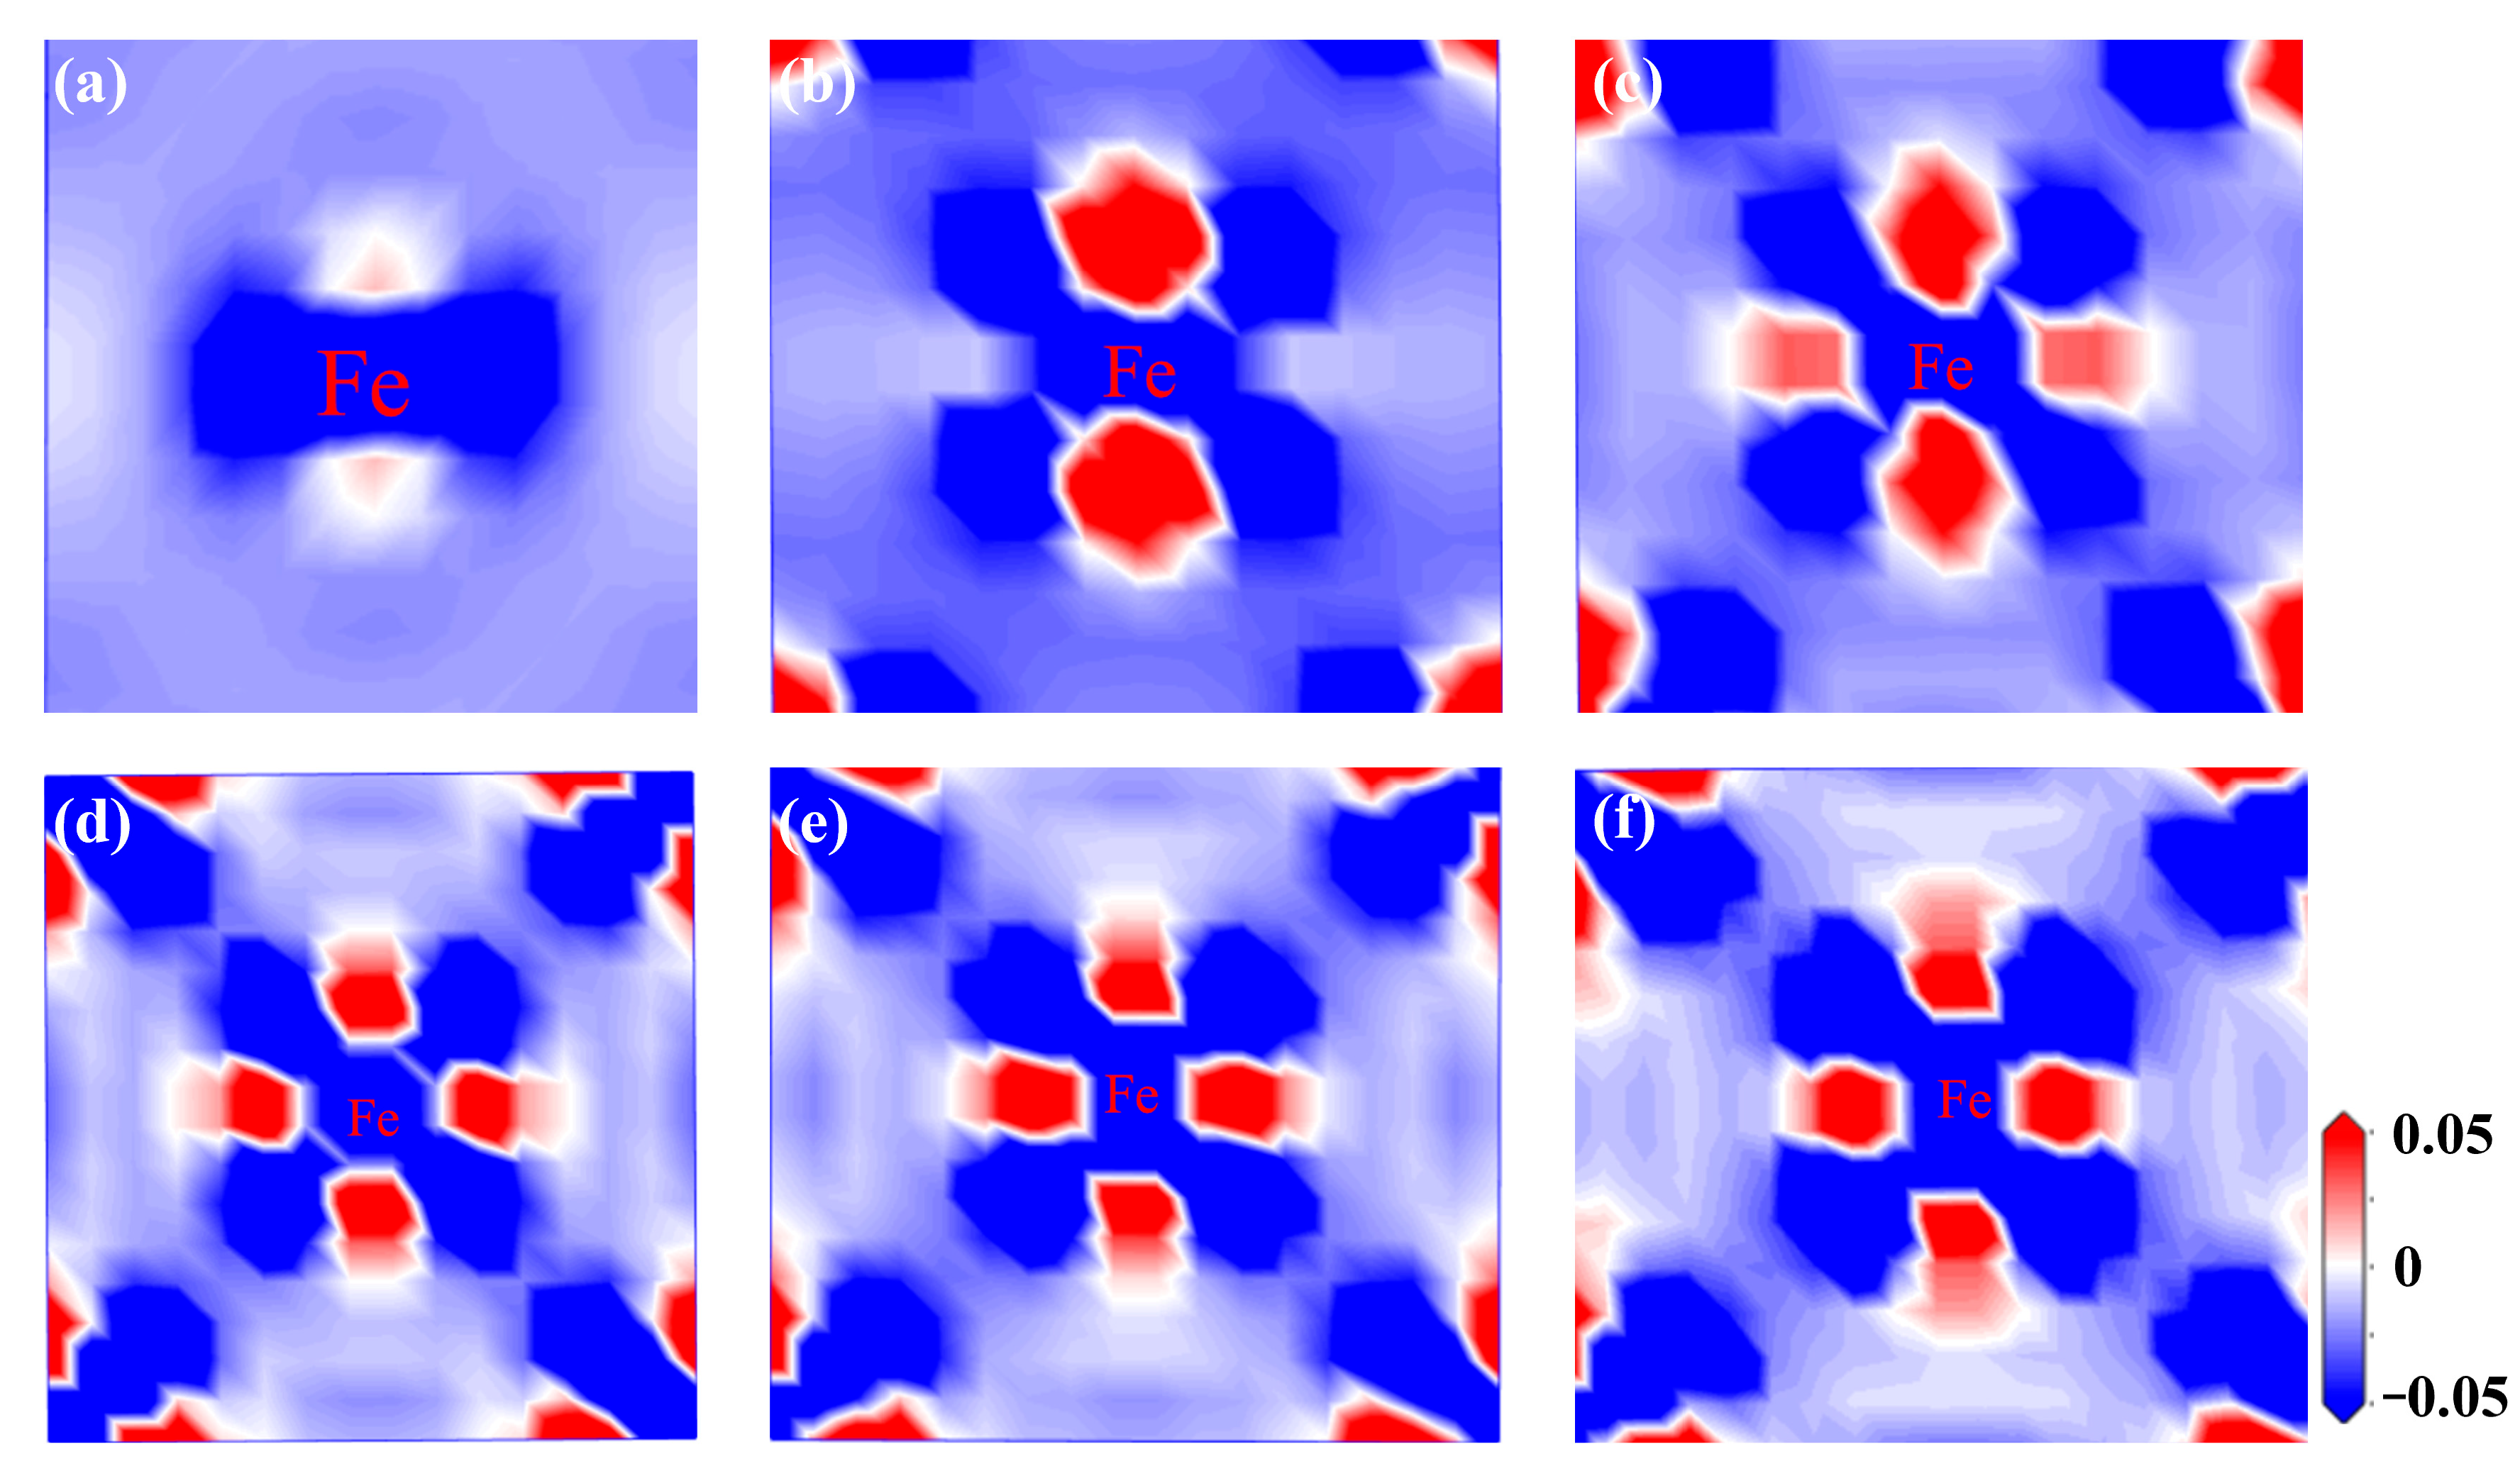
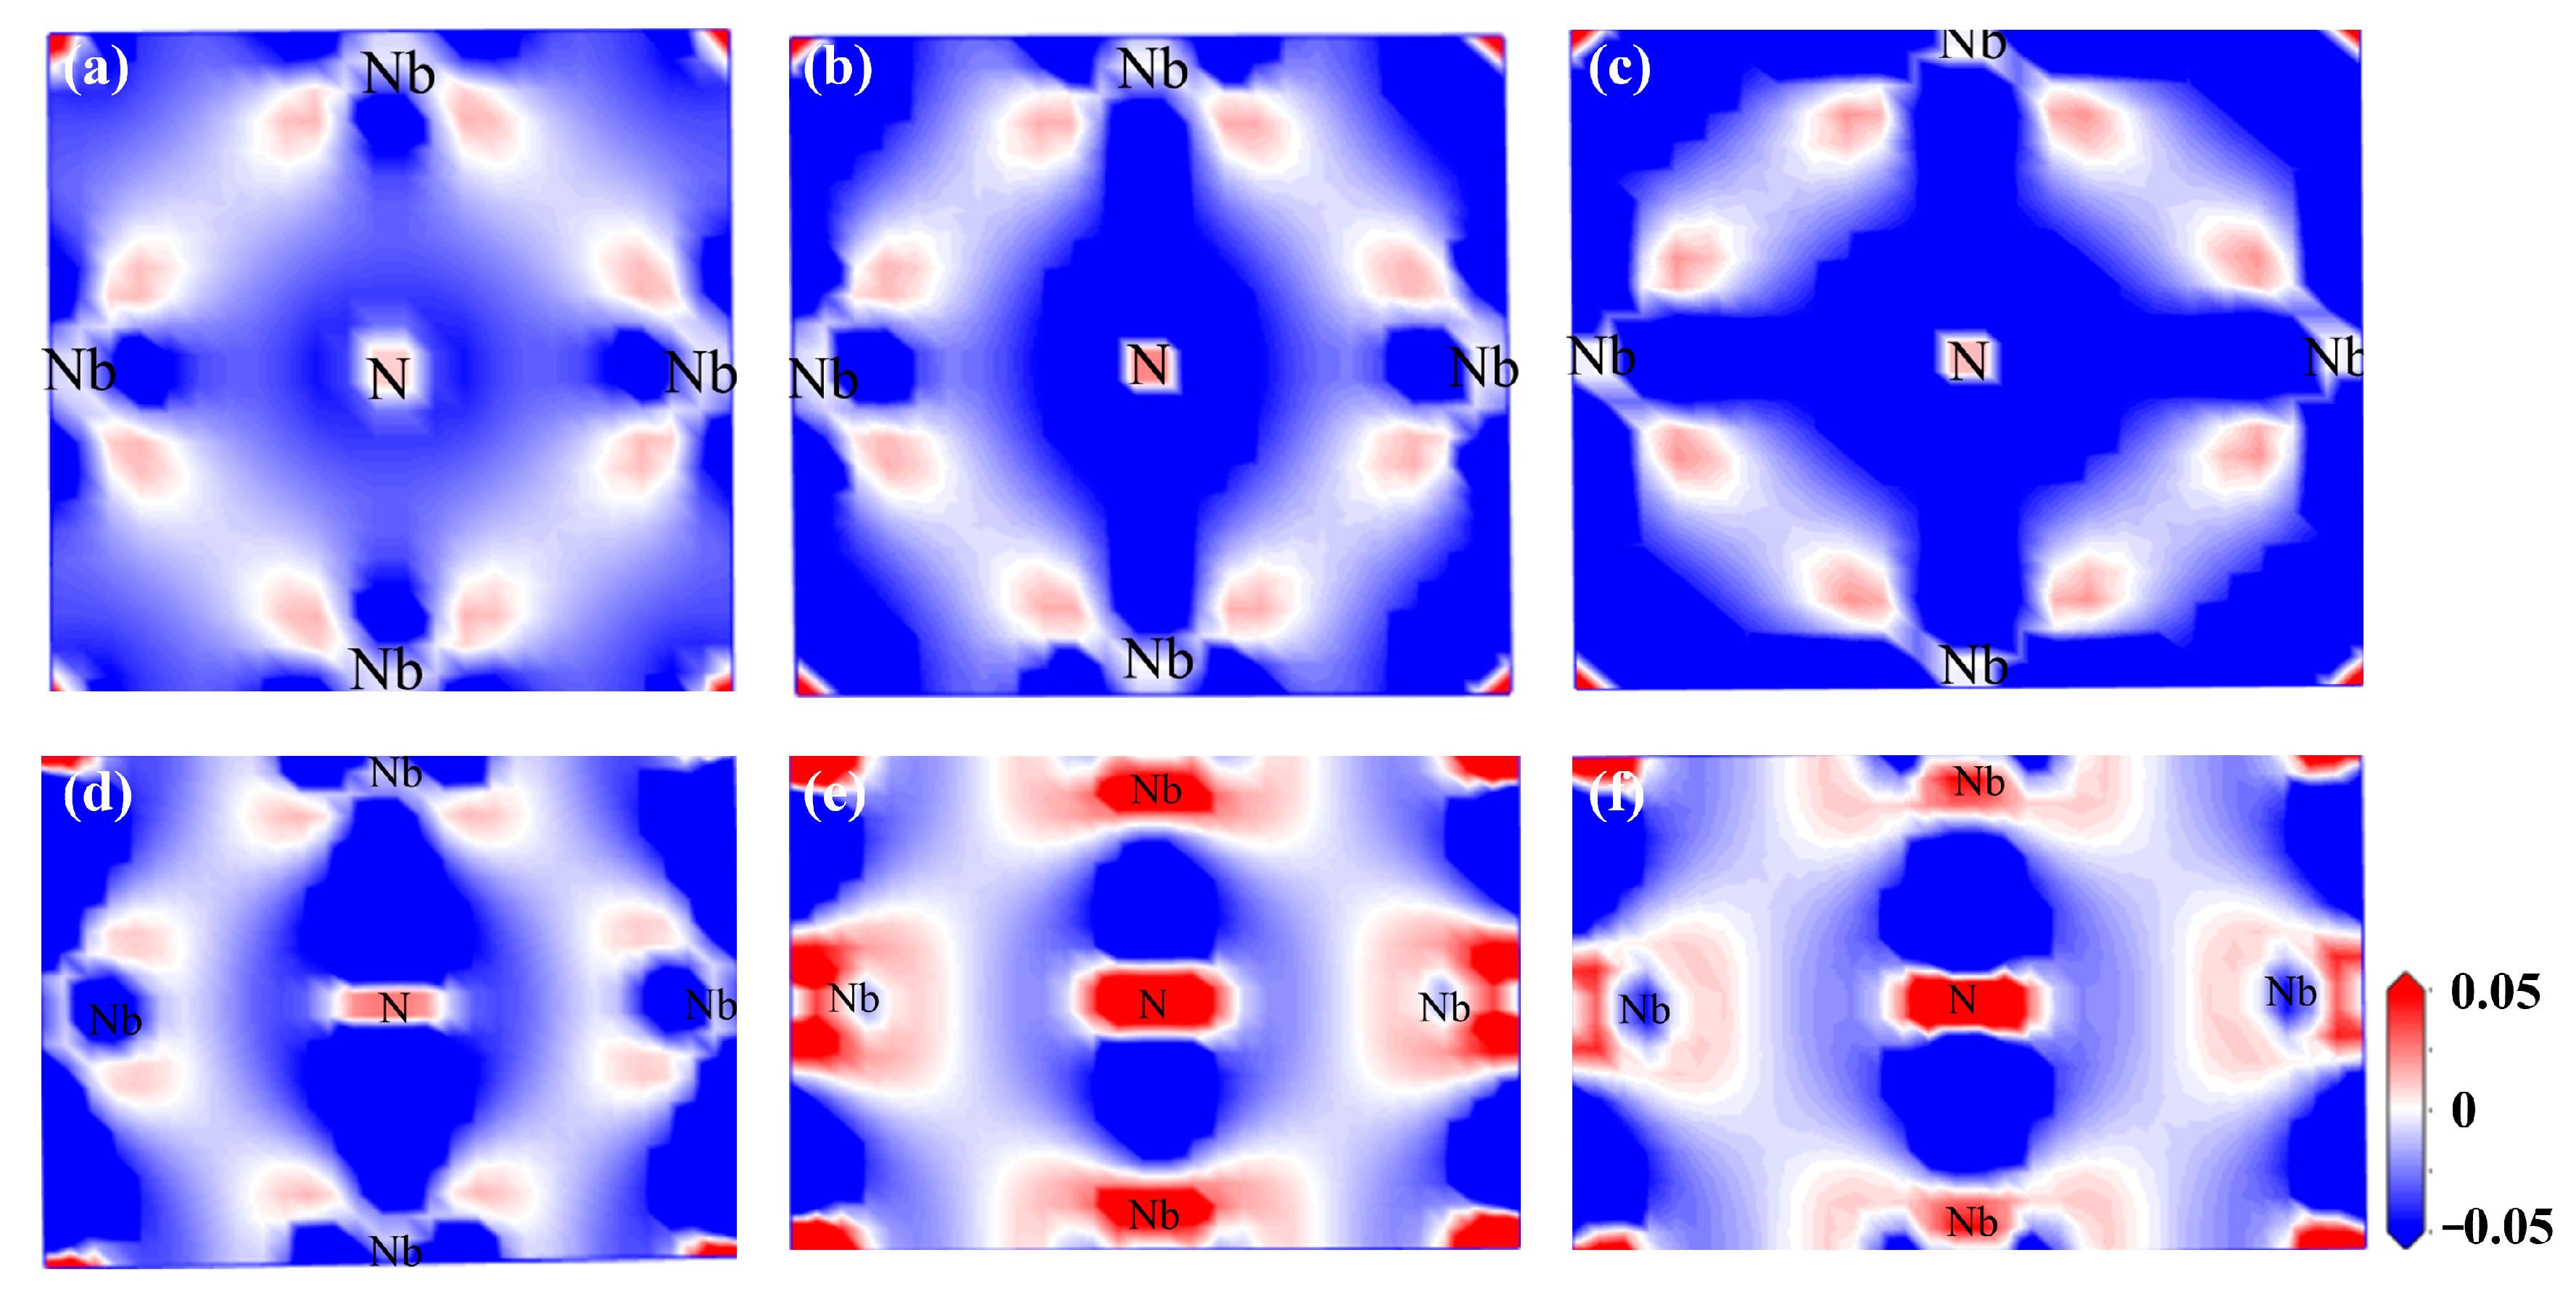
3.2.6. Differential Charge Density Under Strain

To better emphasize the effect of stretching on the fcc-Fe and NbN bulk phases, differential charge analysis was carried out, and it may provide a clear view of the charge transfer in the system. Figure 8 represents the differential charge density of fcc-Fe at different strains. The electron cloud distribution in fcc-Fe when unstrained follows its original chemical bonding and electron orbital properties, which corresponds to the strongest interatomic bonding. When the strain is increased to 10%, it can be observed that the charge distribution starts to change and there are some new red and blue regions, indicating that the atomic arrangement is adjusted accordingly and the electron cloud is redistributed after applying a strain of 10%. Moreover, the increase in charge density in certain regions (deepening or widening of the red color) and the decrease in others (deepening or widening of the blue color) suggests an increase in the inhomogeneity of the electron distribution, attributed to the changes in interatomic distances and interactions due to strains, which in turn affects the distribution of the electron cloud. As the strain increases further to 20%, the change in charge distribution becomes more pronounced, with large changes in the shape and extent of the red and blue regions. Further redistribution of the electron cloud inside the crystal shows that the Fe interatomic bonding starts to decrease with the gradual increase in stretching, leading to a decrease in the crystal stability of fcc-Fe. The complexity of the charge distribution is further increased at 30% strain, where more dispersed red and blue regions can be observed, indicating that the distribution of the electron cloud becomes more inhomogeneous. By now, the crystal structure may have become more deformed and the interactions between the atoms have become more complex. When the strain reaches 40–50%, the trend of the charge distribution gradually tends to stabilize, which indicates that the internal structure of the crystal is in a relatively stable state under high strain, and this trend is consistent with the results of the stress-strain curve.
Figure 9 demonstrates the differential charge density of the NbN crystal structure at different strains. As can be seen from Figure 9a, the electron separation (blue) and aggregation (red) distributions are relatively more symmetrical in the absence of applied stress. The small red region around the central N atom indicates that the electron aggregation degree around the N atom is low at this time, reflecting that the electron distribution in the NbN crystal is in a relatively balanced state, with major covalent bond characteristics accompanying a slight ion bond feature. Compared with Figure 9a, a certain degree of enlargement of the red region around the central N and Nb atoms is observed at a stress of 10%, and the electron aggregation is enhanced. The distribution of the blue region also changes, indicating that the internal structure in the NbN crystal has been affected by the strain. The red and blue regions in the differential charge density change less when the strain is 20–30%. When the strain increases up to 40%, the red region increases dramatically and occupies a large proportion of almost the entire crystal structure, with a high degree of electron aggregation. The red area around the N and Nb atoms is increased, and the blue area is smaller, showing a strong electron aggregation phenomenon. The red region is further enhanced when the strain is 50% and the electron aggregation reaches a higher degree, i.e., the charge consumption is reduced. Meanwhile, the electronic distribution state in the crystal structure differs greatly from that at 0% strain, indicating that the high strain makes the covalent interaction between atoms weaker, and the stability of NbN is weaker at this point.

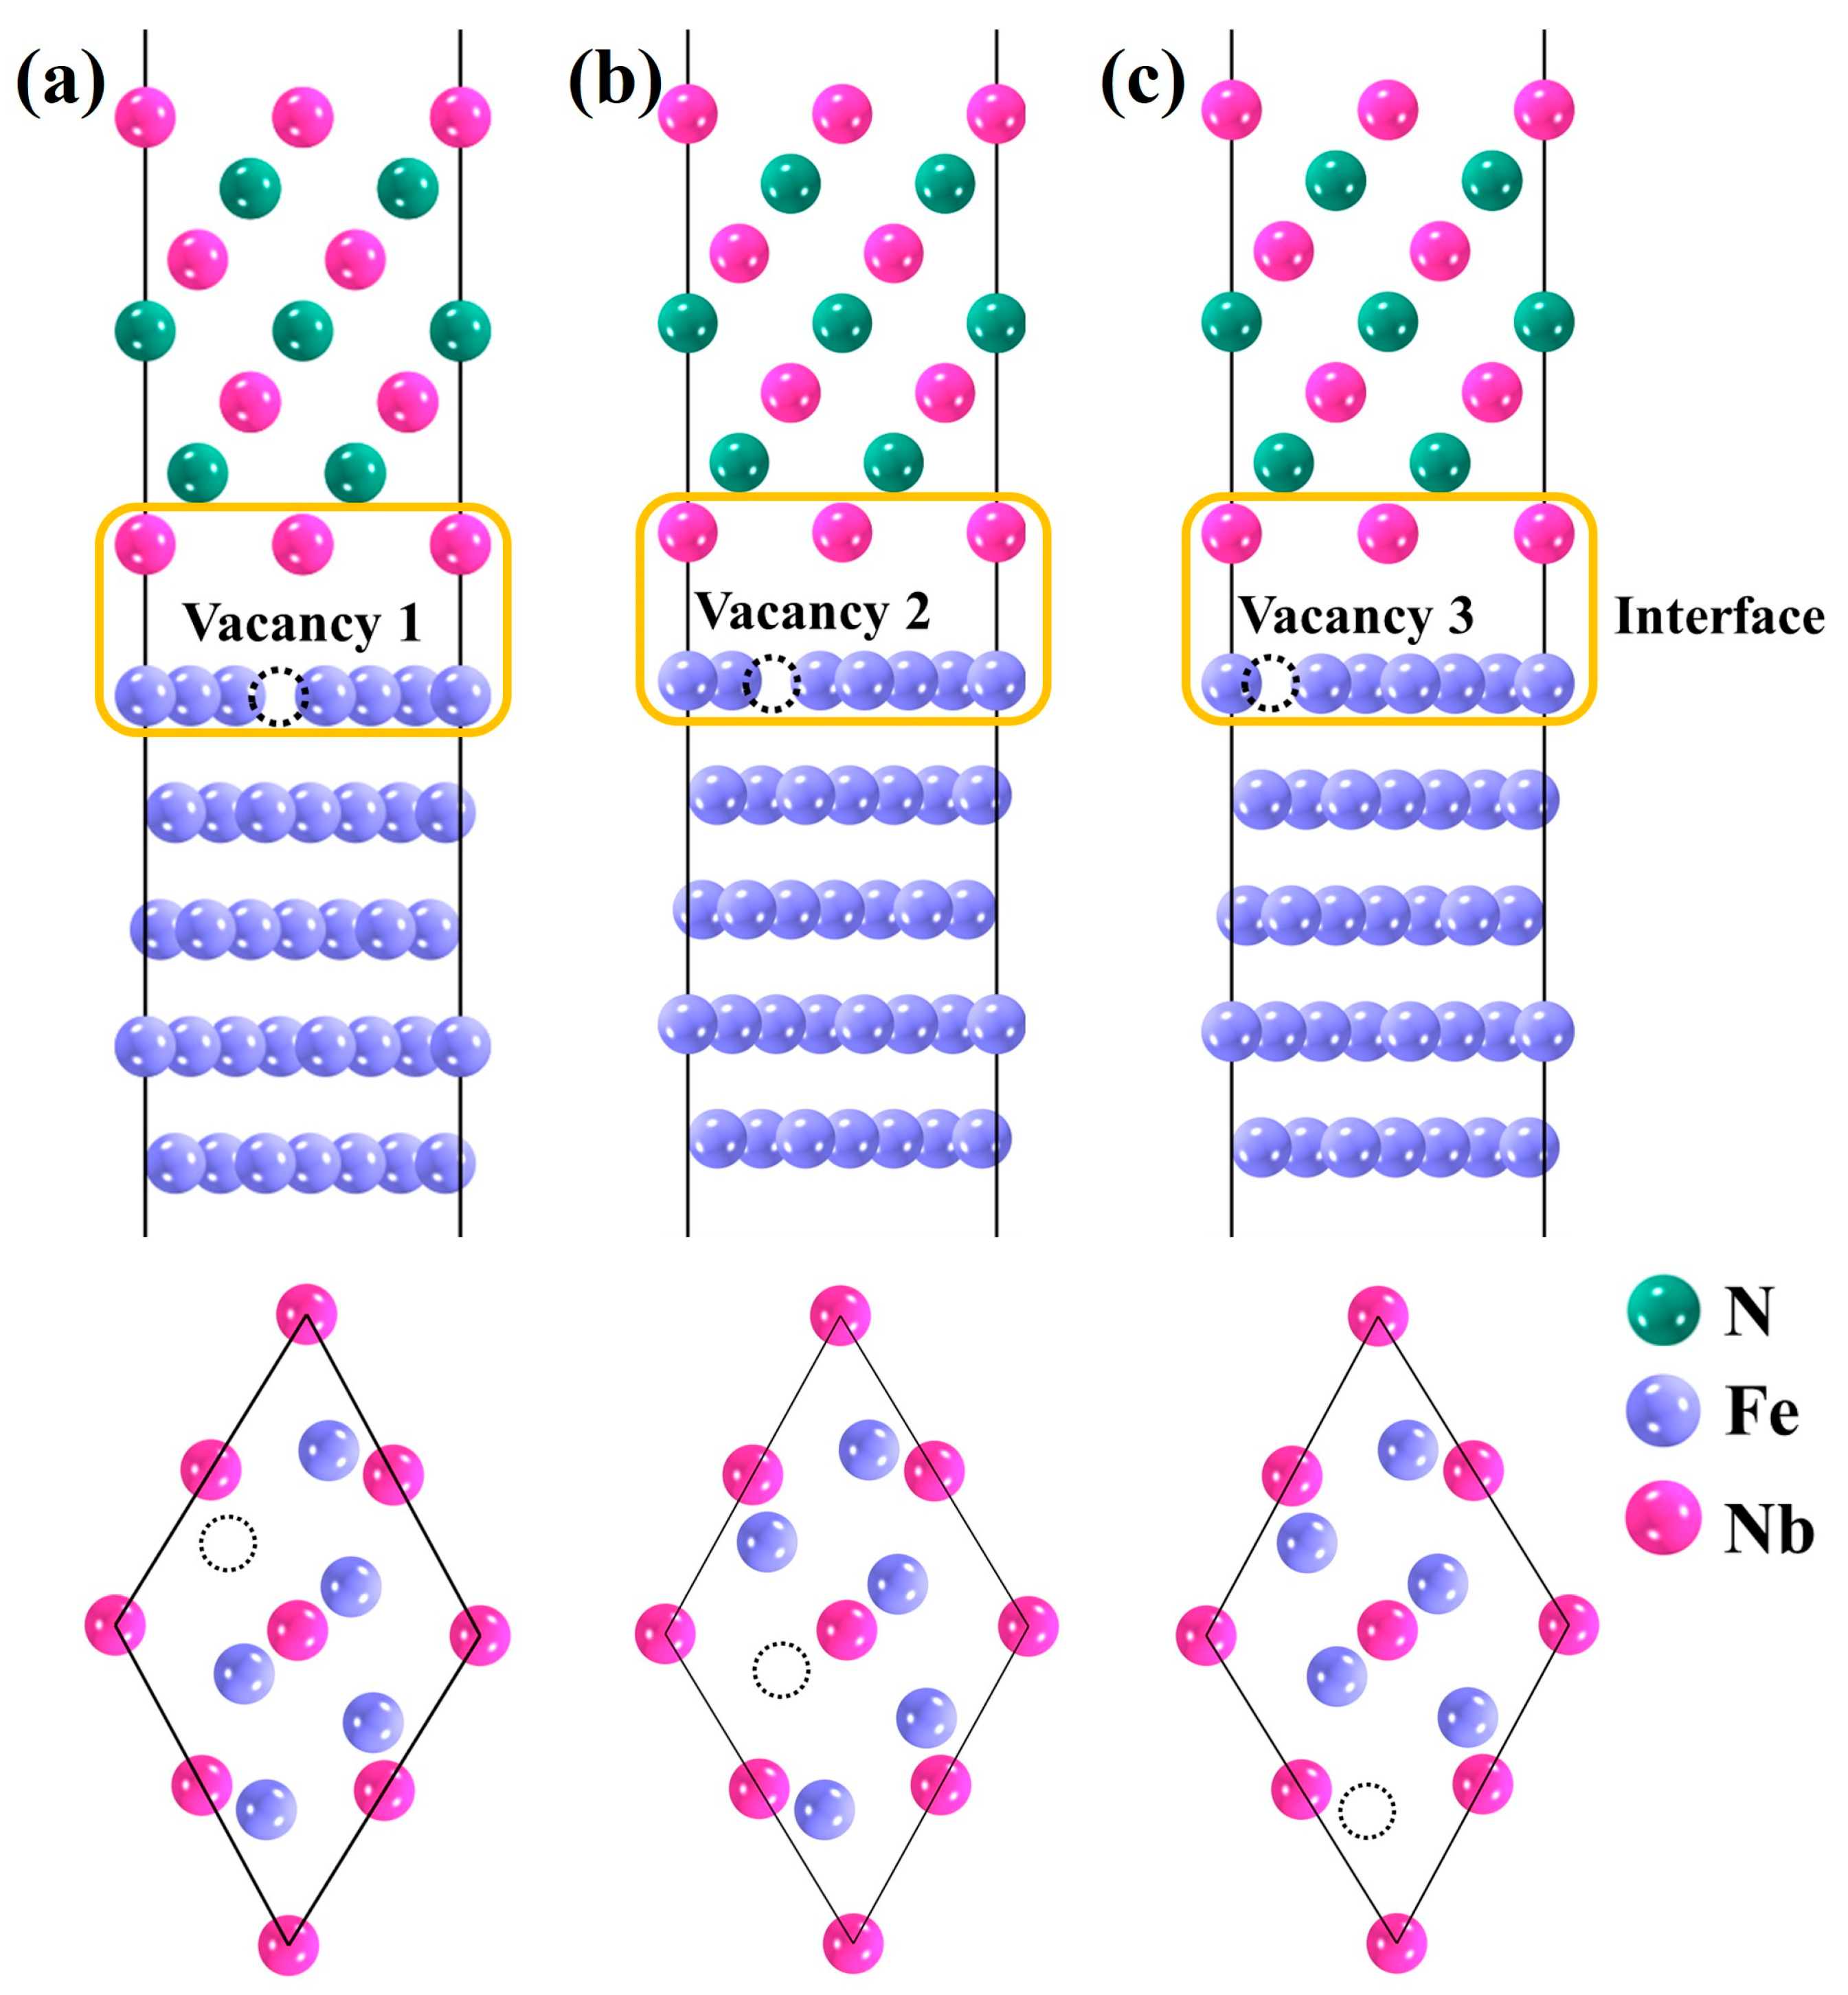
3.3. Defective Fe(111)/NbN(111) Interface Model

To evaluate the optimal occupation sites of vacancies in the interface fcc-Fe(111)/NbN(111), three different sites in the first layer of the interface are selected based on the symmetry, as shown in Figure 10, and the individual vacancy formation energies of the interface fcc-Fe(111)/NbN(111) are calculated with the expression shown in Equation (2). The instinct property is revealed in ref. [32].
E f , V = E t o t V a c a n c y , F e + E A t o m F e E t o t p u r e
E t o t V a c a n c y , F e represents the total energy of the interfacial structure containing a vacancy at different positions of the interface, E t o t p u r e then represents the total energy of the pure interfacial fcc-Fe(111)/NbN(111), and E A t o m F e Atom represents the energy of each atom in the reference state fcc-Fe. The smaller the vacancy formation energy, the stronger the tendency of vacancy formation at the interface, and vice versa, the lower the possibility of vacancy formation at the interface. The calculated vacancy formation energy is also summarized in Table 2. It can be noted that the formation energy of vacancy 1 is the largest, followed by vacancy 2, and the value of vacancy 3 is the smallest, which is 0.648 eV; thus, vacancy 3 is chosen for the subsequent research. The model containing both vacancies and alloying elements (Co, V) is presented in Figure 11a,b. The modeling of the interface fcc-Fe(111)/NbN(111) doped with different contents of alloying elements is shown in Figure 11c–h, and the variations in the contents of the two alloying elements, Co and V, are reflected by the doping of two, three, and four Co or V atoms at the interface, respectively.

3.4. Nature of Fe(111)/NbN(111) Interface

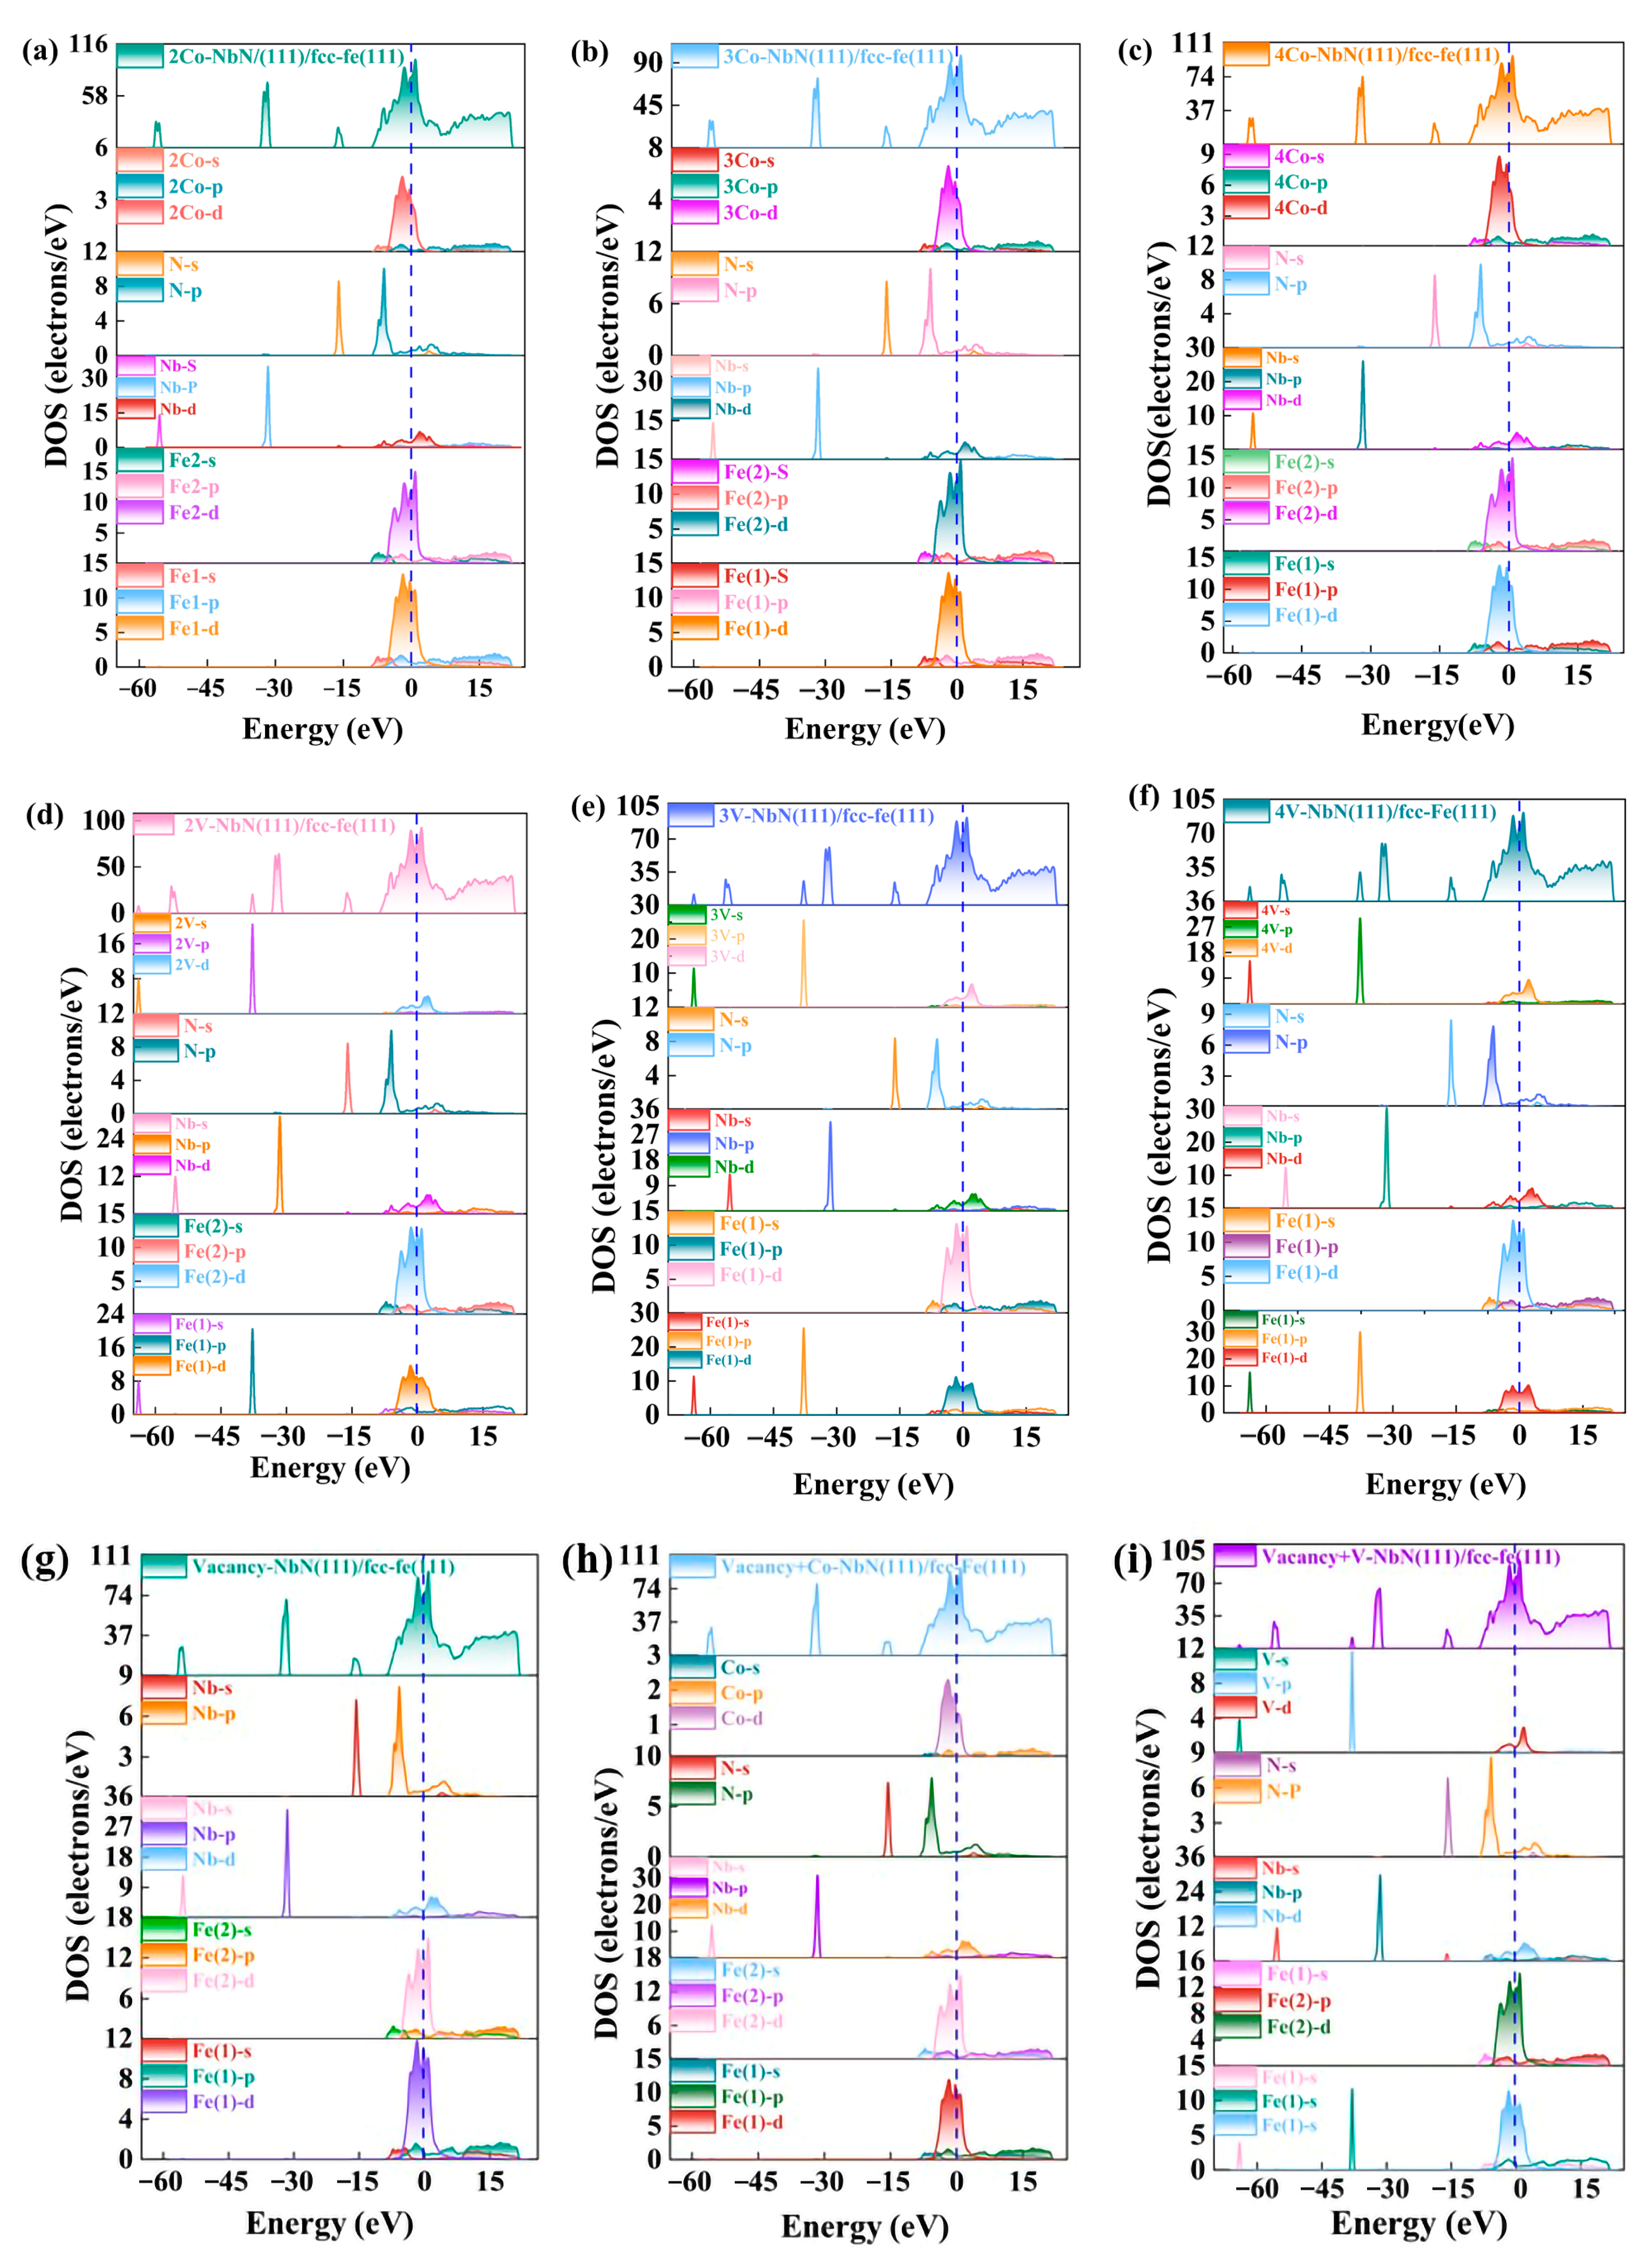
3.4.1. Density of States

The density of states (DOS) doped with different contents of alloying elements fcc-Fe(111)/NbN(111) is illustrated in Figure 12. The blue vertical dashed lines represent Fermi levels and the density of states values at the Fermi levels are not zero, indicating that all interfaces possess a certain metallicity. It can be seen in Figure 12a–c that the partial densities of the atomic layers on the Fe matrix side and the NbN side at the interface are different from the internal atomic layers, and the content of the dopant alloying elements has little effect on the atoms far from the interface. In the vicinity of the Fermi level, the total density of states is dominated by the contribution of the d-orbitals of Fe atoms and the d-orbital electrons of Co atoms, with a weak contribution from the d-orbitals of Nb atoms. As the doped Co content increases, the contribution of the Co-d orbital electrons also increases. The peak intensity of the d orbitals of Co atoms near the Fermi energy level increases significantly when the number of doped Co at the interface is changed from two to three atoms, yet the fractional density of states changes little when the number of doped Co atoms is changed from three to four. As can be seen from Figure 12d–f, the total density of states is mainly contributed by the V-s orbital electrons in the energy range from −65 eV to −60 eV, and the peak intensity of the s orbitals at −63 eV increases significantly with the increase of V content, and it is mainly contributed by the V-p orbital electrons in the energy range from −45 eV to −35 eV. From the −30 eV to −10 eV energy range, the total density of states is mainly contributed by the p-orbital electrons of Nb atoms and the s-orbital electrons of N atoms. In the vicinity of the Fermi level, the change in the V atomic partition density is unobvious.
Figure 12g–i shows the density of states with both vacancies and alloying elements, and the density of states with only one vacancy differs insignificantly from the clean interface. From the density of states containing both vacancies and the alloying element Co, it can be seen that near the Fermi energy level, the total density of states is dominated by the contribution of Fe-d and Co-d orbital electrons. The Fe-d orbitals at the interface exhibit a peak of 11.90 eV at −1.75 eV and the Co-d orbitals show a peak of 2.30 eV at −2.00 eV. Compared to the density of states containing only the alloying element Co, there is a slight weakening of the Fe-d orbital peaks along with a slight weakening of the electrons provided by the Co-d orbitals, whereas the overall trend remains consistent.

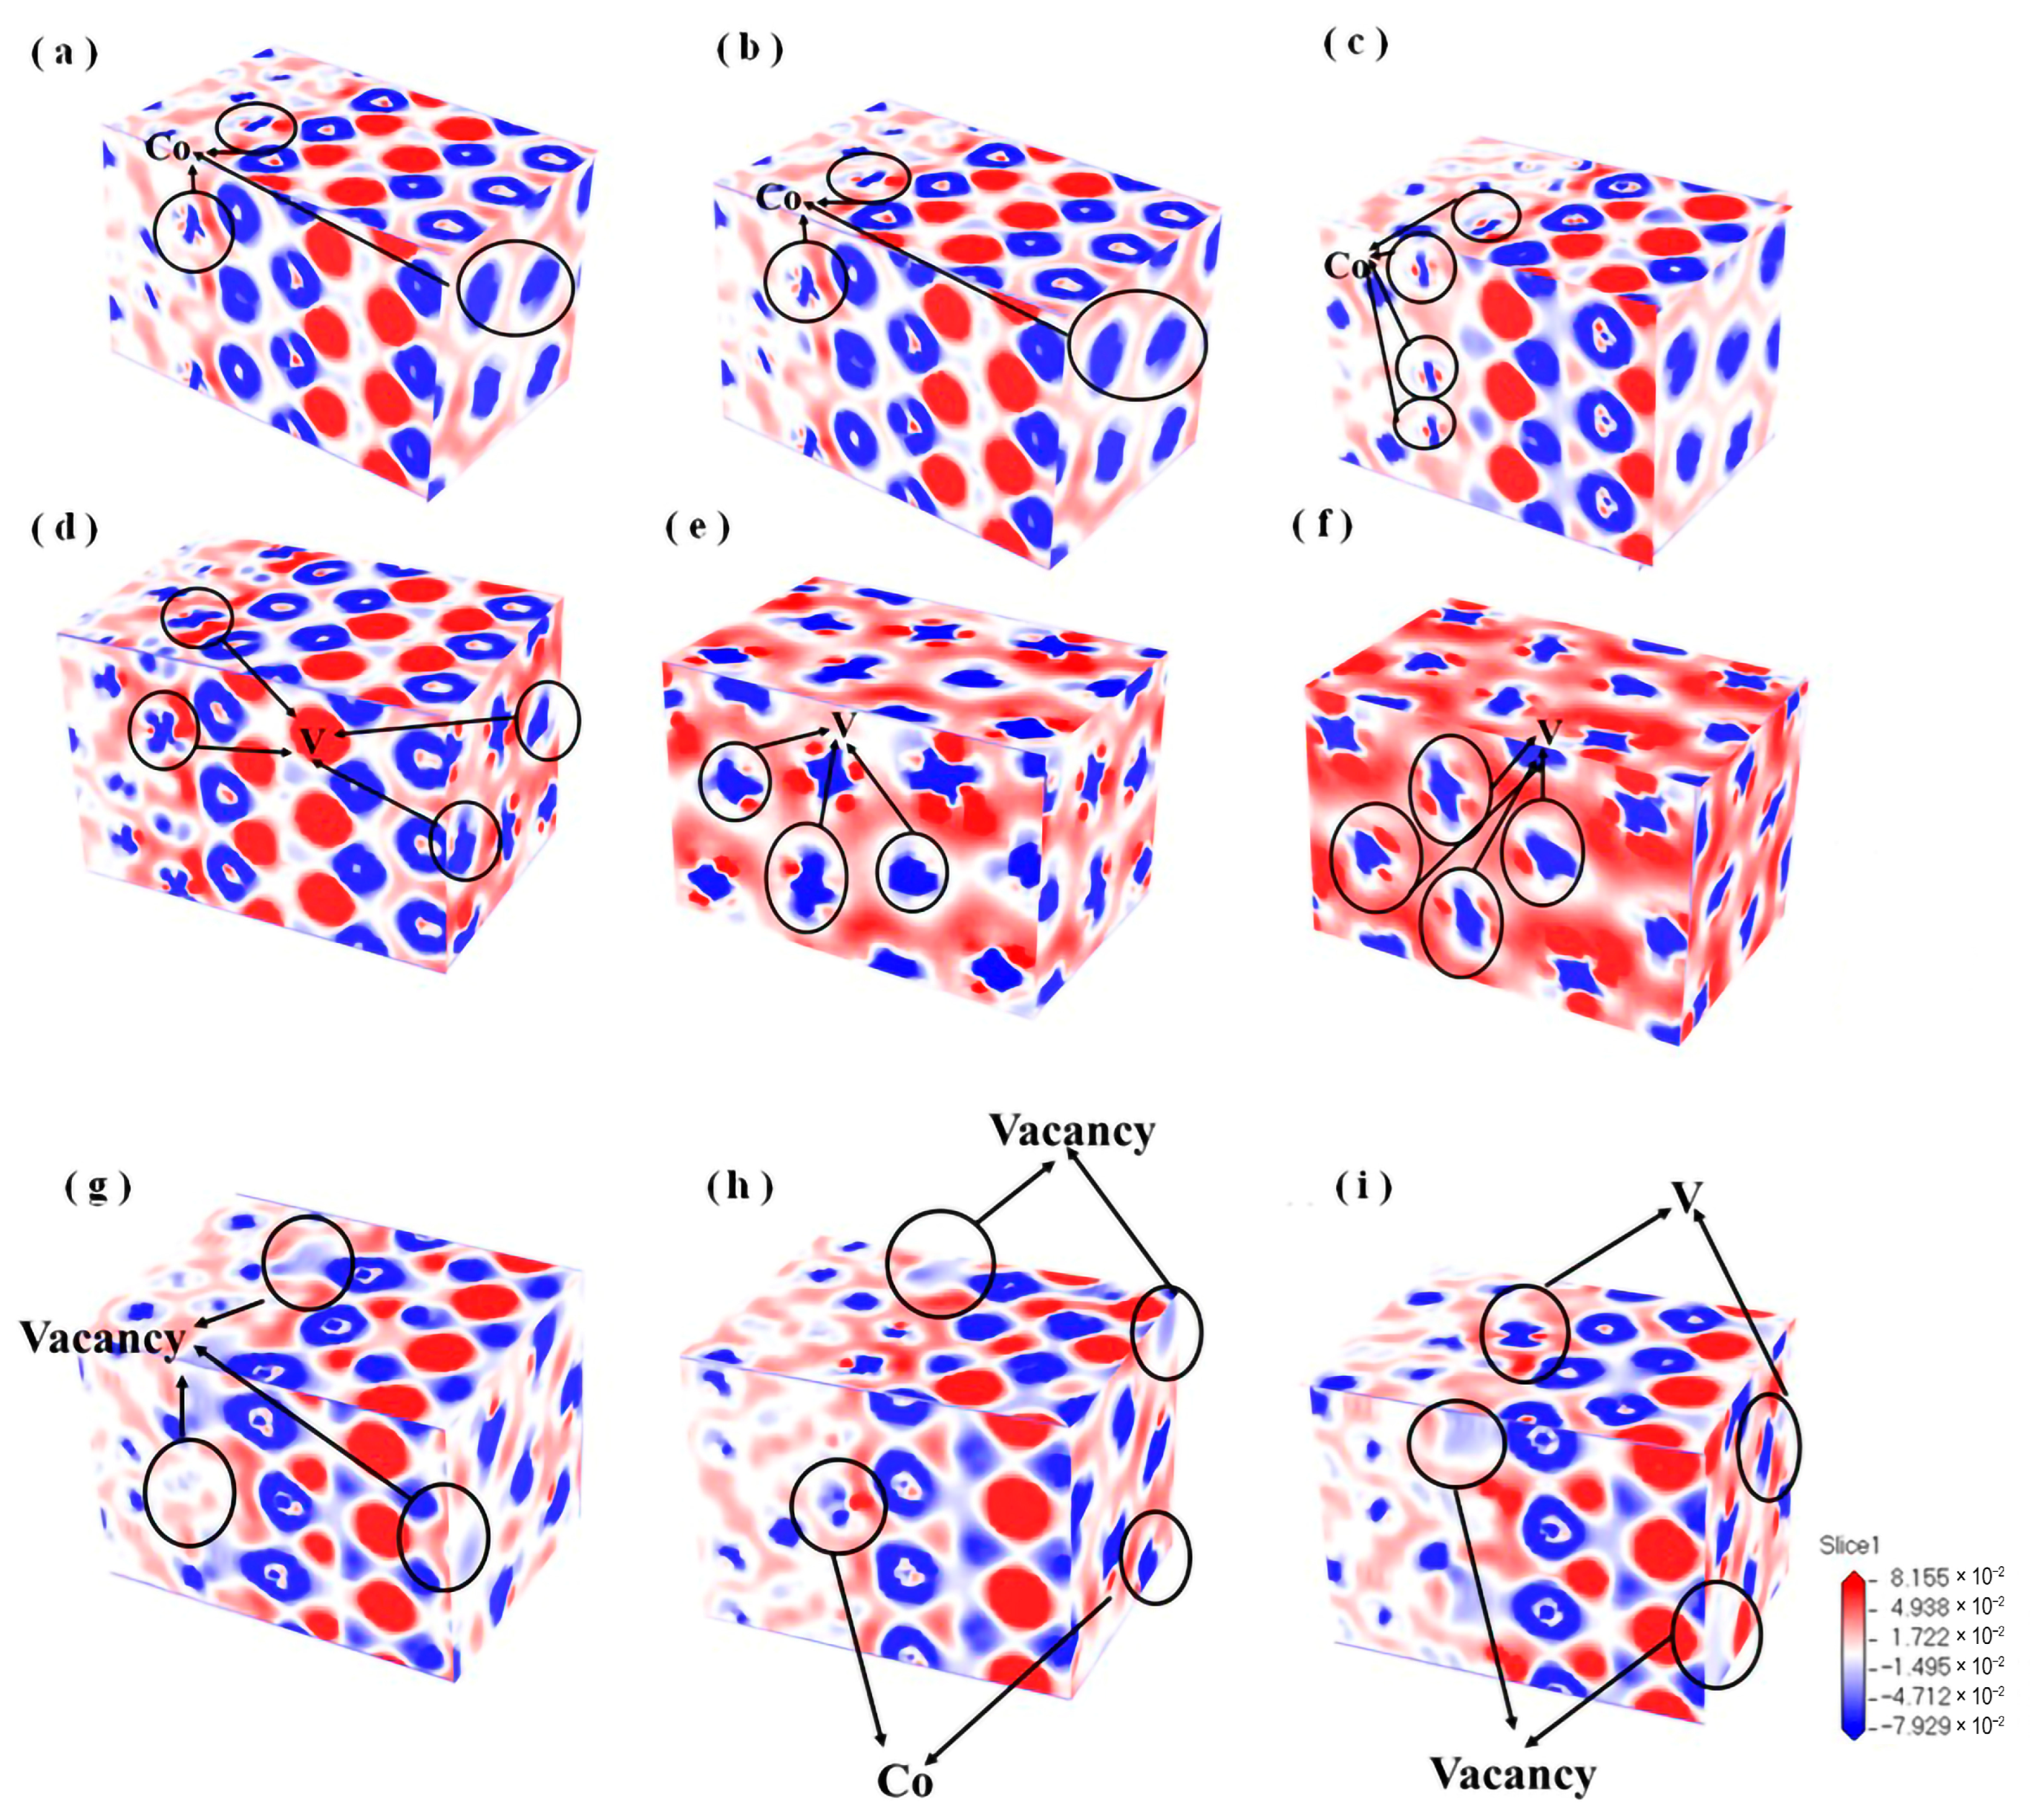
3.4.2. Differential Charge Density

For further characterizing the bonding characteristics and charge distribution of the interface, the differential charge density (DCD) was calculated and expressed by Equation (3):
ρ = ρ f c c F e 111 / N b N 111 ρ f c c F e 111 ρ N b N l 111
where, ρ f c c F e 111 / N b N 111 denotes the total charge density of the interface, and ρ f c c F e 111 and ρ N b N l 111 represent the charge densities of fcc-Fe(111) and NbN(111), respectively. Figure 13a–f represents the differential charge densities of the alloying elements with different contents, the blue area represents the depletion of charge, and the red part means the increase of charge density. Compared with the clean interface and only one Co atom doped interface, the electron transfer between the atoms is enhanced with the increase of the Co content, and the charge distribution in the red and blue regions is significantly changed. The higher the content of alloying elements, the larger the depletion degree the surrounding charge density, indicating a significant increase in the covalent interactions between interfacial atoms, i.e., an increase in the stability of the interfacial structure. The difference is insignificant in terms of the differential charge density of four doped Co atoms versus three doped Co atoms. When there are two doped alloying elements V at the interface, the difference charge diagram does not change significantly. When the doping content continues to increase, the charge consumption between Fe atoms and V atoms decreases, and the charge accumulation becomes more obvious, indicating that an excessive increase of doped V content does not enhance the interaction between atoms, but may reduce the interface stability. Therefore, it can be inferred that the optimal alloying element V content is 1–2 atoms.
Figure 13g–i depicts the density of states for interfaces containing both vacancies and alloying elements. Differential charge densities containing a single vacancy alone can be seen to appear as a significant change in the charge distribution around the vacancy. The blue region indicates that there is electron depletion, which means that the presence of vacancies reduces the density of the surrounding electron cloud and decreases the stability of the interface. Nevertheless, for the element doped models, the introduction of vacancy was discovered to result in a more significant depletion of the charge density around the dopant elements, indicating enhanced covalent bonding between the atoms, thereby contributing to the stability of the interface. Overall, the introduction of vacancy causes a change in the distribution of the surrounding electron cloud, and this change enhances the interactions between the atoms at the interface, enabling the interface to be more stable.

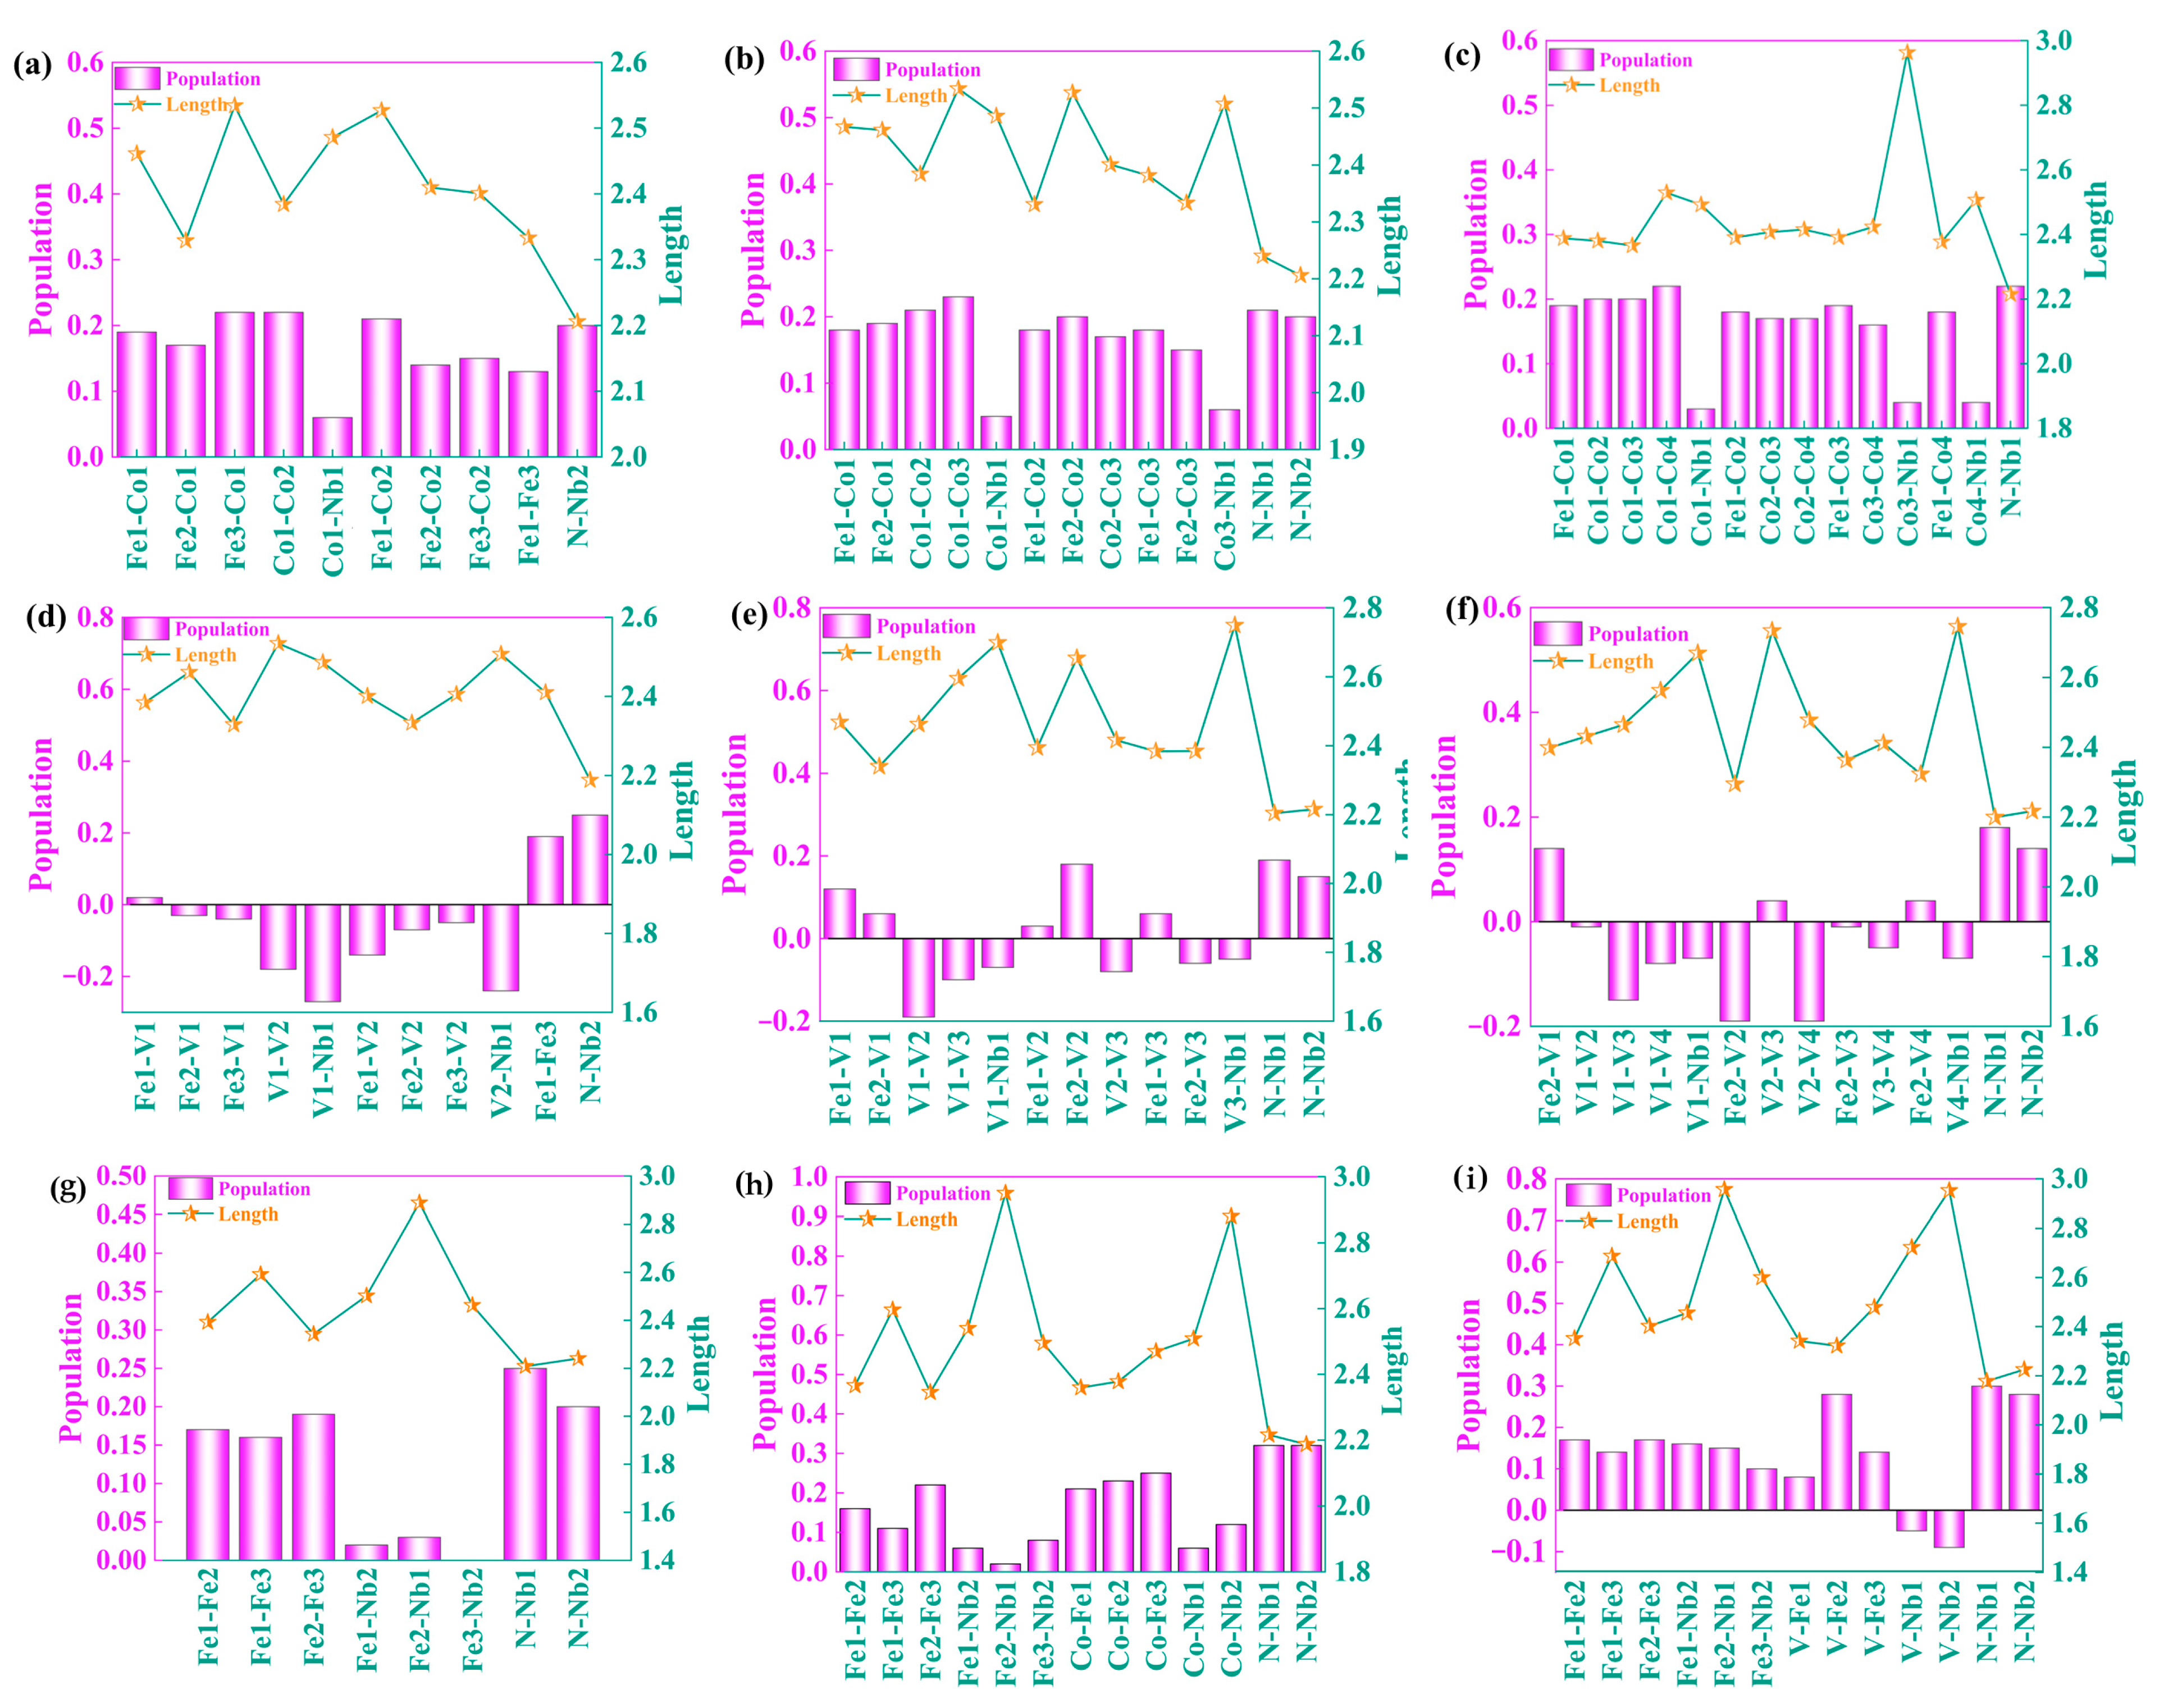
3.4.3. Population Analysis

Population analysis may examine the distribution of electrons in different orbitals to reveal the charge distribution, charge transfer, bonding property, and chemical features between atoms. Figure 14 depicts the charge transfer for doping with different content of alloying elements. Fe1, Fe2, and Fe3 are the Fe atoms around the dopant atoms, respectively, and the charge obtained by the Co atoms varies with the Co content of the dopant alloying element, and the charge obtained by the dopant Co, 2Co, 3Co, and 4Co at the interfaces are 0.15 e, 0.20 e, 0.29 e, and 0.43 e, respectively. The change in the charge obtained by the Fe atoms around the doped element is minor, yet there is a significant decrease in the charge obtained by the surrounding Fe atoms when doped with four Co atoms as compared to that of the other content models. From Figure 14d,e, the charge lost by doping V, 2V, 3V, and 4V at the interface are 0.47 e, 1.21 e, 2.26 e, and 1.53 e, respectively, and the charge lost by the N atoms are almost unchanged, while the charge lost by the surrounding Fe atoms are significantly increased. The total charge obtained by the Nb atoms is 0.69 e, 0.72 e, 0.67 e, and 0.42 e for V, 2V, 3V, and 4V doping at the interface, respectively. The number of charges lost by Nb atoms at the interface is significantly reduced when doped with 4V atoms compared to other doping content models. Figure 14g–i presents the charge transfer maps containing both vacancies and alloying elements. When the vacancies are introduced, Fe1, Fe2, and Fe3 reach charges of 0.05 e, 0.06 e, and 0.11 e, respectively, slightly higher than those before vacancies are introduced, and the amount of charge lost by N atoms is almost unchanged. When containing both vacancies and the alloying element Co, Fe1, Fe2, and Fe3 gain charge of 0.03 e, 0.04 e, and 0.09 e, respectively, and the Co atom loses 0.12 e. There is a slight decrease in the amount of charge gained by Fe atoms compared to the interface containing only vacancy, and there is a decrease in the amount of charge lost by Nb1 and Nb2. When both vacancies and alloying element V are included, Fe1, Fe2, and Fe3 get 0.18 e, 0.13 e, and 0.08 e, respectively, which is an increase in the number of charge obtained by Fe atoms compared to the interface containing only vacancy, and the charge loss of Nb1 and Nb2 atoms follows a decreasing trend, and V atoms receive 0.41 e.
Since the above results can only reflect the situation of charge transfer, it cannot reveal the stability of the interface. Based on it, the bond population is conducted to examine the bonding state of the interface. The magnitude of bond population value may reveal the difference of bond properties, and the larger bond population value indicates that the bond has more covalent components. On the contrary, the smaller bond population indicates that the ionic component is dominant, and the bond properties are more inclined to ionic bonds. Figure 15 shows the bond lengths and bond population values of the interface doped with different alloying elements. It is revealed that the bond length of Co1-Co2 decreases slightly when the interface is doped with 2Co, 3Co, and 4Co, respectively, indicating that the greater the content of alloying elements, the stronger the bonding of atoms at the interface, which will improve the stability of the interfacial structure. Meanwhile, the population values of Fe-Fe, Fe-Nb, and N-Nb bonds change weakly, and the bond population values of Co-Fe, Co-Nb, and Co-Co are all positive, indicating that the increase of the content of doped alloy elements can enhance the covalence of atomic bonding near the interface and further improve the interface bonding ability. It also shows that when an atom of V is doped at the interface, the population values of V-Fe, Fe-Fe, and V-Nb bonds are all positive, while when the 2V, 3V, and 4V atoms are doped at the interface, only a few of the V-Fe and V-V bonds are positive, and the rest are negative. It indicates that the increase of the alloying element V content at the interface, instead of improving the interfacial stability, will also be detrimental to the stabilization of the interfacial structure, which is consistent with the results of the analysis of the density of states and differential charge.
Figure 15g–i shows the bond length and bond population with both vacancy and alloying elements. It can be found that Fe1-Fe2, Fe2-Fe3, Co1-Fe1, Co1-Fe2 bond lengths containing both vacancies and the alloying element Co are reduced to different degrees, meanwhile V-Fe, V-Nb bond lengths containing both vacancies and the alloying element V are reduced as well, suggesting that the introduction of vacancies can play a role in improving the interfacial stability. Combined with the bond population values, it can be seen that there is a significant increase in the Co(V)-Fe bond population values, which indicates that the covalence is enhanced, i.e., the simultaneous inclusion of vacancies and alloying elements can improve the stability of the interface.

4. Conclusions

In conclusion, the elastic modulus and electronic property of the bulk phases fcc-Fe and NbN have been investigated by means of the first principles, and the evolution of stress-strain curves, lattice constant, and electronic feature under tensile behavior have also been analyzed. Furthermore, the effects of various alloying elements and vacancy on the interfacial stability are explored. The results are as follows.
(1)
For the bulk phases, the total density of states of fcc-Fe mainly comes from the contribution of the d-orbitals of Fe atoms, and NbN also has certain metallic features. The differential charge density maps indicate that the overall distribution of the two has a certain symmetry and high structural stability. The elastic modulus calculations indicate that both phases are elastically anisotropic and the degree of anisotropy in Young’s modulus, shear modulus, and Poisson’s ratio is more significant for NbN.
(2)
The fcc-Fe achieved a maximum tensile strength of 32.6 GPa when the tensile strain reaches 20%, and the stress gradually decreases as the strain increases when the strain exceeds 20%. While the maximum tensile strength of NbN is 29 GPa when the strain is 10%, and the stress decreases rapidly with the increase of strain. The unit cell lattice constants (b, c) decrease gradually with the increase of strain. Meanwhile, with the increasing of tensile strain, the fcc-Fe and NbN bulk phases experience the aggregation of charge, and the position of the intensity of the bonding peaks will undergo a change near the Fermi energy level. This indicates that the bulk phases suffer a large deformation with the increase of the strain, which leads to a decrease in the stability of the structure.
(3)
For the interface, the lowest formation energy of vacancy 3 is the optimal occupation site. The differential charge density results show that with the increase in the content of alloying element Co, the degree of charge density depletion around it gradually increases, and the covalent bonding characteristics between the interfacial atoms are significantly enhanced, resulting in enhanced stability of the interfacial structure. However, the increase in the content of alloying element V plays the opposite effect on the interfacial stability. At the same time, the introduction of vacancy leads to variations in the distribution of the surrounding electron clouds, enhancing the interactions between atoms and rendering the interface more stable.
(4)
The results of bond length and bond population are consistent with the results of DOS and DCD analysis. The increase of Co doping content can enhance the covalent bonding of atoms near the interface and further improve the binding ability of the interface. The optimal Co doping content is 3 atoms, and the optimal V doping content is 1 atom. The interfacial model containing vacancy and alloying element exhibits shorter bond length, larger bond population value and stronger covalence, which is conducive to improving the stability of the interface.
(5)
Looking ahead, adjusting the contents of Co and V appropriately in experiments can optimize interfacial properties. Notably, V is an alloying element effective in enhancing the thermal strength of steel, further improving the creep resistance of heat-resistant steels. Given the high cost of Co, which increases production expenses, leveraging the efficient strengthening properties of V as the primary means to enhance performance-supplemented by vacancy defect engineering to optimize interfacial stability-while controlling Co addition to achieve an optimal balance between cost and performance, provides actionable parameter guidance for engineering-scale steelmaking.

Author Contributions

Conceptualization, J.S.; methodology, S.Z. and X.T.; software, S.Z.; validation, X.Z.; formal analysis, X.Z.; investigation, J.R.; data curation, J.S. and J.R.; writing—original draft preparation, J.Z.; writing—review and editing, J.Z.; visualization, X.L.; supervision, X.L.; funding acquisition, X.T. All authors have read and agreed to the published version of the manuscript.

Funding

This research was funded by Gansu Province Science and Technology Plan Project, grant number 23JRRB0003 and Jiayuguan Science and Technology Plan Project, grant number 24-11, 23-01.

Data Availability Statement

The original contributions presented in this study are included in the article. Further inquiries can be directed to the corresponding author.

Conflicts of Interest

Authors Shuangwu Zhang and Xiaolong Zhao were employed by Jiuquan Iron and Steel (Group) Co., Ltd. The remaining authors declare that the research was conducted in the absence of any commercial or financial relationships that could be construed as a potential conflict of interest.

References

  1. Hou, J.; Gan, J.; Li, W.; Tian, H.; Luo, X.; Ju, J.; Zhou, Y.; Liu, S.; Yao, H.; Chen, Z.; et al. Exceptional high-temperature oxidation resistance and mechanisms of a novel chemically complex intermetallic alloy. Corros. Sci. 2023, 225, 111607. [Google Scholar] [CrossRef]
  2. Yamamoto, Y.; Brady, M.P.; Lu, Z.P.; Liu, C.T.; Takeyama, M.; Maziasz, P.J.; Pint, B.A. Alumina-forming austenitic stainless steels strengthened by laves phase and MC carbide precipitates. Met. Mater. Trans. A 2007, 38, 2737–2746. [Google Scholar] [CrossRef]
  3. Nie, S.; Chen, Y.; Ren, X.; Sridharan, K.; Allen, T.R. Corrosion of alumina-forming austenitic steel Fe-20Ni-14Cr-3Al-0.6Nb-0.1Ti in supercritical water. J. Nucl. Mater. 2010, 399, 231–235. [Google Scholar] [CrossRef]
  4. Tian, Y.; Zhao, H.; Yang, R.; Liu, X.; Chen, X.; Qin, J.; McDonald, A.; Li, H. In-situ SEM investigation on stress-induced microstructure evolution of austenitic stainless steels subjected to cavitation erosion and cavitation erosion-corrosion. Mater. Des. 2022, 213, 110314. [Google Scholar] [CrossRef]
  5. Wan, L.; Wang, Q.; Ye, X.; Cao, X.; Jin, S.; Gao, T. Insight into structural stability and helium diffusion behavior of Fe-Cr alloys from first-principles. RSC Adv. 2020, 10, 3277–3292. [Google Scholar] [CrossRef]
  6. Çetin, M.; Günen, A.; Kalkandelen, M.; Karakas, M.S. Microstructural, wear and corrosion characteristics of boronized AISI 904L superaustenitic stainless steel. Vacuum 2021, 187, 110145. [Google Scholar] [CrossRef]
  7. Ajmal, M.; Lopez-Crespo, C.; Cruces, A.S.; Antunes, F.V.; Lopez-Crespo, P. On the use of the plastic component of the CTOD for fatigue analysis in austenitic stainless steel. Procedia Struct. Integr. 2022, 37, 964–976. [Google Scholar] [CrossRef]
  8. Panov, D.O.; Chernichenko, R.S.; Naumov, S.V.; Pertcev, A.S.; Stepanov, N.D.; Zherebtsov, S.V.; Salishchev, G.A. Excellent strength-toughness synergy in metastable austenitic stainless steel due to gradient structure formation. Mater. Lett. 2021, 303, 130585. [Google Scholar] [CrossRef]
  9. Zinovieva, O.; Zinoviev, A.; Romanova, V.; Balokhonov, R. Three-dimensional analysis of grain structure and texture of additively manufactured 316L austenitic stainless steel. Addit. Manuf. 2020, 36, 101521. [Google Scholar] [CrossRef]
  10. Kumar, P.; Jayaraj, R.; Suryawanshi, J.; Satwik, U.R.; McKinnell, J.; Ramamurty, U. Fatigue strength of additively manufactured 316L austenitic stainless steel. Acta Mater. 2020, 199, 225–239. [Google Scholar] [CrossRef]
  11. Kalal, S.; Gupta, M.; Rawat, R. N concentration effects on structure and superconductivity of NbN thin films. J. Alloys Compd. 2021, 851, 155925. [Google Scholar] [CrossRef]
  12. Ivashchenko, V.I.; Turchi, P.E.A.; Pavlova, N.Y.; Gorb, L.; Leszczynski, J. Temperature-and pressure-induced structural transformations in NbN: A first-principles study. Phys. B 2023, 663, 414998. [Google Scholar] [CrossRef]
  13. Wang, D.; Li, Q.; Jiao, X.; Ni, G.; Wang, S. Heterogeneous nucleation interface between NbN (111)and TiN (111) in high-nitrogen austenitic stainless steels: First-principles calculation. Mater. Today Commun. 2024, 40, 109554. [Google Scholar] [CrossRef]
  14. Banik, S.D.; Kumar, S.; Singh, P.K.; Bhattacharya, S.; Mahapatra, M.M. Distortion and residual stresses in thick plate weld joint of austenitic stainless steel: Experiments and analysis. J. Mater. Process. Technol. 2021, 289, 116944. [Google Scholar] [CrossRef]
  15. Lu, E.; Cao, X.; Jin, S.; Zhang, P.; Zhang, C.; Yang, J.; Wu, Y.; Guo, L.; Wang, B. Investigation of vacancy-type defects in helium irradiated FeCrNi alloy by slow positron beam. J. Nucl. Mater. 2015, 458, 240–244. [Google Scholar] [CrossRef]
  16. Iok, I.; Ishijima, Y.; Usami, K.; Sakuraba, N.; Kato, Y.; Kiuchi, K. Radiation hardening and IASCC susceptibility of extra high purity austenitic stainless steel. J. Nucl. Mater. 2011, 417, 887–891. [Google Scholar] [CrossRef]
  17. Edwards, D.J.; Garner, F.A.; Bruemmer, S.M.; Efsing, P. Nano-cavities observed in a 316SS PWR flux thimble tube irradiated to 33 and 70 dpa. J. Nucl. Mater. 2009, 384, 249–255. [Google Scholar] [CrossRef]
  18. Schvartzman, M.M.D.A.M.; Quinan, M.A.D.; Campos, W.R.D.C.; Lima, L.I.L. Stress corrosion cracking of the AISI 316L stainless steel HAZ in a PWR nuclear reactor environment. Weld. Int. 2011, 25, 15–23. [Google Scholar] [CrossRef]
  19. Katsura, R.; Morisawa, J.; Kawano, S.; Oliver, B.M. Post-irradiation annealing effect on helium diffusivity in austenitic stainless steels. J. Nucl. Mater. 2004, 329, 668–672. [Google Scholar] [CrossRef]
  20. Gong, Y.; Jin, S.; Zhu, T.; Cheng, L.; Cao, X.; You, L.; Lu, G.; Guo, L.; Wang, B. Helium self-trapping and diffusion behaviors in deformed 316L stainless steel exposed to high flux and low energy helium plasma. Nucl. Fusion 2018, 58, 046011. [Google Scholar] [CrossRef]
  21. Shen, Y.F.; Li, X.X.; Sun, X.; Wang, Y.D.; Zuo, L. Twinning and martensite in a 304 austenitic stainless steel. Mat. Sci. Eng. A-struct. 2012, 552, 514–522. [Google Scholar] [CrossRef]
  22. Sathiya, P.; Aravindan, S.; Haq, A.N. Mechanical and metallurgical properties of friction welded AISI 304 austenitic stainless steel. Int. J. Adv. Manuf. Technol. 2005, 26, 505–511. [Google Scholar] [CrossRef]
  23. Mierzejewska, Ż.A.; Oksiut, Z. Isolated fracture of the hip stem prosthesis made of austenitic steel-a literature review. Pol. Orthop. Traumatol. 2014, 79, 145–153. [Google Scholar]
  24. Hao, Y.; Yu, S.; Cao, P.J.; Li, K.J. Research status of failure mechanisms of heat-resistant steel in thermal power units. Heat Treat. Met. 2021, 46, 14–24. [Google Scholar]
  25. Vahrusheva, V.; Hlushkova, D.; Volchuk, V. Increasing the corrosion resistance of heat-resistant alloys for parts of power equipment. Boпpocы Aтoмнoй Нayки и Mexники 2022, 140, 137–140. [Google Scholar] [CrossRef]
  26. Liang, Z.; Gui, Y.; Wang, Y.; Zhao, Q. Corrosion performance of heat-resisting steels and alloys in supercritical carbon dioxide at 650 C and 15 MPa. Energy 2019, 175, 345–352. [Google Scholar] [CrossRef]
  27. Achmad, T.L.; Fu, W.; Chen, H.; Zhang, C.; Yang, Z.-G. Effects of alloying elements concentrations and temperatures on the stacking fault energies of Co-based alloys by computational thermodynamic approach and first-principles calculations. J. Alloys Compd. 2017, 694, 1265–1279. [Google Scholar] [CrossRef]
  28. Song, K.; Cao, S.; Bao, Y.; Qian, P.; Su, Y. Designing hydrogen embrittlement-resistant grain boundary in steel by alloying elements segregation: First-principles calculations. Appl. Surf. Sci. 2024, 656, 159684. [Google Scholar] [CrossRef]
  29. Labudovic, M.; Hu, D.; Kovacevic, R. A three dimensional model for direct laser metal powder deposition and rapid prototyping. J. Mater. Sci. 2003, 38, 35–49. [Google Scholar] [CrossRef]
  30. Appleyard, D. Powering up on powder technology. Met. Powder Rep. 2015, 70, 285–289. [Google Scholar] [CrossRef]
  31. Ren, J.; Hou, P.; Gao, Q.; Wang, Q.; Bai, Y.; Li, J.; Xue, H.; Lu, X.; Tang, F. A comparative study of the interfacial bonding properties and thermodynamic properties of bcc-Fe/MeAl (Me = Ni, Ti, Fe) interfaces based on first-principles methods. J. Phys. Chem. Solids 2025, 202, 112679. [Google Scholar] [CrossRef]
  32. Guo, X.; Zhang, J.; Liu, D.; Chen, B.; Bai, Z.; Yang, P.; Ren, J.; Lu, X. Influence of alloying elements on the stability and segregation behavior of fcc-Fe/NbN interface by simulation. Vacuum 2024, 228, 113479. [Google Scholar] [CrossRef]
Figure 1. Supercell and unit cell models. (a,c) fcc-Fe and (b,d) NbN.
Metals 15 00759 g001
Figure 2. Density of states of (a) Fe and (b) NbN, differential charge density of (c) Fe and (d) NbN.
Metals 15 00759 g002
Figure 3. 2D and 3D anisotropy distributions of (ad) fcc-Fe and (eh) NbN elastic modulus.
Metals 15 00759 g003aMetals 15 00759 g003b
Figure 4. Tensile models and stress-strain curves of (a,c) fcc-Fe and (b,d) NbN bulk phases.
Metals 15 00759 g004aMetals 15 00759 g004b
Figure 5. Variation of lattice constants for (a) fcc-Fe and (b) NbN bulk phases.
Metals 15 00759 g005
Figure 6. Density of states of fcc-Fe at various strains. (a) 0%, (b) 10%, (c) 20%, (d) 30%, (e) 40%, (f) 50%.
Metals 15 00759 g006
Figure 7. Density of states of NbN at various strains. (a) 0%, (b) 10%, (c) 20%, (d) 30%, (e) 40%, (f) 50%.
Metals 15 00759 g007
Figure 8. Differential charge density of the fcc-Fe bulk phase at different strains. (a) 0%, (b) 10%, (c) 20%, (d) 30%, (e) 40%, and (f) 50%.
Metals 15 00759 g008
Figure 9. Differential charge densities of the NbN bulk phase at different strains. (a) 0%, (b) 10%, (c) 20%, (d) 30%, (e) 40%, and (f) 50%.
Metals 15 00759 g009
Figure 10. The vacancy at different positions in the interface.
Metals 15 00759 g010
Figure 11. Fcc-Fe(111)/NbN(111) interface model with (a,b) vacancy and alloying elements and (ch) doping with different alloying elements.
Metals 15 00759 g011
Figure 12. Densities of states doped by (a) 2Co, (b) 3Co, (c) 4Co, (d) 2V, (e) 3V, and (f) 4V, with both vacancies and alloying elements (g) pure vacancy, (h) vacancy and Co, and (i) vacancy and V.
Metals 15 00759 g012
Figure 13. DCD of interface doped by (a) 2Co, (b) 3Co, (c) 4Co, (d) 2V, (e) 3V, and (f) 4V, with both vacancies and alloying elements (g) pure vacancy, (h) vacancy and Co, and (i) vacancy and V.
Metals 15 00759 g013
Figure 14. Charge transfer maps doped by (a) 2Co, (b) 3Co, (c) 4Co, (d) 2V, (e) 3V, and (f) 4V, with both vacancies and alloying elements (g) pure vacancy, (h) vacancy and Co, and (i) vacancy and V.
Metals 15 00759 g014
Figure 15. Bond length and bond population maps doped by (a) 2Co, (b) 3Co, (c) 4Co, (d) 2V, (e) 3V, and (f) 4V, with both vacancies and alloying elements (g) pure vacancy, (h) vacancy and Co, and (i) vacancy and V.
Metals 15 00759 g015
Table 1. Elastic anisotropy of fcc-Fe and NbN.
PhasesYoung’s Modulus
(GPa)
Linear Coefficient
(TPa−1)
Shear Modulus
(GPa)
Poisson’s Ration
EminEmaxβminβmaxGminGmaxυminυmax
fcc-FeValues322.53616.361.161.16122.80269.980.010.48
Anisotropy1.8812.09
NbNValues66.63599.251.161.2822.92263.440.020.88
Anisotropy8.931.1011.4946.21
Table 2. The interface forming energy at different positions of the interface (unit: eV).
Vacancy123
E f , V 0.6640.6490.648
Disclaimer/Publisher’s Note: The statements, opinions and data contained in all publications are solely those of the individual author(s) and contributor(s) and not of MDPI and/or the editor(s). MDPI and/or the editor(s) disclaim responsibility for any injury to people or property resulting from any ideas, methods, instructions or products referred to in the content.

