Processing of Intermetallic Titanium Aluminide Wires

 ,
,
Abstract
: This study shows the possibility of processing titanium aluminide wires by cold deformation and annealing. An accumulative swaging and bundling technique is used to co-deform Ti and Al. Subsequently, a two step heat treatment is applied to form the desired intermetallics, which strongly depends on the ratio of Ti and Al in the final composite and therefore on the geometry of the starting composite. In a first step, the whole amount of Al is transformed to TiAl3 by Al diffusion into Ti. This involves the formation of 12% porosity. In a second step, the complete microstructure is transformed into the equilibrium state of γ-TiAl and TiAl3. Using this approach, it is possible to obtain various kinds of gradient materials, since there is an intrinsic concentration gradient installed due to the swaging and bundling technique, but the processing of pure γ-TiAl wires is possible as well.1. Introduction
Titanium aluminides have gained much attention in literature according to their excellent mechanical properties at high temperature such as tensile strength, Young’s modulus or creep behaviour. In addition, their low mass density makes them especially attractive to mobile applications like it is the case in aeronautic or automotive industries [1]. The lack of room temperature ductility is the main reason why these intermetallics have to be produced by non-conventional and costly production routes. This involves powder metallurgy [2,3], near-net-shape casting from very high temperatures [4], selective laser melting [5,6], electron beam melting [7] and hot forging methods [8].
All these preparation routes are restricted in terms of the final shape and size. In particular, it costs enormous efforts to produce semi-finished products such as wires following the aforementioned attempts. Nevertheless, Acoff’s group [9,10] showed the possibility of preparing γ-TiAl sheets using a rolling processing route combined with adequate heat treatments.
Nevertheless, possibilities to produce wires made from this material are very limited, but possible applications such as cables or welding wires for repairing turbine blades via additive manufacturing routes are promising. In a recent work, a preparation route for multi-filamentary Ti/Al wires using an accumulative swaging and bundling technique was set up by the authors [11]. This technique in combination with a subsequent heat treatment opens up the possibility to obtain wires made from titanium aluminides, which is one concern of the present work.
The second concern is on the reaction kinetics and the microstructural evolution. In literature, the making of titanium aluminides from elemental foils [12], powders [13] or by reaction synthesis [14] usually involves the formation of the tetragonal TiAl3 phase when annealing is conducted below the melting point of Al [9,12,14–17]. Above the melting point of Al, e.g., at 950 °C, all phases present in the equilibrium phase diagram of Ti and Al [18] are observed. After a subsequent adequate heat treatment, the whole amount of aluminium has reacted with Ti to an intermediate titanium aluminide phase. Further phase reaction annealing at higher temperatures will allow the complete transfer of the remaining Ti and the intermediate TiAl3 to the equilibrium titanium aluminide composition.
2. Experimental Section
Wires were prepared using the experimental setup and materials previously described by our group [11,19]. The process starts with an AA5049 rod (simply named Al or Al alloy in the following) and a Ti tube, which are being co-deformed to a wire. After attaining a certain diameter (2.8 mm), the wire is cut and stacked into an undeformed Ti tube of the same dimension as the first. This procedure is referred to as one stacking cycle.
To end the preparation route with a composite composed of 50 at.% Ti and Al each, two stacking cycles are applied using the materials and the dimensions shown in Table 1. In addition, the table shows calculated and measured mass density values of the composites during the processing.
The measured mass densities are given in brackets and are slightly higher than the calculated values. They can exactly be reproduced by calculating the whole composite as if it was prepared by a starting Al rod of 17 mm in diameter. This indicates that parts of the Al—due to the differences in deformation behaviour—was pressed out of the composite at the very beginning of the preparation route.
Deformation was performed at room temperature without any subsequent heat treatments. To evaluate the intermediate heat treatment parameters and phase reaction kinetics, the wires obtained were isothermally annealed in an electrical resistivity measurement set-up at temperatures of 540 °C, 560 °C, 580 °C and 600 °C in argon atmosphere. Heating was conducted by using a two step ramp. The first step heated to 500 °C using 2 K min−1, while during the second step the temperature was increased to the nominal temperature with 1 K min−1. This was necessary in order to minimize temperature overdrive.
After completion of the phase reactions, the wires were annealed at 1300 °C for 12 h in a quartz glass tube under Ar atmosphere to transfer the material in the complete cross section to the equilibrium titanium aluminide phases.
X-ray diffraction (using a Co Kα source (40 kV, 40 mA) in combination with a secondary graphite monochromator) was carried out at the cross section of the wires, which were prepared by grinding using conventional P4000 SiC paper. The measurement was made on the rotating sample collecting X-rays for 30 s in each 0.02° step in the range of 37°–57° and 73°–114° in 2Θ.
The area fractions of single phases in the wire cross section were determined by optical microscopy (OM) with an Epiphot microscope using the analysis software A4i Docu.
Scanning electron microscopy (SEM) was conducted using a Zeiss Gemini 1530 LEO microscope equipped with a field emission gun operating at 20 kV acceleration voltage.
Mass density measurements were performed using the Archimedean principle inside and outside a C4H9I bath at 25 °C. The accuracy of the used scale was 0.1 mg.
3. Results and Discussion
3.1. Mesostructure
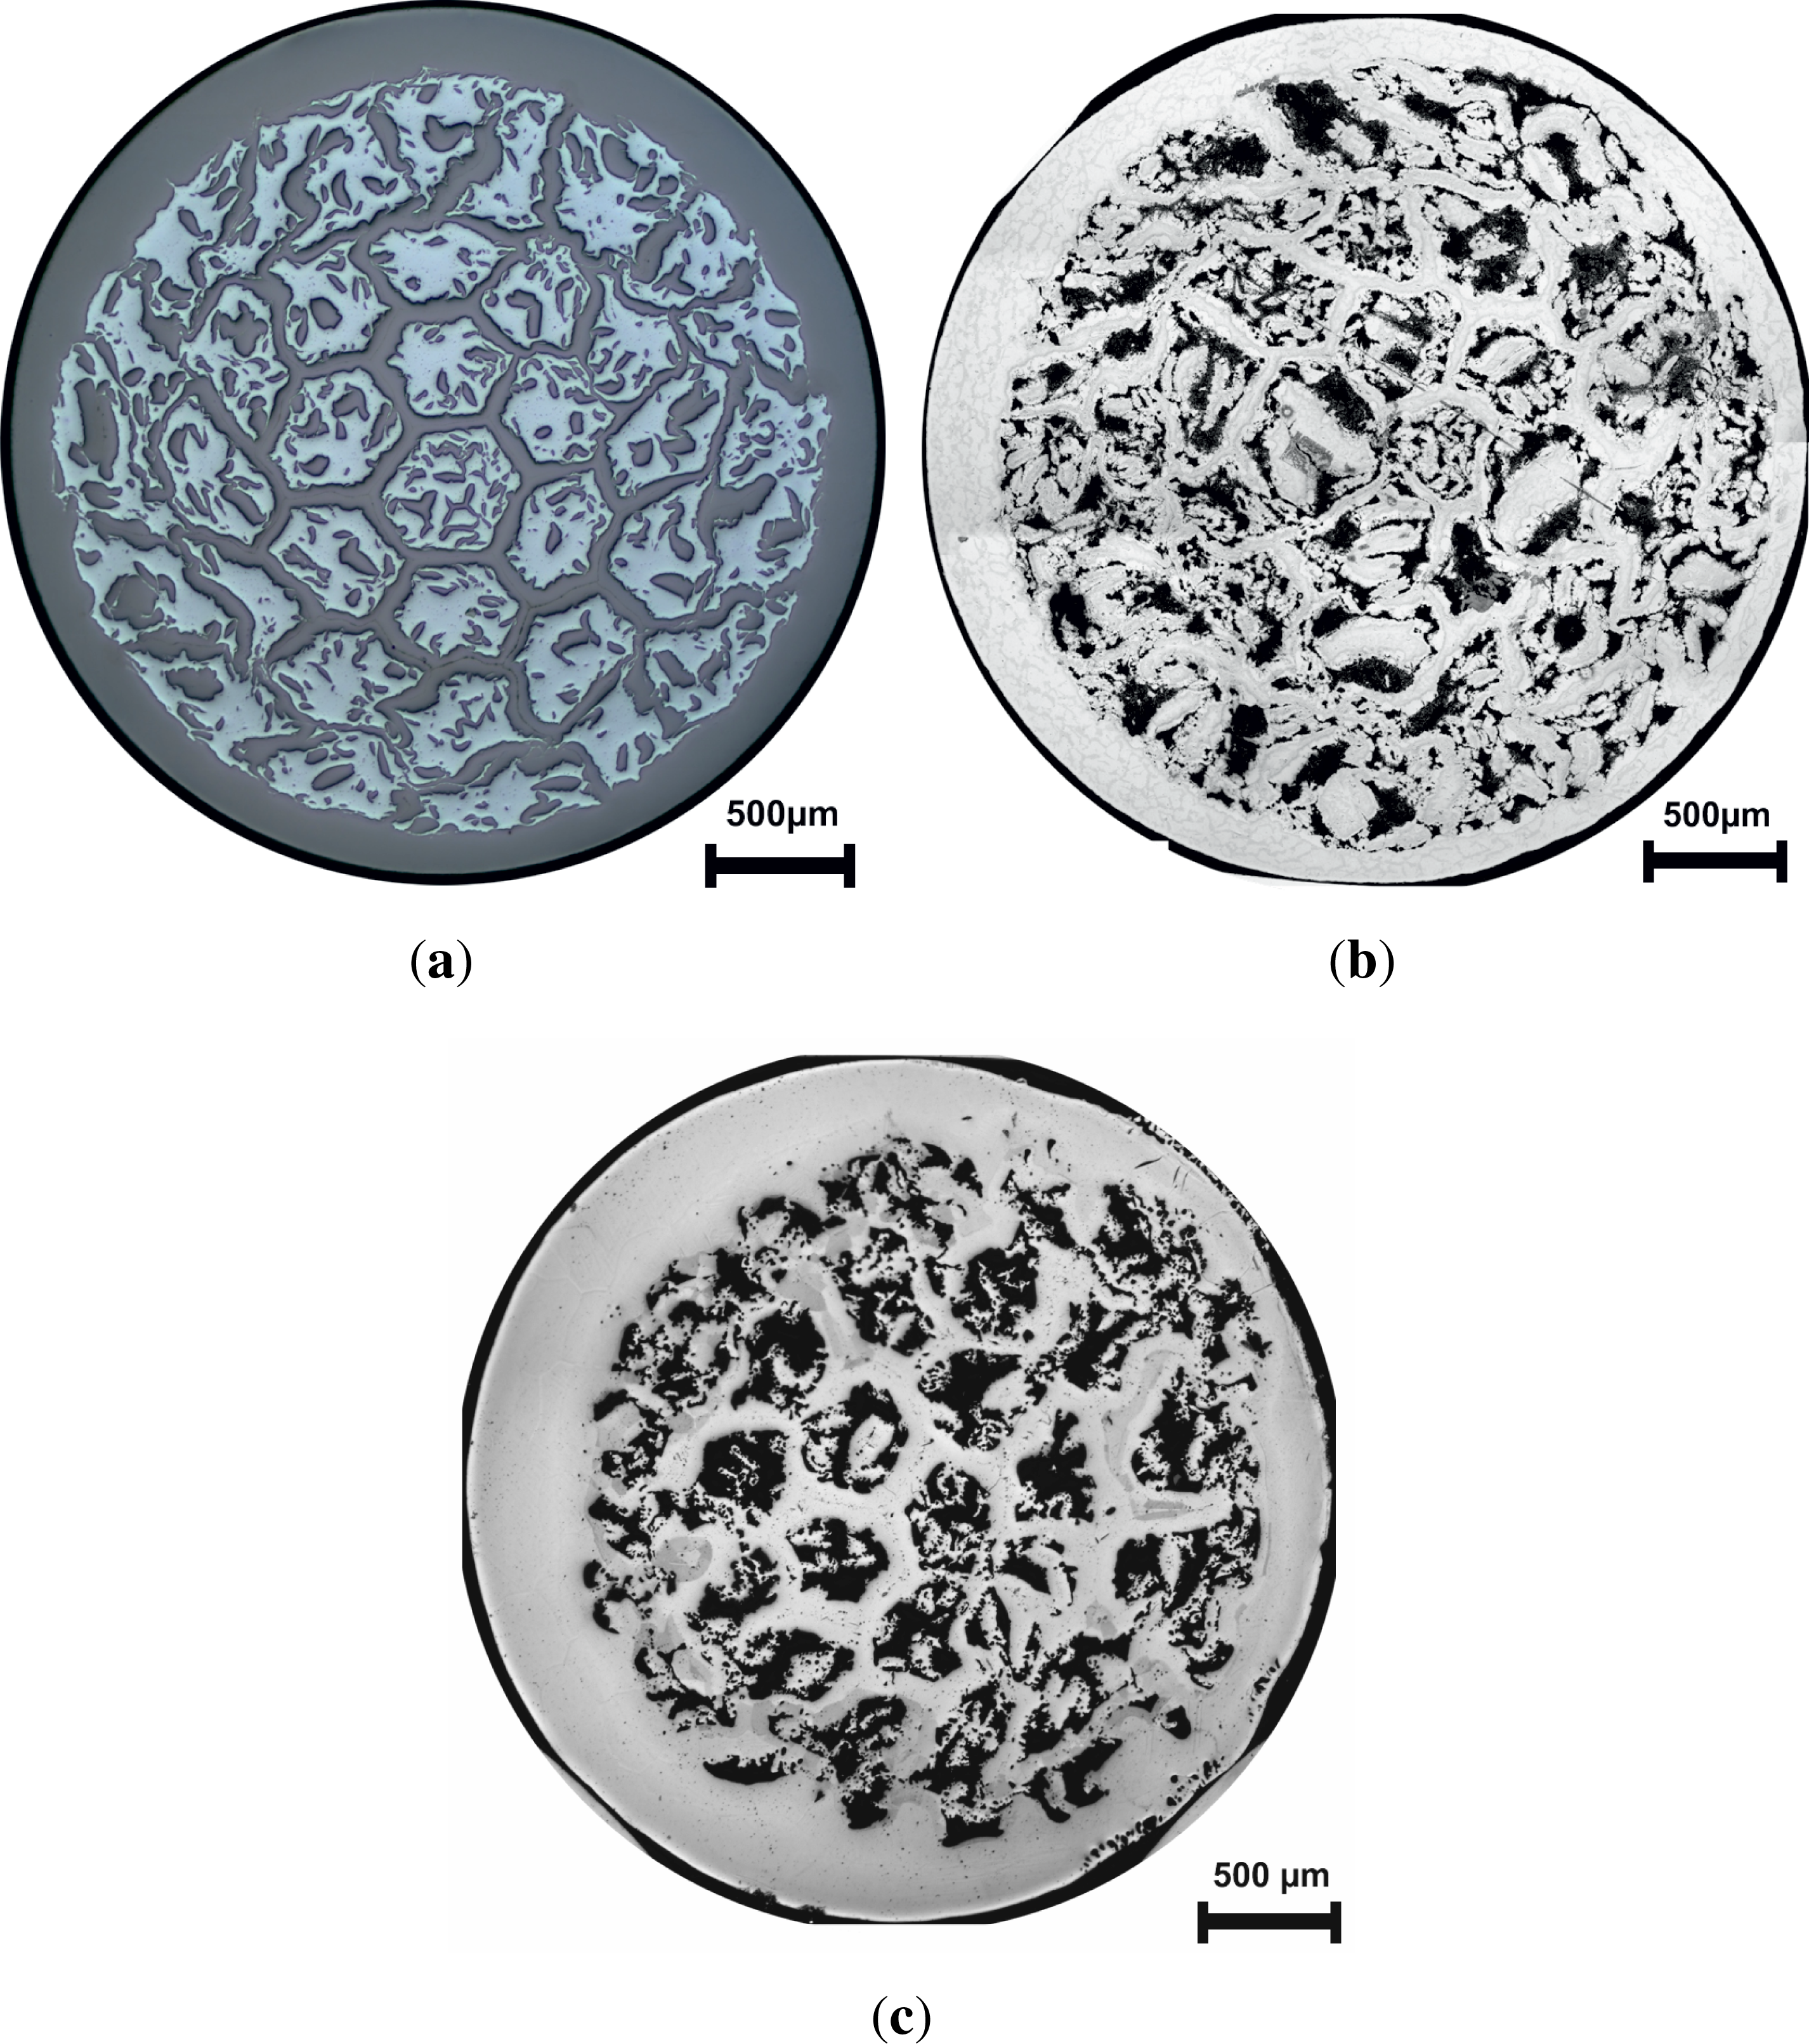
The cross section of the as prepared wire is shown in Figure 1a. The bright and dark phases refer to Al and Ti, respectively. The wire mass density at this condition is 3.71 g cm−3. That value implies a composition of 45.3 at% Al and 54.7 at% Ti, neglecting alloying elements in the Al alloy. Therefore, the intended atomic ratio was not exactly reproduced. This is due to inhomogeneity of deformation at the beginning, as already stated.
Al and Ti are irregularly dispersed in the center of the wire cross section; the original filaments are broken due to the strong deformation during processing. Nevertheless, diffusion paths should be short enough to allow for complete phase reaction within finite time. The wire is shielded by Ti, which means that the longest diffusion paths during the following heat treatments occur at the very outside of the wires.
Figure 1b shows the cross section after low temperature heat treatment at 580 °C for 116 h. A large number of voids are visible and a closer look reveals an indication for a two phase composition of the remaining microstructure. The two phases correspond to Ti and TiAl3, as will be given proof in Section 3.3.
The observed pores in this phase reaction are usually referred to as a consequence of the differences in the molar volume of the starting materials and the end products of the reaction as well as to the Kirkendall effect [18]. The difference in molar volume of and weighted with their atomic ratio is only 5.8% compared with . Since the overall composition of the wire is far from 25:75 (at%) Ti:Al, not the whole material participates at this phase reaction, as can be seen from Equation 1:
Following this argumentation, pores resulting from the different molar volume should be even less than 5.8% of the wire cross section. However, the area fraction of pores after the phase reaction in the wire cross section is estimated to be 11.8%. Table 2 shows all measured geometrical data and mass densities of the wires before any heat treatment, after 116 h at 580 °C, and after the reaction annealing at 1300 °C for 12 h.
The high porosity value of roughly 12% indicates that other aspects than the differences in molar volume are dominating the observed void formation. One possibility is the Kirkendall effect, which without doubt plays a role in the Ti–Al interdiffusion system. After annealing, an increase of the wire diameter from 2789 ± 5 μm to 2966 ± 10 μm is observed. This increase in cross sectional area of 11.5% correlates with the observed porosity.
It is believed that this is mainly due to the strong diffusion of Al into Ti at 580 °C. However, there is also evidence that the opposite behaviour is the case for this diffusion couple [17,20], namely that Ti is predominantly diffusing into the Al rich side. In contrast, earlier works show that the only diffusing element in that system below 660 °C is Al [21]. The increase in wire diameter in the present work indicates an effective material transport from the inside (Al rich) to the outside (Ti rich) of the wires. This diffusion will then cause the Ti shell to expand and therefore increase the wire diameter. In the early stages of the phase formation, or at different temperatures this behaviour may differ, but under the present circumstances, Al is believed to diffuse faster within the TiAl3 phase than vice versa. The material transport can even be noticed in the OM images, since the thickness of the former Ti shell expanded when comparing Figure 1c with Figure 1a or 1b.
Figure 1c shows the wire cross section after the final heat treatment at 1300 °C. The wire diameter has not significantly changed compared with the wire after the low temperature heat treatment. The number of voids is reduced while their size has increased, as it is typical for Ostwald ripening. The overall porosity has increased to almost 17%–18% caused by the effective mass transport from the inside of the wires to the outside in order to reduce the concentration gradient.
3.2. Microstructure
The focus of the present article is on phase reactions. Other microstructural features and texture of the deformed state are already discussed in more detail elsewhere [11].
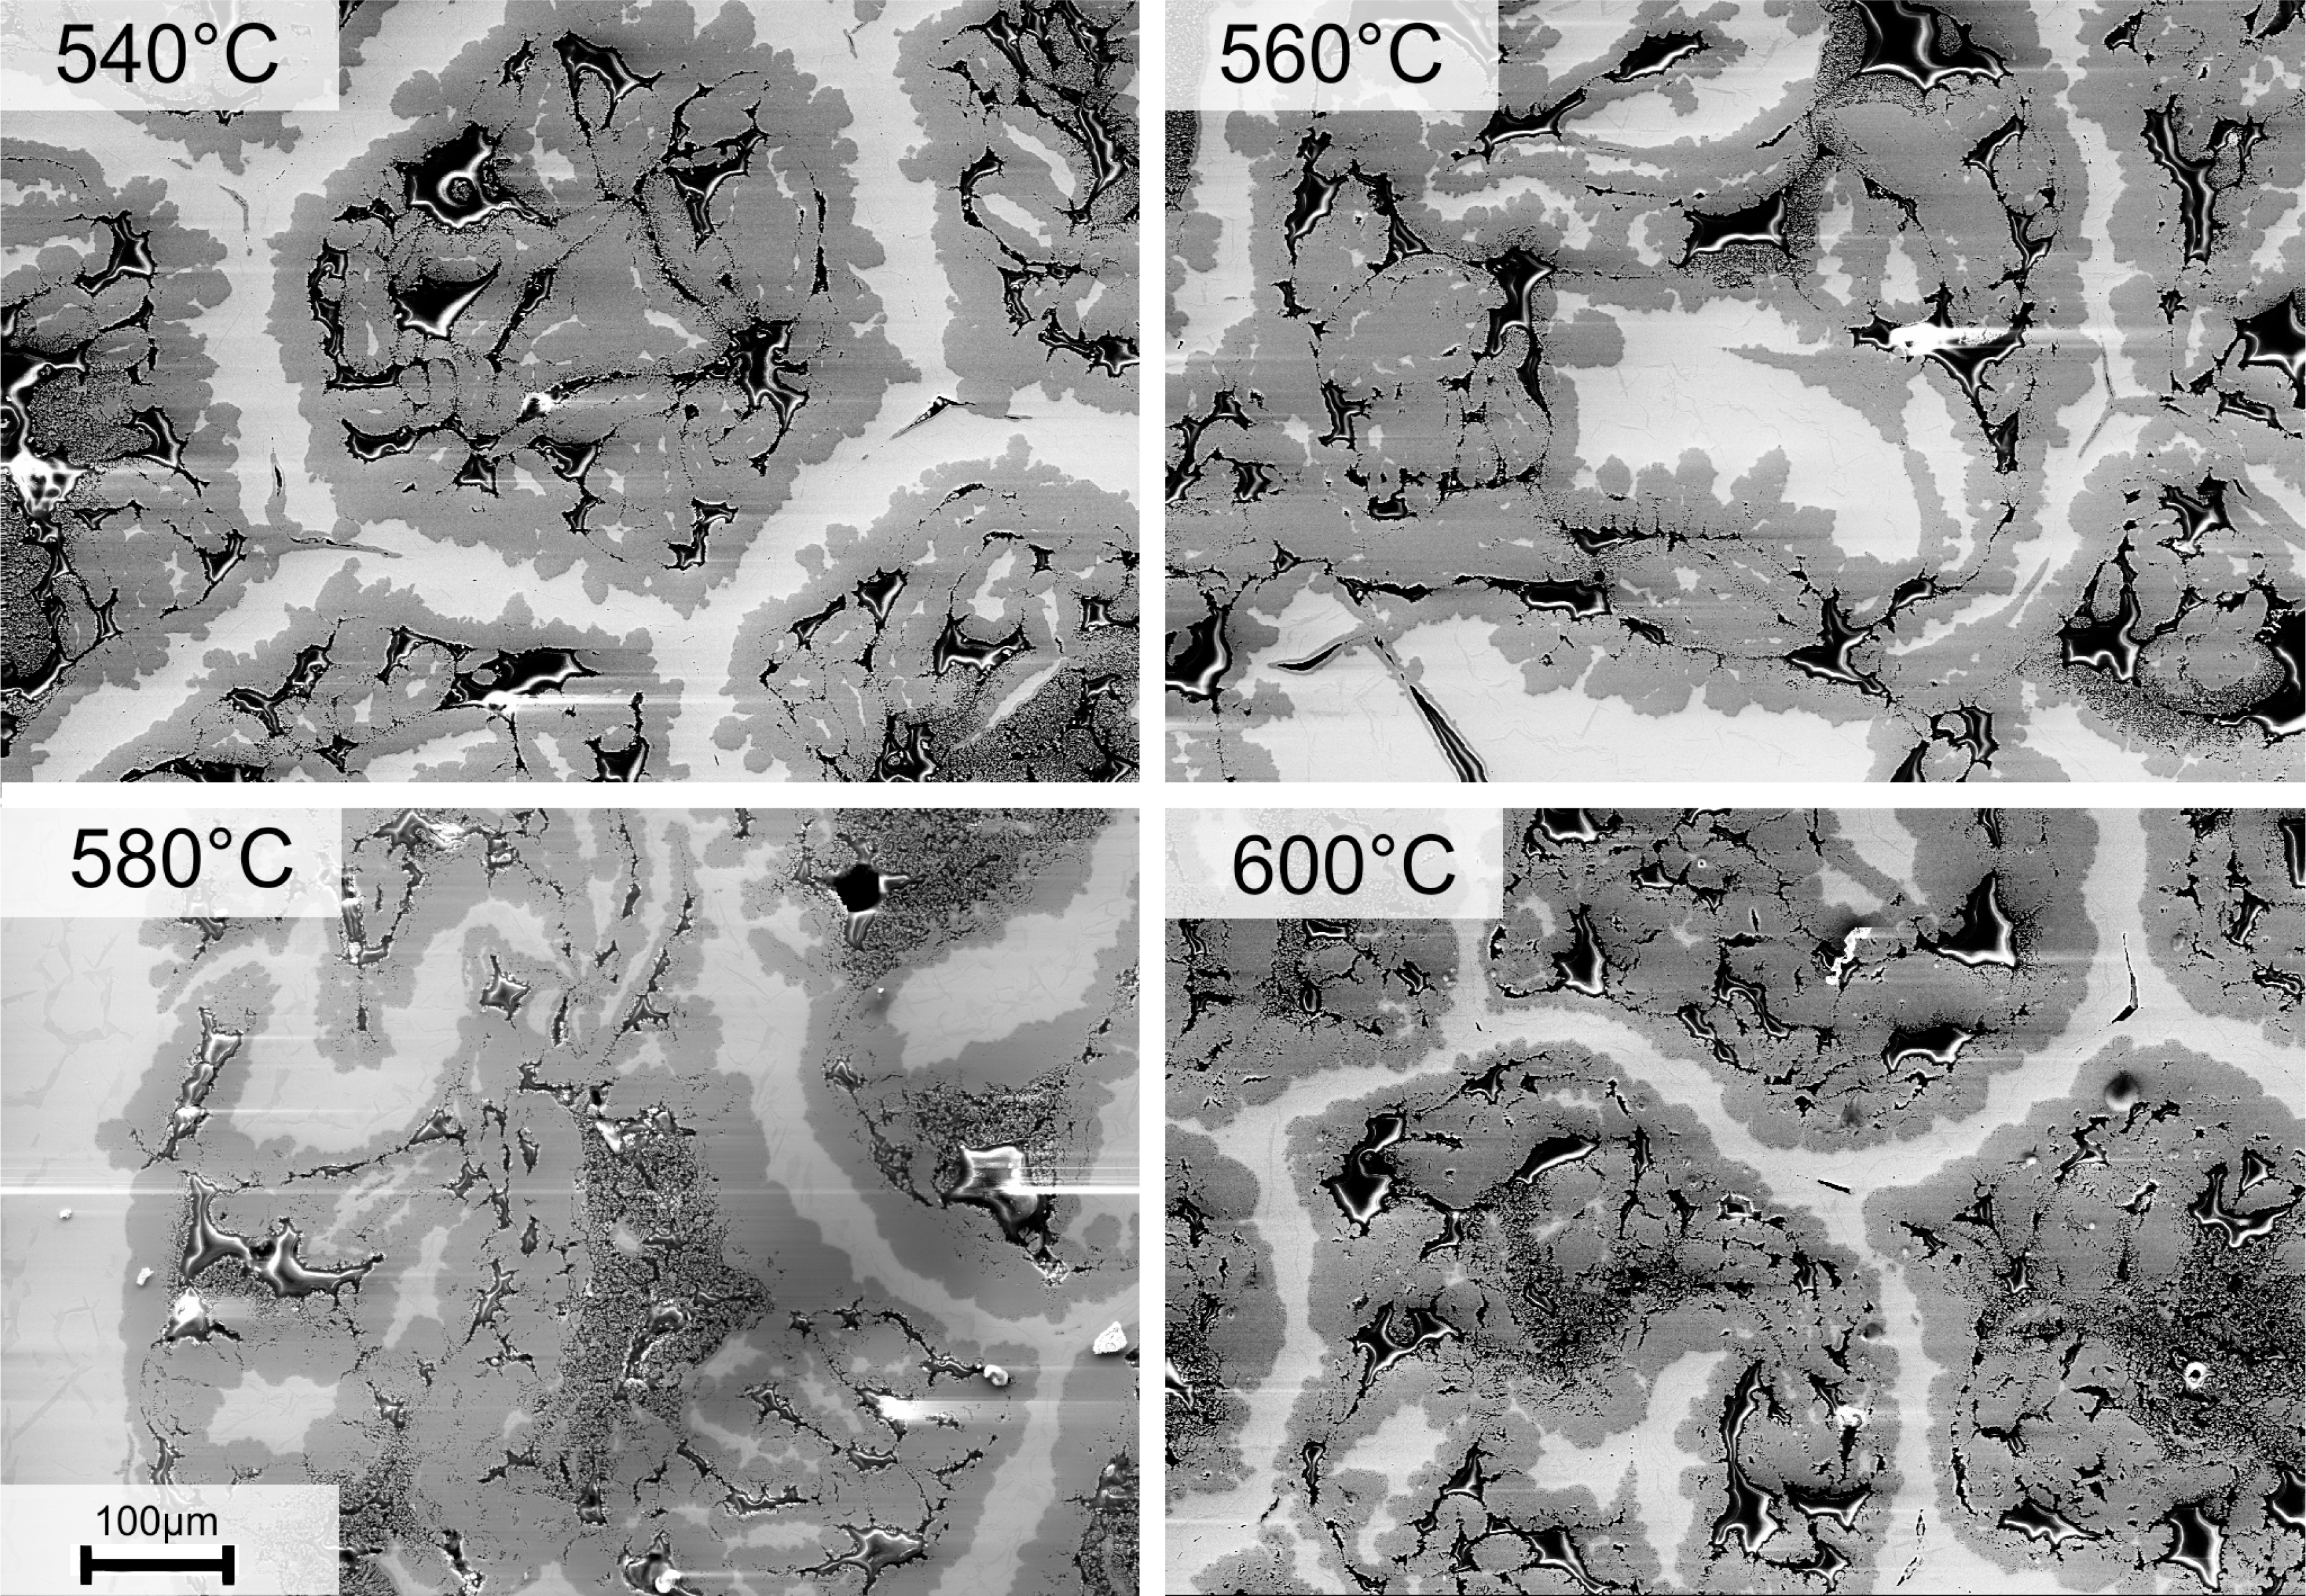
While the initial microstructure of the as-deformed state is only composed of Al solid solution and commercially pure Ti, it completely changes after heat treatment. Figure 2 shows the wire microstructure after all low temperature heat treatments applied. Al is completely consumed by the reaction of Al and Ti to TiAl3 (dark grey), while still a significant amount of Ti (bright phase) remains as bridges enclosed by TiAl3. Many voids have formed, but they have already been discussed. By eye, there is no obvious difference in morphology of the phases visible within the temperature range shown. The microstructure looks similar for all cases, except that the Ti bridges are thinner for the highest temperature when comparing 600 °C and 540 °C. The interface lines also look more serrated for the lower temperatures.
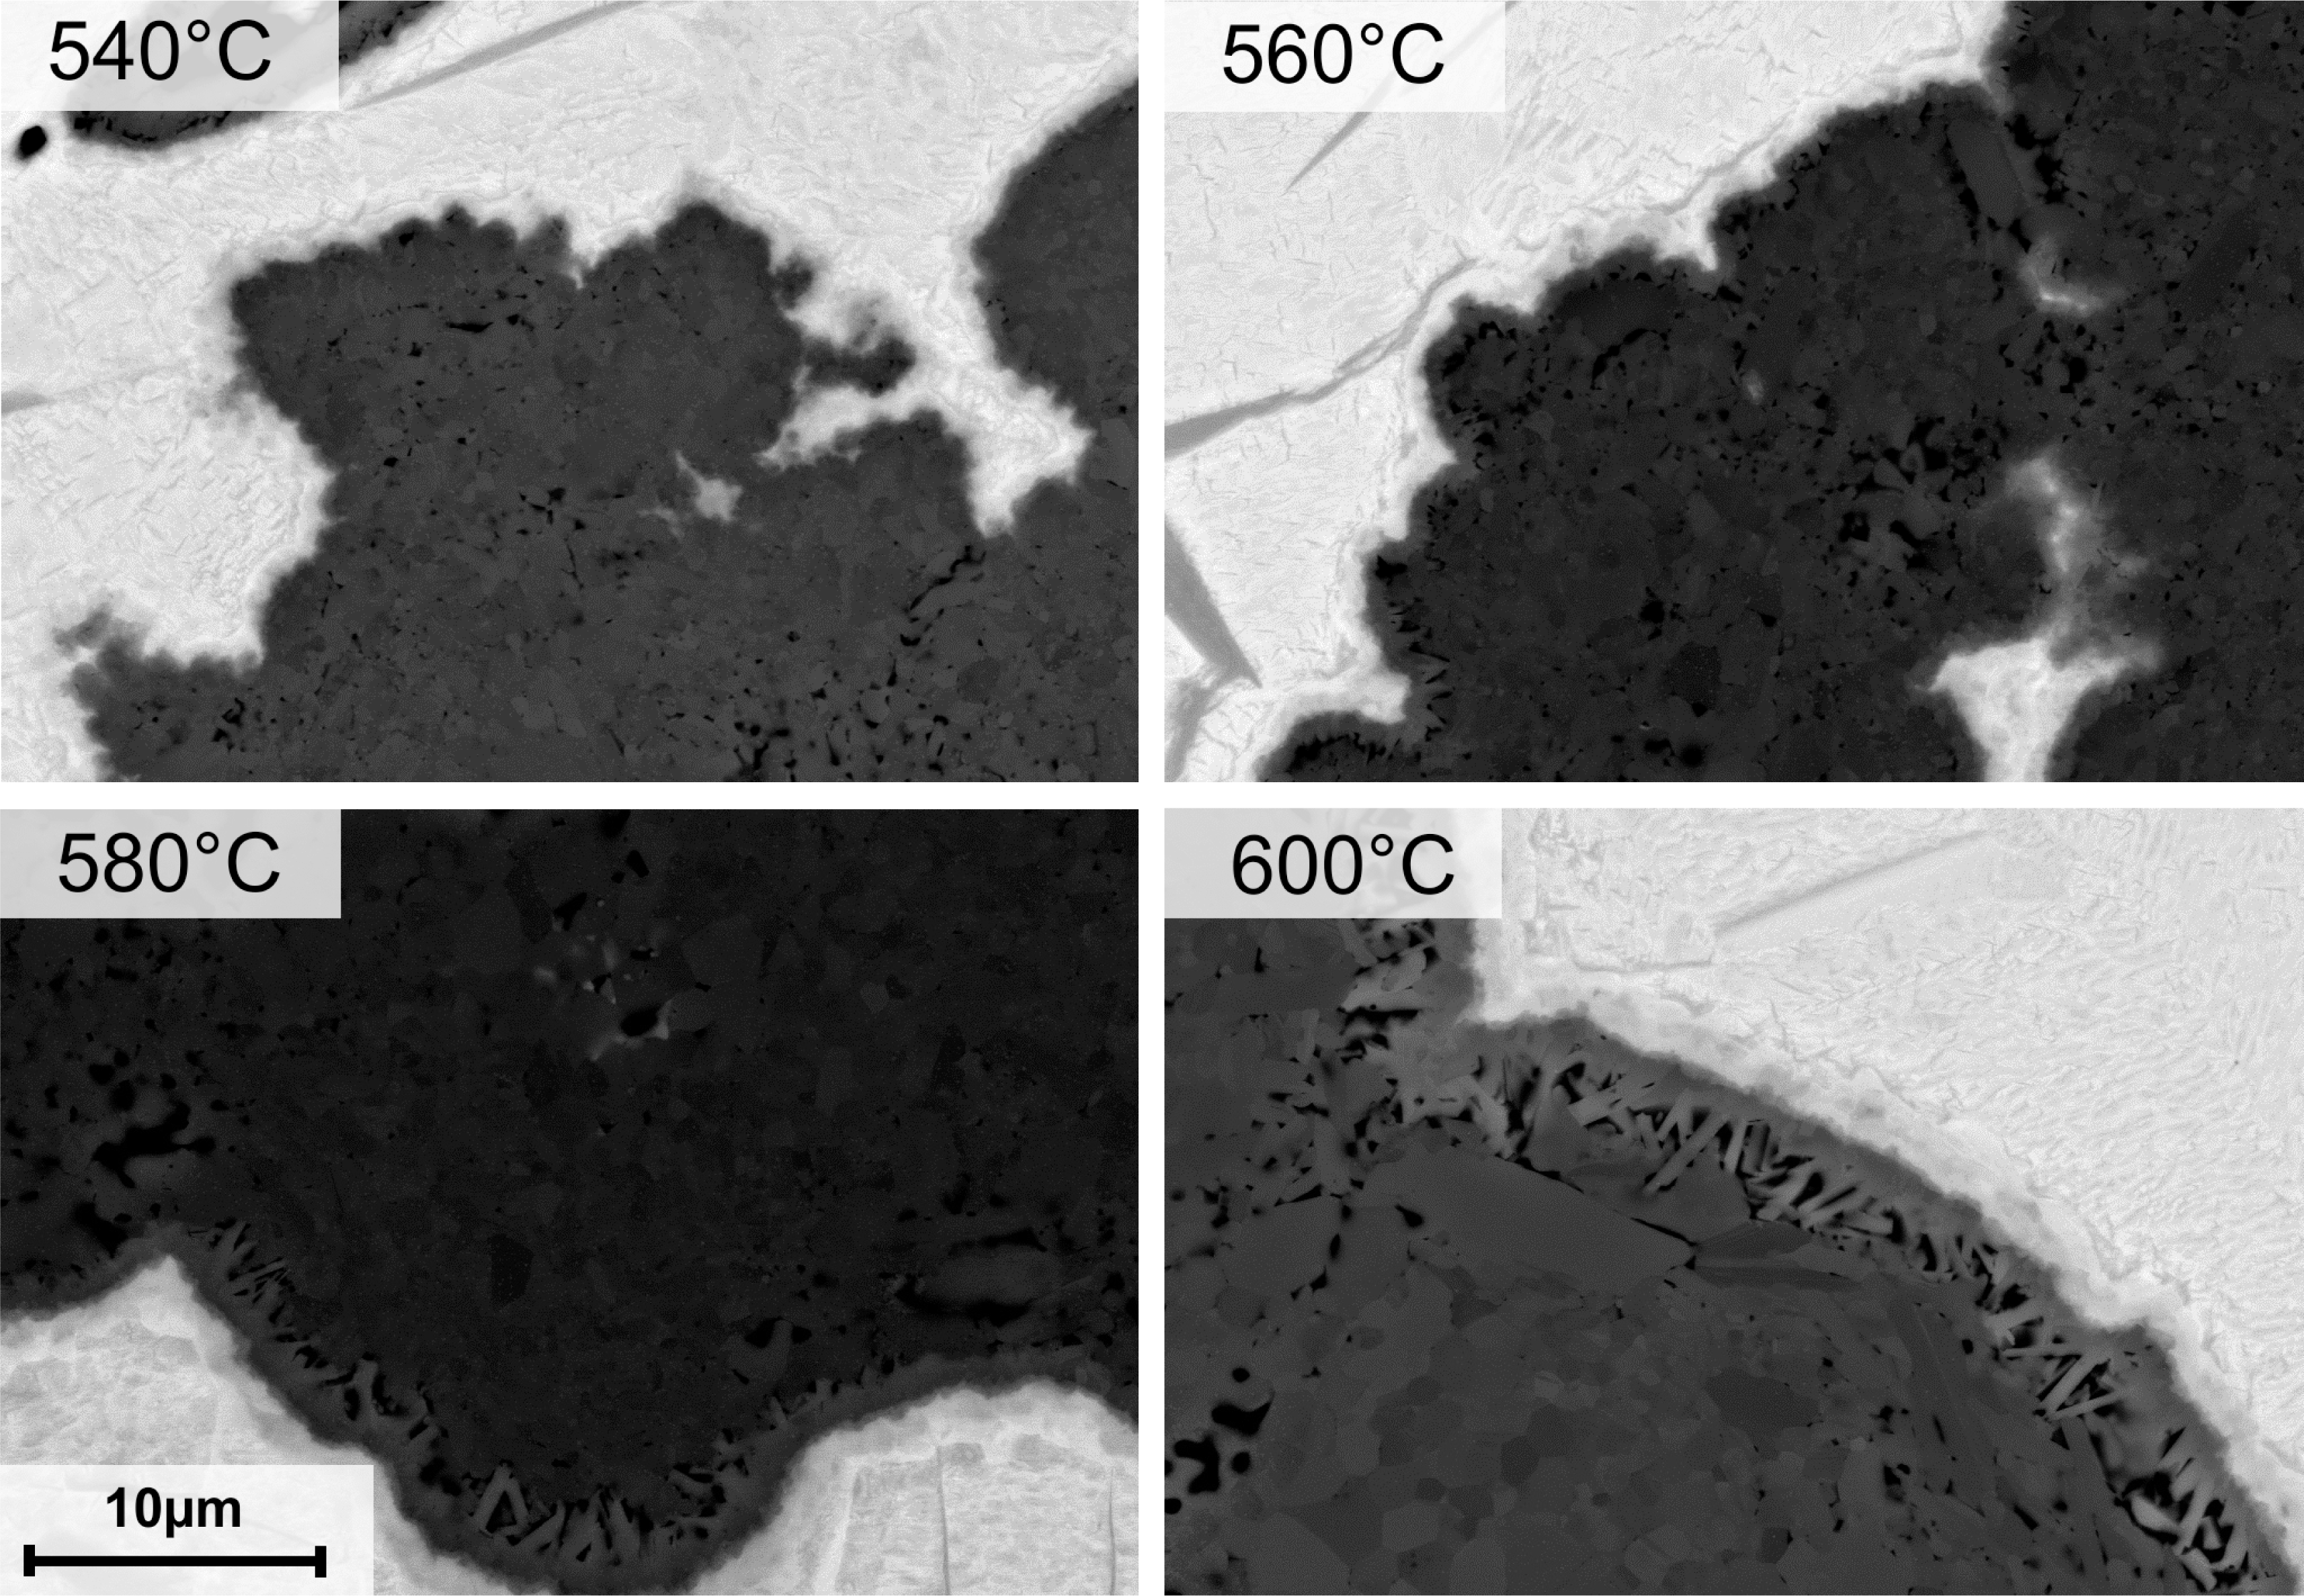
This is better seen at higher magnification in Figure 3 and indicates a change in kinetics that is also observed and discussed in Section 3.4. A change from interphase to volume dominated diffusion may be one possible explanation for this observation.
Additionally, the phase visible in between Ti and TiAl3 after all heat treatments is found to be more pronounced at higher temperatures. Although this interface layer is too narrow to be reliably analyzed by EDX in the SEM, Figure 4 indicates that it might be composed of Ti3Al and TiAl2. Anticipating the further discussion, the rising resistivity in case of the 580 °C and 600 °C heat treatment (black arrow) after completion of the phase reaction shown in Figure 5 also indicates the growth of at least one additional phase after formation of the TiAl3.
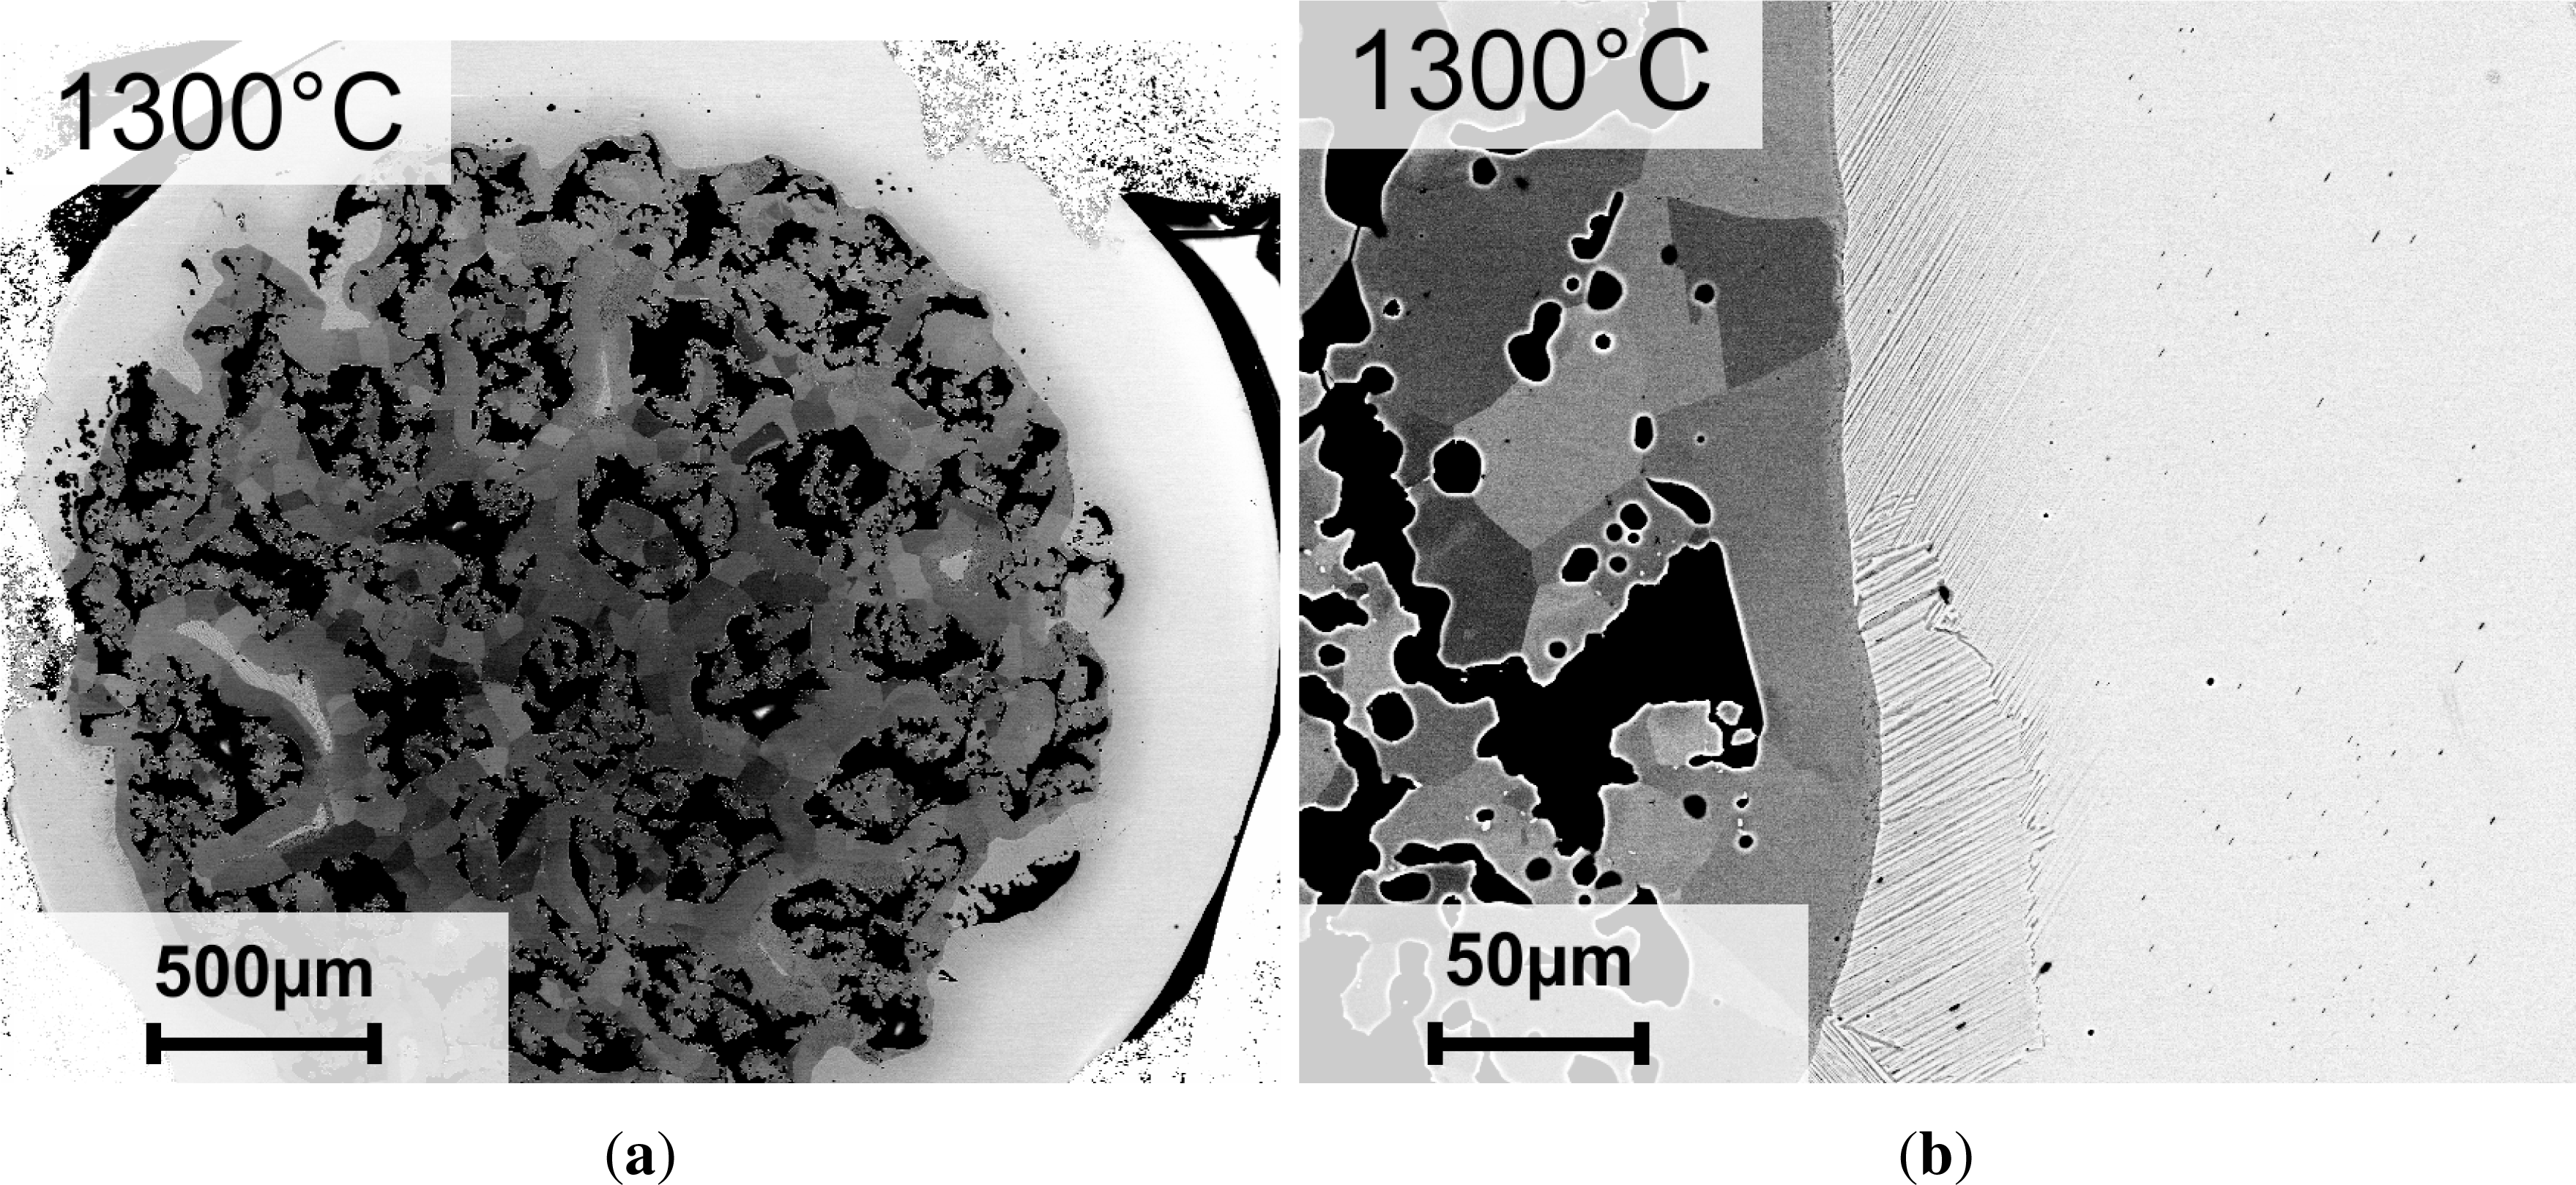
The microstructure after the reaction annealing at 1300 °C is shown in Figure 6. Compared with Figure 1c, Figure 6a shows a strong phase contrast indicating at least two separate phases. Figure 6b shows the outer region (Ti-rich) of the wire close to the surface, which is composed of lamellae. These lamellae become finer the closer they get to the surface of the wire (right side in the image). Section 3.3 will give proof that the dark inner part of the wire is composed of γ-TiAl, while the outer region is two-phased with lamellae of γ-TiAl and Ti3Al.
3.3. Phase Identification
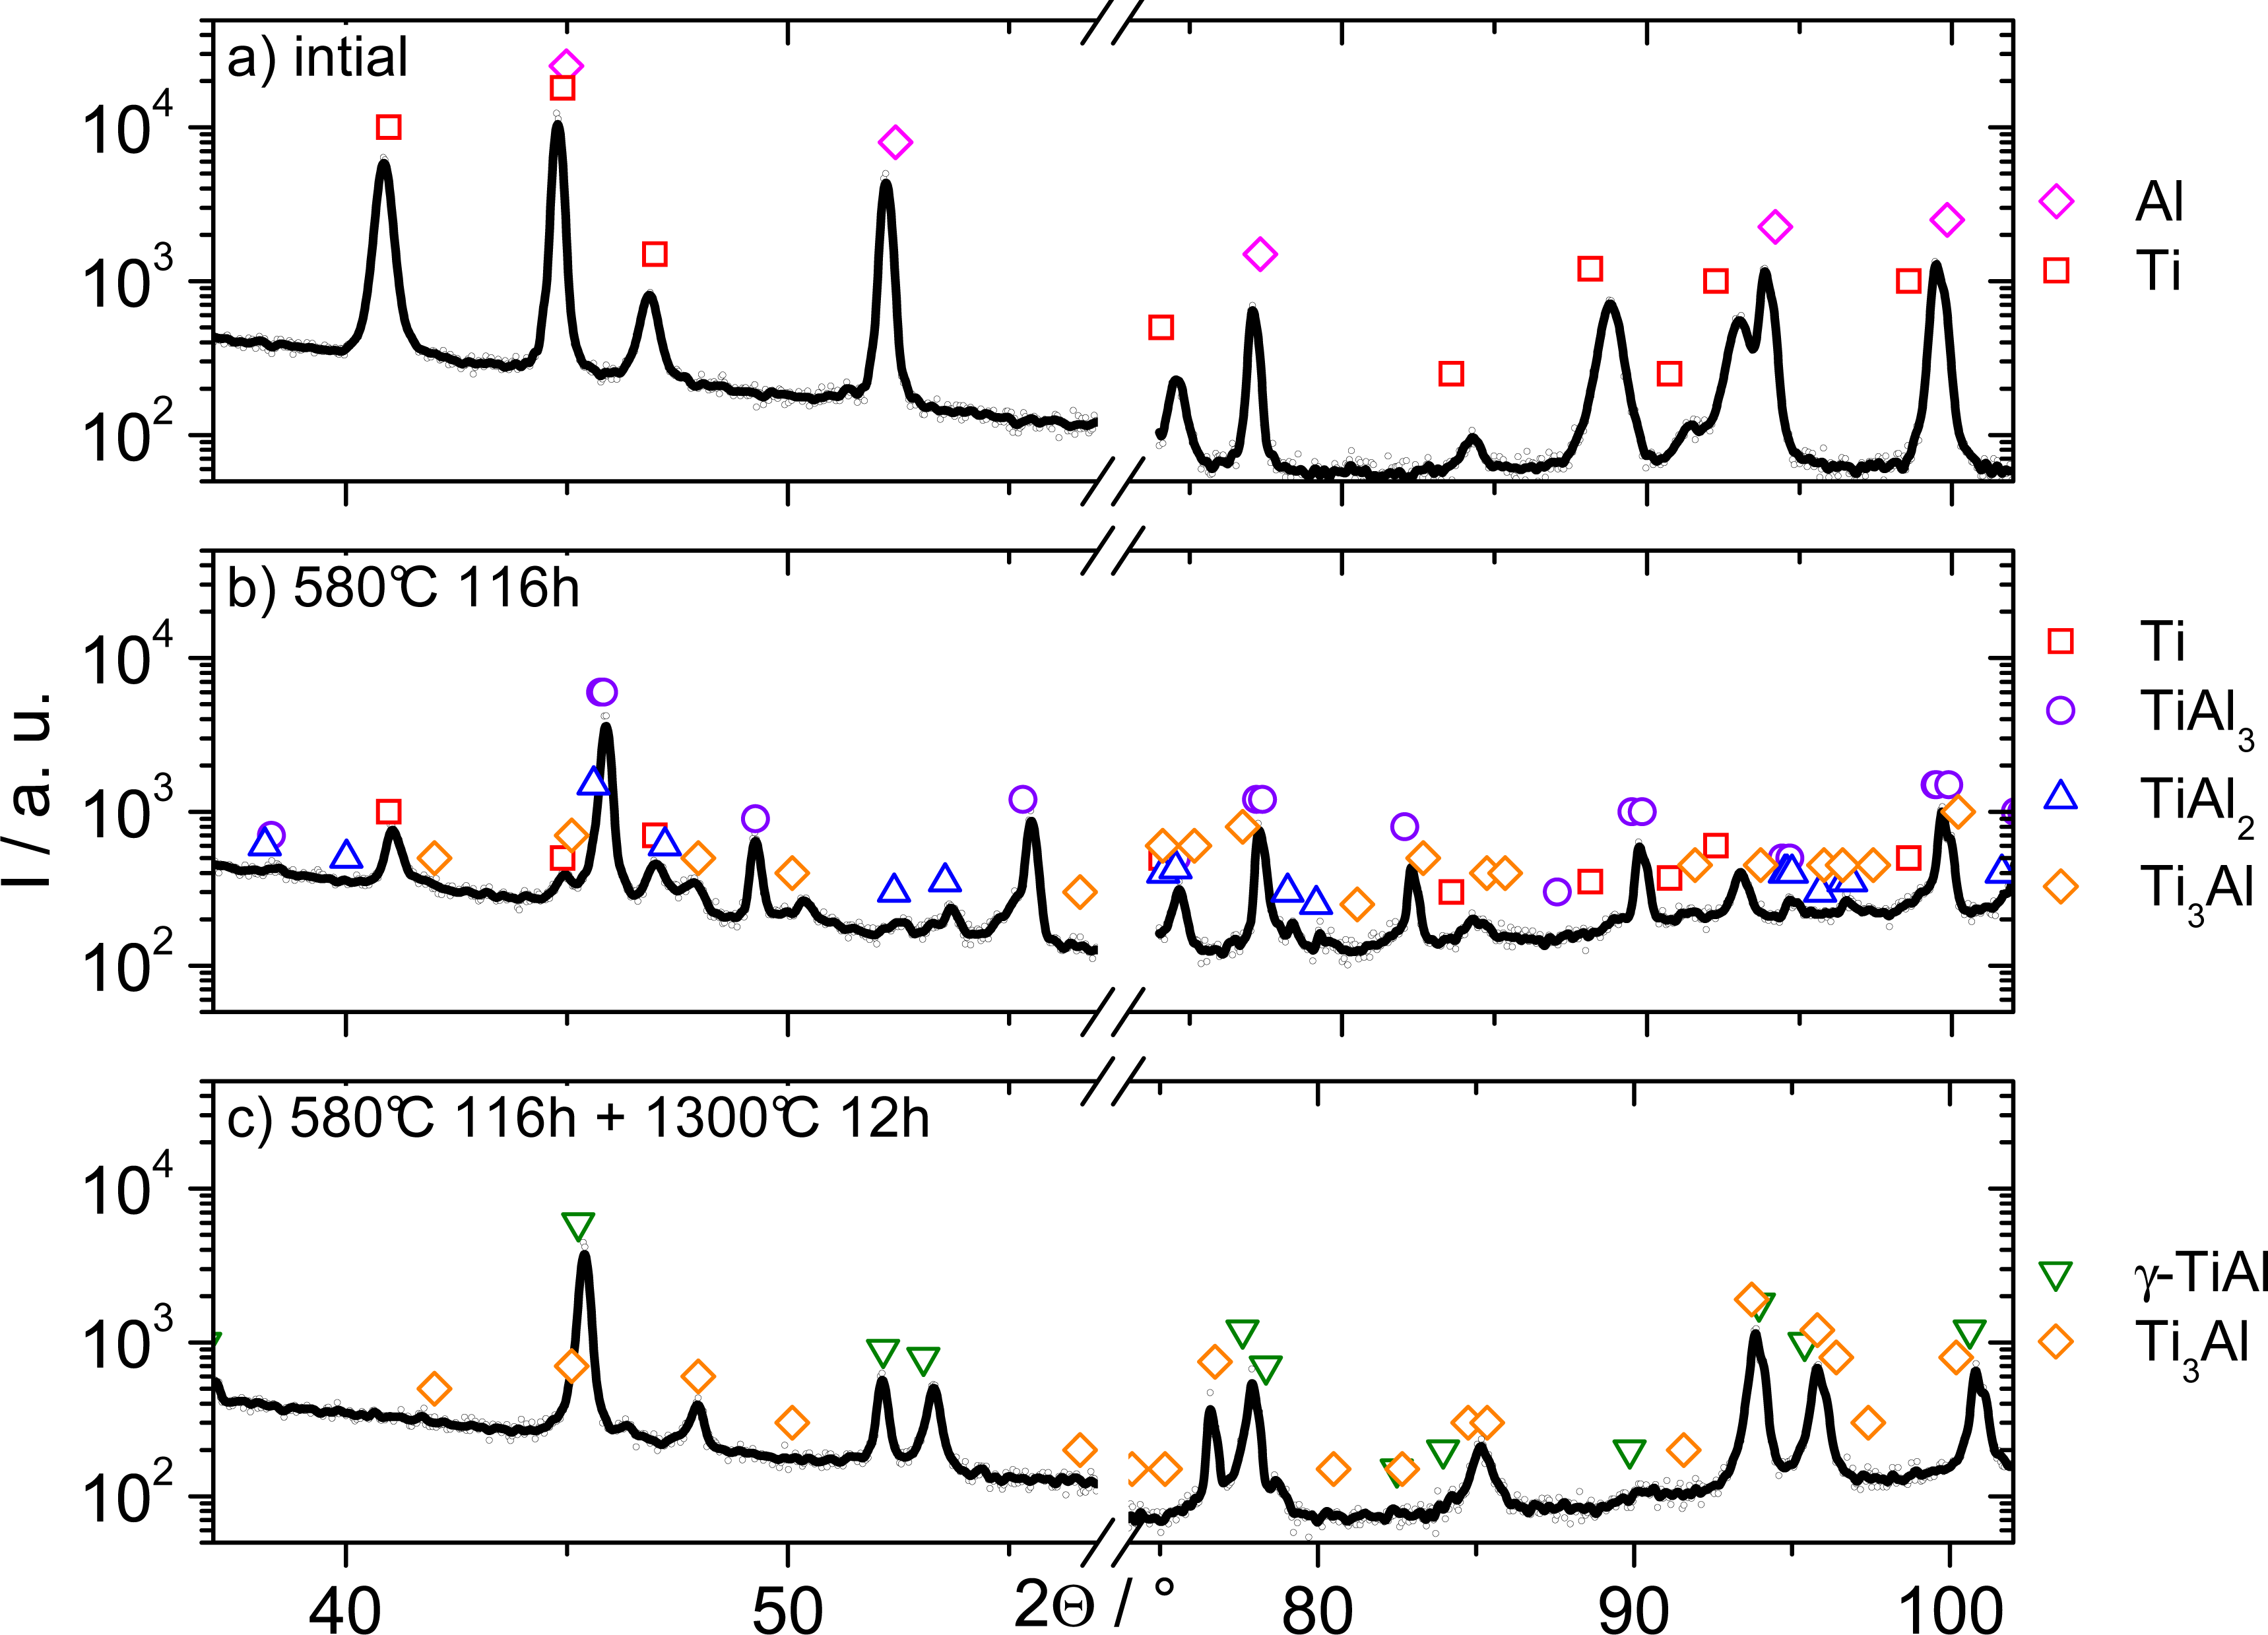
Figure 4 shows two sections of the X-ray diffractograms of the initial wire, the initial wire after the intermediate temperature heat treatment and the one additionally heat-treated at 1300 °C. Some high indexed reflections were removed for clarity reasons. Directly after processing, in Figure 4a, only Al and Ti reflections are visible. Their intensity ratios indicate a strong deformation texture, which is expected when considering the wire processing route and is proven elsewhere [11].
After a heat treatment at 580 °C (Figure 4b), four different phases are observed: Ti, TiAl3, TiAl2 and Ti3Al. TiAl3 is the dominant phase formed during the prior phase reaction. TiAl2 and Ti3Al only exist in small quantities, indicated by their low overall intensities. These phases developed after completion of the TiAl3 formation. Figure 5b gives also proof to this assumption by a slight increase in resistivity for the highest three temperatures after reaching the saturation level of about 0.9 · 10−6 Ωm (black arrow). This increase gives sign for further (but slower) phase reactions, which will then result in the formation of all other equilibrium phases according to the phase diagram. γ-TiAl is not observed in this temperature range.
After the high temperature reaction annealing, only two phases remain in the microstructure. Figure 4c shows reflections of γ-TiAl and Ti3Al, which are the expected equilibrium phases for the overall composition.
3.4. Kinetics of TiAl3 Phase Formation
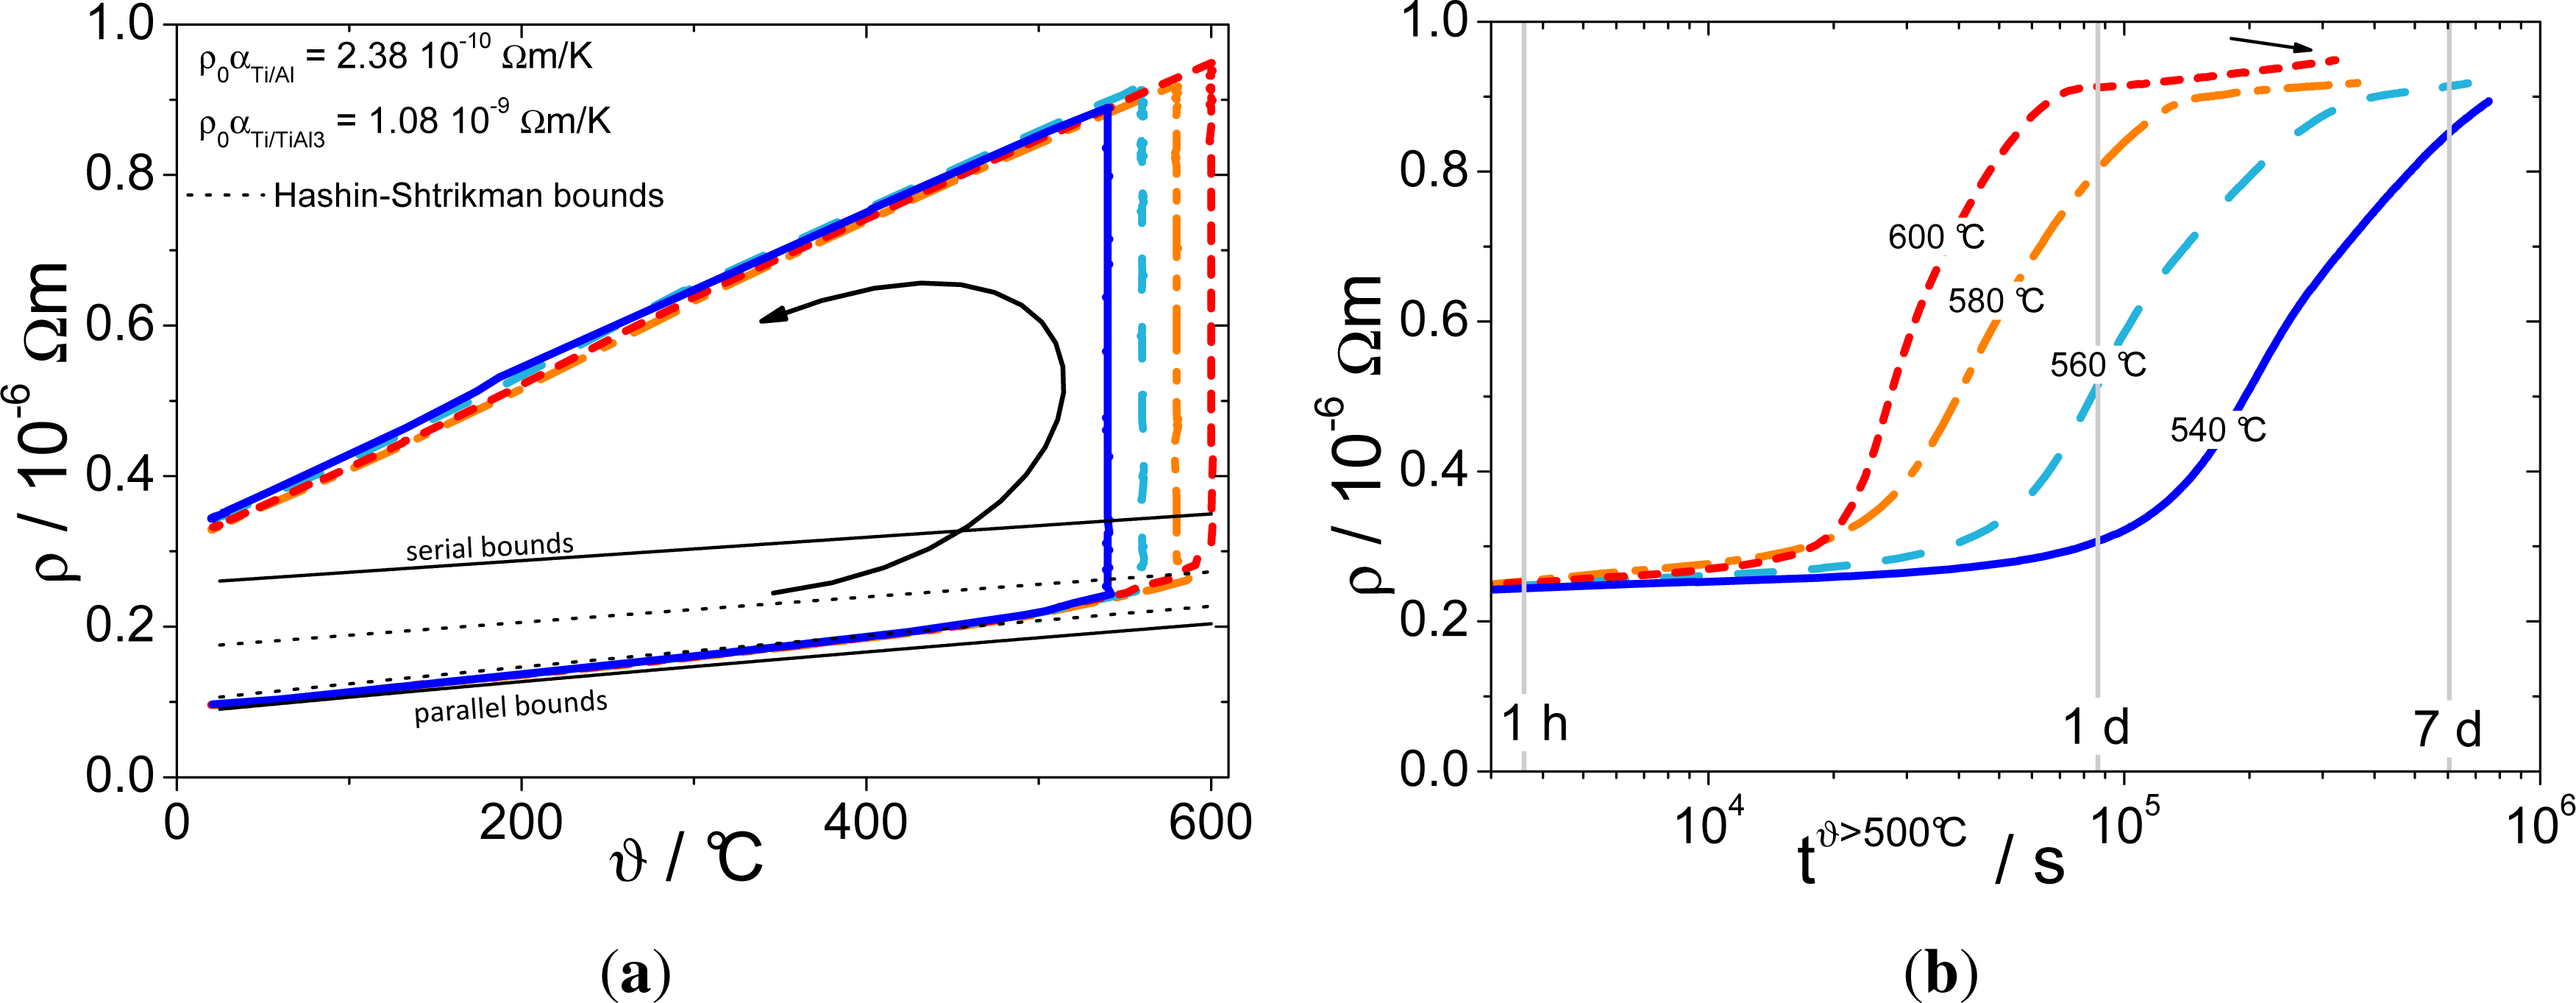
Figure 5 presents electric resistivity measurements of the wires at different temperatures. Starting at room temperature, Figure 5a shows a linear increase in resistivity with temperature for all wires investigated in the range between room temperature and 400 °C. Above 400 °C, an additional increase compared with the linear slope before is observed. This indicates the onset of a phase reaction according to Equation 1. For this reason, isothermal resistivity measurements were performed well above this temperature in order to investigate the effect of phase transformations on the electrical behaviour. This is depicted in Figure 5b for temperatures in the range of 540 °C to 600 °C. A decrease of the cross sectional area due to void formation can be excluded as a main reason for the increase in resistivity. The cross section measured before and after the heat treatment at 580 °C is 6.109 mm2 and 6.094 mm2, respectively. This yields a reduction of 0.2%, which is not enough to explain an increase in resistivity by roughly 300%. Doing the same calculation taking the porosity value into account gained by density measurements, the effective cross sectional area even slightly increases after the heat treatment at 580 °C. Therefore, the increase in resistivity is discussed with regard to the phase transformation according to Equation 1.
The data presented in Figure 5a allows a detailed study of phase arrangement of Ti and Al in the as-prepared state. By using specific room temperature resistivities ρ0 of 4 · 10−8 Ωm and 43 · 10−8 Ωm and resistivity temperature coefficients ρ0 α of 1.825 · 10−10 Ωm/K and 1.2 · 10−10 Ωm/K for the Al alloy [22] and Ti [23], respectively, general models describing the temperature dependence of the resistivity of the compound can be applied. As expected from the deformation procedure, the assumption of parallel connection of Al and Ti is a good approximation of the temperature dependence of the electrical resistivity of the compound. Another description of the compound can be given by adopting the Hashin–Shtrikman bounds. Assuming Al as matrix material in which isotropic Ti is homogeneously distributed, the observed temperature dependence of the compound material can be well described, too.
As can be seen in Figure 1a, the initial filament structure is destroyed during accumulative swaging and bundling due to necking of the Ti, which is commonly observed in Ti-Al composites [9,10,17,24]. Thus, the composite can be treated as an Al matrix with Ti particles embedded within the large scale filaments of the second stacking. The larger filaments themselves do not break up and behave more like a parallel arrangement. This is probably the reason why the measured resistivity curves are in between the parallel and the lower Hashin–Shtrikman bounds (Figure 5a).
After reaching the nominal temperature, the reaction starts after a temperature dependent incubation time, which indicates that the reaction is dominated by nucleation and growth. After the incubation time is reached, the resistivity increases with a very fast rate until saturation is reached. Above the inflexion point, the reaction continues noticeably slower than expected from the beginning of the reaction. This is probably due to a lowered diffusion rate due to void formation.
According to the work of van Loo and Rieck [21], TiAl3 is the only phase that is formed during the reaction in spite of possible interface layers as long as non-reacted Al is still existent. This is due to the high diffusivity of Al in TiAl3. Other phases do not start to develop before the entire Al is consumed by the reaction. The slight increase in resistivity for the samples annealed at the highest temperatures after reaching the saturation level indicates the start of a second phase reaction, e.g., TiAl2 or Ti3Al, as already discussed. The formation of all possible aluminides once all Al reacted to TiAl3 is also reported by van Loo and Rieck [21].
During cooling, the linear slope of the resistivity of the wires, ρ0 α, has significantly increased from 2.38·10−10 Ωm/K to 1.08·10−9 Ωm/K (Figure 5a). This value corresponds to the new composite, consisting of Ti and the titanium aluminide mixture.
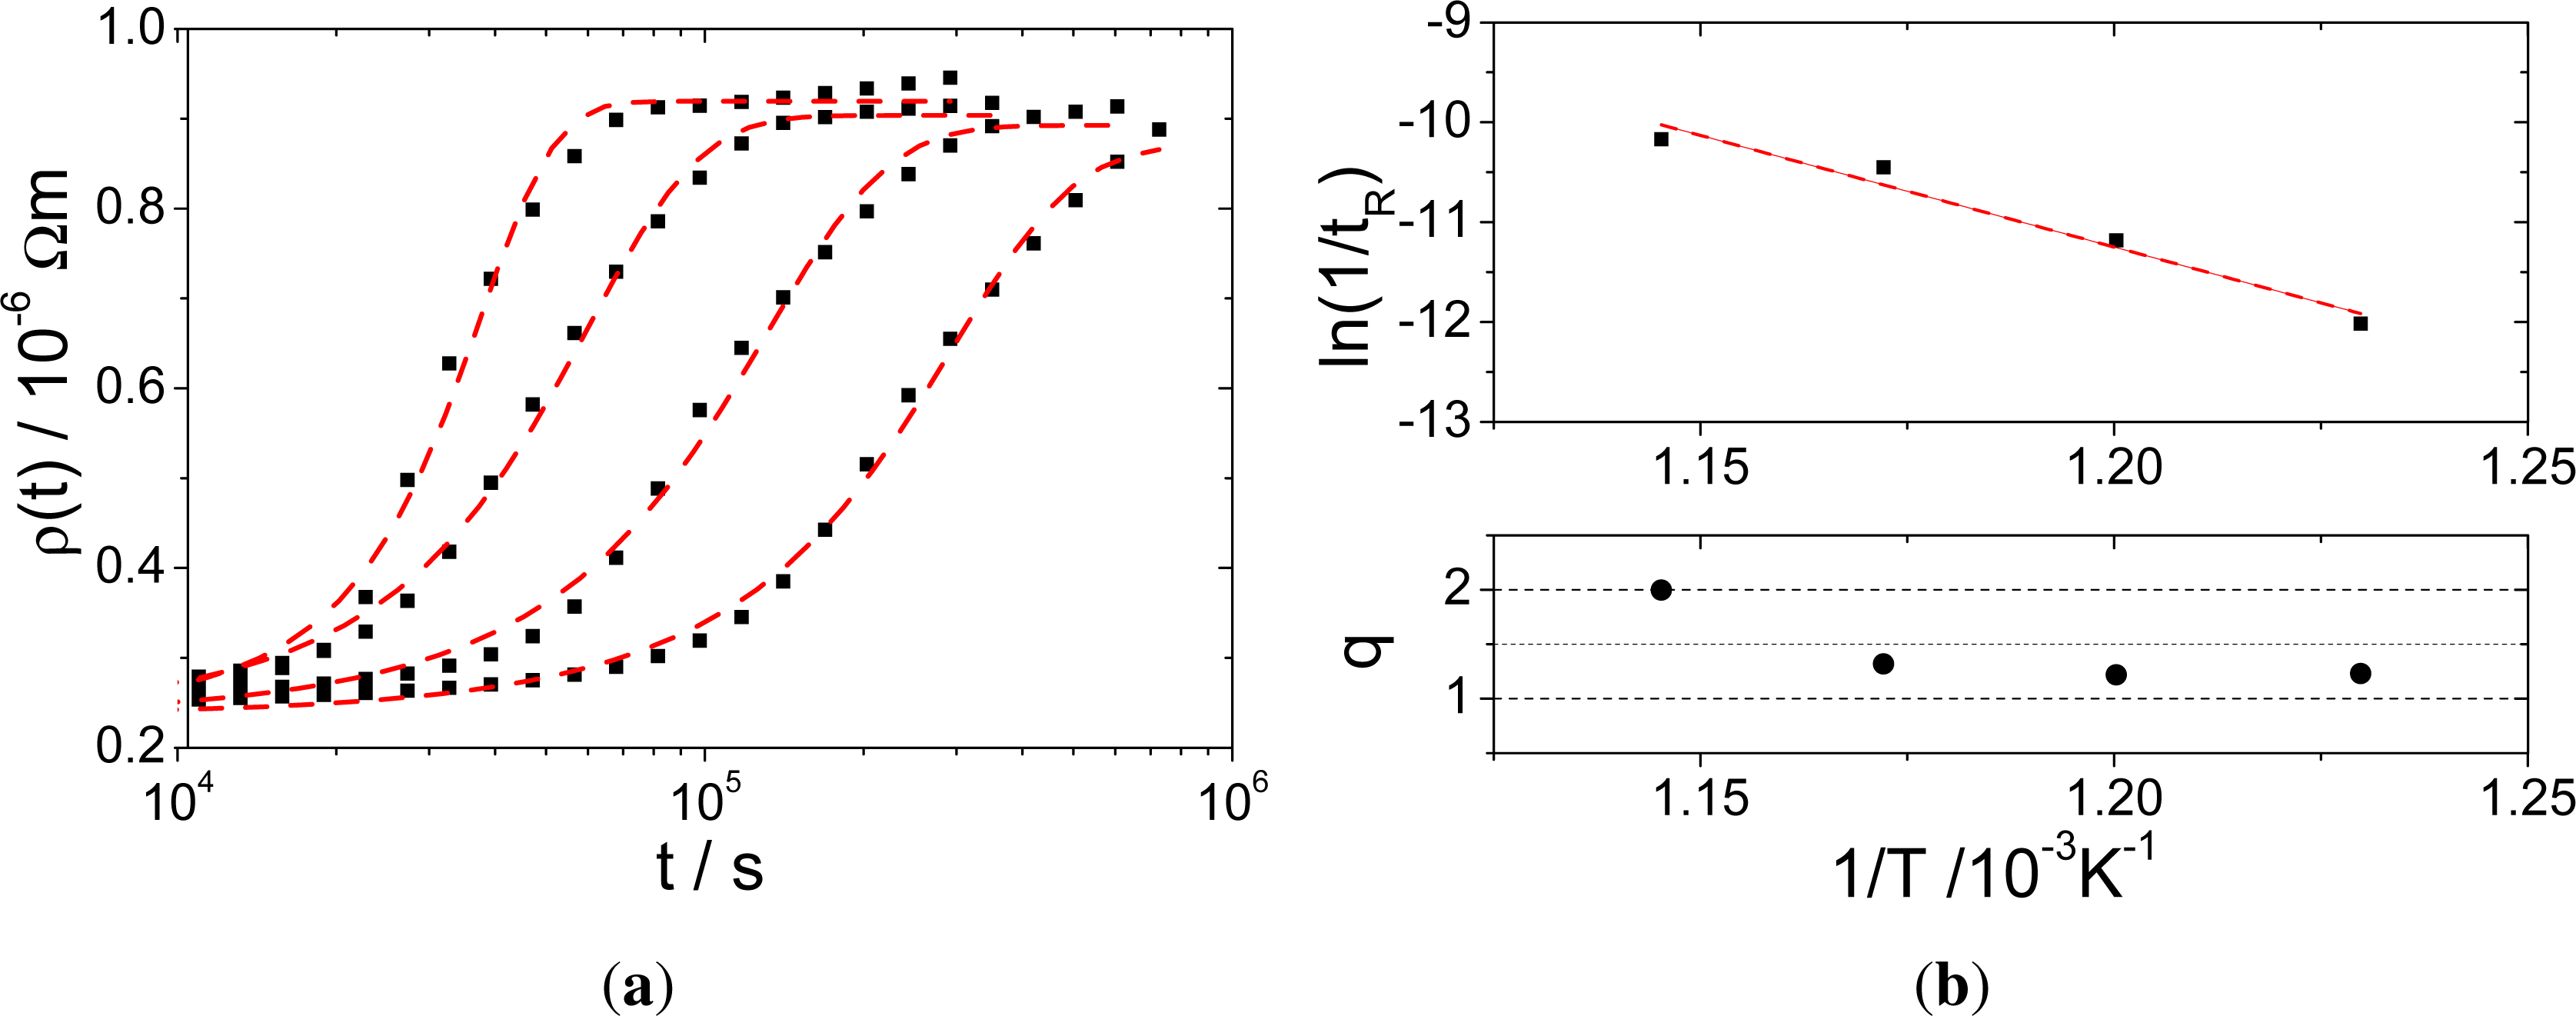
To characterize the phase reaction, the curves in Figure 5b were fitted using the JMAK equation [25] for the normalized reacted volume fraction v(t) given in Equation 2 to obtain the time dependent resistivity value ρ(t) (Equation 3) in the range of the starting ρ0 and the final value ρ1 of the measured resistivity curves:
Note that ρ(t) is assumed to be in parallel circuitry as this was already proven for the linear thermal resistivity behaviour during heating, as shown in Figure 5a.
Despite the fact that certainly not all assumptions made for the validity of Equation 2 in [25] are fulfilled, the fitting parameters tR and q allow an objective characterization of the measured time dependency for all temperatures. Original curves and those fitted with Equation 3 are shown in Figure 7a, while the Arrhenius plot of the calculated tR values is shown in Figure 7b. The JMAK equation fits the measured data very well, which is expected for a phase transition based on nucleation and growth. The calculated tR value characterizes the time, after which the volume fraction has been transformed. The activation energy of the phase formation is calculated to 1.92 eV, which is in good agreement with the activation energy for Al diffusion in TiAl3 (1.86 eV [21]). Therefore, it is concluded that the phase reaction is governed by nucleation mechanisms, while the growth is dominated by Al diffusion in TiAl3.
Figure 7b shows the JMAK exponent q as a function of temperature, which is close to 1 for temperatures up to 580 °C and almost 2 for the highest temperature investigated. The JMAK exponent is an indication for the growth dimensionality, which seems to change with increasing temperature. However, there is no visible proof for this assumption from the final microstructure shown in Figure 2 (except for the slight change in phase boundary shape discussed in Section 3.2). Different dominating diffusion mechanisms might be the reason for the change in dimensionality.
4. Conclusions
In the present study, the possibility of processing wires of titanium aluminides using the accumulative swaging and bundling technique is shown. This technique allows room temperature co-deformation of Ti and Al. The atomic ratio of Ti and Al at the end of the deformation process is nearly one. Phase reaction to titanium aluminides is accomplished by a two step heat treatment.
The first step up to 600 °C mostly forms the intermetallic phase TiAl3 until the entire Al in the composite is consumed by the reaction. About 12% of porosity is introduced by this treatment, mainly due to the strong Al diffusion from the center to the wire rim region. Al diffusion is the dominating process during this phase formation since the activation energy for this reaction of 1.92 eV is close to that of Al diffusion in TiAl3. With increasing temperature, the growth mechanism of TiAl3 seems to change from one- to two-dimensional growth, since the JMAK exponent increases from about 1.2 to 2.
A second step heat treatment at high temperature allows homogenization of the microstructure. Due to the initial Ti and Al concentration gradient from the inside to the outside, the final composition of the wires varies from γ-TiAl in the wire center to a lamellar microstructure composed of γ-TiAl and Ti3Al near the wire surface. The final mesostructure and phase composition are governed by the geometry of the Ti tubes and Al rods used.
Acknowledgments
The work of D. Seifert, M. Frey and T. Wolf are gratefully acknowledged. This work has been supported by the Free State of Saxonia in the framework of the European Centre for Emerging Materials and Processes (ECEMP) under contract no. 100111842.
References
- Russell, A. Ductility in intermetallic compounds. Adv. Eng. Mater 2003, 5, 629–639. [Google Scholar]
- Gerling, R.; Clemens, H.; Schimansky, F. Powder metallurgical processing of intermetallic gamma titanium aluminides. Adv. Eng. Mater 2004, 6, 23–38. [Google Scholar]
- Gupta, R.K.; Pant, B.; Agarwala, V.; Agarwala, R.C.; Sinha, P.P. Evaluation of Ti aluminide intermetallics processed through reaction synthesis. High Temp. Mater. Process 2009, 28, 121–132. [Google Scholar]
- Yuyong, C.; Yanfei, C.; Jing, T.; Fantao, K.; Shulong, X.; Lijuan, X. Development and research status of investment casting TiAl-based alloys. Rare Metal Mater. Eng 2009, 38, 554–558. [Google Scholar]
- Löber, L.; Klemm, D.; Kühn, U.; Eckert, J. Rapid manufacturing of cellular structures of steel or titaniumalumide. Mater. Sci. Forum 2011, 690, 103–106. [Google Scholar]
- Löber, L.; Biamino, S.; Ackeli, U.; Sabbadini, S.; Epicoco, P.; Fino, P.; Eckert, J. Comparison of Selective Laser and Electron Beam Melted Titanium Aluminides. In Proceedings of the Solid Freeform Fabrication Symposium, Austin, TX, USA, 8–10 August, 2011.
- Xin, Y.; Zhengping, X.; Yong, L.; Huiping, T.; Wenpeng, J. Research progress of electron beam melting technology for TiAl intermetallics. Rare Metal Mater. Eng 2011, 40, 2252–2256. [Google Scholar]
- Wallgram, W.; Schmoelzer, T.; Cha, L.; Das, G.; Guether, V.; Clemens, H. Technology and mechanical properties of advanced gamma-TiAl based alloys. Int. J. Mater. Res 2009, 100, 1021–1030. [Google Scholar]
- Zhang, R.; Acoff, V.L. Processing sheet materials by accumulative roll bonding and reaction annealing from Ti/Al/Nb elemental foils. Mater. Sci. Eng. A 2007, 463, 67–73. [Google Scholar]
- Chaudhari, G.P.; Acoff, V.L. Titanium aluminide sheets made using roll bonding and reaction annealing. Intermetallics 2010, 18, 472–478. [Google Scholar]
- Marr, T.; Freudenberger, J.; Seifert, D.; Klauß, H.; Romberg, J.; Okulov, I.; Scharnweber, J.; Eschke, A.; Oertel, C.G.; Skrotzki, W.; Kühn, U.; Eckert, J.; Schultz, L. Ti-Al composite wires with high specific strength. Metals 2011, 1, 79–97. [Google Scholar]
- Zhang, J. Synthesis of gamma-TiAl foils and sheets by innovative reactive diffusion methods from elemental Ti and Al. Intermetallics 2010, 18, 2292–2300. [Google Scholar]
- Fu, E.K.Y.; Rawlings, R.D.; McShane, H.B. Reaction synthesis of titanium aluminides. J. Mater. Sci 2001, 36, 5537–5542. [Google Scholar]
- Uenishi, K.; Sumi, H.; Kobayashi, K. Joining of the intermetallic compound TiAl using self-propagating high-temperature synthesis reaction. Zeitschrift für Metallkunde 1995, 86, 64–68. [Google Scholar]
- Xu, L.; Cui, Y.; Hao, Y.; Yang, R. Growth of intermetallic layer in multi-laminated Ti/Al diffusion couples. Mater. Sci. Eng. A 2006, 435–436, 638–647. [Google Scholar]
- Yang, D.; Hodgson, P.; Wen, C. The kinetics of two-stage formation of TiAl3 in multilayered Ti/Al foils prepared by accumulative roll bonding. Intermetallics 2009, 17, 727–732. [Google Scholar]
- Luo, J.G.; Acoff, V.L. Using cold roll bonding and annealing to process Ti/Al multi-layered composites from elemental foils. Mater. Sci. Eng. A 2004, 379, 164–172. [Google Scholar]
- Sun, Y.b.; Zhao, Y.q.; Zhang, D.; Liu, C.y.; Diao, H.y.; Ma, C.l. Multilayerd Ti-Al intermetallic sheets fabricated bay cold rolling and annealing of titanium and aluminum foils. Trans. Nonferrous Met. Soc. China 2011, 21, 1722–1727. [Google Scholar]
- Marr, T.; Freudenberger, J.; Kauffmann, A.; Scharnweber, J.; Oertel, C.G.; Skrotzki, W.; Siegel, U.; Kuehn, U.; Eckert, J.; Martin, U.; Schultz, L. Damascene light-weight metals. Adv. Eng. Mater 2010, 12, 1191–1197. [Google Scholar]
- Lucadamo, G.; Barmak, K.; Carpenter, D.; Lavoie, C.; Cabral, C.; Michaelsen, C.; Rickman, J. Microstructure Evolution during Solid-state Reactions in Polycrystalline Nb/Al and Ti/Al Multilayer Thin-films. In Polycrystalline Metal and Magnetic Thin Films; Laughlin, D., Rodbell, K., Thomas, O., Zhang, B., Eds.; Materials Research Society: Warrendale, PA, USA, 1999; Volume 562, pp. 159–164. [Google Scholar]
- Van Loo, F.; Rieck, G. Diffusion in the titanium-aluminium system I. Interdiffusion between solid Al and Ti or Ti-Al alloys. Acta Metall 1973, 21, 61–71. [Google Scholar]
- Hufnagel, W. Aluminium Taschenbuch; Aluminium-Verlag Düsseldorf: Düsseldorf, Germany, 1988. [Google Scholar]
- Zwicker, U. Titan und Titanlegierungen; Springer-Verlag: Berlin/Heidelberg, Germany, 1974. [Google Scholar]
- Maier, V.; Hoeppel, H.W.; Goeken, M. Nanomechanical Behaviour of Al-Ti Layered Composites Produced by Accumulative Roll Bonding. Proceedings of the 15th International Conference on the Strength of Materials (ICSMA-15), Dresden, Germany, 16–21 August 2009; Skrotzki, W., Oertel, C., Biermann, H., Heilmaier, M., Eds.; Journal of Physics Conference Series: Bristol, UK, 2010; 240, p. 012108. [Google Scholar]
- Humphreys, F.J.; Hatherly, M. Recrystallization and Related Annealing Phenomena, 2 ed.; Elsevier: Amsterdam, The Netherlands, 2004; p. 658. [Google Scholar]


| Composite is | ||||
|---|---|---|---|---|
| not stacked | 1× stacked | 2× stacked | ||
| Shell | Do/mm | 24 | 24 | 24 |
| Di/mm | 22 | 22 | 22 | |
| material | Grade 1 Ti | Grade 1 Ti | Grade 1 Ti | |
| Core | count | 1 | 37 | 37 |
| Do/mm | 21.5 | 2.8 | 2.8 | |
| Material | Al5049 | 1× stacked | 2× stacked | |
| composition | Ti/at% | 15.7 | 35.2 | 50.3 |
| Al/at% | 84.3 | 64.8 | 49.7 | |
| mass density/g·cm−3 | composite | 3.00 [3.13] | 3.36 [3.46] | 3.63 [3.71] |
| as prepared | 580 °C 116 h | 580°/ 1300 °C 12 h | |
|---|---|---|---|
| diameter / μm | 2789 ± 5 | 2966 ± 10 | 2965 ± 9 |
| porosity by OM area analysis / % | 0.0 | 11.8 | 17.8 |
| density measured / g·cm−3 | 3.72 ± 0.02 | 3.46 ± 0.02 | 3.21 ± 0.02 |
| density calculated / g·cm−3 | 3.71 a | 3.93 | 3.90 |
| porosity by density measurements / % | −0.2 | 11.5 | 16.9 |
acalculation considering the lower Al content.
© 2013 by the authors; licensee MDPI, Basel, Switzerland This article is an open access article distributed under the terms and conditions of the Creative Commons Attribution license (http://creativecommons.org/licenses/by/3.0/).
Share and Cite
Marr, T.; Freudenberger, J.; Kauffmann, A.; Romberg, J.; Okulov, I.; Petters, R.; Scharnweber, J.; Eschke, A.; Oertel, C.-G.; Kühn, U.; et al. Processing of Intermetallic Titanium Aluminide Wires. Metals 2013, 3, 188-201. https://doi.org/10.3390/met3020188
Marr T, Freudenberger J, Kauffmann A, Romberg J, Okulov I, Petters R, Scharnweber J, Eschke A, Oertel C-G, Kühn U, et al. Processing of Intermetallic Titanium Aluminide Wires. Metals. 2013; 3(2):188-201. https://doi.org/10.3390/met3020188
Chicago/Turabian StyleMarr, Tom, Jens Freudenberger, Alexander Kauffmann, Jan Romberg, Ilya Okulov, Romy Petters, Juliane Scharnweber, Andy Eschke, Carl-Georg Oertel, Uta Kühn, and et al. 2013. "Processing of Intermetallic Titanium Aluminide Wires" Metals 3, no. 2: 188-201. https://doi.org/10.3390/met3020188