Abstract
The effects of silicon (Si) on the mechanical properties and fracture toughness of heavy-section ductile cast iron were investigated to develop material for spent-nuclear-fuel containers. Two castings with different Si contents of 1.78 wt.% and 2.74 wt.% were prepared. Four positions in the castings from the edge to the center, with different solidification cooling rates, were chosen for microstructure observation and mechanical properties’ testing. Results show that the tensile strength, elongation, impact toughness and fracture toughness at different positions of the two castings decrease with the decrease in cooling rate. With an increase in Si content, the graphite morphology and the mechanical properties at the same position deteriorate. Decreasing cooling rate changes the impact fracture morphology from a mixed ductile-brittle fracture to a brittle fracture. The fracture morphology of fracture toughness is changed from ductile to brittle fracture. When the Si content exceeds 1.78 wt.%, the impact and fracture toughness fracture morphology transforms from ductile to brittle fracture. The in-situ scanning electronic microscope (SEM) tensile experiments were first used to observe the dynamic tensile process. The influence of the vermicular and temper graphite on fracture formation of heavy section ductile iron was investigated.
1. Introduction
Silicon is an extremely sensitive element in heavy section ductile iron, which affects the formation of chunky graphite [1,2,3]. S.I. Karsay and E. Campomanes [4,5,6,7,8,9] studied the influence of silicon content on ductile iron, and found that lower silicon content can reduce the performance of chunky graphite iron, especially in its capacity to demonstrate good impact performance at low temperatures. The proper content of silicon can increase the nodularity and improve the mechanical properties of heavy section ductile iron, and inhibit graphite floatation and chunky graphite formation [10,11,12,13].
Although many researchers have studied the influences of Si on the microstructures and mechanical properties of ductile cast iron [14], systematic research on effects of Si on large-scale heavy section ductile cast iron is scarce.
The aim of this paper is to investigate the effects of Si on microstructures and mechanical properties as well as fracture toughness of heavy section ductile cast iron. Two cubic-shaped castings with different Si contents of 1.78 wt.% and 2.74 wt.% were prepared. Specimens were taken at four positions from the edge to the center of the castings, which representthe different typical cooling rates of heavy section ductile cast iron. The influence of Si content on morphology and distribution of graphite, and on the impact toughness, tensile strength, elongation and fracture toughness of the specimens at different positions of castings were studied. The in-situ scanning electronic microscope (SEM) tensile experiment was used to observe the dynamic tensile process. Fracture analysis was carried out to clarify how the vermicular graphite and temper graphite affect the fracture process of heavy section ductile iron.
2. Experimental Procedure
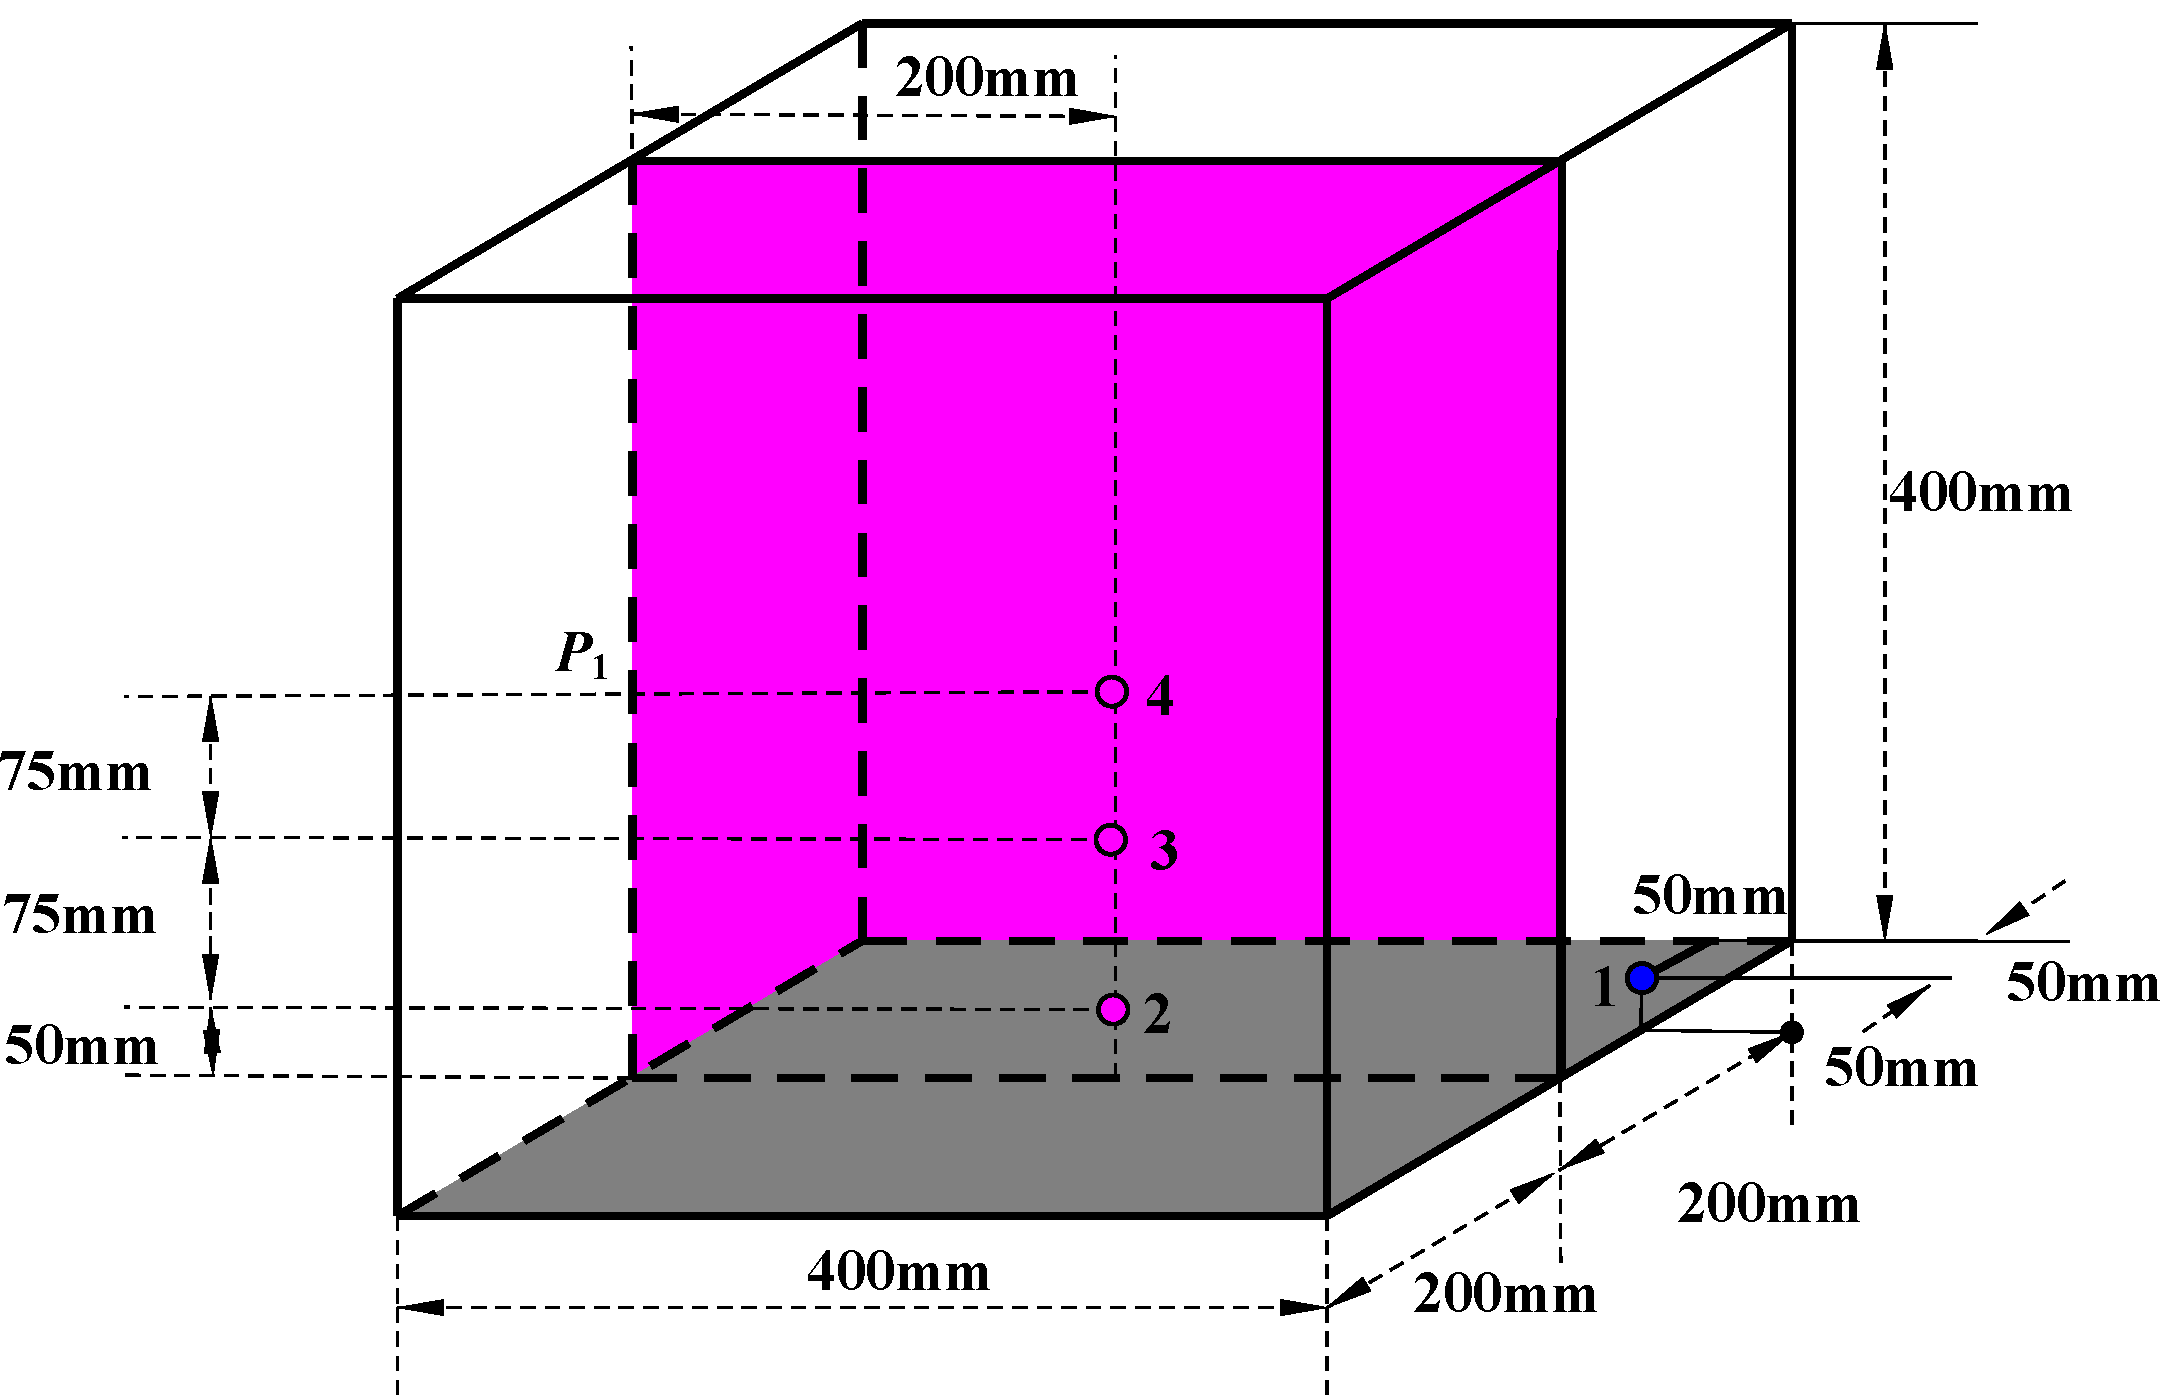
The heavy section ductile cast iron castings were obtained by melting pig iron, 45 steel and graphite in a medium frequency induction furnace. The Ce-Mg-Si and 75 wt.% Si-Fe alloys were used as nodularizer and inoculant, respectively. The composition of nodularizer used in the experiments is given in Table 1. The molten iron was poured into the furan resin sand mould to obtain cubic-shaped block casting, with dimension of 400 mm × 400 mm × 400 mm. Two castings with Si contents of 1.78 wt.% and 2.74 wt.% were prepared, and they were denoted as Casting-A and Casting-B, respectively. The compositions of castings are given in Table 2. Four positions (P1, P2, P3 and P4) were chosen from the edge to the core of the as-casts (Figure 1). As shown in Figure 1, specimens were fabricated at four positions from the edge to the center of the castings, and they were denoted as A1 (B1), A2 (B2), A3 (B3) and A4 (B4), respectively. The cooling curves of the specimens from the four positions were measured by using a Kingview temperature monitoring system.

Table 1.
Composition of nodularizer (wt.%).
| Elements of Nodularizer/Content | ||||
|---|---|---|---|---|
| Ce | Mg | Si | Mn | Ca |
| 6.49 | 7.88 | 43.04 | 2.0 | <3 |

Table 2.
Compositions of castings (wt.%).
| Elements | C | Si | Mn | S | P | Mg |
|---|---|---|---|---|---|---|
| Casting-A | 3.61 | 1.78 | <0.2 | <0.02 | <0.05 | 0.037 |
| Casting-B | 3.57 | 2.74 | <0.2 | <0.02 | <0.05 | 0.046 |
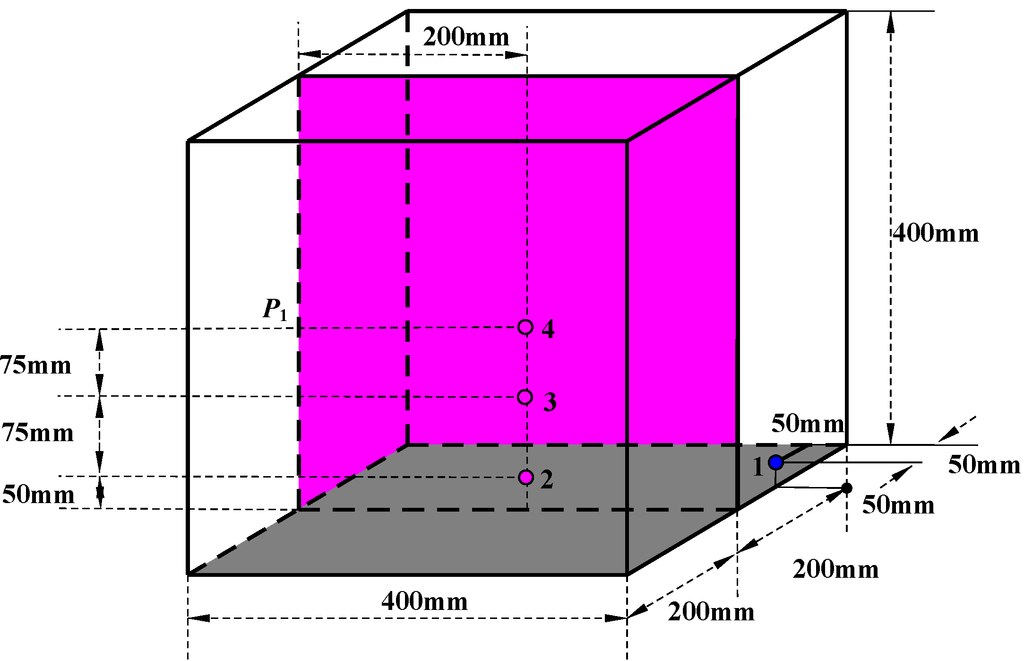
Figure 1.
Four positions (P1, P2, P3 and P4) in castings chosen for measuring temperature and preparing specimens.
Figure 1.
Four positions (P1, P2, P3 and P4) in castings chosen for measuring temperature and preparing specimens.
The morphology of graphite in specimens was observed by using an optical microscope (GX71, Olympus, Shanghai, China). The tensile tests were conducted at room temperature on the tensile tester (1186, Instron, Norwood, MA, USA) according to the standard GB228-2002. The gauge length of the sample is 50 mm. The tensile rate is 0.8 mm·min−1. Impact toughness specimens (50 mm × 10 mm × 10 mm) were tested in a standard impact testing machine (JBN-300B, Chenda, Jinan, China) at room temperature according to the standard GB229-2007.
The fracture toughness test was carried out at room temperature on electro-hydraulic servo testing machine (809, MTS, Minneapolis, MN, USA) according to the standard GB/T4161-2007. The sample size is shown in Figure 2. The in situ SEM tensile experiment was performed at room temperature on SEM (S-570, Hitachi, Tokyo, Japan) loaded by manual. The maximum tensile load and the maximum stretching distance is 10 kg and 5 mm, respectively. As shown in Figure 3, the thickness of in situ SEM tensile specimen is 0.1 mm, and the pre-crack is 0.5 mm in depth.
3. Results and Discussion
3.1. Cooling Curves and Microstructures of Ductile Cast Iron
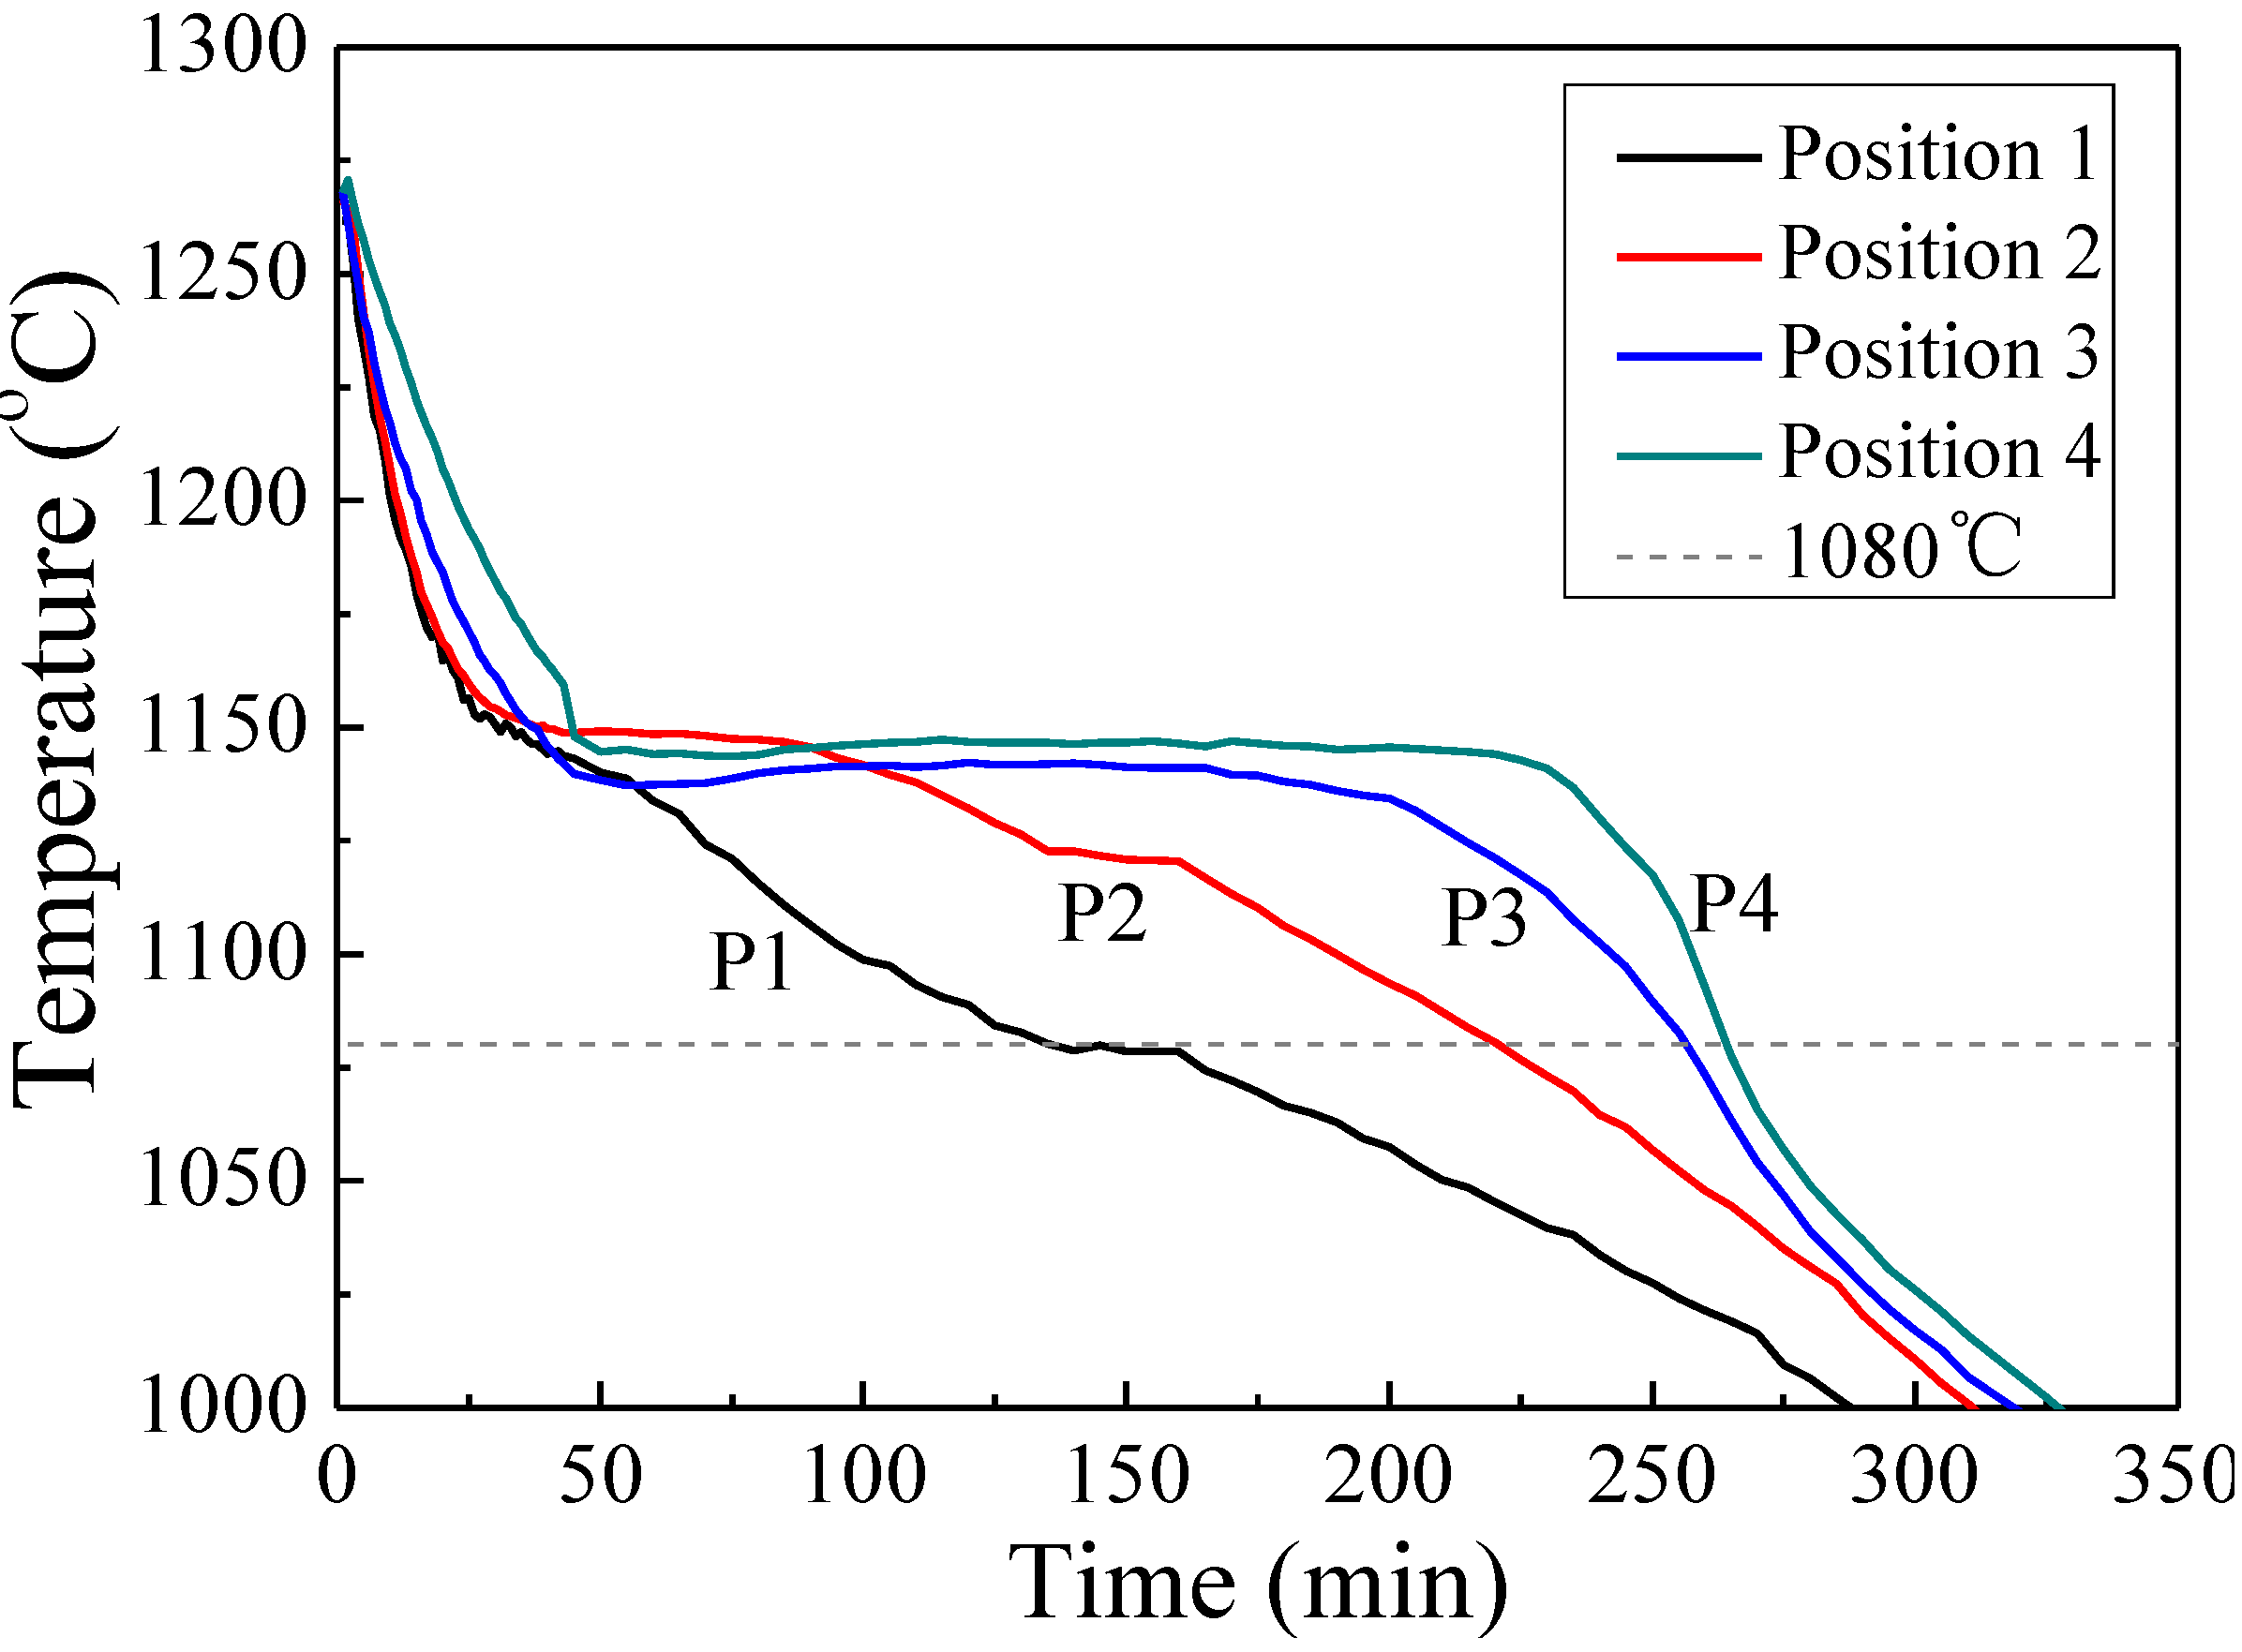
Figure 4 shows the cooling curves at four positions of two castings during solidification. It can be seen that the cooling rate at position 1 is the highest and the subsequent sequence is positions 2, 3, and 4. At position 3 and position 4, the solidification time is more than 250 min. The cooling curves in Figure 4 represent the cooling rate of four positions in two castings owing to the micro-amount change of Si content. The influence of Si content on the cooling process of ductile iron (more than 500 kg) can be ignored [15].
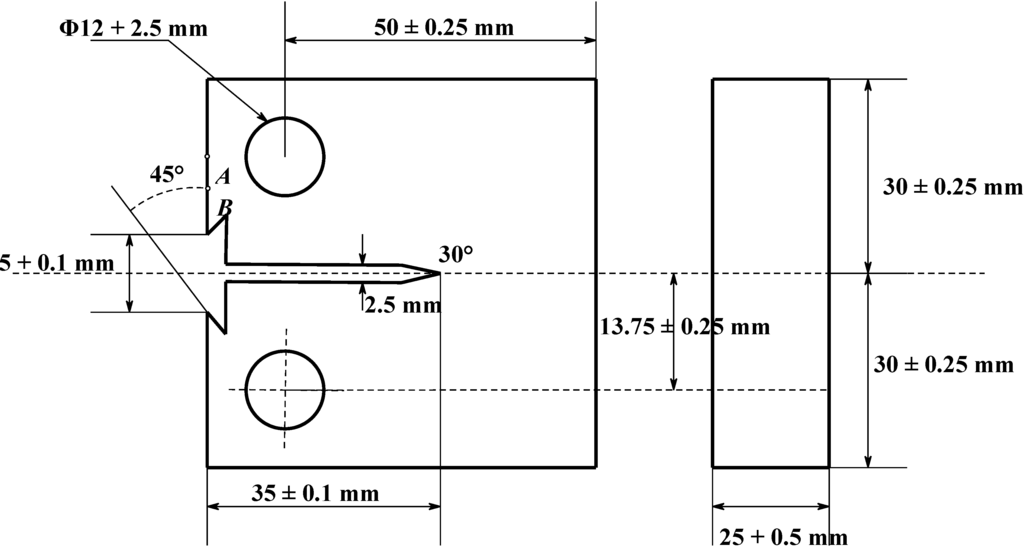
Figure 2.
Dimensions of the fracture toughness specimen.
Figure 2.
Dimensions of the fracture toughness specimen.
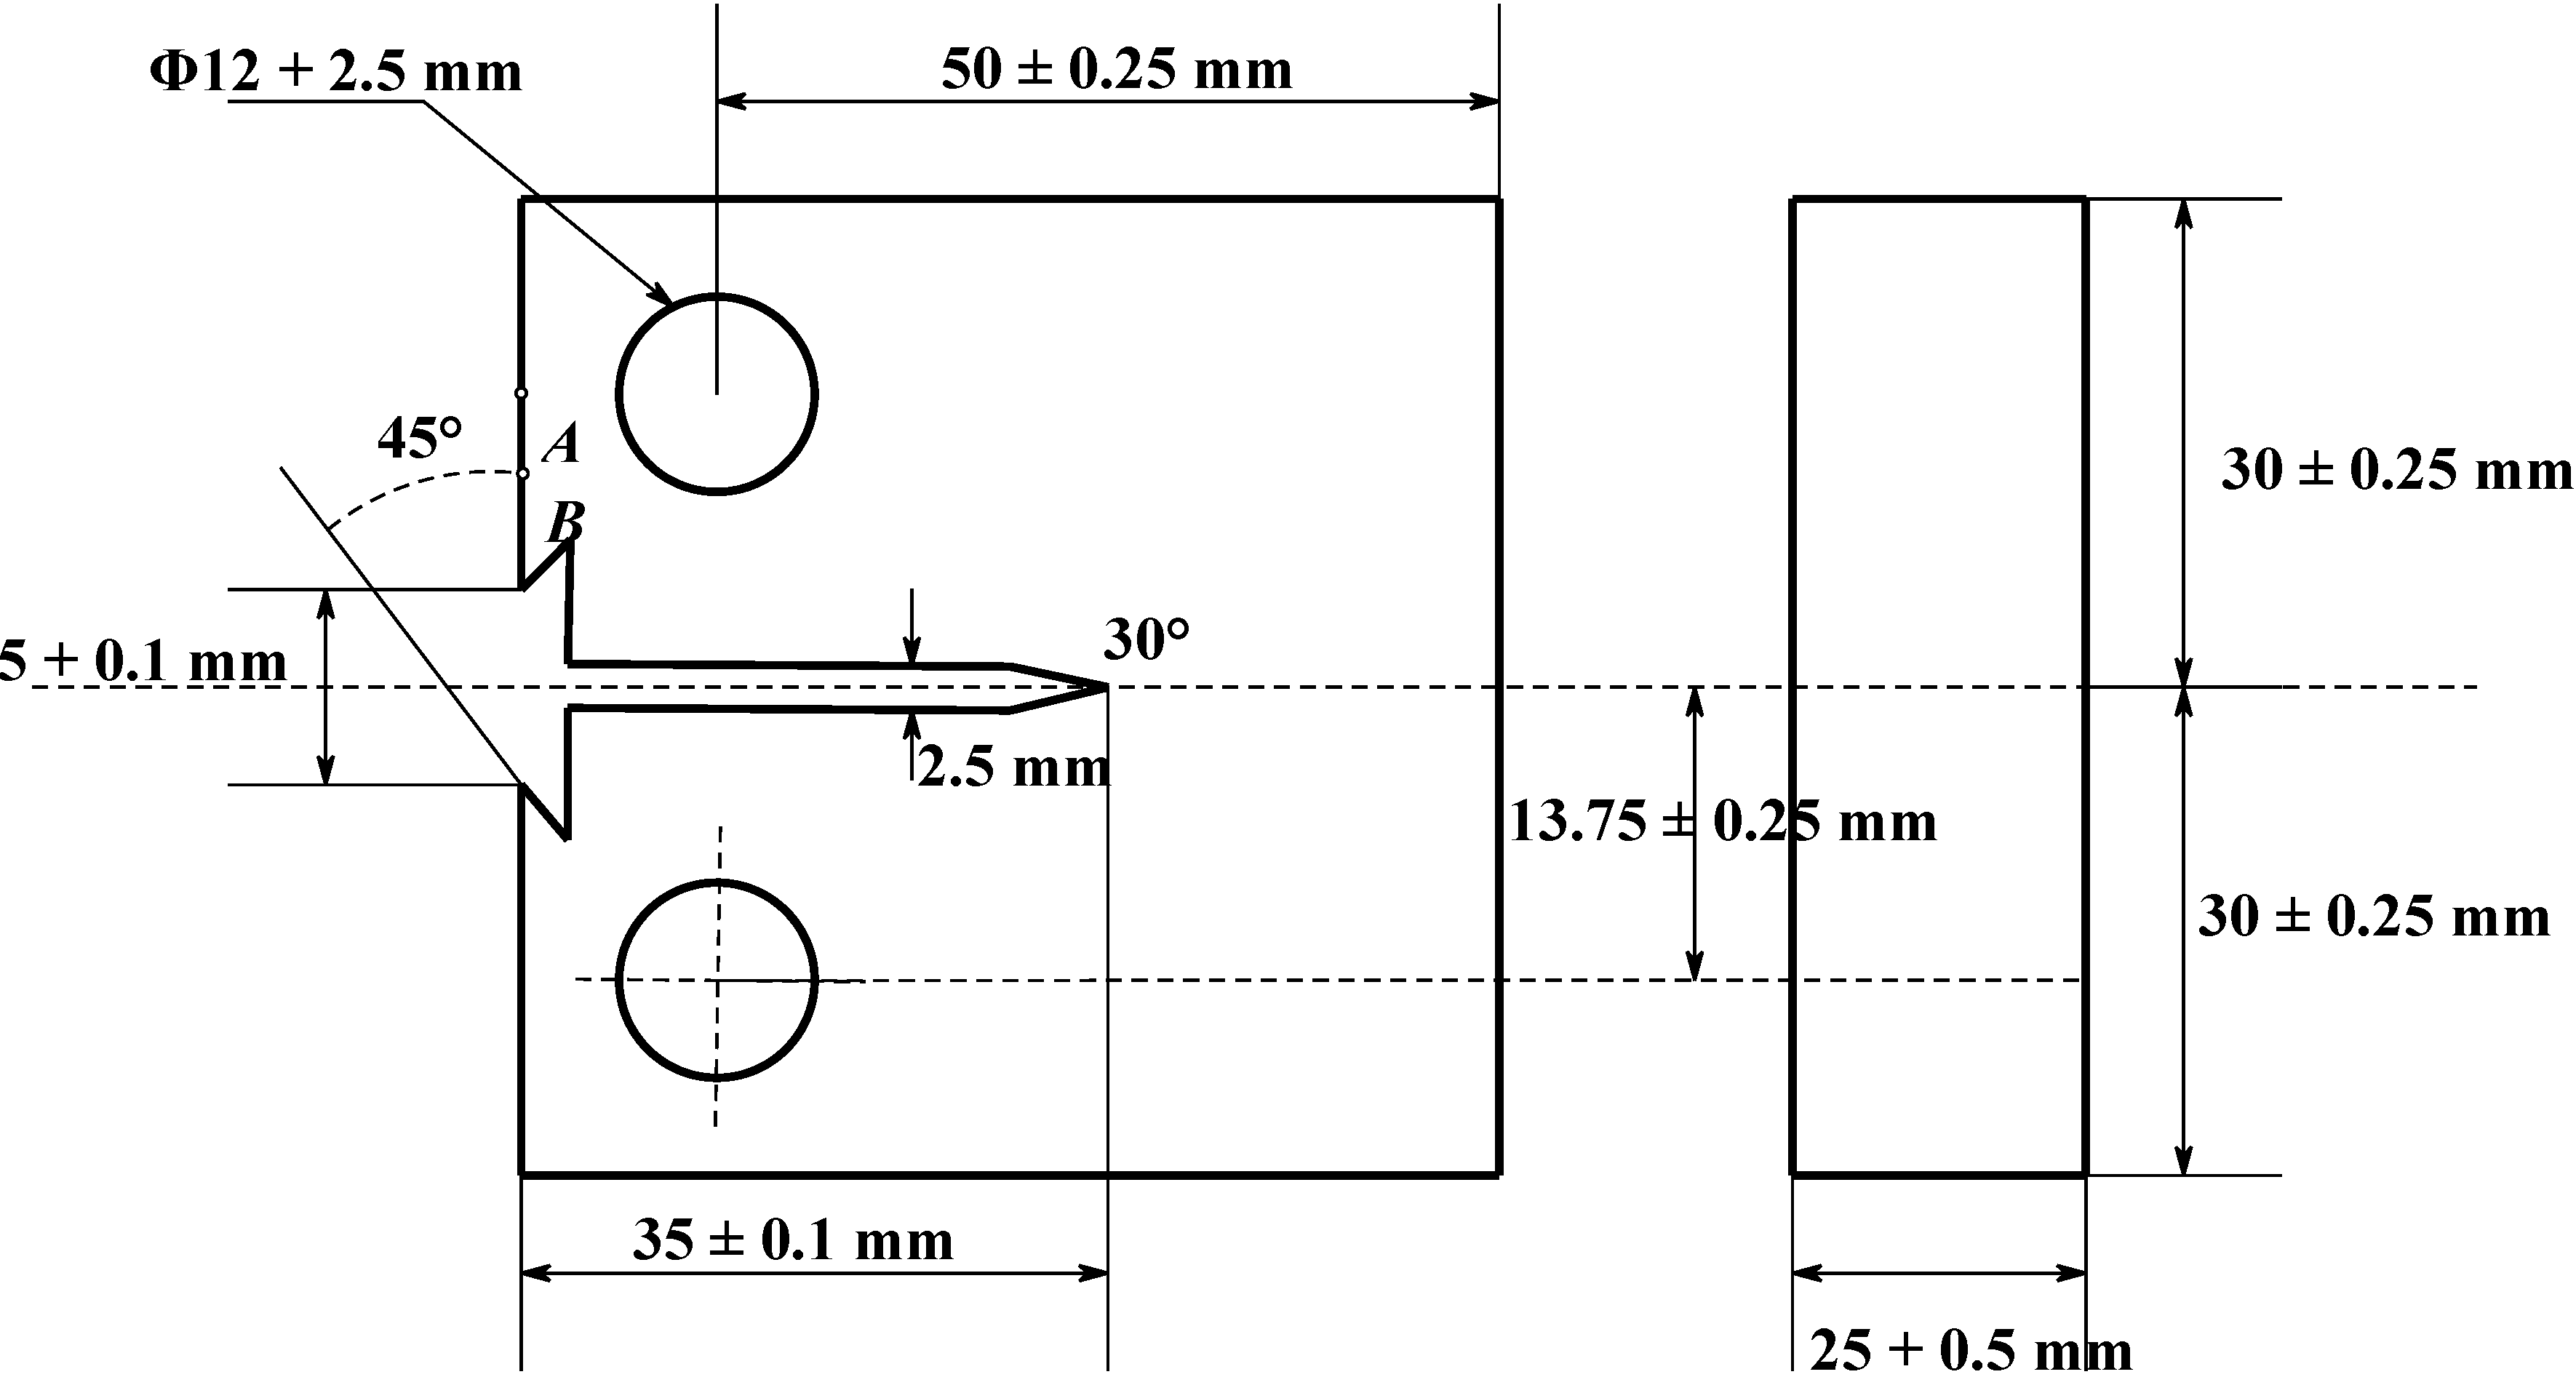
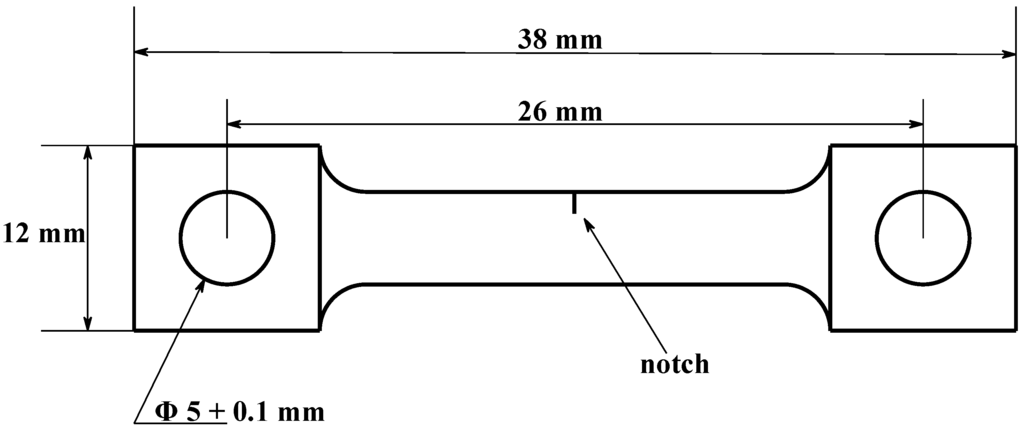
Figure 3.
Dimensions of the in situ SEM tensile specimen.
Figure 3.
Dimensions of the in situ SEM tensile specimen.
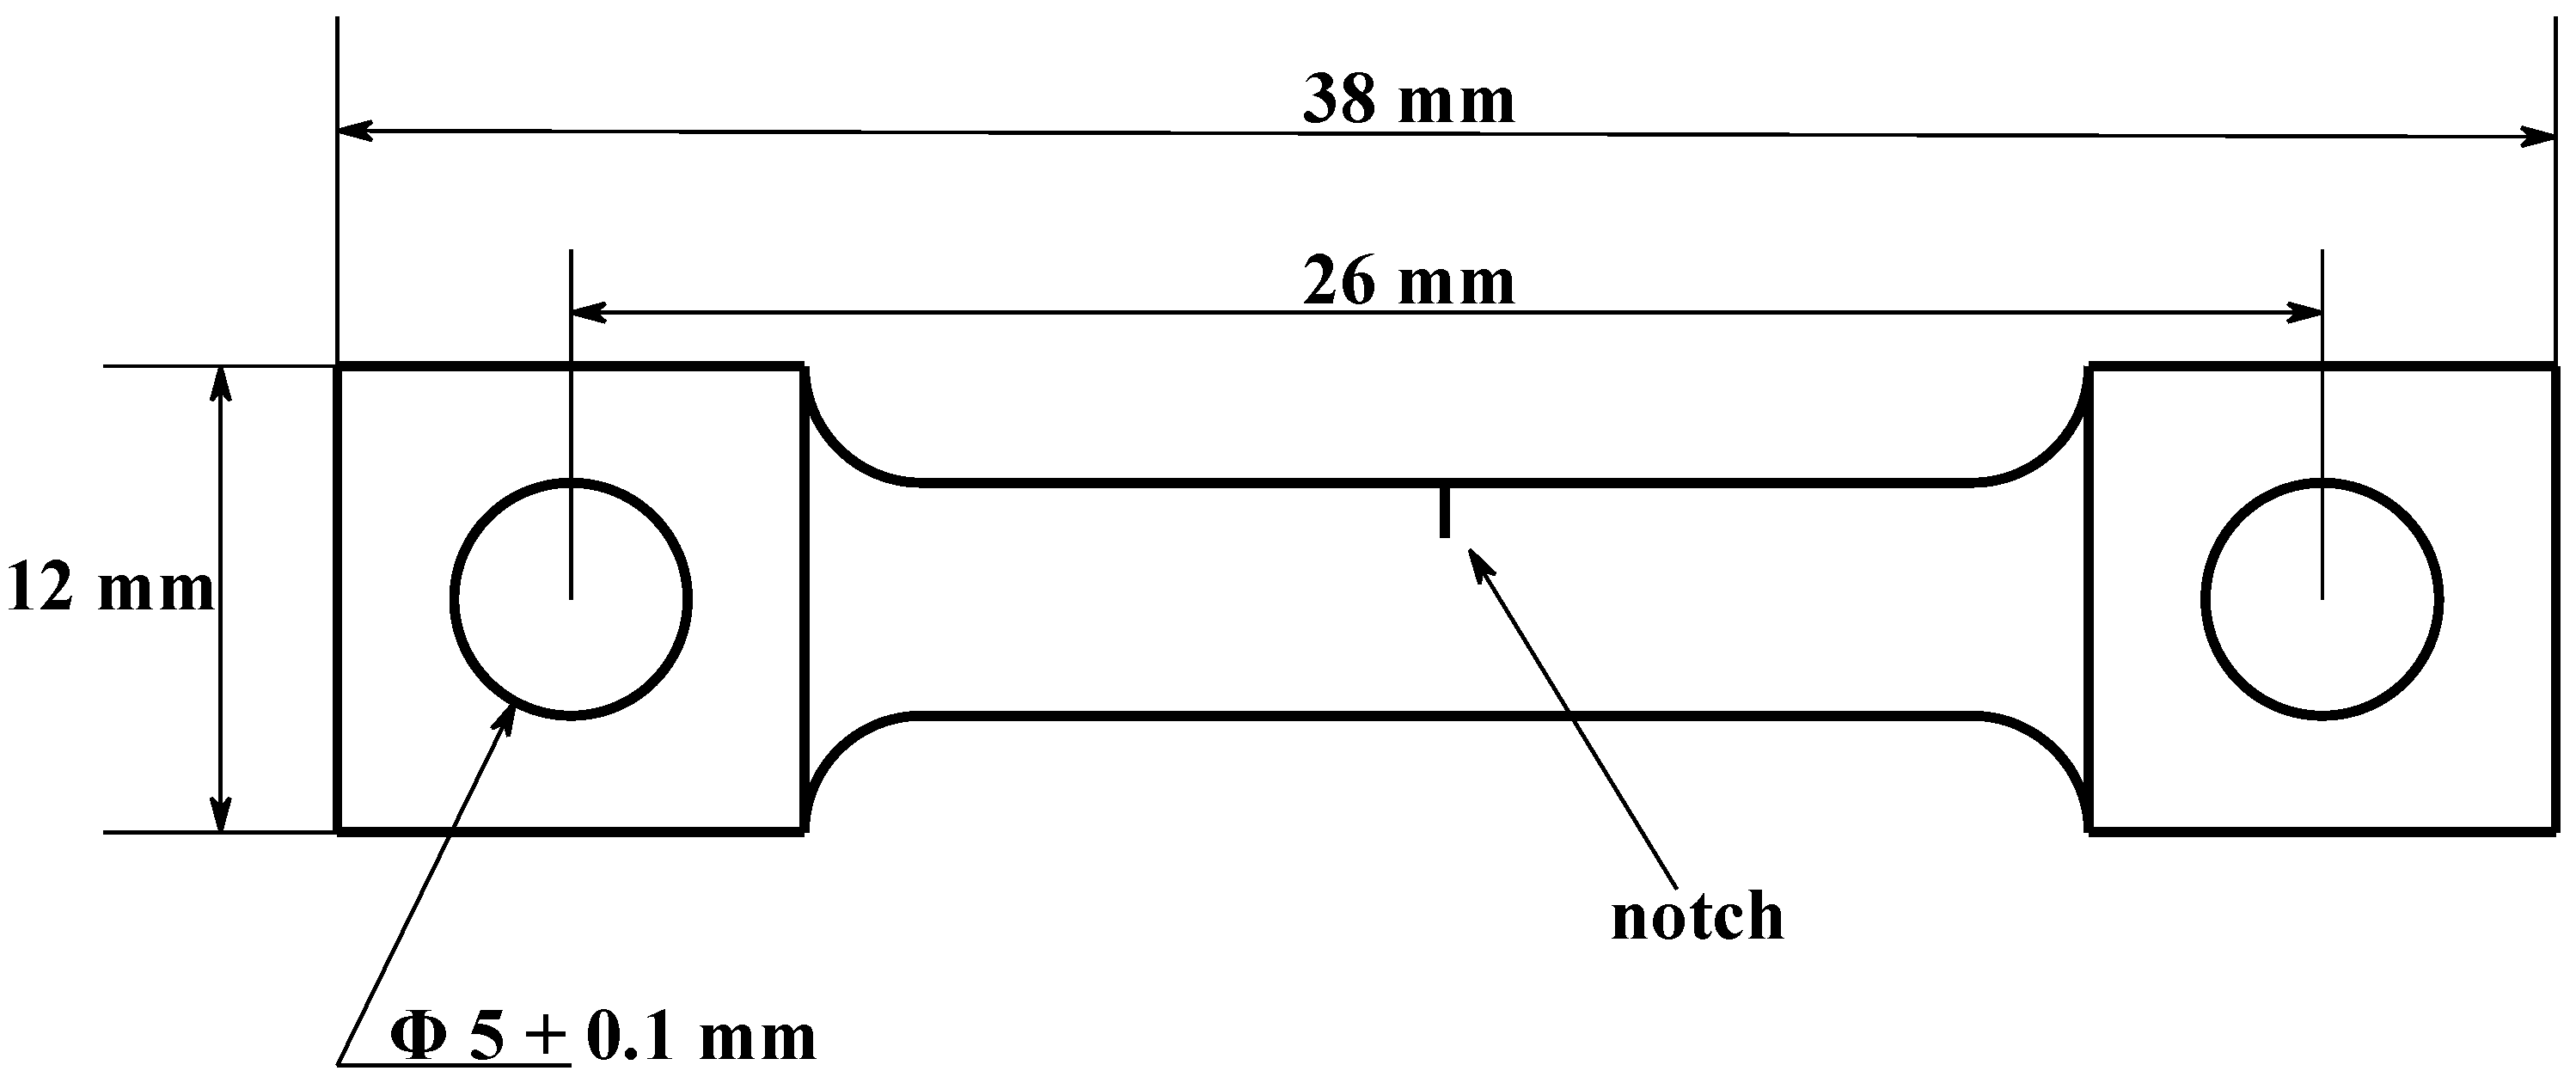
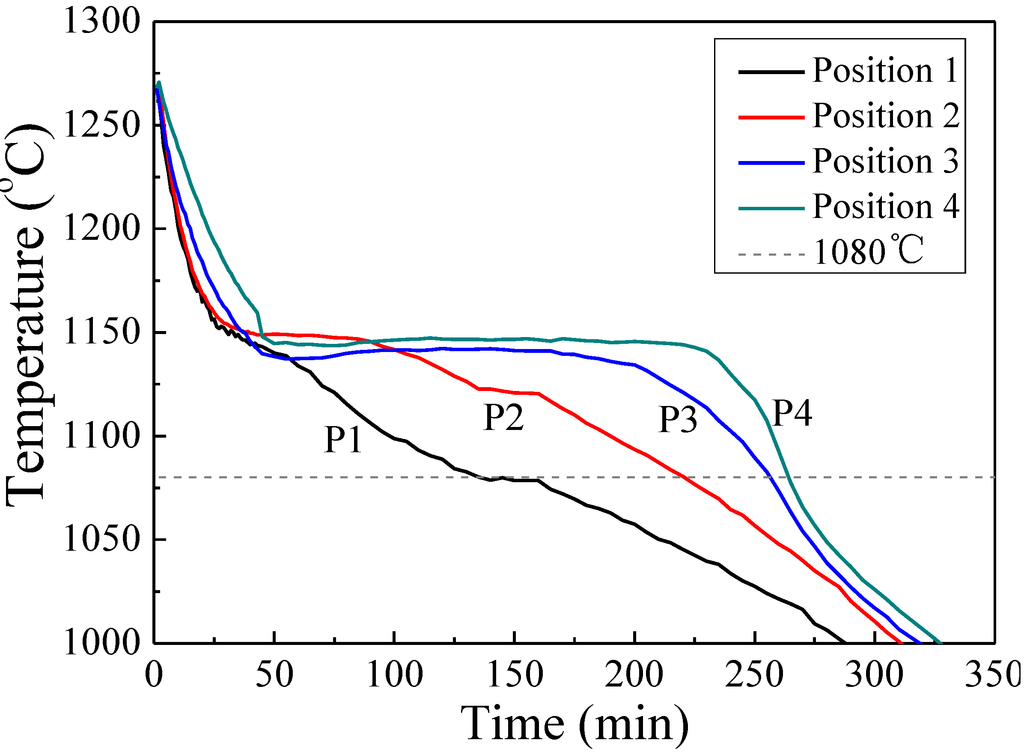
Figure 4.
Cooling curves at four positions of castings during solidification.
Figure 4.
Cooling curves at four positions of castings during solidification.
The OM observation results show that the matrix structure of all specimens contains ferrite without pearlite. Figure 5 shows the graphite morphology of specimens at four positions of Casting-A (Si content of 1.78 wt.%) and Casting-B (Si content of 2.74 wt.%), respectively. As shown in Figure 5a1, the graphite nodules are almost spheroidal and a small amount of quasi-spheroidal temper graphite can be observed at position 1 of casting-A. With the increase of solidification time, the quasi-spheroidal temper graphite nodule and temper graphite nodule increases, as shown in Figure 5a2. With the further increase of solidification time, some vermicular graphite nodules occur, as shown in Figure 5a3. It shows that the spheroidalization decaying happens in Casting-A. The graphite nodules are almost chunky and the graphite is tempered at position 4 of casting-A, as shown in Figure 5a4. It can be inferred that with the decrease of cooling rate, the spheroidalization decaying becomes more significant and the graphite morphology gradually deteriorates.
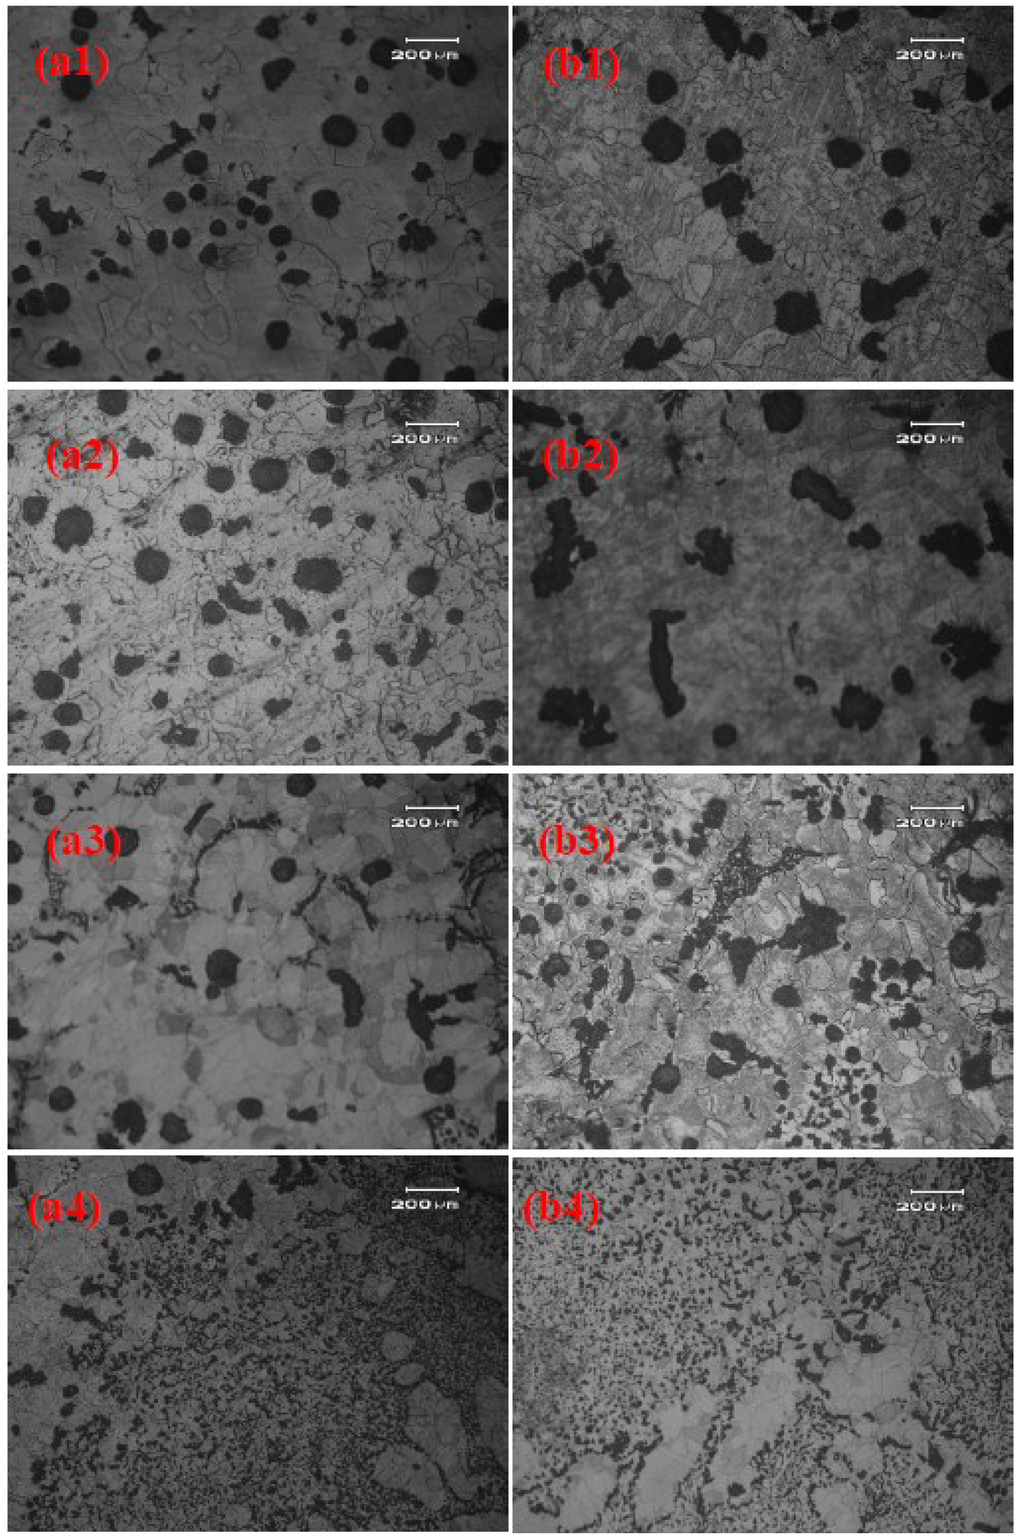
Figure 5.
Graphite morphology of at four positions of two castings (a1) specimen A1; (a2) specimen A2; (a3) specimen A3; (a4) specimen A4; (b1) specimen B1; (b2) specimen B2; (b3) specimen B3; and (b4) specimen B4.
Figure 5.
Graphite morphology of at four positions of two castings (a1) specimen A1; (a2) specimen A2; (a3) specimen A3; (a4) specimen A4; (b1) specimen B1; (b2) specimen B2; (b3) specimen B3; and (b4) specimen B4.
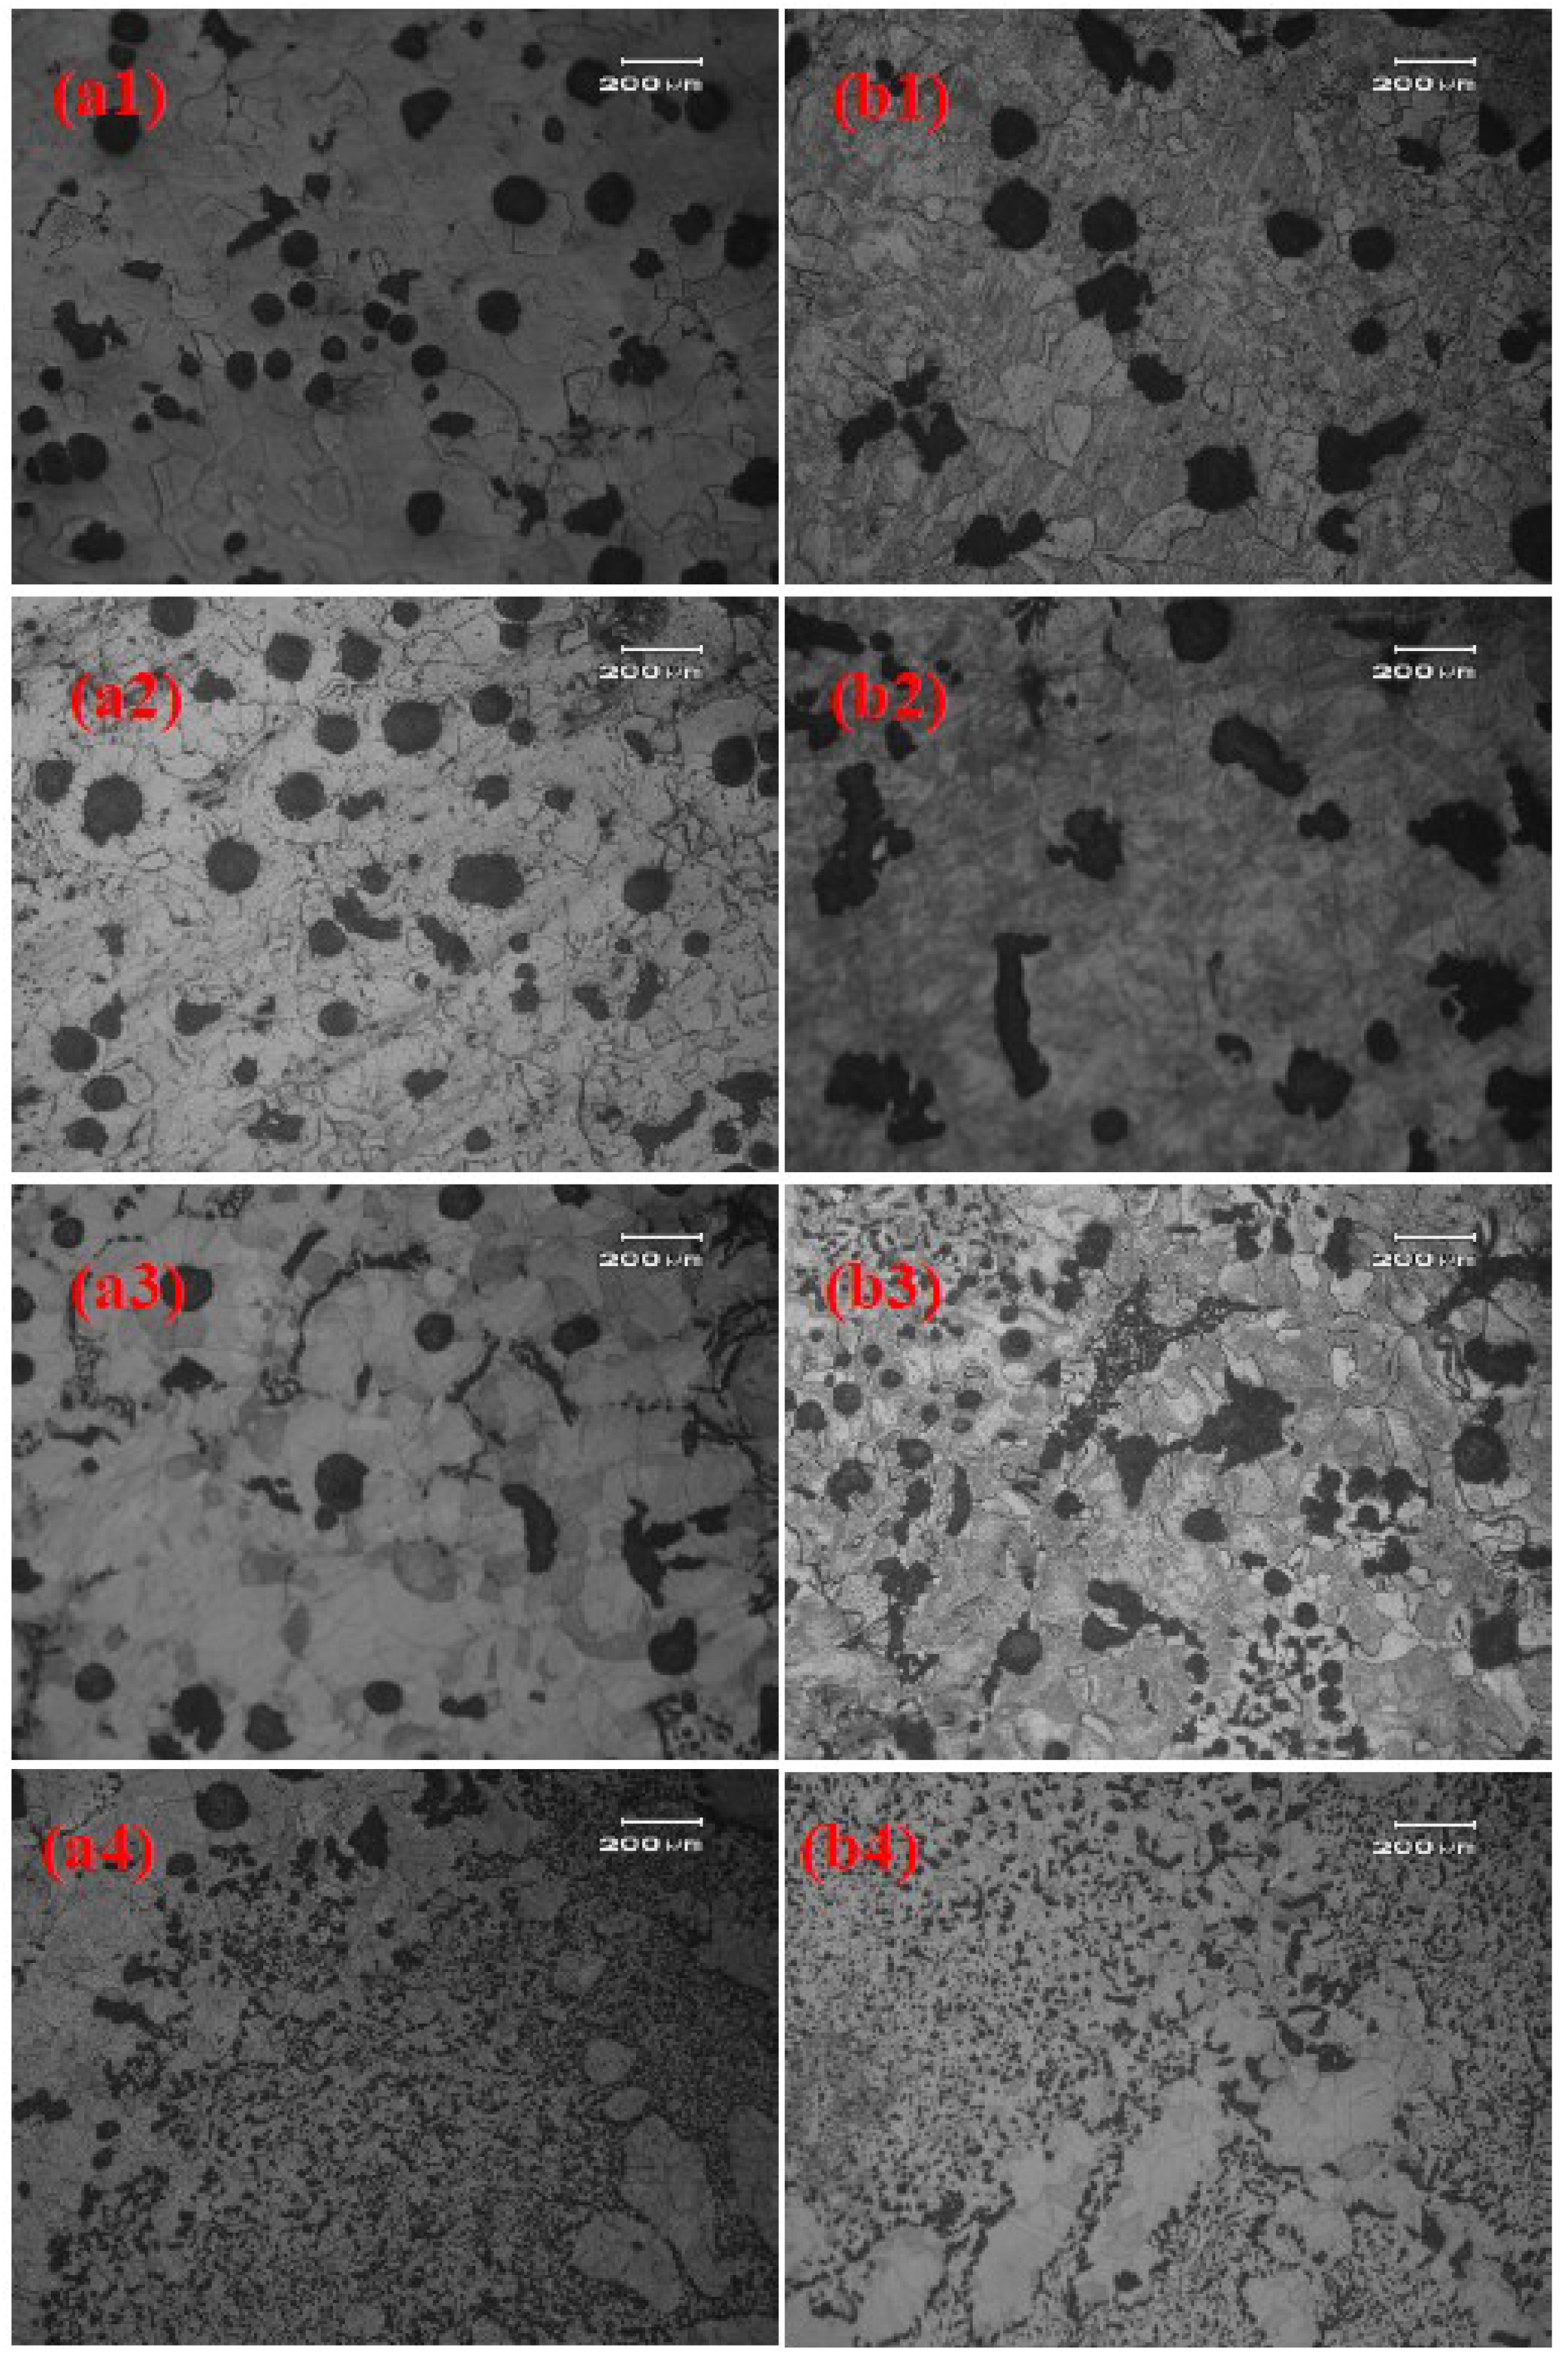
As shown in Figure 5b1, the graphite nodules at position 1 of casting-B are almost that of spheroidal and quasi-spheroidal temper graphite, and some temper graphite can be observed. With the decrease of cooling rate, the number and diameter of graphite nodules of specimen B2 decreases. Some vermicular graphite can be observed at position 2, as shown in Figure 5b2. The graphite morphology of specimens B3 and B4 is almost that of chunky, vermicular graphite. It can be inferred that significant spheroidalization decaying occurs, as shown in Figure 5b3,b4. The morphology of graphite, graphite sphere grade and nodularity of the specimens in Casting-A and Casting-B are listed in Table 3. It can be seen that the graphite sphere grade and nodularity of Casting-A are higher than that of Casting-B at the same position.
The silicon, like cerium, calcium and nickel, can cause melting point of austenitic shell to drop and promote the formation of chunky graphite. Therefore, the content of silicon must be controlled in the production of heavy-section ductile cast iron. Generally, a suitable addition of silicon can obviously improve the graphite sphere grade and nodularity of heavy section ductile iron [9]. However, when the content is 2.74 wt.%, the aggregation of chunky graphite occurs, as shown in Figure 5b4. This is because the excess addition of Si will result in too much heterogeneous nucleation, causing an increase in the amount of chunky graphite and the aggregation of chunky graphite. Areas of aggregation become weak points during tensile and impact tests [16,17].

Table 3.
Morphology of graphite, graphite sphere grade and nodularity in Casting-A (Si content = 1.78 wt.%) and Casting-B (Si content = 2.74 wt.%).
| Specimens | Graphite Morphology | Graphite-sphere Grade | Nodularity% |
|---|---|---|---|
| A1 | Spheroidal + Quasi-spheroidal temper | 3 | 80 |
| A2 | Spheroidal + Quasi-spheroidal temper + temper | 5 | 60 |
| A3 | Spheroidal + Temper + Vermicular | 6 | 50 |
| A4 | Spheroidal + Temper + chunky | - | - |
| B1 | Spheroidal+Quasi-spheroidal temper + temper | 5 | 60 |
| B2 | Spheroidal + Temper + Vermicular | 6 | 50 |
| B3 | Temper + Vermicular + chunky | - | - |
| B4 | Vermicular + Temper + chunky | - | - |
3.2. Mechanical Properties of Ductile Cast Iron
Figure 6 shows the tensile strength, impact toughness, elongation and fracture toughness of the specimens at the four positions of Casting-A and Casting-B. With the decrease of the cooling rate, the mechanical properties of ductile iron decrease. The mechanical properties of the specimens at position 4 of the two castings are the poorest. Compared with the specimen at position 1 of Casting-A, the tensile strength, impact toughness, elongation and fracture toughness of the specimens at position 4 are decreased by 6.7%, 75.8%, 81.3% and 28.3%, respectively. As for Casting-B, compared with the specimen at position 1, the tensile strength, impact toughness, elongation and fracture toughness of the specimens at position 4 are decreased by 5.8%, 62.5%, 66.7% and 29.8%, respectively.
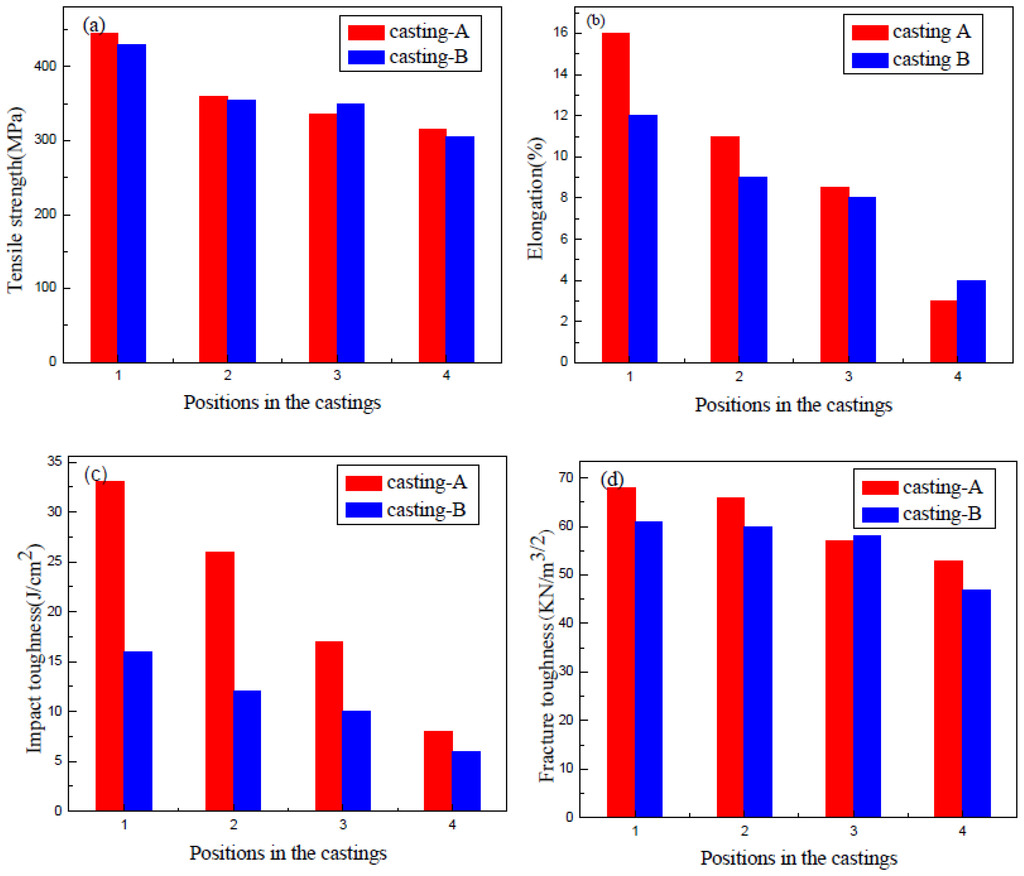
Figure 6.
The tensile strength, elongation, impact toughness and fracture toughness at four positions of two castings (a) Tensile strength; (b) Elongation; (c) Impact toughness; and (d) Fracture toughness.
Figure 6.
The tensile strength, elongation, impact toughness and fracture toughness at four positions of two castings (a) Tensile strength; (b) Elongation; (c) Impact toughness; and (d) Fracture toughness.
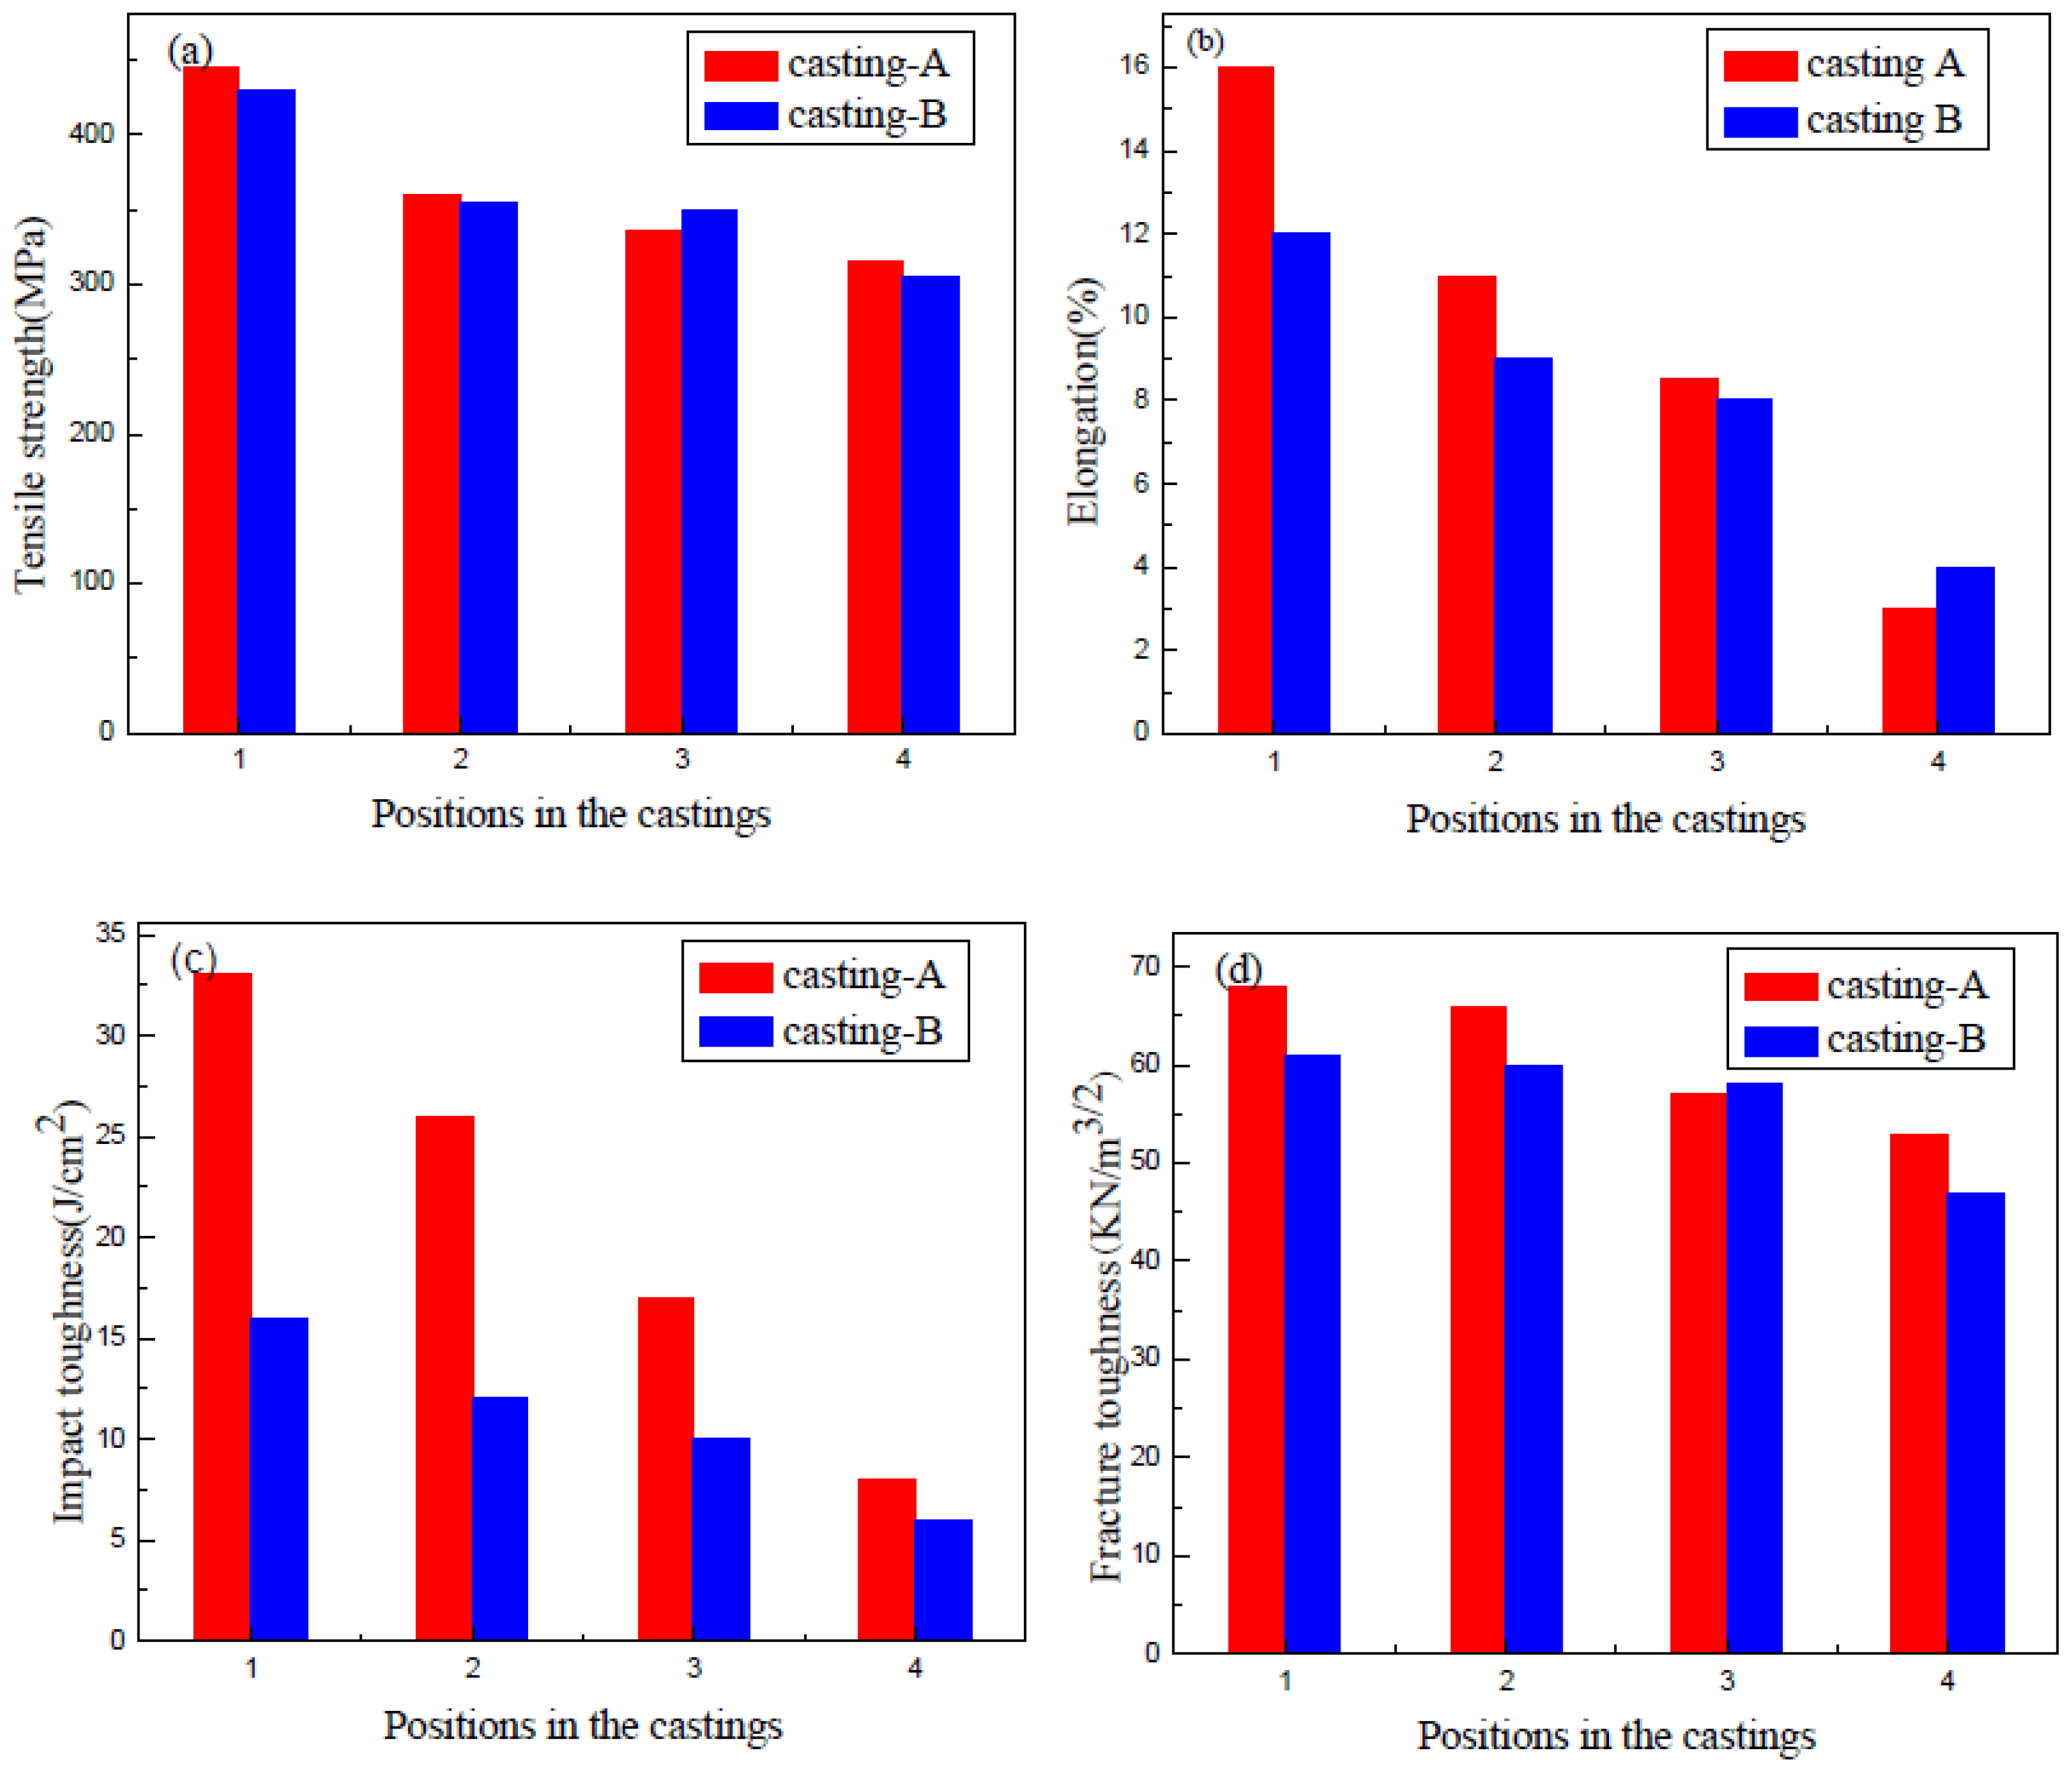
As shown in Figure 6, it can be seen that the mechanical properties of the Casting-A is higher than that of Casting-B at the same position. With the increase of Si content, the mechanical properties of heavy section ductile iron decrease. This is because Si can increase the eutectic temperature, reduce the carbon content of the eutectic ferrite and increase the amount of ferrite. However, Si is an extremely sensitive element in heavy section ductile iron, and the excess of it can result in the generation of chunky graphite [17].
3.3. Fracture Microstructure
Figure 7 shows the fracture toughness fracture microstructures of the specimens in Casting-A and Casting-B. As shown in Figure 7a, there are many dimples in the matrix at position 1 of casting-A. The graphite nodules are surrounded by dense dimples, forming tearing ridges. Most of the tearing ridges are closed. The closed tearing ridges can retard the spread of micro-cracks and the connections between the cracks. Therefore, the specimen A1 shows better ductility. The graphite nodules being peeled off from the ferrite under applied force creates the fracture mechanism. The cavities are formed and grow under the effect of slip. Eventually, the cavities connect with each other and cause macroscopic fracture. A relatively larger plastic deformation of ferrite is generated during this process. The fracture morphology of specimen A1 is a typical ductile fracture.
As shown in Figure 7a2,b1, there exists a small amount of dimples in the matrix. Some tearing ridges are connected with each other. A few graphite nodules are split by the spread of micro-cracks that originate from the adjacent abnormal graphite, such as temper graphite and vermicular graphite. The fracture morphology of specimen A2 and specimen B1 is the mixed cleavage-dimple fracture. There are some abnormal graphite nodules in specimen A3 and B2, as shown in Figure 7a3,b2. When the force is applied on the specimens, stress concentration forms at the tips of the abnormal graphite, and micro-cracks originate at these places. The micro-cracks quickly reach an unstable spreading stage without experiencing a cavity aggregation growth stage due to high stress concentration at the tips of abnormal graphite and inconsistency in the deformation performance of ferrite. Most of the graphite nodules are fractured because they cannot be protected by the dimples. Cracks spread quickly in the ferrite, causing cleavage fracture with flat cleavage planes. The fracture morphology of specimens A3 and B2 shows brittle fracture of the cleavage.
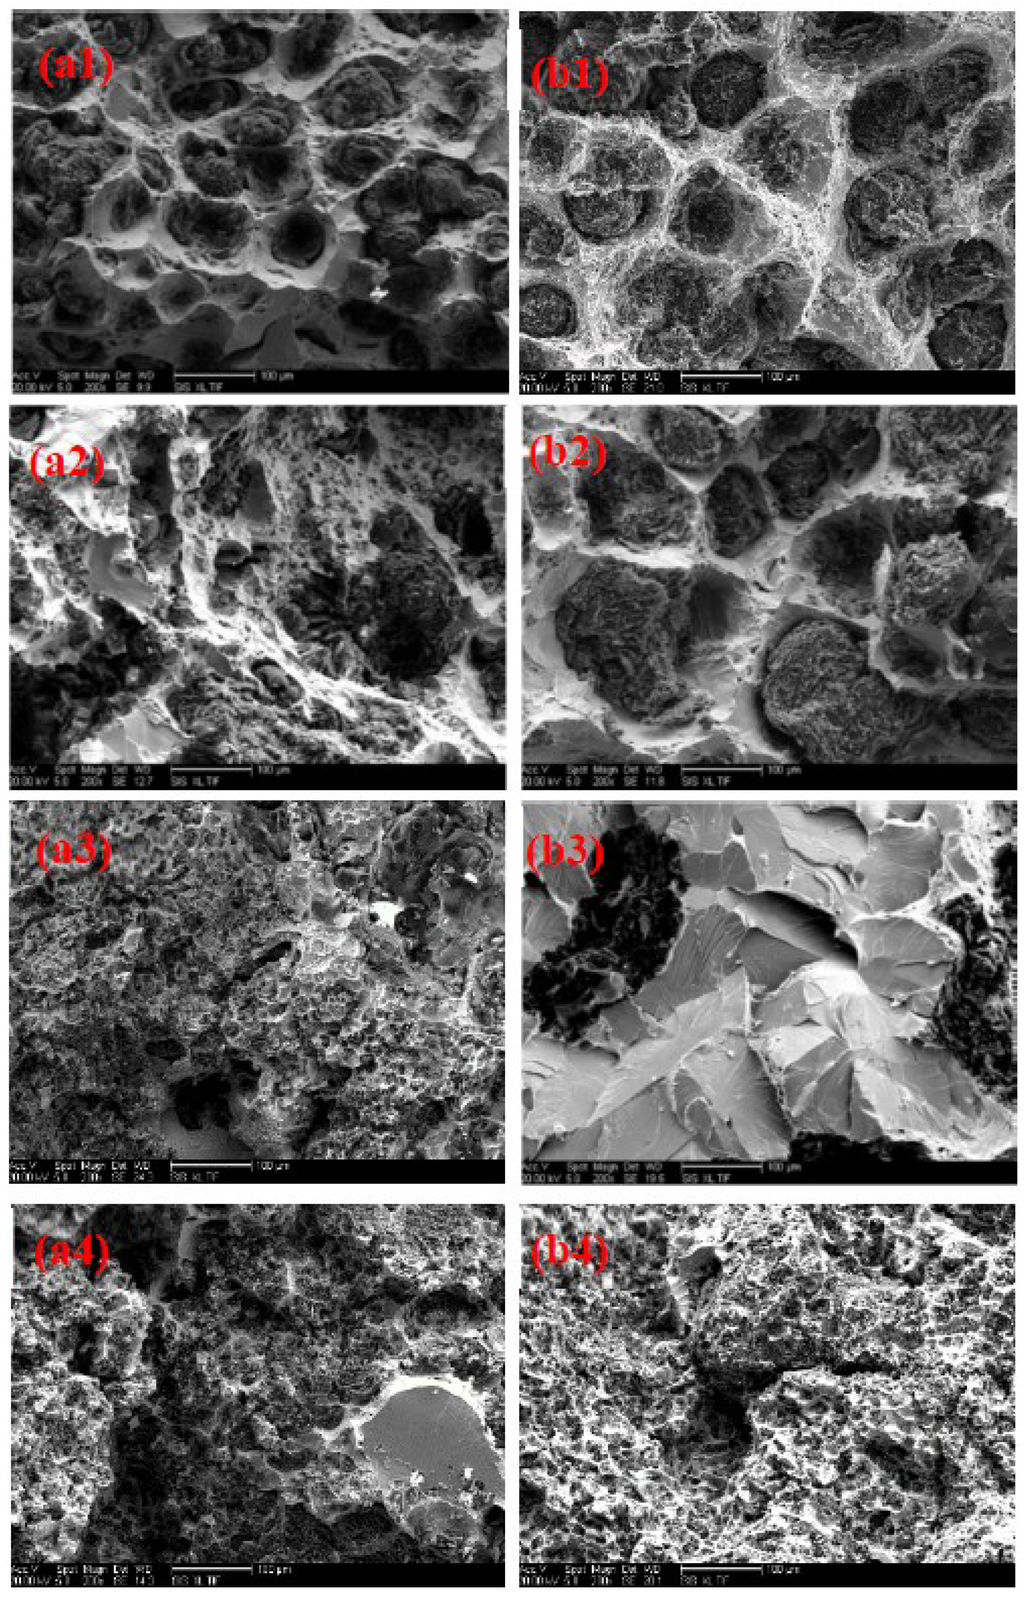
Figure 7.
The fracture toughness fracture morphology at four positions of two castings (a1) specimen A1; (a2) specimen A2; (a3) specimen A3; (a4) specimen A4; (b1) specimen B1; (b2) specimen B2; (b3) specimen B3; and (b4) specimen B4.
Figure 7.
The fracture toughness fracture morphology at four positions of two castings (a1) specimen A1; (a2) specimen A2; (a3) specimen A3; (a4) specimen A4; (b1) specimen B1; (b2) specimen B2; (b3) specimen B3; and (b4) specimen B4.
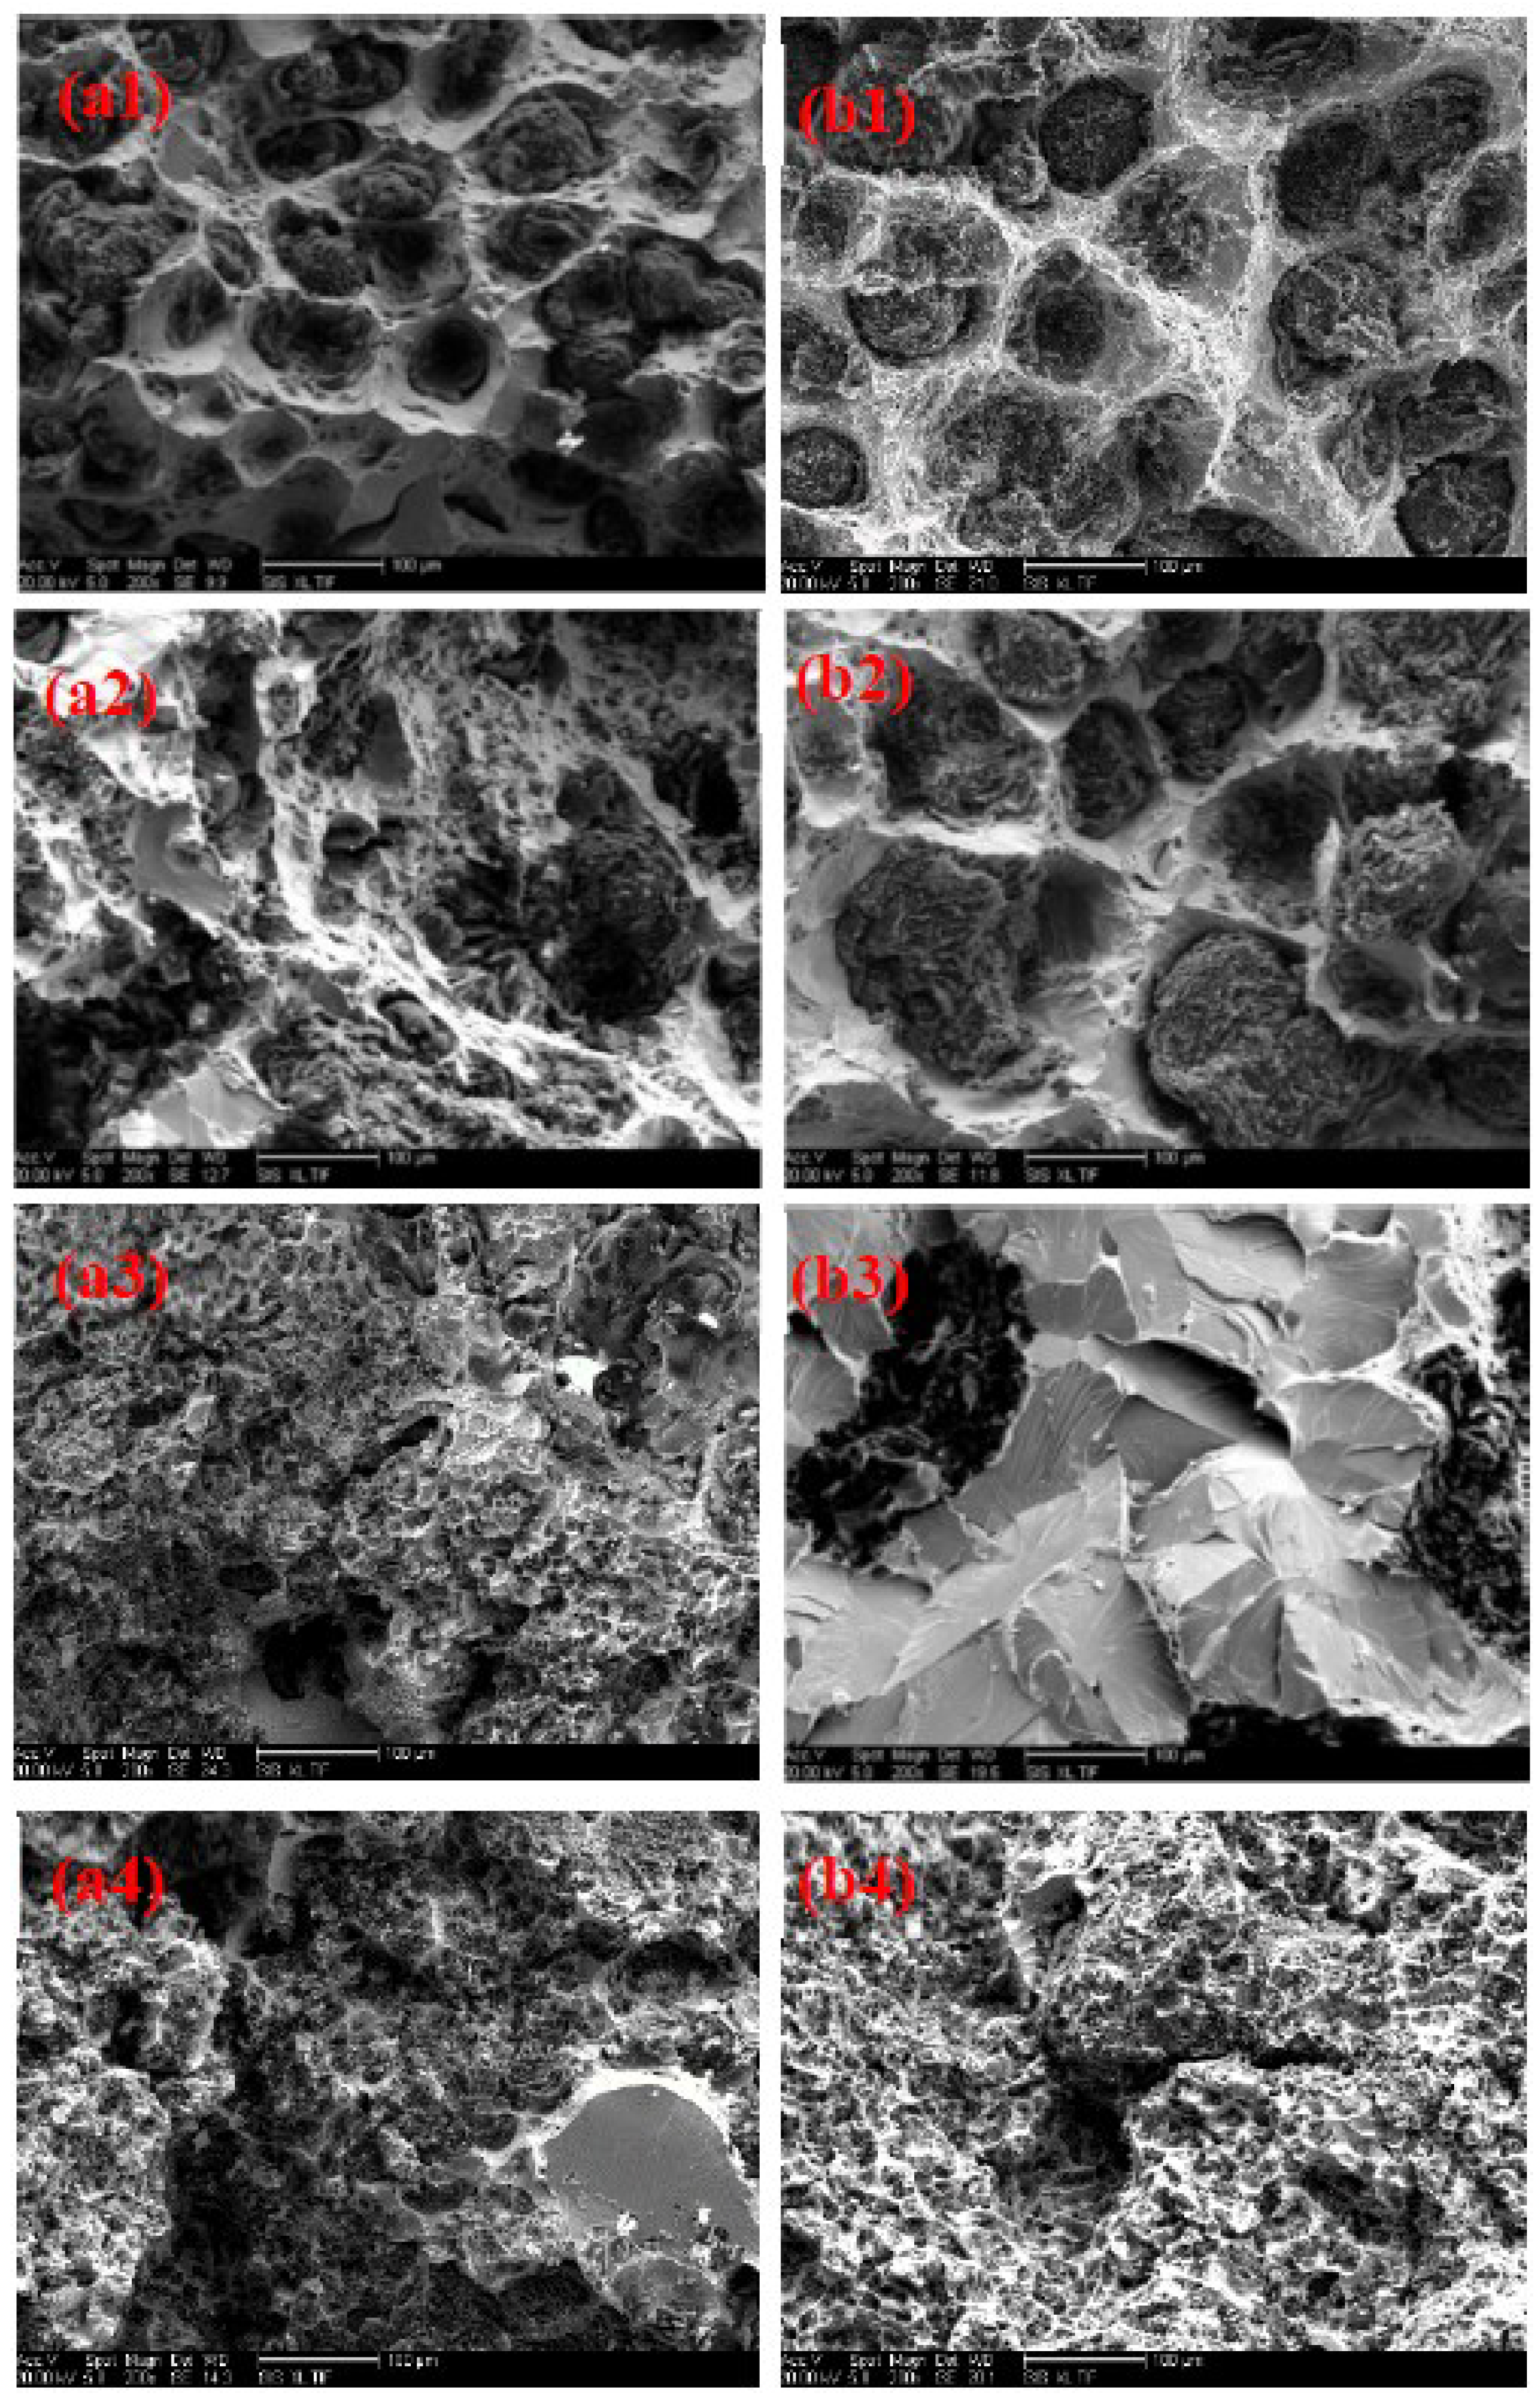
As shown in Figure 7a4,b3,b4, there is a large amount of small cleavage planes. The aggregation of chunky graphite occurs. The stress concentration forms easily at the areas of aggregation during the test, while micro-cracks originate and connect with the other cracks surrounding the areas of aggregation. Therefore, the fracture morphology of specimens A4, B3 and B4 is that of brittle fracture.
3.4. The Microscopic Fracture Process of Vermicular Graphite of Heavy Section Ductile Iron
Figure 8 shows the microscopic fracture process of vermicular graphite of heavy-section ductile cast iron. Several typical locations were selected to observe the fracture process of graphite. In Figure 8a1, VG1 is vermicular graphite. When the stretch of specimen is 2.1 mm, micro-crack CVG1 occurs within VG1 (Figure 8a2). The micro-crack initiates at the graphite-matrix(G-M) interface and extends along the G-M interface. The micro-crack CVG1 tears the ferrite matrix at the sharp corners of vermicular graphite. Some local plastic deformation and a small amount of slip bands can be observed in front of the micro-cracks (Figure 8a3). It can be inferred that the stress concentration is significant at the location of sharp cracks in CVG1.
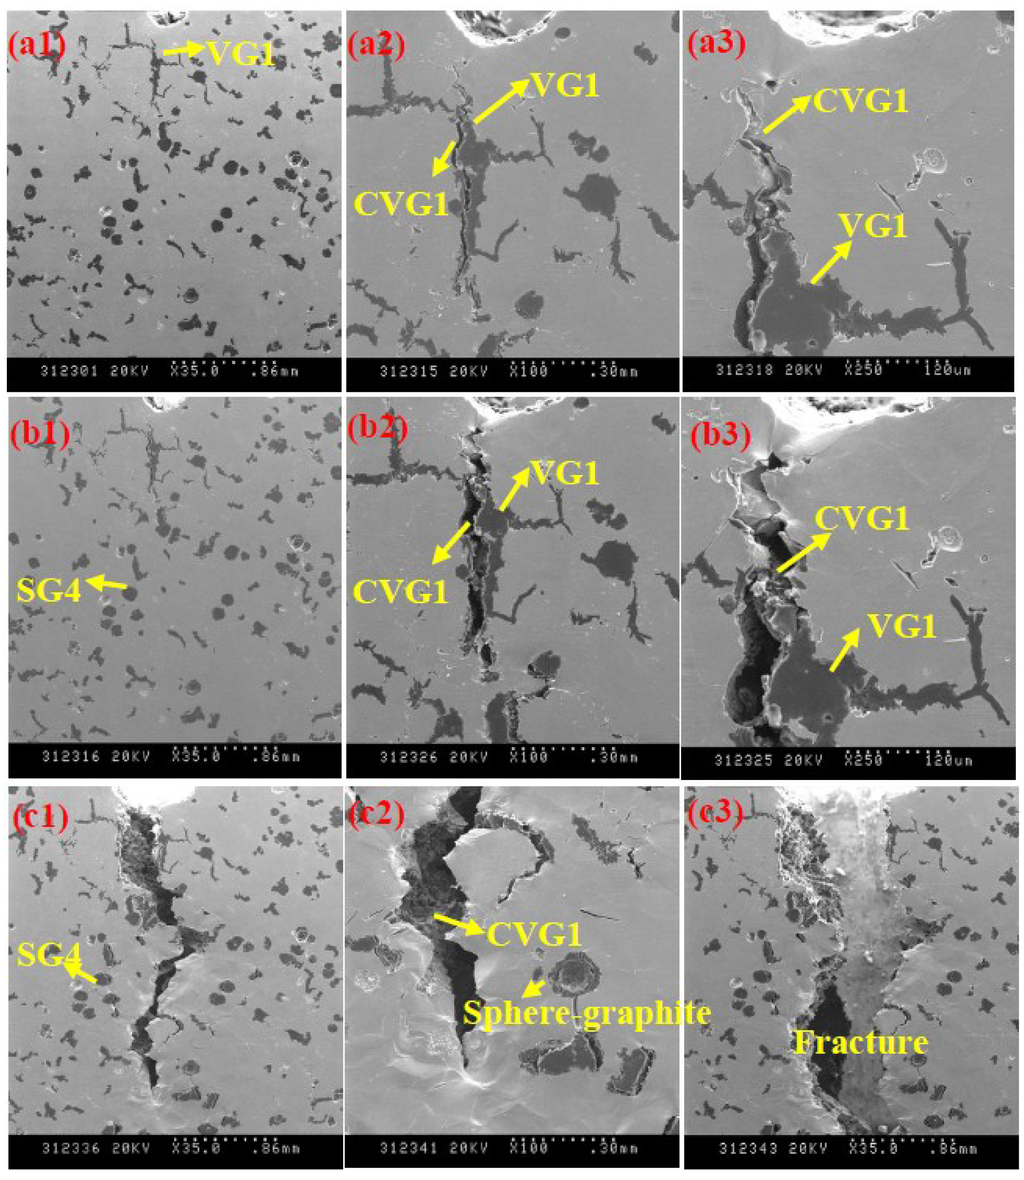
Figure 8.
The crack process of vermicular graphite of heavy section ductile iron. (a1), (a2) and (a3): the stretch of specimen is 2.1 mm; (b1), (b2) and (b3): the stretch of specimen is 2.25 mm; (c1), (c2) and (c3): the stretch of specimen is 2.45 mm.
Figure 8.
The crack process of vermicular graphite of heavy section ductile iron. (a1), (a2) and (a3): the stretch of specimen is 2.1 mm; (b1), (b2) and (b3): the stretch of specimen is 2.25 mm; (c1), (c2) and (c3): the stretch of specimen is 2.45 mm.
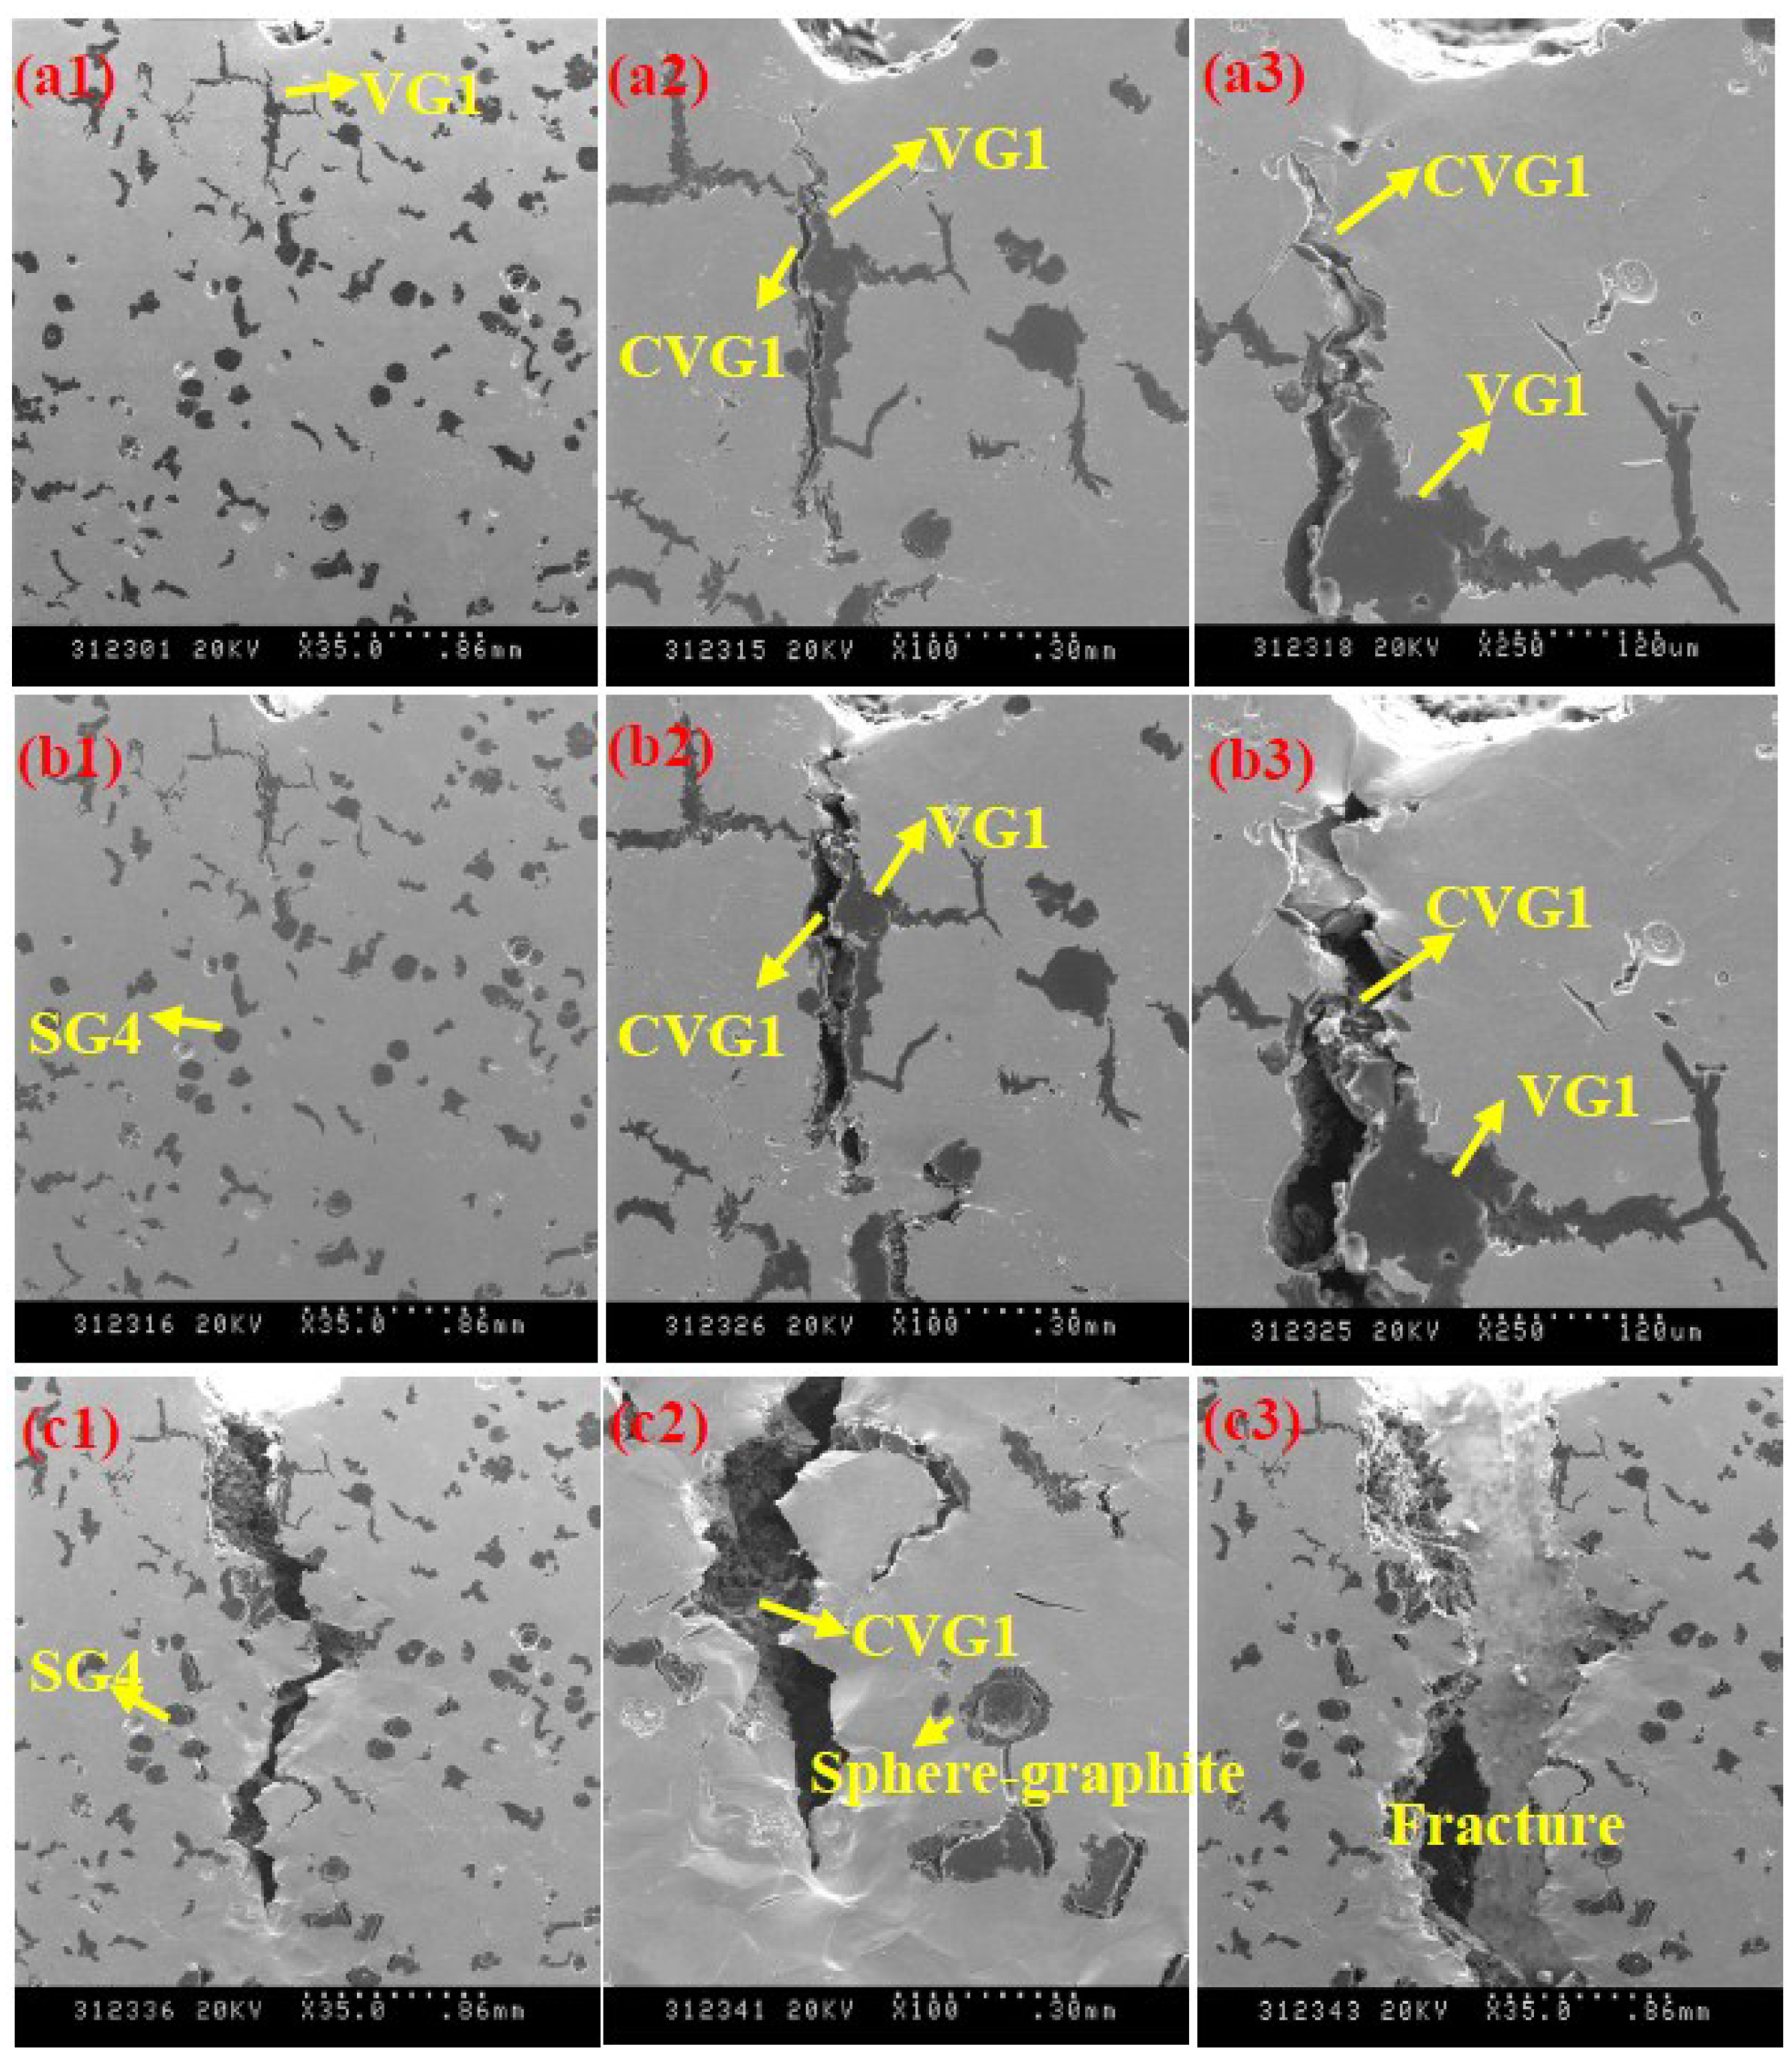
As shown in Figure 8b1, SG4 is spheroidal graphite. When the stretch of specimen is 2.25 mm, the spheroidal graphite SG4 shows no micro-crack initiation. The micro-crack CVG1 extends and becomes wider, as shown in Figure 8b2. The micro-crack CVG1 tears the ferrite matrix and extends to the pre-crack notch. Obvious plastic deformation can be observed in front of the micro-crack in the ferrite matrix, as shown in Figure 8b3.
When the stretch of specimen is 2.45 mm, the micro-crack CVG1 further widens and extends, as shown in Figure 8c1. CVG1 tears the ferrite matrix and connects with the pre-crack notch. A main crack in the matrix is formed. At the tip of the main crack, severe plastic deformation can be observed in the matrix, as shown in Figure 8 (c2). The spherical graphite around the main crack is stripped from the ferrite matrix and plastic deformation is generated, which causes a further concentration of stress on the main crack tip. The main crack propagates unstably and eventually causes fracture, as shown in Figure 8c3.
From the discussion above, it is clear that the vermicular graphite most likely initiates cracks along the G-M interface under the external force. The micro-cracks cause the ferrite matrix to be easily torn and extend unstably because the stress cannot be released by the plastic deformation of the matrix. The vermicular graphite can significantly reduce the conventional mechanical properties and fracture toughness of heavy section ductile iron.
3.5. The Microscopic Fracture Process of Temper Graphite of Heavy Section Ductile Iron
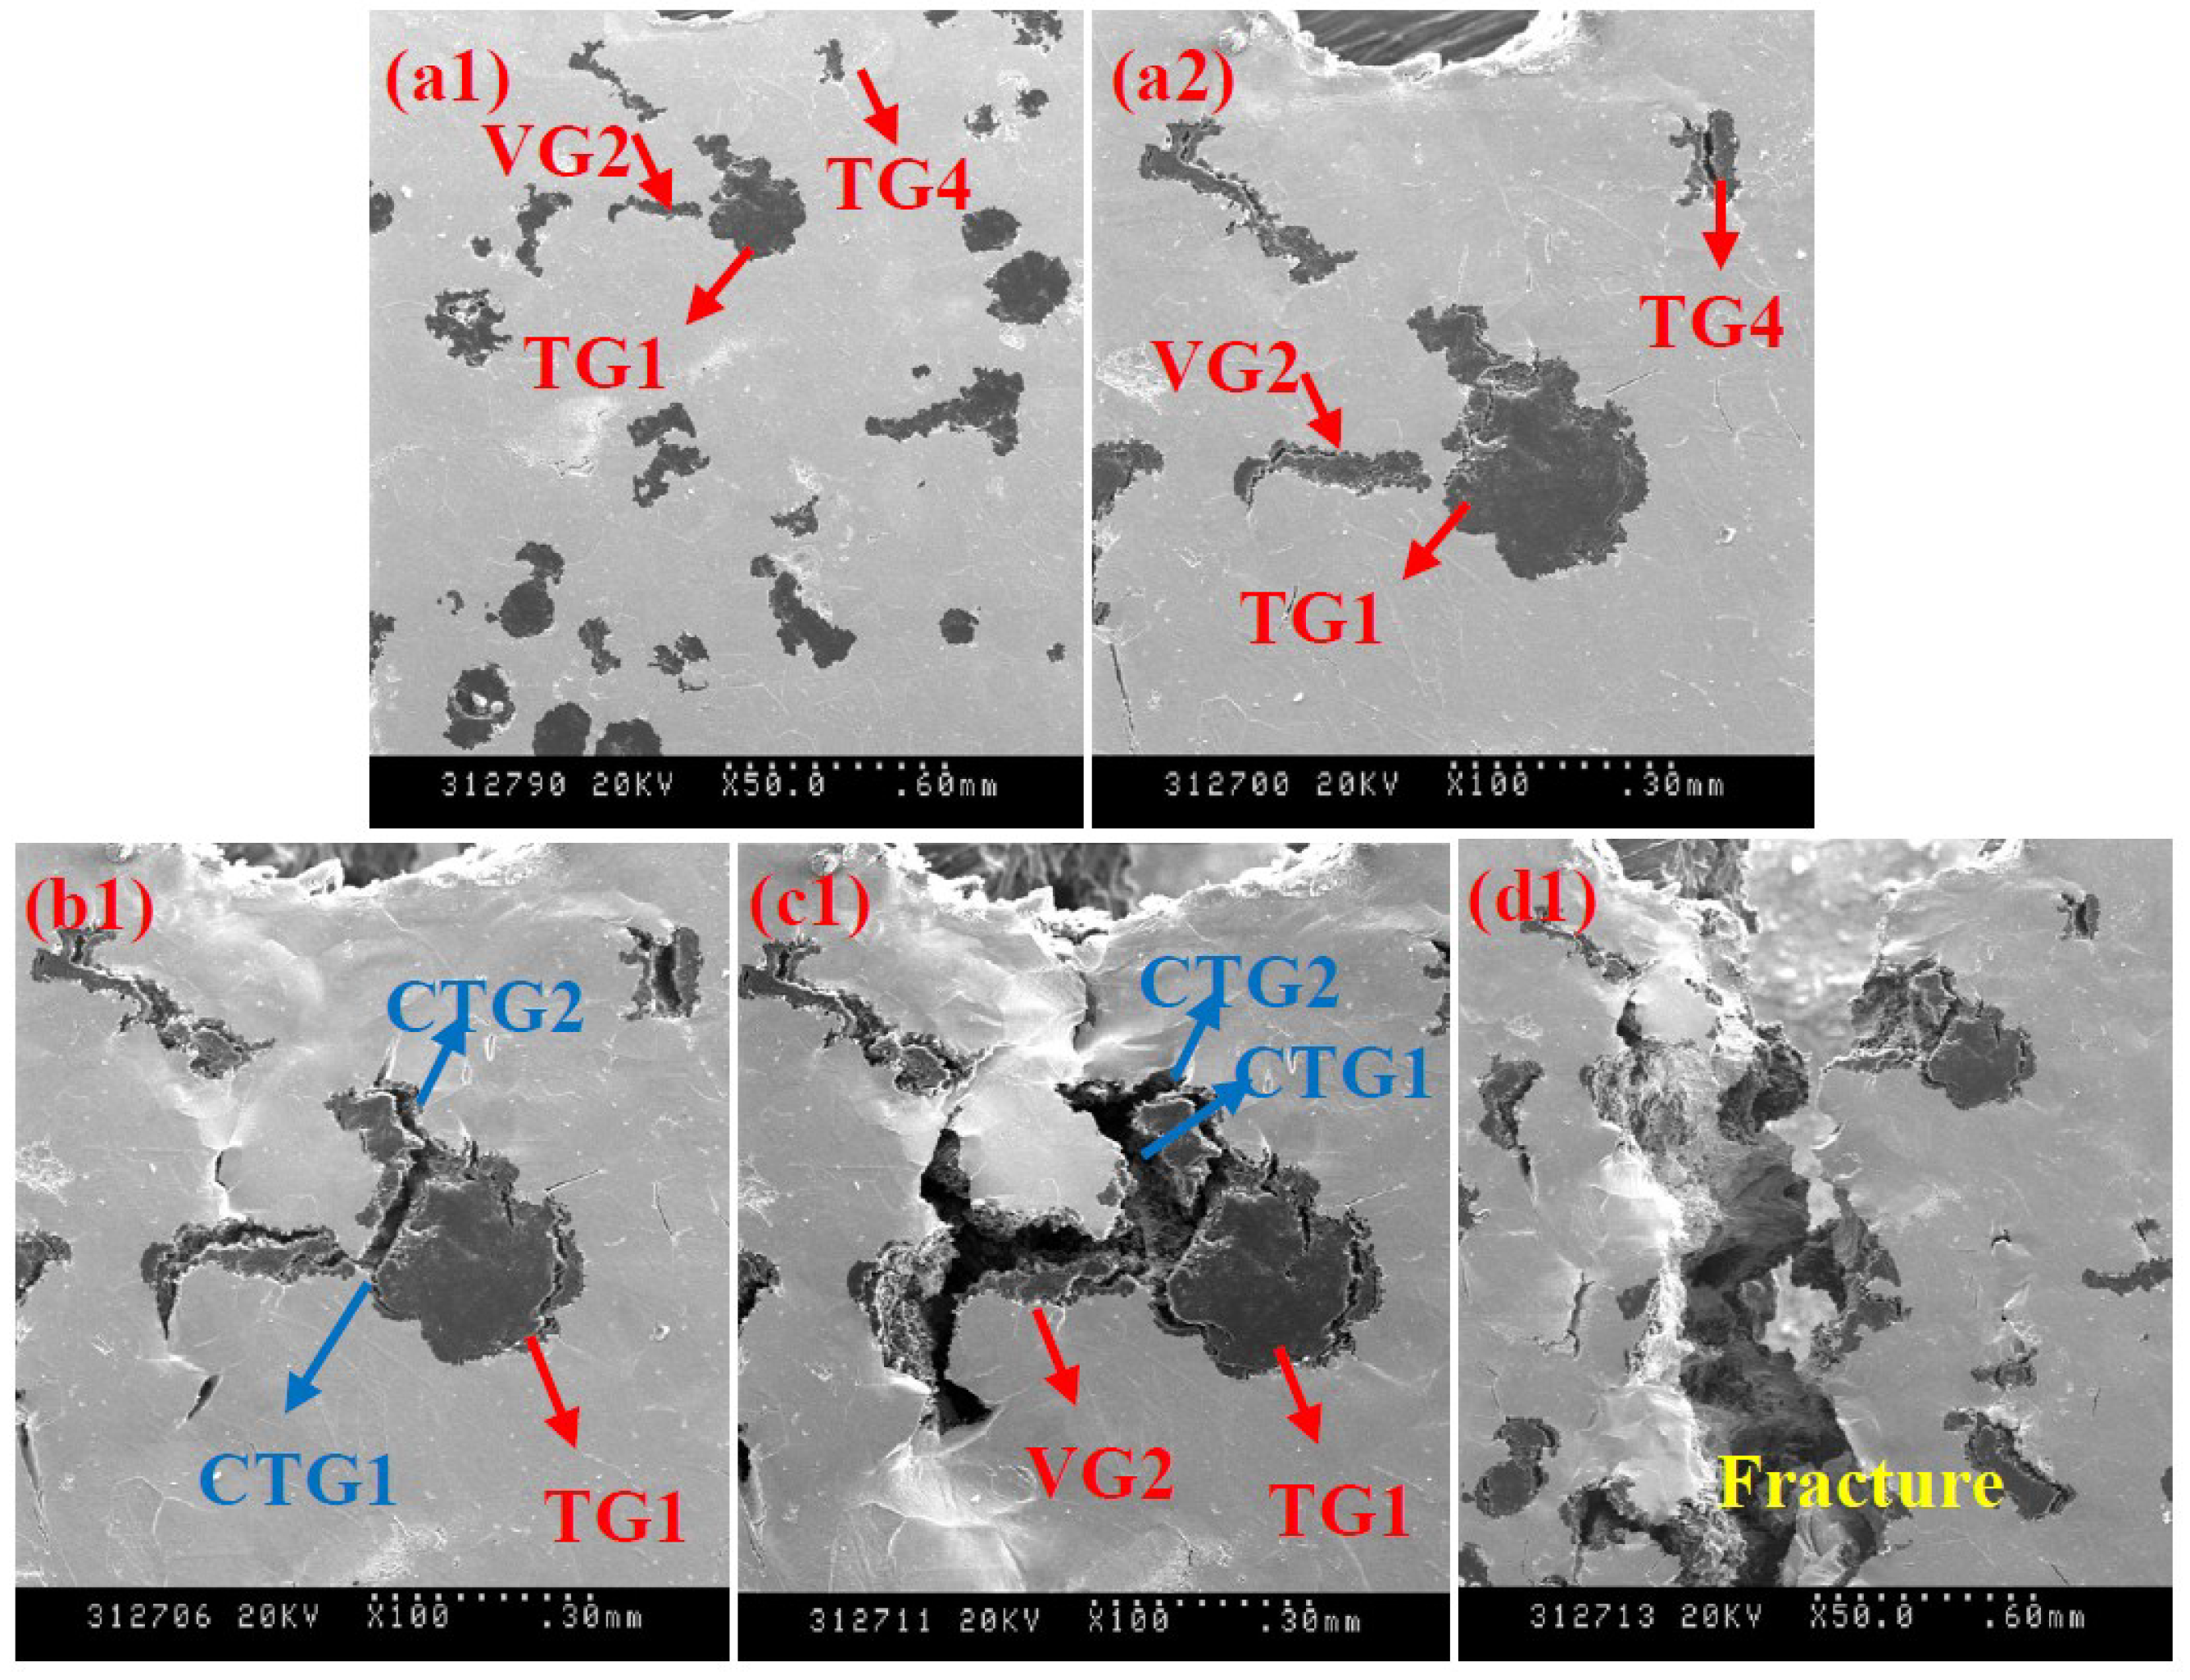
Figure 9 shows the microscopic fracture process of temper graphite of heavy section ductile iron. Several typical locations were selected to observe the fracture process of graphite. As shown in Figure 9a1, TG1, TG4 and VG2 is temper graphite, temper graphite and vermicular graphite, respectively. When the stretch of specimen is 2.1 mm, the micro-cracks can be observed in TG1, TG4 and VG2, as shown in Figure 9a2. When the stretch of specimen is 2.25 mm, two micro-cracks CTG1 and CTG2 initiate at the tangential direction of the spheroidal section of temper graphite TG1, as shown in Figure 9b1. Obvious plastic deformation and slip bands can be observed in front of micro-cracks in the ferrite matrix. It can be inferred that stress concentration occurs at the corners of TG1 and the ferrite matrix is torn. When the stretch of specimen is 2.45 mm, the micro-cracks in TG1 further extend, as shown in Figure 9c1. The micro-crack CTG1 in temper graphite TG1 tears the ferrite matrix and connects with the micro-crack in vermicular graphite VG2. The micro-crack CTG2 extends along with G-M interface of dendritic branching part of TG1, and eventually tears the ferrite matrix. When the stretch of specimen is 2.79 mm, the micro-cracks in TG1 and VG2 further extend and connect with each other, forming a major crack and causing final fracture, as shown in Figure 9d1.
From the discussion above, it is clear that the temper graphite most likely initiates cracks throughout the graphite or along the G-M interface under the external force. High local stress concentration occurs due to the presence of sharp corners of temper graphite. The matrix at the sharp corners is torn up and the micro-cracks extend unstably. The temper graphite can significantly reduce the conventional mechanical properties and fracture toughness of heavy section ductile iron.
4. Conclusions
Under the present conditions, with the increase of Si content, the mechanical properties of ductile iron decreased. When the Si content exceeds 1.78 wt.% and reaches 2.74 wt.%, the impact and fracture toughness of the fracture morphology transforms from ductile to brittle fracture.
The vermicular graphite most likely initiates micro-cracks along the G-M interface under the external force. The micro-cracks cause the ferrite matrix to easily torn, and extend unstably because the stress cannot be released by the plastic deformation of the matrix. The vermicular graphite can significantly reduce the conventional mechanical properties and fracture toughness of heavy section ductile iron.
The temper graphite most likely initiates cracks throughout the graphite or along the G-M interface under the external force. High local stress concentration occurs due to the presence of sharp corners of temper graphite, which causes the unstable extension of micro-cracks. The temper graphite can significantly reduce the mechanical properties and fracture toughness of heavy section ductile iron.
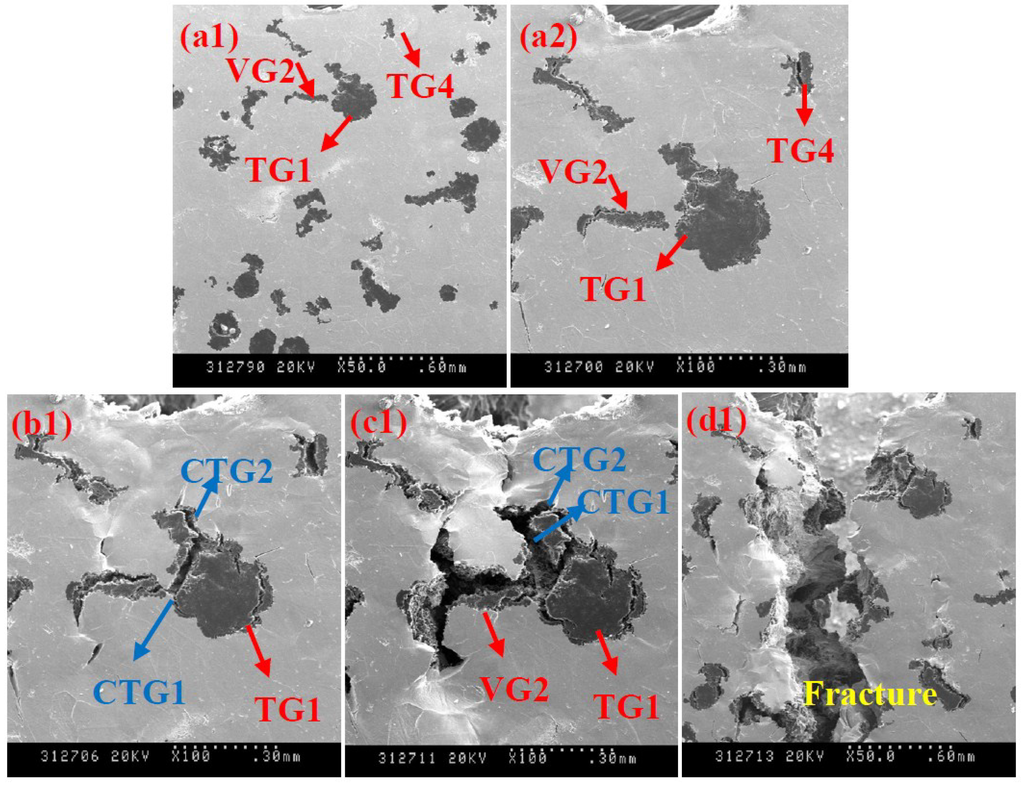
Figure 9.
The crack process of temper graphite in heavy section ductile iron. (a1) and (a2): the stretch of specimen is 2.1 mm; (b1): the stretch of specimen is 2.25 mm; (c1): the stretch of specimen is 2.45 mm; (d1): the stretch of specimen is 2.79 mm.
Figure 9.
The crack process of temper graphite in heavy section ductile iron. (a1) and (a2): the stretch of specimen is 2.1 mm; (b1): the stretch of specimen is 2.25 mm; (c1): the stretch of specimen is 2.45 mm; (d1): the stretch of specimen is 2.79 mm.
Acknowledgments
This study was financially supported by National Natural Science Foundation of China (No. 51174068 and 51374086).
Author Contributions
The authors would like to acknowledge Liang Song for carrying out the experimental work and mechanism analyzing work at “Heilongjiang University of Science and Technology”, China. Erjun Guo, Liping Wang, and Dongrong Liu would like to acknowledge very much, for the experimental support.
Conflicts of Interest
The authors declare no conflict of interest.
References
- Cai, Q.H.; Wei, B.K. Recent Development of ductile cast iron production technology in China. China Foundry 2008, 5, 82–91. [Google Scholar]
- Dong, M.J.; Berdin, C.; Beranger, A.S. Damage effect in the fracture toughness of nodular cast iron. J. Phys. IV France 1996, 6, 65–74. [Google Scholar] [CrossRef]
- König, M. Literature review of microstructure formation in compacted graphite iron. Int. J. Cast Met. Res. 2010, 23, 185–192. [Google Scholar] [CrossRef]
- Riposan, I.; Chisamera, M.; Stanper, S. Peformance of heavy ductile iron castings for windmills. China Foundary 2010, 3, 163–170. [Google Scholar]
- Larrañaga, P.; Asenjo, I.; Sertucha, J. Effect of antimony and cerium on the formation of chunky graphite during solidification of heavy-section castings of near-eutectic spheroidal graphite irons. Metall. Mater. Trans. A 2009, 40, 65–74. [Google Scholar] [CrossRef]
- Toktaş, G.; Toktaş, A.; Tayanç, M. Influence of matrix structure on the fatigue properties of an alloyed ductile iron. Mater. Des. 2008, 29, 1600–1608. [Google Scholar] [CrossRef]
- Fredriksson, H.; Stjerndahl, J.; Tinoco, J. On the solidification of nodular iron and its relation to the expansion and contraction. Mater. Sci. Eng. A 2005, 413, 363–372. [Google Scholar] [CrossRef]
- Cho, G.S.; Choe, K.H.; Lee, K.W. Effects of alloying elements on the microstructures and mechanical properties of heavy section ductile cast iron. J. Mater. Sci. Technol. 2007, 23, 97–101. [Google Scholar] [CrossRef]
- Yeung, C.F.; Zhao, H.; Lee, W.B. Effect of homogenisation treatment on segregation of silicon in ferritic ductile irons: A colour metallographic study. Mater. Sci. Technol. 1999, 15, 733–737. [Google Scholar] [CrossRef]
- Wang, L.; Guo, E.; Jiang, W. Physical modeling of spent-nuclear fuel container. China Foundry 2012, 9, 366–369. [Google Scholar]
- Baer, W.; Wossidlo, P.; Abbasi, B. Large scale tesing and statistical analysis of dynamic fracture toughness of ductile cast iron. Eng. Fract. Mechanics 2009, 76, 1024–1036. [Google Scholar] [CrossRef]
- Minnebo, P.; Nilsson, K.F.; Blagoeva, D. Tensile, compression and fracture properties of thick-walled ductile cast iron components. J. Mater. Eng. Perform. 2007, 16, 35–45. [Google Scholar] [CrossRef]
- Iacoviello, F.; Di Bartolomeo, O.; Di Cocco, V. Damaging micromechanisms in ferritic-pearlitic ductile cast irons. Mater. Sci. Eng. A 2008, 478, 181–186. [Google Scholar] [CrossRef]
- Nakae, H.; Jung, S.; Kitazawa, T. Eutectic solidification mode of spheroidal graphite cast iron and graphitization. China Foundry 2007, 4, 34–37. [Google Scholar]
- Song, L.; Guo, E.; Tan, C. Effect of Bi on graphite morphology and mechanical properties of heavy section ductile cast iron. China Foundry 2014, 2, 125–131. [Google Scholar]
- Mourujärvi, A.; Widell, K.; Saukkonen, T. Influence of chunky graphite on mechanical and fatigue properties of heavy-section cast iron. Fatigue Fract. Eng. Mat. Str. 2009, 32, 379–390. [Google Scholar] [CrossRef]
- Asenjo, I.; Larranaga, P.; Sertucha, J. Effect of mould inoculation on formation of chunky graphite in heavy section spheroidal graphite cast iron parts. Int. J. Cast. Metal. Res. 2007, 20, 319–324. [Google Scholar] [CrossRef]
© 2015 by the authors; licensee MDPI, Basel, Switzerland. This article is an open access article distributed under the terms and conditions of the Creative Commons Attribution license (http://creativecommons.org/licenses/by/4.0/).
