Abstract
Sintered metal porous media currently plays an important role in air bearing systems. When flowing through porous media, the flow properties are generally represented by incompressible Darcy-Forchheimer regime or Ergun regime. In this study, a modified Ergun equation, which includes air compressibility effects, is developed to describe friction characteristic. Experimental and theoretical investigations on friction characteristic are conducted with a series of metal-sintered porous media. Re = 10 is selected as the boundary for a viscous drag region and a form drag region. Experimental data are first used to determine the coefficient α in the viscous drag region, and then the coefficient β in the form drag region, rather than both simultaneously. Also, the theoretical mass flow rate in terms of the modified Ergun equation provides close approximations to the experimental data. Finally, it is also known that both the air compressibility and inertial effects can obviously enhance the pressure drop.
1. Introduction
Air flow through porous media is universal in a broad range of industrial equipments, e.g., filters, heat exchanges, catalytic reactors and pneumatic silencers. In such porous media the distribution of pores with respect to shape and size is irregular [1]. Therefore, the porous media easily provide impedance when they are connected in a pneumatic circuit. There is a crucial need for an accurate description of the friction characteristic in order to evaluate their performance. In pneumatics, it is generally known that flow rate characteristics of normal pneumatic components are characterized in terms of sonic conductance and critical pressure ratio by the ISO 6358 standard [2], which is deduced from isentropic flow through a perfect nozzle, or by an ISO expanded expression proposed by Oneyama in 2003 [3]. Unfortunately, the flow pathway in porous media is much more complicated than that of the ordinary pneumatic components, and there is no such a generalized specification for characterizing the flow throughout porous medium.
A number of studies [4,5,6,7] have demonstrated the physics of flow through porous media under the assumption that the internal structure is isotropic and homogeneous. The results revealed that the linear Darcy regime [4] can properly predict the flow behavior when the flow velocity is sufficiently small, or in other words, when the regime is dominated by viscous effects. However, when inertial effects become dominant, the pressure gradient versus flow velocity exhibit a nonlinear relation. On this issue, probably the two most known equations including the effects of viscosity and inertia should be the Forchheimer equation and the Ergun equation [8,9]. Many researchers have attempted to correlate experimental data to assess the flow characteristics of porous media using the two fundamental equations. Early experimental works by Beavers et al. [10,11] indicate that the flow characteristics of fibrous porous media can be clarified by Forchheimer equation with appropriate permeability and inertial coefficient. Montillet et al. [12] proposed a correlating equation to predict pressure drops through packed beds and provided experimental evidence for validation. Antohe et al. [13] presented a study that uses the Forchheimer extended flow model to compute the permeability and inertial coefficient for the compressed aluminum matrices. Dukhan and Minjeur [14] suggested the use of two permeabilities, one for the Darcy regime and another for the Forchheimer regime, to depict pressure drop properties. Moreover, Dukhan and Patel [15,16], Dukhan and Ali [17] experimentally investigated wall, size, entrance and exit effects on permeability and form drag coefficient. In addition to the use of Forchheimer equation, Dukhan [18] also verified the validity of the Ergun-type relationship to characterize pressure drop with respect to flow velocity and confirmed that both permeability and inertial coefficient correlate well with porosity. Du Plessis [19] theoretically derived a momentum transport equation for fully-developed flow in porous media which is based on Ergun equation. J.F. Liu [20] described the friction characteristic based on the measured pressure drop of air through foam matrixes using an empirical equation which is similar to Ergun equation.
According to the literature survey it is noted that porous media with a high range of porosities (over 80%) have been frequently used in earlier applications, and, existing references that use either the Forchheimer regime or the Ergun equation, commonly neglect the velocity gradient in the flow direction. When unidirectional airflow passes through those loose media, air compressibility is negligible due to slight pressure drops, and velocity in the flow direction is generally considered constant [21,22,23]. However, in contemporary air-bearing feeding systems, porous media fabricated by sintered metal that have a small porosity also receive great attention. Belforte et al. [24,25] showed a considerable pressure drop between the upstream and downstream, and verified the capability of porous media to eliminate pressure peak compared with the case involving an orifice. Amano et al. [26] and Oiwa et al. [27] developed air conveyor systems that use sintered metal porous air supply pads. In these applications, air compressibility cannot be ignored, and therefore, the conventional correlation of friction characteristics needs to be reconstructed. The authors [28] have developed a modified Forchheimer equation to represent the pressure drop characteristic for a series of metal sintered porous media, but the feasibility in terms of the Ergun equation is not yet known and also needs to be confirmed.
In this study, we determined the friction characteristic in terms of a modified Ergun equation. Several sintered metal porous resistances were tested, and the effectiveness of the proposed correlation was experimentally verified.
2. Theoretical Section
Porous media consist of thousands of irregular pores, and its microstructure is characterized by several factors, such as pore size, pore shape, and porosity. The physical model of airflow through porous media is schematically shown in Figure 1, and the following assumptions are made to enable a theoretical derivation.
(1) The flow is steady and fully developed. (2) The porous medium is isotropic and homogeneous, so its property parameters are constant. (3) The flow is in the horizontal direction only. (4) The flow through the porous medium remains isothermal.

Figure 1.
Schematic of flow through porous medium.
Figure 1.
Schematic of flow through porous medium.
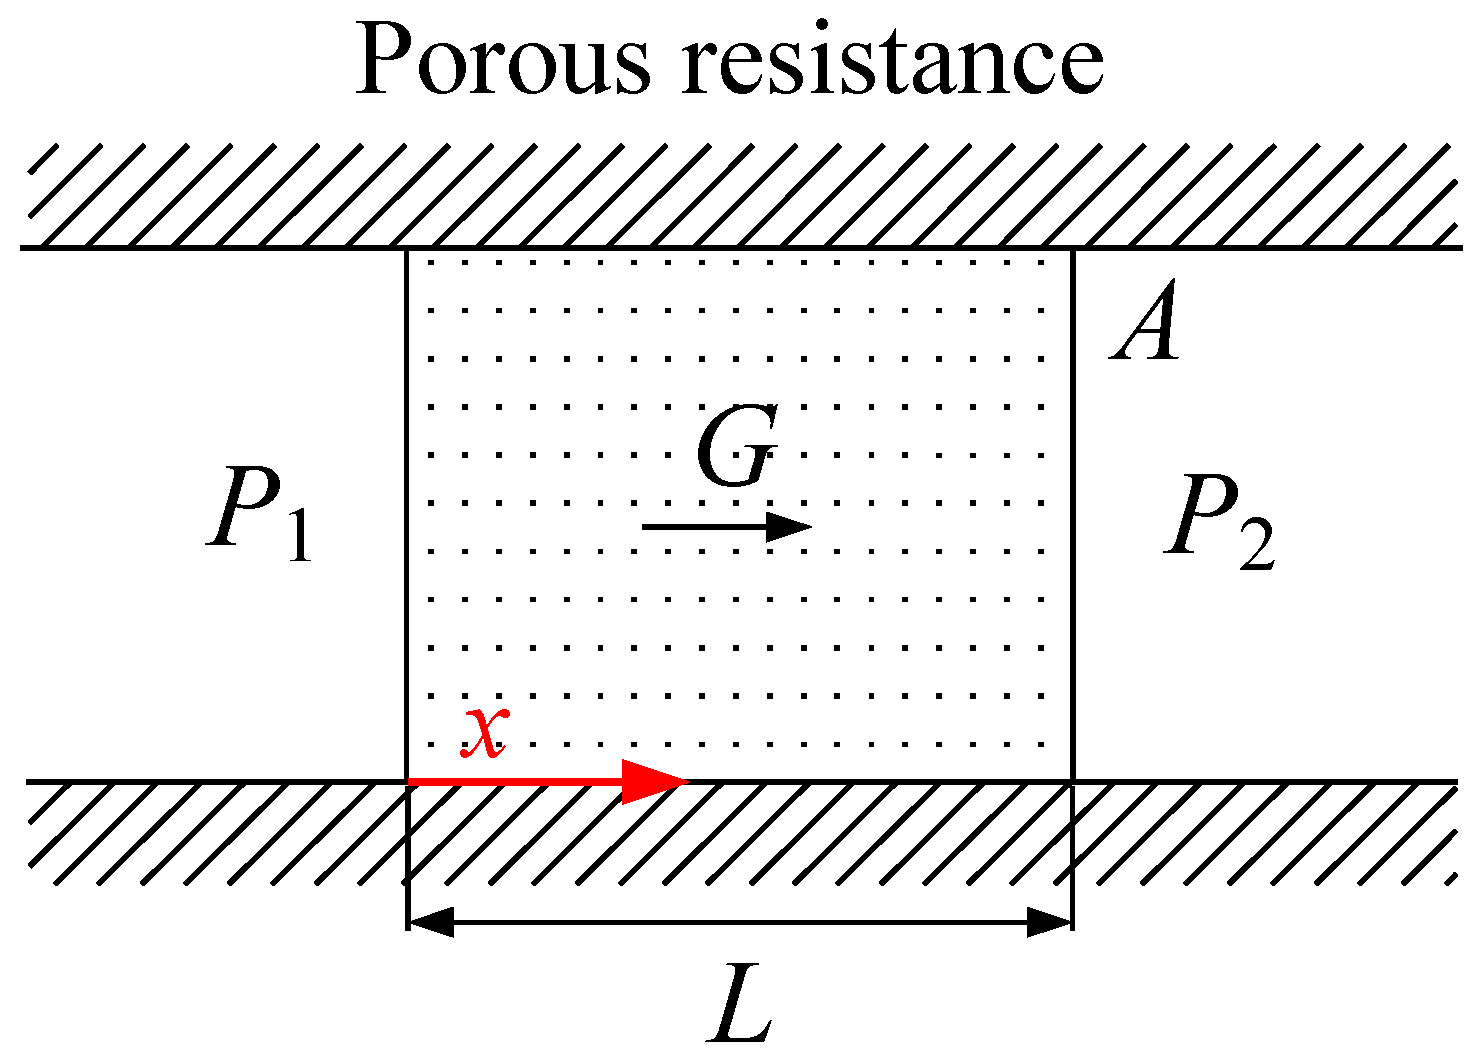
Consequently, the mean flow velocity changes with the air density along the length direction and is written in the following form [25]
where v is the flow velocity, G is the mass flow rate, ρ is the density and A is the cross-sectional area.
Assuming that the air is a perfect gas, density ρ is expressed in the following form according to the ideal gas state equation
where P is the pressure, R is the gas constant and T is the temperature.
Ergun [8] published an empirical relation for describing the pressure drop through porous media based on the porosity and a geometrical length scale as
where α is a factor for the viscous drag portion of the pressure drop, β is a factor for the form drag portion, ε is the porosity and Dp is the particle diameter. In addition, a coefficient of sphericity φ, which multiplies the particle diameter, is employed in the equation in order to correct the pressure losses.
The construction of Ergun equation was based on modeling the space between packed beds of spheres as parallel capillaries, with the first term accounting for viscous effects and the other term for kinetic effects. The multipliers α and β can be viewed as correction factors to account for the geometrical difference between flow paths through packed spheres and parallel capillaries, Dukhan et al. [29]. Substituting Equations (1) and (2) into Equation (3), the Ergun equation takes the following form for an incompressible flow
The Reynolds number based on porosity ε and particle diameter Dp is given by
A dimensionless friction factor f is defined as
Substituting Equations (5) and (6) into Equation (3), we obtain the following correlation for the friction factor as a function of the Reynolds number
For traditional Ergun, coefficients α and β are valued 150 and 1.75, respectively. However, by experiments, we found that the coefficients differ from these values. Experimental method and results will be clarified in the next two sections.
3. Experimental Section
A series of commercial porous resistances with different dimensions were selected from many specimens, and are designated as #1 to #6 in Figure 2. Each sample was a cylinder having a length of 2, 5, 2, 4, 10, and 3 mm and a diameter of 4, 4, 8, 8, 8, and 12 mm. All of these samples were fabricated by sintering SUS316L powder into a cylindrical shape at a temperature above 1000 °C. During sintering, complicated flow paths were formed by interconnected and dead-end pores, as shown in the microscope photograph of the porous surface (Figure 2). The average particle diameter Dp is approximately 75 μm for #1 and #3, approximately 90 μm for #2 and #5, and approximately 50 μm for #4 and #6. Porosity ε, defined as the fraction of the total volume that is occupied by void space, is calculated as follows
where γ = 8.03 × 10³ kg/m3 is the density of the steel alloy, m is the mass of the resistance, L is the length, and D is the diameter. Dimensions, weights, porosities, average particle diameters, coefficient of sphericity and hydraulic diameter of the test resistances are tabulated in Table 1.

Table 1.
Dimensions, weights, porosities, average particle diameters, coefficient of sphericity and hydraulic diameter of the test resistances.
| Porous media | Diameter (mm) | Length (mm) | Weight (g) | Porosity | Particle diameter (μm) | Hydraulic diameter (μm) |
|---|---|---|---|---|---|---|
| #1 | 4 | 2 | 0.122 | 0.397 | 75 | 16.5 |
| #2 | 4 | 5 | 0.277 | 0.451 | 90 | 24.6 |
| #3 | 8 | 2 | 0.494 | 0.388 | 75 | 15.8 |
| #4 | 8 | 4 | 0.974 | 0.379 | 50 | 10.2 |
| #5 | 8 | 10 | 2.301 | 0.430 | 90 | 22.6 |
| #6 | 12 | 3 | 1.476 | 0.458 | 50 | 14.1 |
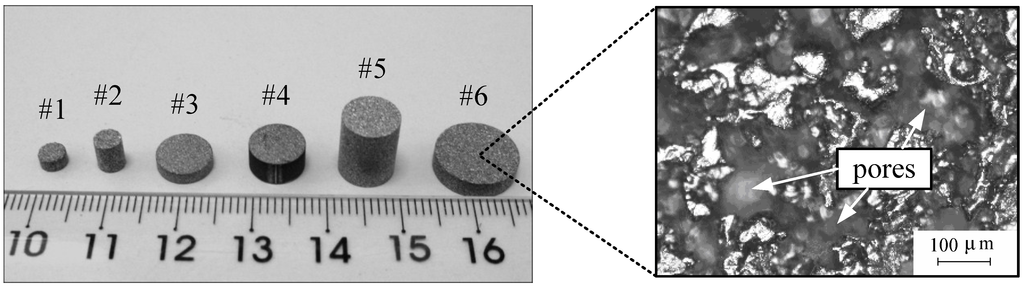
Figure 2.
Test porous resistances.
Figure 2.
Test porous resistances.

The arrangement of the pneumatic circuit is shown in Figure 3. The porous resistance is sealed in a metal sleeve using a cylindrical rubber to prevent possible leakage between the side face and the sleeve. Compressed air is supplied and regulated to the selected pressure. The buffer tank with a volume of 30 L, located after the pressure regulator, is used to stabilize the supply pressure. Two calibrated pressure gauges are respectively placed upstream and downstream of the porous resistance, and an adjustable valve is connected to change the downstream pressure. The upstream and downstream pressure gauges are installed at a distance not less than three times the resistance length before and after the medium to avoid the entrance and exit effect [16]. It should be noted that the pressure drops in the connecting pipes are negligibly small in comparison with that in the porous media and it is believable the pressure data can be measured with sufficient accuracy and do not need any correction. The total air volume through the porous resistance is collected by a dry test gas meter which has a range of 0.04~6 m3/s, with a stopwatch used to record the time and then to calculate the mean flow rate. An attempt was also made in advance to clarify the effects of flow direction by reversing the resistance position relative to the flow direction. No apparent variation in flow rate measured under the same pressure condition was observed before and after the position changed. This result validates that the friction characteristic is independent of the flow direction.
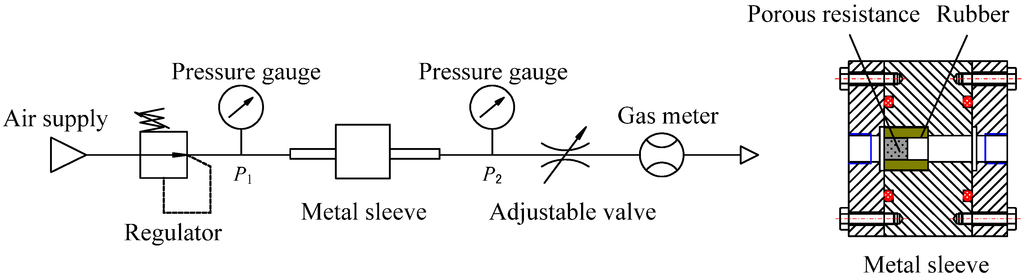
Figure 3.
Schematic of experimental setup.
Figure 3.
Schematic of experimental setup.

During the experiments, the procedure is performed as follows: (1) maintain a steady flow rate and keep the upstream pressure unchangeable at 584.9 kPa. (2) Use the adjustable valve to change the pressure ratio P2/P1, and record the paired pressure and flow rate for more than 20 points. To reduce the uncertainty, steady flow is maintained at least 30 s for procuring each data point, and the measurements are repeated three times for each sample to get an average result. In the case of small pressure drop, a differential pressure transducer (KL17 [30], Nagano Keiki Co., Tokyo, Japan), with a measuring range of 0~2 kPa, is used to measure the pressure difference, and correspondingly, the gas meter is replaced by a wet type one with a measuring range of 0.016~5 L/min.
4. Results and Discussion
The first term on the right-hand side of Equation (4) represents the viscous drag portion of the pressure drop, and therefore, the coefficient α can be determined by the experimental data under small pressure drop. The pressure drop results (<1.5 kPa) are considered negligibly small in comparison with the supply pressure, and therefore air is treated as incompressible fluid, without density variation. Figure 4 shows that the pressure drop (0 to 1 kPa) is in close linearity to the flow rate, a result implying that form drag effects are negligible. If we visualize the porous medium as a bundle of tubes, it is not difficult to understand the linear relationship with the knowledge of equivalent hydraulic diameter. In the meantime, it should be noted that the medium size also plays an important role in the relationship between the pressure drop and the flow rate. Therefore, a least squares straight line is passed through the data points, with the slope proportional to the coefficient α. Then, all the data are used to gain the coefficient β by Equation (4). The R2 value for the linear fitting line exceeds 0.99 for all the test media so that the error is thought to be acceptable for the calculation.
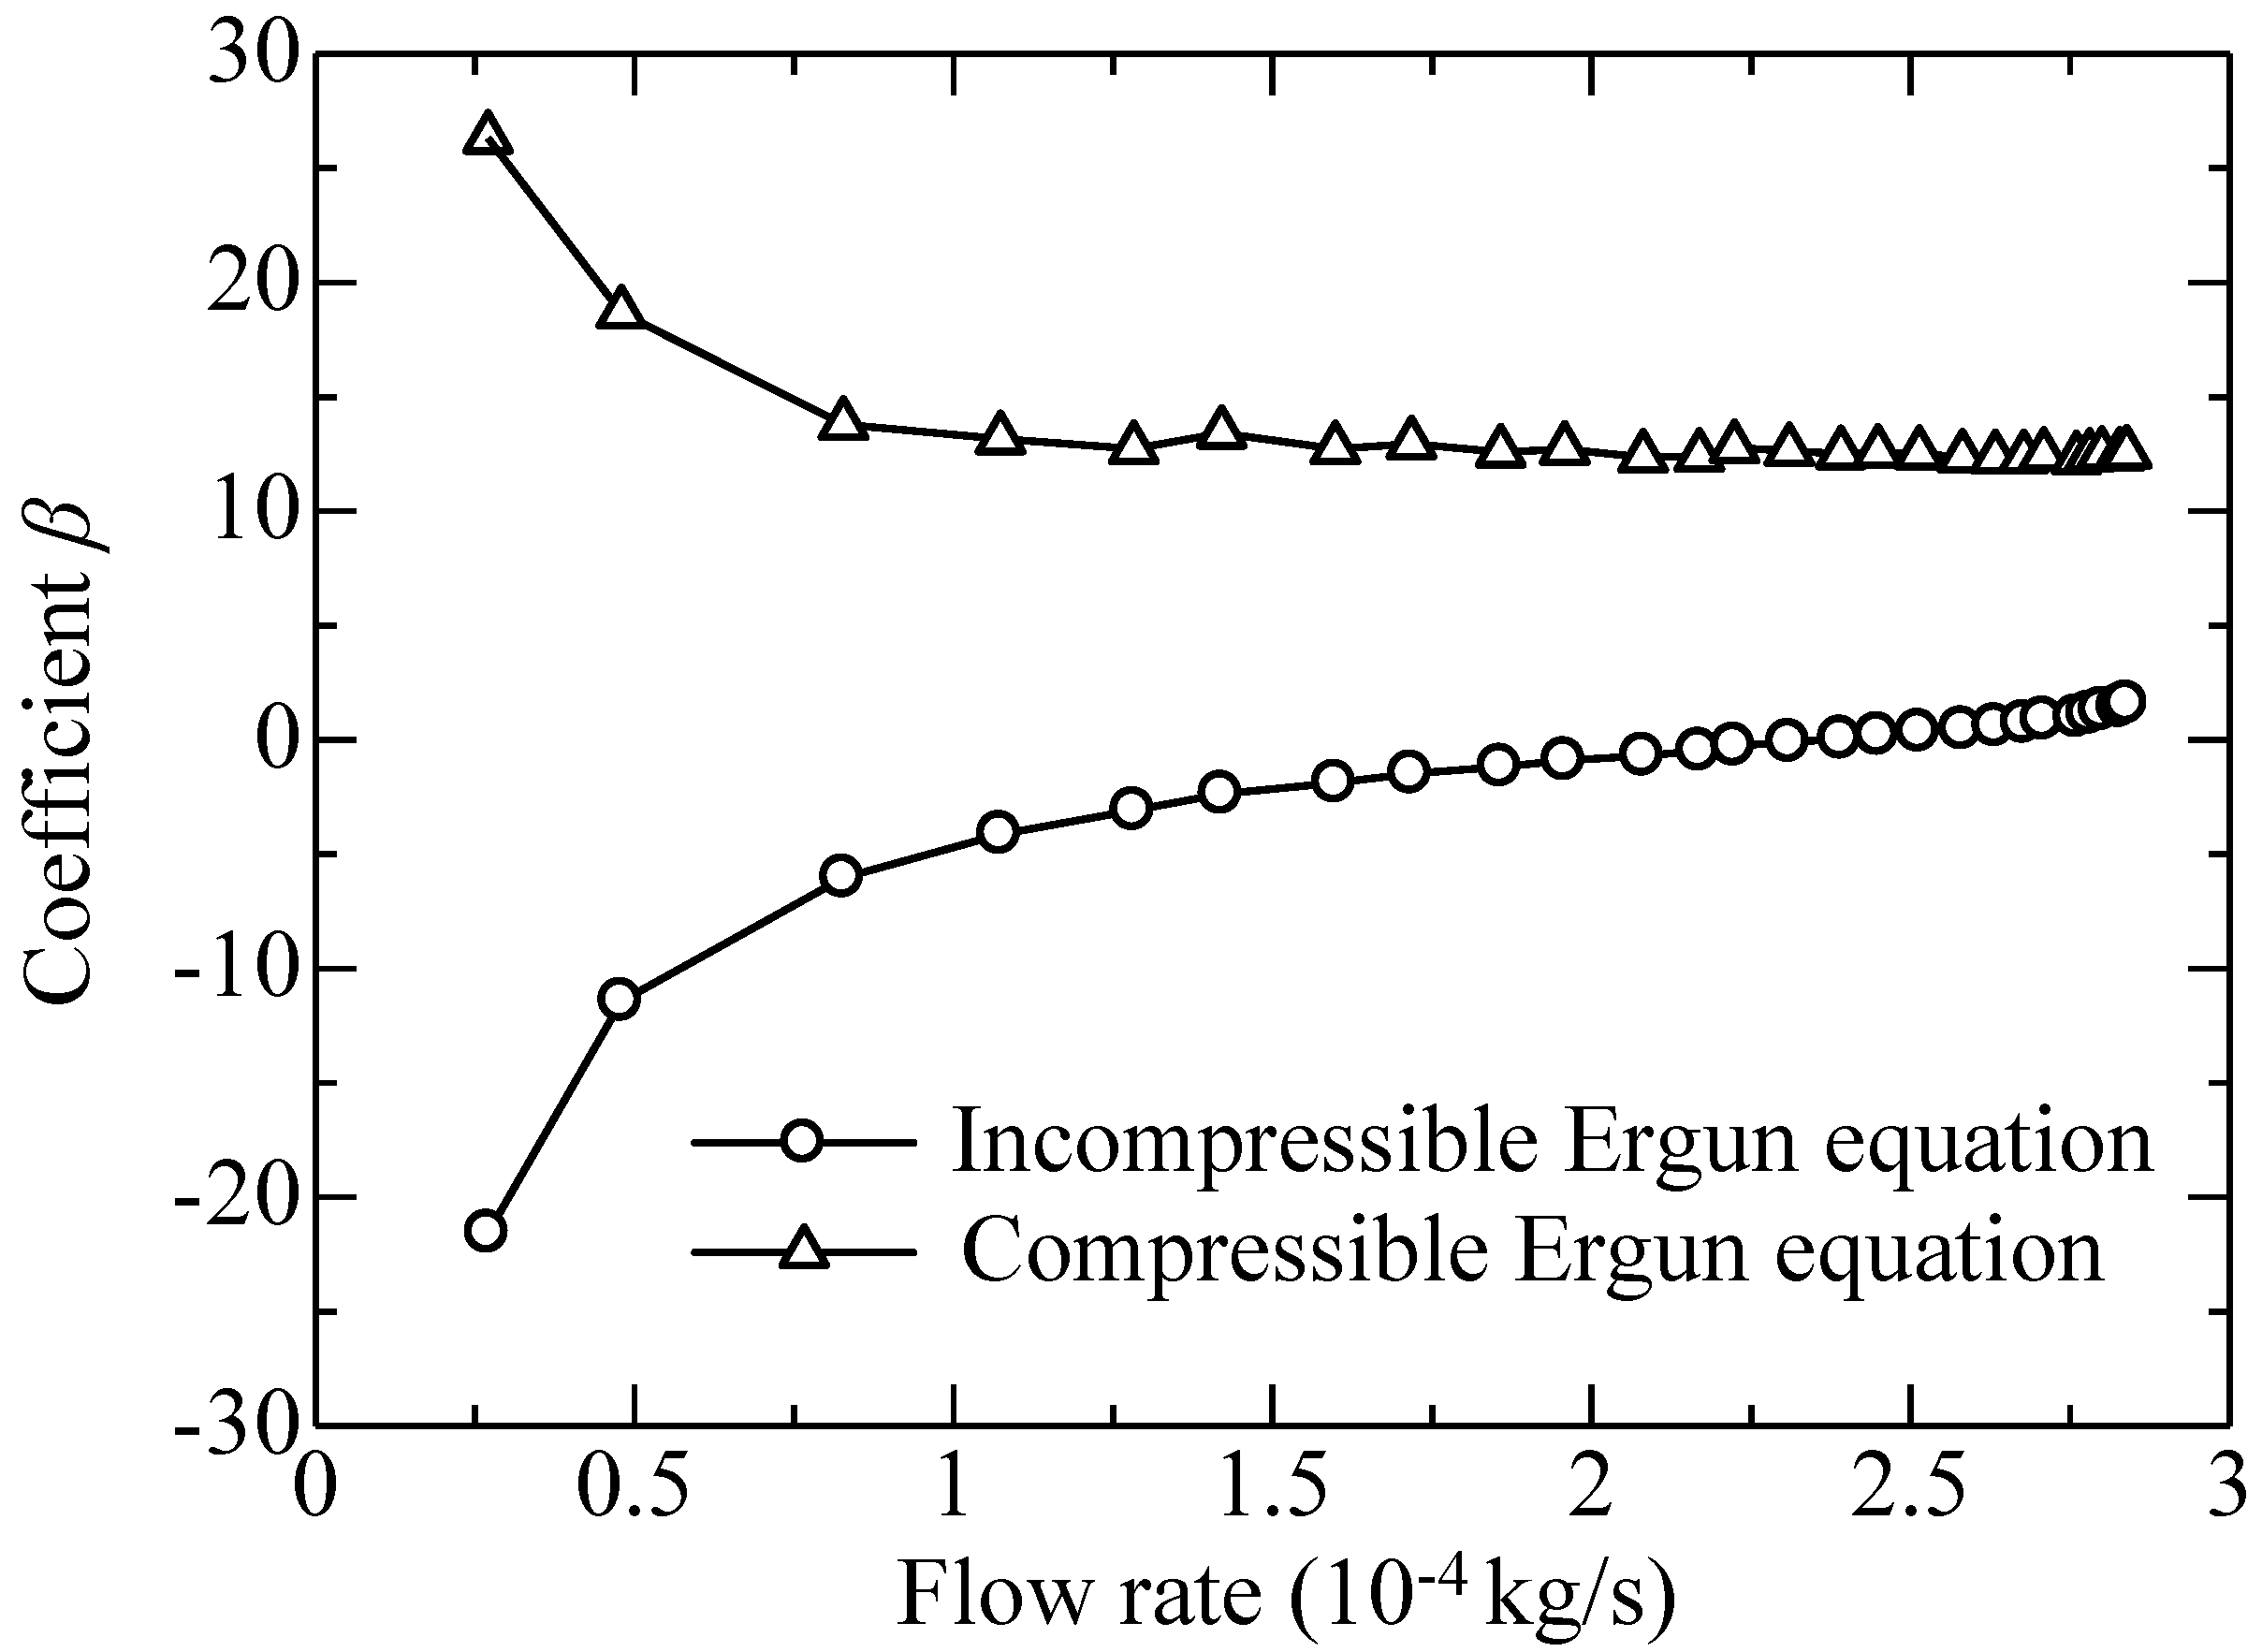
Figure 5 shows the relation between coefficient β and flow rate in terms of incompressible Ergun equation. The β is not an average coefficient for all the test media, and, it is just for a specific case and varies with the properties of the medium. The β is obtained with the resulting coefficient α using Equation (9) with the paired pressure drop and flow rate. Observation shows that β is a negative value and appears to continuously change as the flow rate increases. However, these results are theoretically unreasonable. First, the negative value is physically meaningless because the form drag effects have positive impacts on the pressure drop. Second again, in general, when form drag effects dominate the flow pattern, β should have the tendency to be a universal constant because it is completely dependent on the properties of the media. The negative and increasing β indicates that it is the compressibility effects enhance the pressure drop and thus cannot be ignored. Actually, in theory, the coefficient β should be a constant that only depends on the internal geometry at high Reynolds number. However, numerous studies indicate that a transitional regime exists between the viscous and inertial regimes. The visible variations in β at small Reynolds number are mainly because the data points in the transitional regime are mistakenly used for the calculation. As a result, the optimal β should be selected for the converged value under the maximum flow rate.
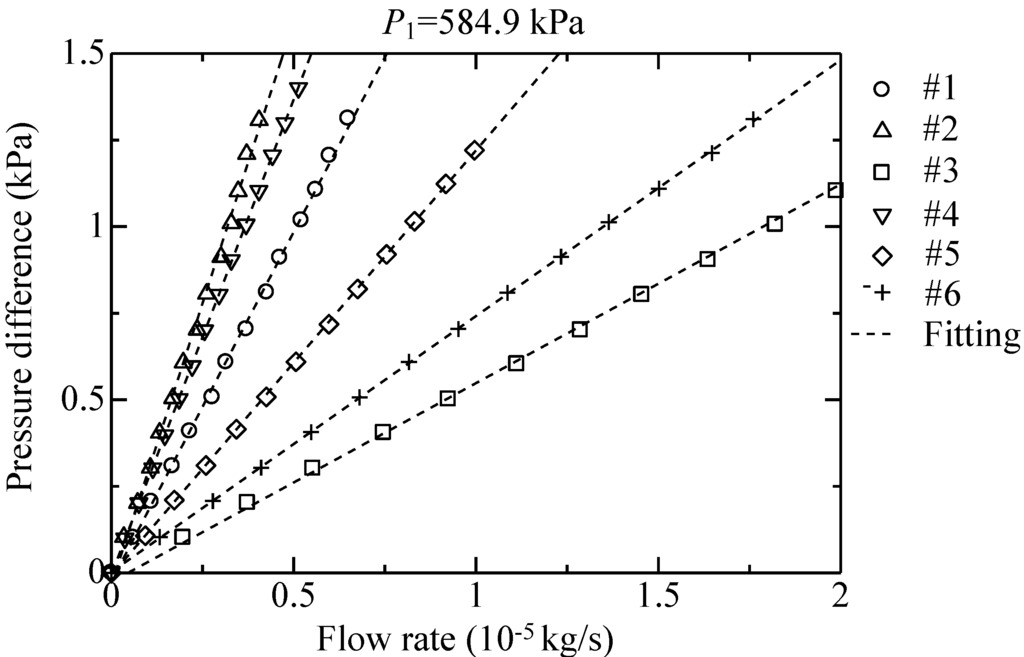
Figure 4.
Pressure difference versus flow rate.
Figure 4.
Pressure difference versus flow rate.


Figure 5.
Coefficient β versus flow rate (resistance #1).
Figure 5.
Coefficient β versus flow rate (resistance #1).
Accordingly, substituting Equations (1) and (2) into Equation (3) and integrating the pressure with respect to length, with the boundary conditions P = P1 (x = 0 [m]), P = P2 (x = L [m]), obtain the following modified Ergun equation
Equation (9) includes the contribution of air compressibility to the pressure drop. The relation of β with respect to flow rate in terms of the modified Ergun equation is also presented in Figure 5, which shows that β is a positive value and indeed converges to constant as the flow rate increases. As a result, considering compressibility effects is necessary.
According to Equation (9), the coefficients α and β are determined non-simultaneously by, α first in viscous drag region, then β in form drag region. This method is named non-simultaneous method hereinafter. Table 2 lists the determined coefficients for each test medium. The values of α and β were generally thought to be universal; however some early experiments proved otherwise. In [31], Fand et al. tested spheres of various diameters and found that α and β exhibit some variations with diameter. Comiti and Renaud [32] obtain an average value of 141 for α and 1.63 for β for all of the packed spheres they tested. In this work, the authors contend to first use different α and β to describe the friction characteristic for each of the test media for a comparison. Noted that as the flow rate increases, small changes in coefficient β will induce an obvious variation in the pressure drop, and therefore it is corrected to the second decimal place to improve accuracy. Moreover, an alternative method is to determine the coefficients simultaneously according to the Gauss–Newton fitting method, which is hereinafter referred to as the simultaneous method. The simultaneous method is simple in comparison with the non-simultaneous method. Coefficients obtained by the simultaneous method are also listed in Table 2. Clearly, the coefficients determined by different methods have different values.
Table 2.
Results of coefficients α and β using non-simultaneous and simultaneous method.
| Porous medium | Non-simultaneous method | Simultaneous method | ||
|---|---|---|---|---|
| α | β | α | β | |
| #1 | 466.2 | 12.43 | 515.9 | 12.12 |
| #2 | 458.0 | 12.84 | 550.4 | 12.01 |
| #3 | 475.8 | 8.73 | 419.3 | 9.08 |
| #4 | 457.9 | 14.82 | 502.4 | 13.73 |
| #5 | 460.8 | 10.01 | 599.8 | 8.81 |
| #6 | 468.4 | 14.99 | 332.0 | 18.59 |
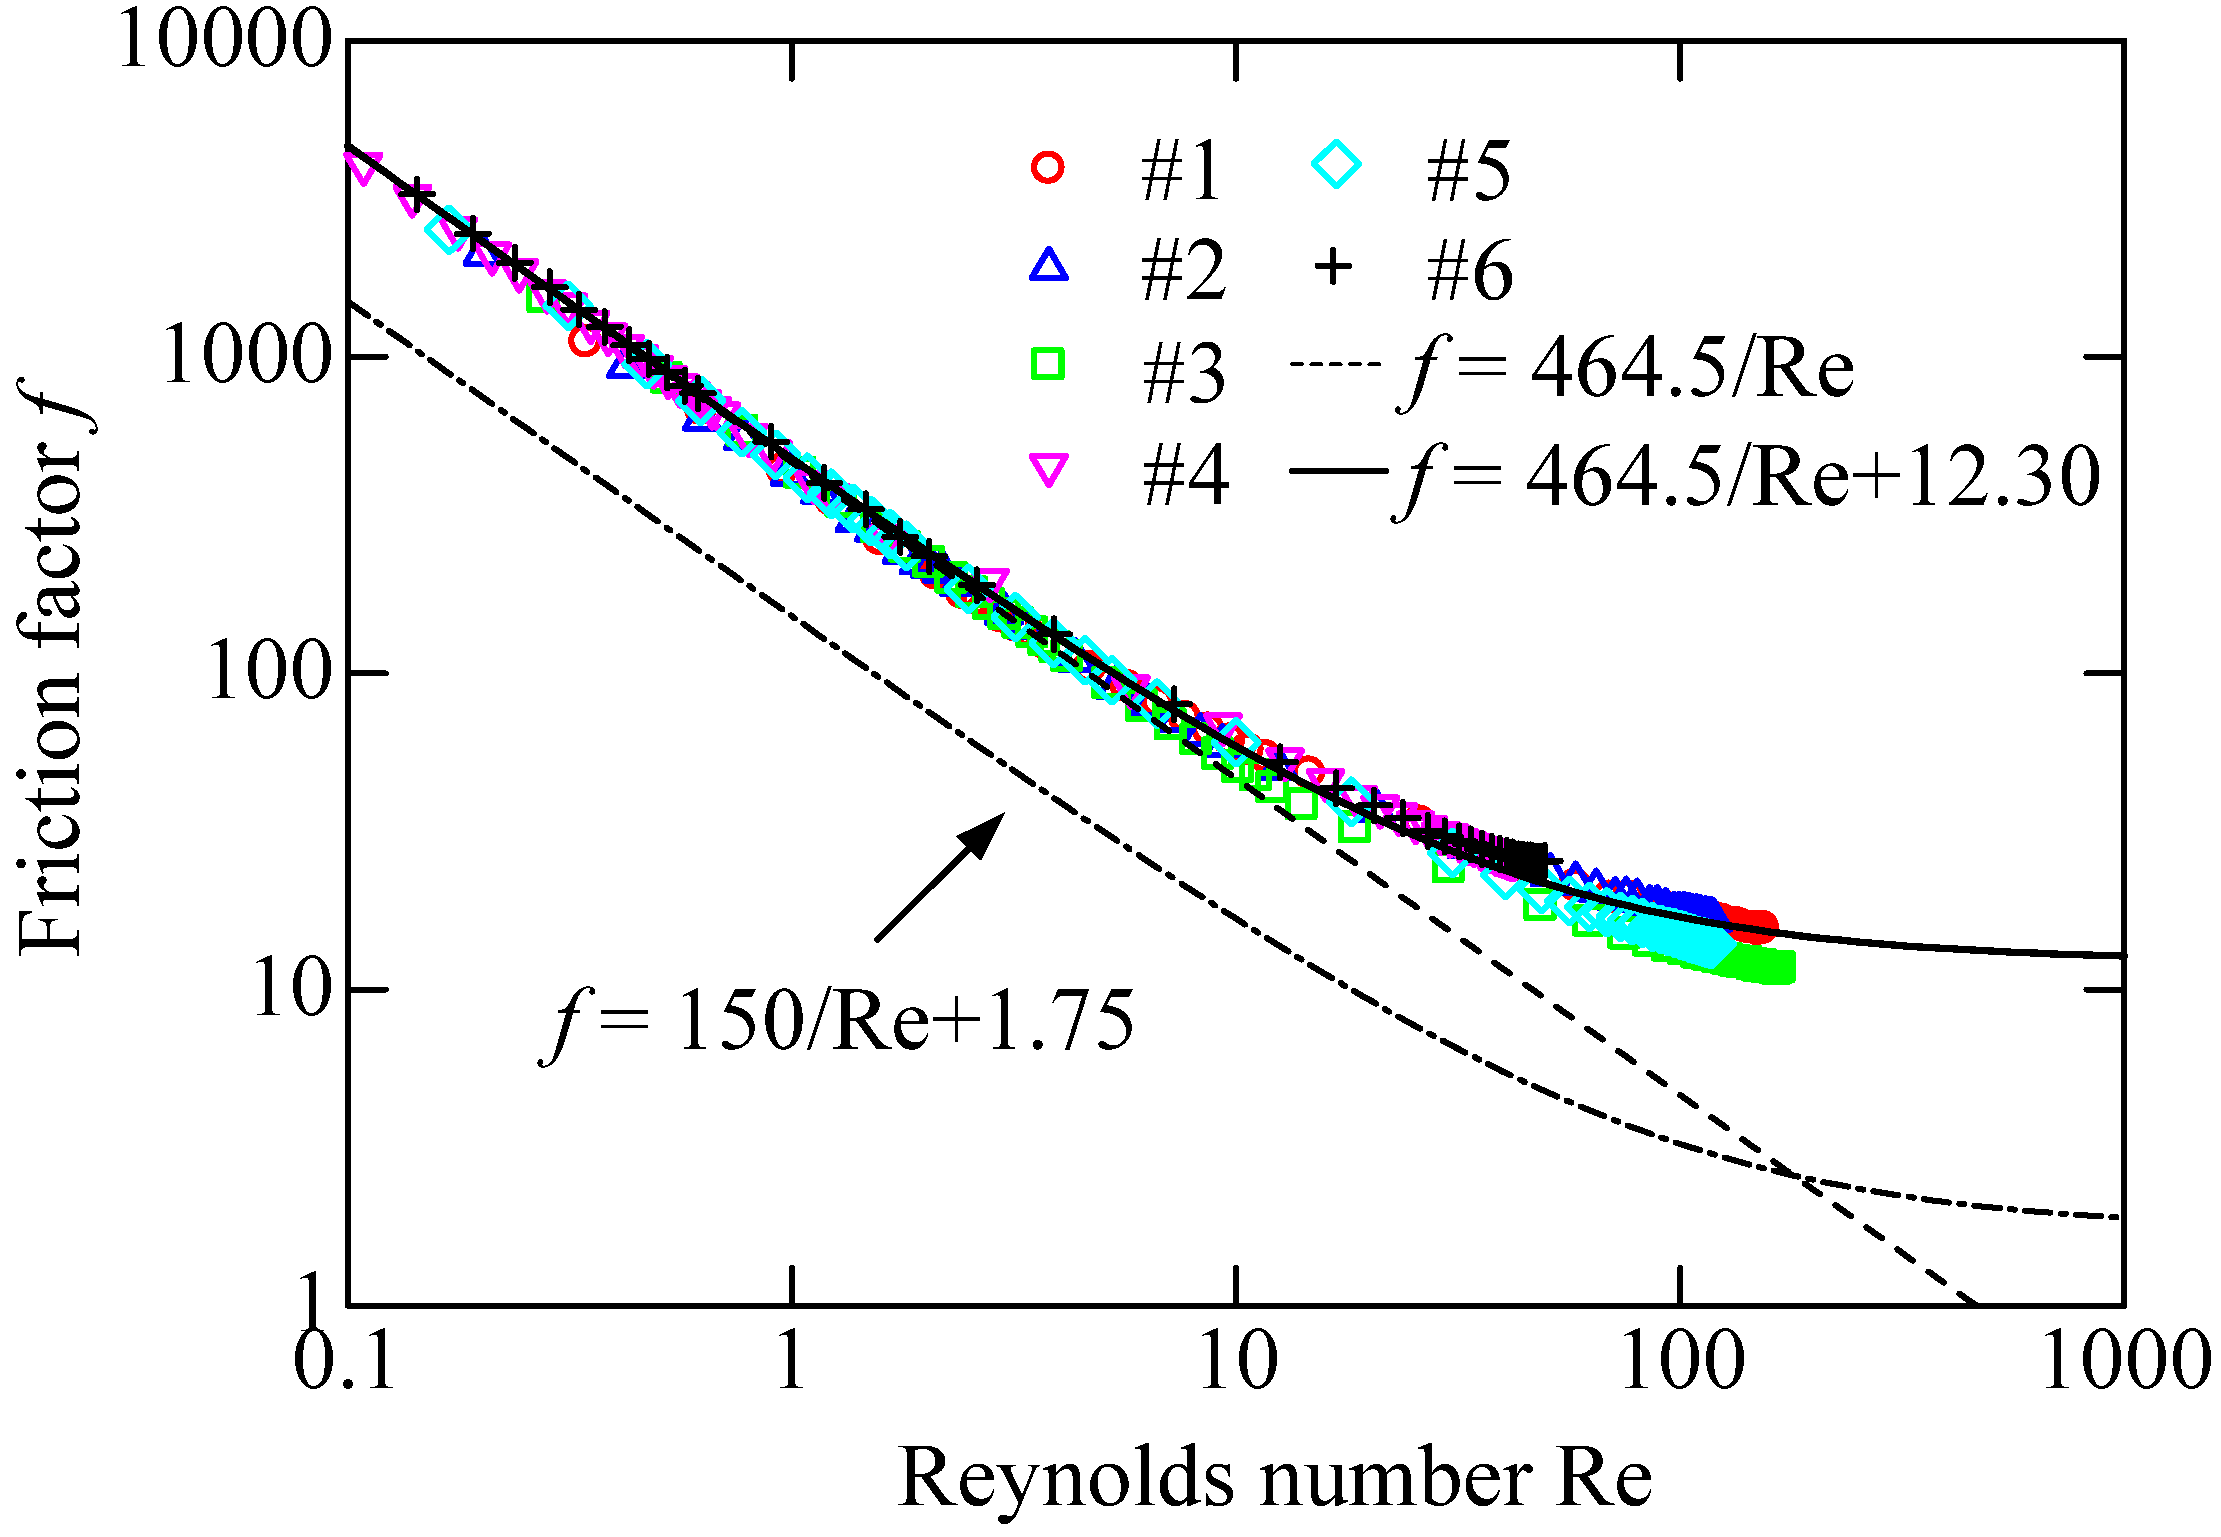
A presentation of the data in the form of friction factor versus Reynolds number is given in Figure 6. The linear dashed curve is for f = 464.5/Re, which leaves out the second term of the Equation (4) and serves as a reference line for medium #1. The experimental Reynolds number ranges for the medium #1 to #6 are 0.35~154, 0.26~153, 0.28~169, 0.04~42, 0.17~118 and 0.06~67, respectively. Dybbs and Edwards [33] reported that the boundary for viscous flow regime and inertial flow regime is Re = 1. However, the authors contend that the region with Re from 1 to 10 would involve the transition regime. For this class of porous resistances, the form drag effects prevail over the viscous effects when Reynolds number is approximately beyond 10. Therefore, Re = 10 can be seen as the boundary to distinguish the viscous drag region and the form drag region. Following Dybbs’s classification the experimental range only cover the laminar regime. Actually, both viscous and inertial regimes, along with transition between the two, are laminar in nature. Moreover, friction factor decreases with the increase of Reynolds number, and gradually converges to an asymptotic value depended on the coefficient β as the Reynolds number becomes adequately large. The curve, which represents the Ergun equation with coefficients α and β respectively valued 150 and 1.75, is also given in Figure 6 for a comparison with the experimental data. Quite clearly, the traditional Ergun equation cannot be directly used to describe the friction characteristic. Table 2 shows that the values of α and β varies little for each of the materials by the non-simultaneous method. So, the optimal α and β can be obtained as the average value for all the media, and therefore, the generalized Ergun equation is now represented by 464.5/Re + 12.30, which shows a good agreement with all of the experimental data. However, even if the coefficients α and β are constants, Equation (9) indicates that the pressure losses do not only depend on the particle diameter and porosity but also the diameter and length of the medium. Taking the media #1 and #3 as an example, the two have almost the same particle diameter and porosity, but provide totally different pressure changes under the same flow rate due to the size difference (Figure 4). In addition to the size difference, as for media #2 and #5, the difference in coefficient of sphericity also greatly affects the pressure changes.
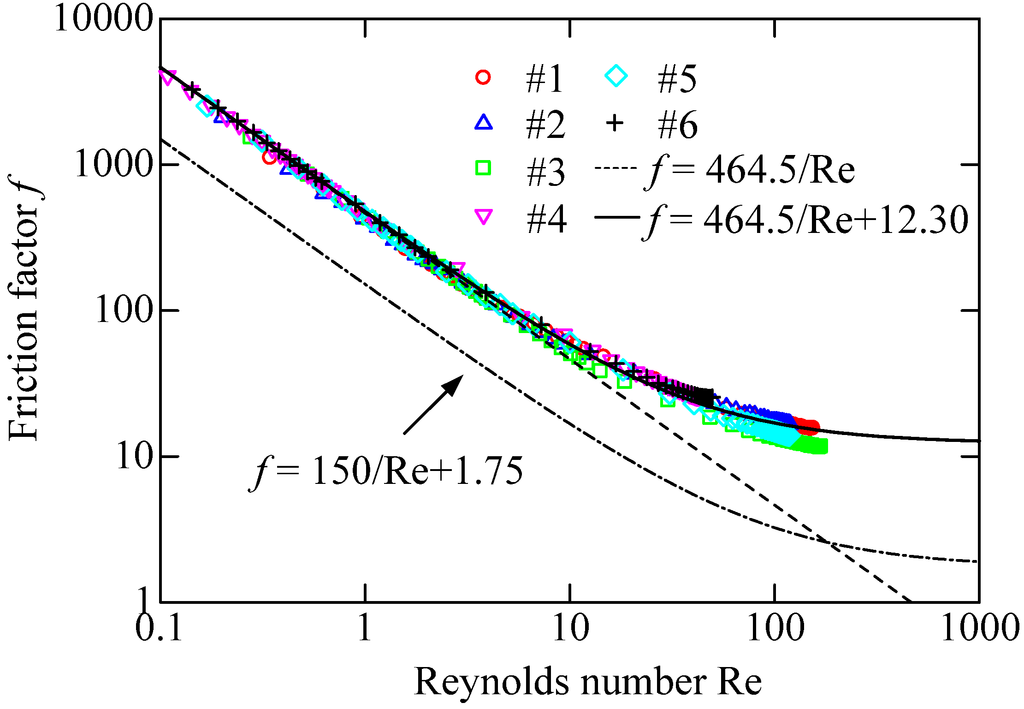
Figure 6.
Relation between friction factor and Reynolds number.
Figure 6.
Relation between friction factor and Reynolds number.
Taking the resistance #2 as an example, Figure 7 plots the experimental data and the calculated results by the non-simultaneous method and simultaneous method. It is observed that both calculated curves accord with the experimental data when Re > 50. However, in the viscous region, the black curve, by the simultaneous method, shows significant departures from the experiment data. Then, to evaluate the applicability of the two methods, flow rate satisfying Equation (9) are calculated, and the errors E between the experimental data and theoretical results are considered as
where G(exp)i represents the experimental data, and G(cal)i represents the calculated result.

Figure 7.
Relation between friction factor and Reynolds number (#2).
Figure 7.
Relation between friction factor and Reynolds number (#2).
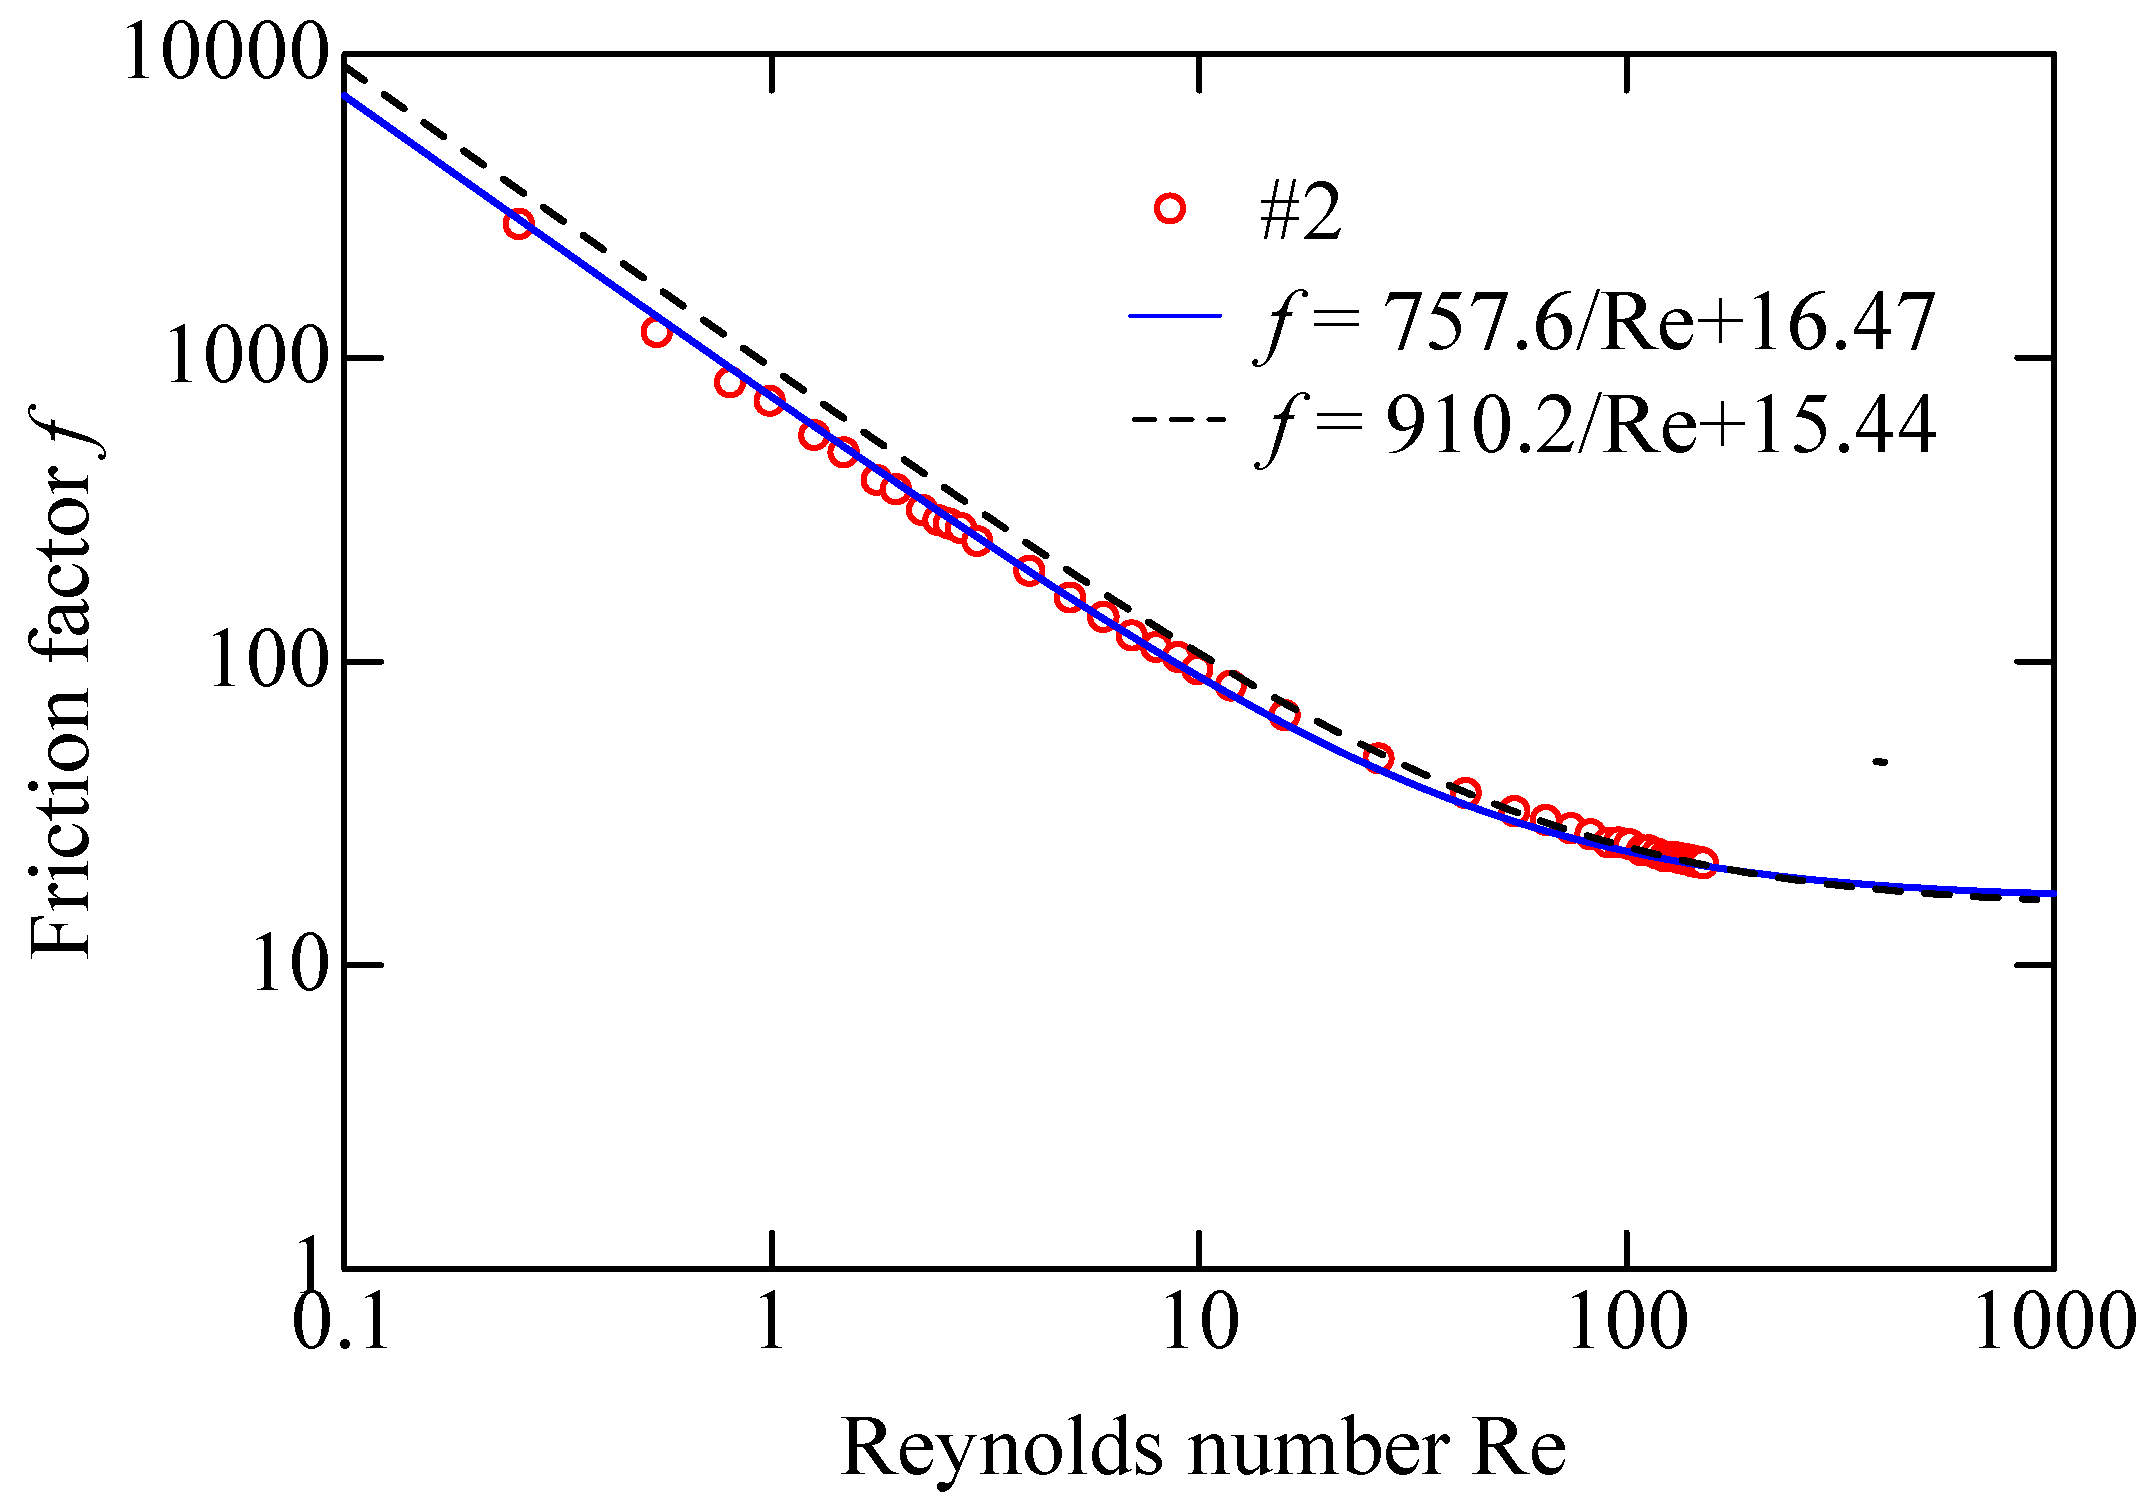
Table 3 lists a comparison of the errors for the two methods in different regions. It is made clear that in the form drag region, the simultaneous method provides a slightly better accuracy. However, in the viscous drag region, it is found that such approach is subject to considerable errors, even sometimes over 20%, which is unacceptable in applications. That is to say, although in some parts the simultaneous method can achieve a higher accuracy, it is just a curve fitting method, and those determined coefficients may lose physical meanings. Inversely, the representation with coefficients by the non-simultaneous method shows good accordance with the experimental data over the whole range.
Table 3.
Errors E.
| Tested resistances | Viscous region | Form drag region | ||
|---|---|---|---|---|
| Non-simultaneous method (E) | Simultaneous method (E) | Non-simultaneous method (E) | Simultaneous method (E) | |
| #1 | 4.6% | 13.3% | 1.1% | 0.8% |
| #2 | 5.0% | 20.2% | 1.0% | 0.4% |
| #3 | 2.8% | 11.0% | 0.4% | 0.4% |
| #4 | 0.8% | 9.5% | 1.0% | 0.4% |
| #5 | 1.4% | 24.1% | 1.5% | 0.5% |
| #6 | 0.5% | 39.4% | 1.1% | 1.6% |
Air density is variable in the porous media, and Expression (2) is another form of the continuity equation that includes air compressibility. When flowing through the porous media, air expands, accelerates, and the pressure decreases along the length direction. Figure 8 gives a comparison of the experimental data and the calculated results. It can be easily figured out that the proposed modified Ergun equation considering air compressibility accords well with the experimental data. As the pressure drop becomes visible, air density changes greatly throught the porous media, and of course, compressibility effects cannot be ignored. The dashed line, which depicts the incompressible case, expresses a less conspicuous pressure drop, indicating that air compressibility can lead to a more conspicuous pressure drop. In addition, the calculated curve for the incompressible case appears nonlinear because the inertial effects also play an important role.
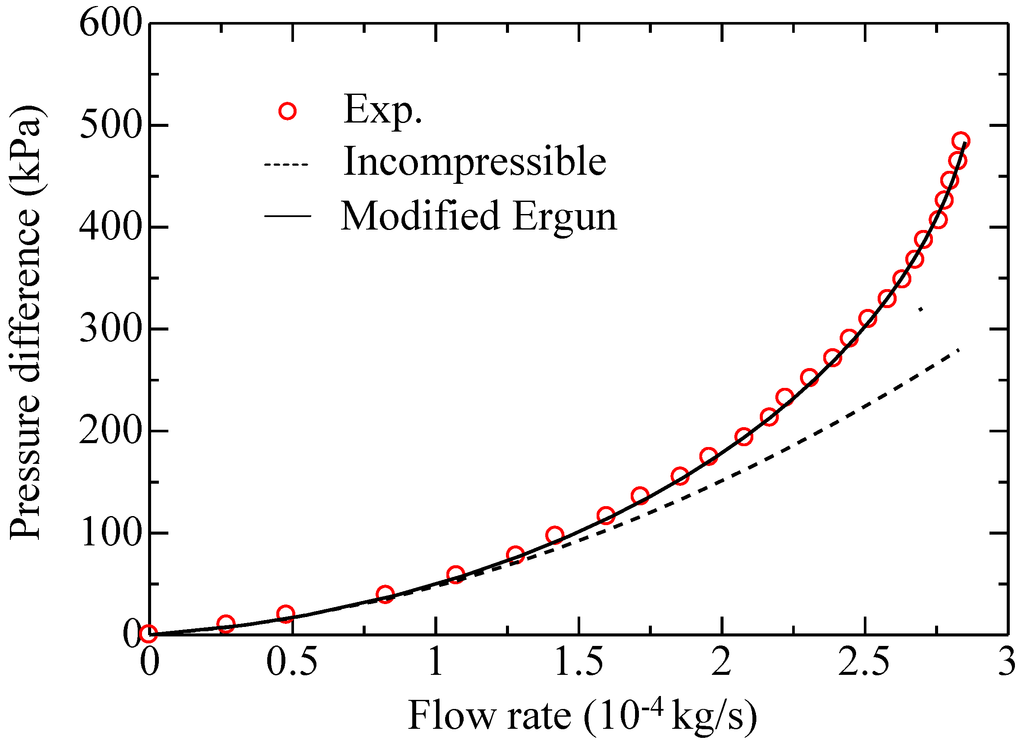
Figure 8.
Pressure difference versus flow rate (#1).
Figure 8.
Pressure difference versus flow rate (#1).

5. Conclusions
This study provides an insight into the determination of friction characteristic for airflow through sintered metal porous media. An experimental setup was established to measure the pressure drop versus flow rate through porous media, and a few samples were tested within the laminar region. The traditional Ergun equation is proven inappropriate for the description of the friction characteristic. Therefore, a modified Ergun equation taking into account the air compressibility effects is proposed. The coefficients α and β in the modified equation are factors for the viscous drag portion and form drag portion of the pressure drop. Air is treated as an incompressible fluid when the pressure drop is sufficiently small. As the pressure drop becomes visible, air density changes greatly and the compressibility effects cannot be ignored. Two methods, the simultaneous method and the non-simultaneous method, are respectively used to determine the coefficients. The simultaneous method gives a perfect accordance with the experimental data when the flow rate becomes adequately large, but brings unacceptable errors even over 30% at small flow ranges. To completely avoid the transitional region, Re = 10 is selected as the boundary for the viscous drag region and form drag region. The non-simultaneous method is used to determine the coefficients by, α first in the viscous drag region, then β in the form drag region, and, the optimal β is selected for the converged value under maximum flow rate. Moreover, theoretical mass flow rate in terms of the modified Ergun equation can provide close approximations over the entire range within 5% uncertainty, which is sufficient for most applications.
It should be noted that, in addition to the experimental study, the proposed modified Ergun equation can also be of importance when dealing with numerical studies (e.g., [34,35], etc.). Efforts are needed to develop some numerical model that incorporates the basic fluid dynamics features in porous media in the future.
Acknowledgments
The authors wish to thank the financial support of the National Natural Science Foundation of China (Grant No. 51205174), the Postdoctoral Science Foundation of China (Grant No. 2014M550309), the Open Foundation of the State Key Laboratory of Fluid Power Transmission and Control (Grant No. GZKF-201407) and the Youth Funds of the State Key Laboratory of Fluid Power Transmission and Control (SKLoFP_QN_1304).
Author Contributions
Wei Zhong designed experiments, analyzed data and wrote the paper; Xin Li gave technical support and conceptual advice; Guoliang Tao gave technical support and discussed the results; Toshiharu Kagawa discussed the results and commented on the manuscript.
Conflicts of Interest
The authors declare no conflict of interest.
References
- Nield, D.A.; Bejan, A. Convection in Porous Media, 3rd ed.; Springer: New York, NY, USA, 2006. [Google Scholar]
- ISO 6358-1: 2013. Pneumatic fluid power-Determination of flow-rate characteristics of components using compressible fluids-Part 1: General rules and test methods for steady-state flow. Available online: http://www.iso.org/iso/home/store/catalogue_ics/catalogue_detail_ics.htm?ics1=23&ics2=100&ics3=01&csnumber=56612 (accessed on 4 March 2015).
- Oneyama, N.; Zhang, H.P.; Senoo, M. Study and suggestions on flow-rate characteristics of pneumatic components. In Proceedings of the Fourth International Symposium on Power Transmission and Control, Wuhan, China, 8–10 April 2003; pp. 326–331.
- Lage, J.L.; Antohe, B.V.; Nield, D.A. Two types of nonlinear pressure-drop versus flow-rate relation observed for saturated porous media. J. Fluids Eng. 1997, 119, 700–706. [Google Scholar] [CrossRef]
- Andrade, J.S.; Costa, U.M.S.; Almeida, M.P.; Makse, H.A.; Stanley, H.E. Inertial effects on fluid flow through disordered porous media. Phys. Rev. Lett. 1999, 82, 5249–5252. [Google Scholar] [CrossRef]
- Boomsma, K.; Poulikakos, D. The effects of compression and pore size variations on the liquid flow characteristics in metal foams. J. Fluids Eng. 2002, 124, 263–272. [Google Scholar] [CrossRef]
- Medraj, M.; Baril, E.; Loya, V.; Lefebvre, L.P. The effect of microstructure on the permeability of metallic foams. J. Mater. Sci. 2007, 42, 4372–4383. [Google Scholar] [CrossRef]
- Ergun, S. Fluid flow through packed columns. Chem. Eng. Prog. 1952, 48, 89–94. [Google Scholar]
- Macdonald, I.F.; EI-Sayed, M.S.; Mow, K.; Dullien, F.A.L. Flow through porous media-the Ergun Equation Revisited. Ind. Eng. Chem. Fundam. 1979, 18, 199–208. [Google Scholar] [CrossRef]
- Beavers, G.S.; Sparrow, E.M. Non-Darcy flow through fibrous porous media. J. Appl. Mech. 1969, 36, 711–714. [Google Scholar] [CrossRef]
- Beavers, G.S.; Sparrow, E.M.; Rodenz, D.E. Influence of bed size on the flow characteristics and porosity of randomly packed beds of spheres. J. Appl. Mech. 1973, 40, 655–660. [Google Scholar] [CrossRef]
- Montillet, A.; Akkari, E.; Comiti, J. About a correlating equation for predicting pressure drops through packed beds of spheres in a large range of Reynolds numbers. Chem. Eng. Process. 2007, 46, 329–333. [Google Scholar] [CrossRef]
- Antohe, B.V.; Lage, J.L.; Price, D.C.; Weber, R.M. Experimental determination of permeability and inertia coefficients of mechanically compressed aluminum porous matrices. J. Fluids Eng. 1997, 119, 404–412. [Google Scholar] [CrossRef]
- Dukhan, N.; Minjeur, C.A. A two-permeability approach for assessing flow properties in metal foam. J. Porous Mater. 2011, 18, 417–424. [Google Scholar] [CrossRef]
- Dukhan, N.; Patel, K. Entrance and exit effects for fluid flow in metal foam. AIP Conf. Proc. 2010, 1254, 299–304. [Google Scholar]
- Dukhan, N.; Patel, K. Effect of sample’s length on flow properties of open-cell metal foam and pressure-drop correlations. J. Porous Mater. 2011, 18, 655–665. [Google Scholar] [CrossRef]
- Dukhan, N.; Ali, M. Effect of confining wall on properties of gas flow through metal foam: An experimental study. Transp. Porous Media 2012, 91, 225–237. [Google Scholar] [CrossRef]
- Dukhan, N. Correlations for the pressure drop for flow through metal foam. Exp. Fluids 2006, 41, 665–672. [Google Scholar] [CrossRef]
- Du Plessis, J.P. Analytical quantification of coefficients in the Ergun equation for fluid friction in a packed bed. Transp. Porous Media 1994, 16, 189–207. [Google Scholar] [CrossRef]
- Liu, J.F.; Wu, W.T.; Chiu, W.C.; Hsieh, W.H. Measurement and correlation of friction characteristic of flow through foam matrixes. Exp. Therm. Fluid Sci. 2006, 30, 329–336. [Google Scholar] [CrossRef]
- Kim, T.; Lu, T.J. Pressure drop through anisotropic porous medium like cylinderbundles in turbulent flow regime. J. Fluids Eng. 2008, 130, 104501:1–104501:5. [Google Scholar]
- Jin, L.W.; Kai, C.L. Pressure drop and friction factor of steady and oscillating flows in open-cell porous media. Transp. Porous Media 2008, 72, 37–52. [Google Scholar] [CrossRef]
- Mancin, S.; Zilio, C.; Cavallini, A.; Rossetto, L. Pressure drop during air flow in aluminum foams. Int. J. Heat Mass Tran. 2010, 53, 3121–3130. [Google Scholar] [CrossRef]
- Belforte, G.; Raparelli, T.; Viktorov, V.; Trivella, A. Feeding system of aerostatic bearings with porous media. Available online: http://www.jfps.jp/proceedings/tukuba2005/pdf/100193.pdf (accessed on 2 March 2015).
- Belforte, G.; Raparelli, T.; Viktorov, V.; Trivella, A. Metal woven wire cloth feeding system for gas bearings. Tribol. Int. 2009, 42, 600–608. [Google Scholar] [CrossRef]
- Amano, K.; Yoshimoto, S.; Miyatake, M.; Hirayama, T. Basic investigation of noncontact transportation system for large TFT-LCD glass sheet used in CCD inspection section. Precis. Eng. 2001, 35, 58–64. [Google Scholar] [CrossRef]
- Oiwa, N.; Masuda, M.; Hirayama, T.; Matsuoka, T.; Yabe, H. Deformation and flying height orbit of glass sheets on aerostatic porous bearing guides. Tribol. Int. 2012, 48, 2–7. [Google Scholar] [CrossRef]
- Zhong, W.; Li, X.; Liu, F.H.; Tao, G.L.; Lu, B.; Kagawa, T. Measurement and correlation of pressure drop characteristics for air flow through sintered metal porous media. Transp. Porous Media 2014, 101, 53–67. [Google Scholar] [CrossRef]
- Dukhan, N.; Bağci, Ö.; Özdemir, M. Experimental flow in various porous media and reconciliation of Forchheimer and Ergun relations. Exp. Therm. Fluid Sci. 2014, 57, 425–433. [Google Scholar] [CrossRef]
- KL 17, Differential Pressure Transmitter. Available online: http://products.naganokeiki.co.jp/assets/files/3030/E-KL17J130401.pdf (accessed on 2 March 2015).
- Fand, R.M.; Kim, B.Y.K.; Lam, A.C.C.; Phan, R.T. Resistance to the flow of fluids through simple and complex porous media whose matrices are composed of randomly packed spheres. J. Fluids Eng. 1987, 109, 268–273. [Google Scholar] [CrossRef]
- Comiti, J.; Renaud, M. A new model for determining mean structure parameters of fixed beds from pressure drop measurements: application to beds packed with parallelepipedal particles. Chem. Eng. Sci. 1989, 44, 1539–1545. [Google Scholar] [CrossRef]
- Dybbs, A.; Edwards, R.V. A new look at porous media fluid mechanics—Darcy to Turbulent. Fundam. Transp. Phenom. Porous Media 1984, 82, 199–256. [Google Scholar]
- Machado, R. Numerical simulations of surface reaction in porous media with lattice Boltzmann. Chem. Eng. Sci. 2012, 69, 628–643. [Google Scholar] [CrossRef]
- Rong, L.W.; Dong, K.J.; Yu, A.B. Lattice-Boltzmann simulation of fluid flow through packed beds of uniform spheres: Effect of porosity. Chem. Eng. Sci. 2013, 99, 44–58. [Google Scholar] [CrossRef]
© 2015 by the authors; licensee MDPI, Basel, Switzerland. This article is an open access article distributed under the terms and conditions of the Creative Commons Attribution license (http://creativecommons.org/licenses/by/4.0/).