Article

The Optimization of Process Parameters and Microstructural Characterization of Fiber Laser Welded Dissimilar HSLA and MART Steel Joints

Department of Mechanical Engineering, Uludag University, Bursa 16059, Turkey
*
Author to whom correspondence should be addressed.
Metals 2016, 6(10), 245; https://doi.org/10.3390/met6100245
Submission received: 22 July 2016 / Revised: 9 October 2016 / Accepted: 10 October 2016 / Published: 18 October 2016

Abstract

:
Nowadays, environmental impact, safety and fuel efficiency are fundamental issues for the automotive industry. These objectives are met by using a combination of different types of steels in the auto bodies. Therefore, it is important to have an understanding of how dissimilar materials behave when they are welded. This paper presents the process parameters’ optimization procedure of fiber laser welded dissimilar high strength low alloy (HSLA) and martensitic steel (MART) steel using a Taguchi approach. The influence of laser power, welding speed and focal position on the mechanical and microstructural properties of the joints was determined. The optimum parameters for the maximum tensile load-minimum heat input were predicted, and the individual significance of parameters on the response was evaluated by ANOVA results. The optimum levels of the process parameters were defined. Furthermore, microstructural examination and microhardness measurements of the selected welds were conducted. The samples of the dissimilar joints showed a remarkable microstructural change from nearly fully martensitic in the weld bead to the unchanged microstructure in the base metals. The heat affected zone (HAZ) region of joints was divided into five subzones. The fusion zone resulted in an important hardness increase, but the formation of a soft zone in the HAZ region.

1. Introduction

The automotive sector is focused on developing and manufacturing fuel saving, higher safety vehicles with cost efficient methods. This will be achieved through proper design and using lighter and stronger materials on the auto body parts. Therefore the utilization of advanced high-strength steels (AHSS) is widespread. Due to the higher strength and good formability properties, AHSS can replace conventional thicker materials used in vehicle bodies without comprising crashworthiness. Dual phase (DP), complex phase (CP), martensitic steel (MART) and transformation-induced plasticity (TRIP) steels are the most common types of the AHSS [1]. Among these AHSS types, MART steel is one of the strongest cold-rolled AHSS on the market and has become the preferred material for automotive body applications, such as side impact beams, bumpers and structural components. Although using AHSS steels in the automobile structure is increasing, due to specific mechanical properties, high strength low alloy (HSLA) steel is still mainly used for structural parts, such as cross members, longitudinal beams, chassis components, etc. [2].
Welding is one of the most used and essential joining technique in the fabrication of the auto body and plays a significant role in assessing the final mechanical and metallurgical properties of the joined parts [3]. Due to much superiority over conventional welding methods, such as non-contact and single side access welding, low process cost and suitability of automation, laser welding is becoming an attractive and economically advantageous joining technique in the automotive industry [4]. Joints of dissimilar steel combinations in auto body structures are widely utilized for several applications requiring a special combination of properties besides cost saving and weight reduction. However, due to different metallurgical, thermal and physical properties of the materials, dissimilar material welding is more challenging than similar materials welding. Due to low and concentrated heat input and high speed properties, laser welding has also advantages on joining dissimilar materials over other conventional methods [5]. Thus, reduced distortion and a narrower heat affected zone (HAZ) with limited microstructural changes can be obtained.
There are several studies in the literature concerning the laser welding of similar or dissimilar DP and HSLA steels. Saha et al. [2] examined the mechanical and microstructural properties of laser welded DP980 and HSLA steel sheets. They stated that the tensile strength of the dissimilar welds was lower than DP welds. Xu et al. [6] investigated microstructural and mechanical properties, and Parkes et al. [7] reported the fatigue properties of laser welded DP and HSLA joints with varying weld geometries. Parkes et al. [8] evaluated the tensile properties of laser welded HSLA and DP steels at cryogenic, room and elevated temperatures. They reported that with the temperature increase, the tensile properties were decreased. In addition, several research works investigated laser welding of higher degree DP steels and AHSS. Wang et al. [9,10] investigated the effect of energy input and softening mechanism on the laser butt welded DP1000 steel. They found that the weld bead width and softening zone width become narrowed at lower energy input levels. Additionally, the mechanical properties were increased. The study of Rossini et al. [11], concerned with laser welding of dissimilar AHSS types, has shown that a fully martensitic microstructure was present in the 22MnB5, DP and TRIP steels close to the fusion zone (FZ), while mainly tempered martensite and ferrite zones were close to the base metal.
Although there are many research works about laser welding of DP and HSLA steels, only limited work has been reported on the laser welding of MART steels. Nemecek et al. [12] compared the microstructural and mechanical properties of MART steel joints made by laser and metal active gas (MAG) welding. They stated that the strength of the laser welded joints was higher than arc welding, and the HAZ width and grain coarsening in the HAZ were minimal. Zhao et al. [13] investigated the effect of welding speed on weld bead geometry and the tensile properties of the laser welded MART steel. They observed that, due to the fast cooling rate, the FZ of the joints contained predominantly martensite. Furthermore, the tensile load gradually increased with decreasing welding speed.
Due to welding process parameters directly affecting the quality of the weld joints, it is necessary to work in the suitable range. However, defining the suitable parameters to obtain the required quality welded joints is a time-consuming process. Several optimization methods are utilized in order to solve this problem. The Taguchi method is one of the most common design of experiment (DOE) techniques that allows the analysis of experiments with the minimum number [14,15]. In the literature, several researchers have used DOE methods to optimize quality characteristics in laser welding parameters. Benyounis and Olabi [16] have presented a review of the application of optimization techniques in several welding processes. Anawa and Olabi [17] used the Taguchi method for the purpose of increasing the productivity and decreasing the operation cost of laser welding ferritic-austenitic steel sheets. Another study of the authors [18] analyzed the optimized shape of dissimilar laser welded joints and fusion zone area depending the process parameters. Sathiya et al. [19] carried out the Taguchi method and desirability analysis to relate the parameters to the weld bead dimension and the tensile strength of the joints with various shielding gasses. Fiber laser welding has demonstrated its capability of welding dissimilar steel joint with and without the help of a synergic power source like the arc [20]. Acherjee et al. [21] used Taguchi, response surface methodology (RSM) and desirability function analyses in laser transmission welding, and they investigated the optimal parameter combination for the joint quality.
In addition to these studies, several researchers used other DOE methods to investigate the effect of laser parameters on the mechanical properties and bead geometries of laser welded joints. Benyounis et al. [22] examined the influence of process parameters on the weld bead geometry. They stated that weld bead dimensions were affected by the level of heat input. Ruggiero et al. [23] and Olabi et al. [24] showed the effects of the process parameters on the weld geometry and operating cost for austenitic steel and low carbon steel. The authors developed models and stated that, in terms of weld bead dimensions, the most influential parameter was welding speed. Reisgen et al. [25] optimized the parameters of the laser welded DP and TRIP steels to obtain the highest mechanical strength and minimum operation costs. Zhao et al. [26] investigated the effects of prescribed gap and laser welding parameters on the weld bead profile of galvanized steel sheets in a lap joint format and developed regression models. Benyounis et al. [27] reported the multi-response optimization of laser welded austenitic stainless steel. They developed mathematical models and established relationships between process parameters and responses, such as cost, tensile and impact strength.
As a result of the literature review, laser power, welding speed and focal position were found to be the most important welding parameters for welded joints’ quality and mechanical performance. Due to the mechanical properties, especially tensile strength, being dependent on the weld bead geometry, heat input comes to the fore [19]. Although various studies examined the influence of laser parameters on the weld quality of dissimilar HSLA and DP steel joints, the information on fiber laser welding of dissimilar HSLA and MART steel sheets is still not quite clear. Whereas, resolving the issue of reducing vehicle mass while improving crash safety, the use of AHSS and HSLA is increasing. It is essential to investigate the effect of laser welding process parameters on the mechanical performance and quality of these steel types. Therefore, the aim of this work was to evaluate the effects of laser welding parameters of laser power, welding speed and focal position on the response, which was a proportional combination of tensile load (TL) and heat input (HI) using the Taguchi method. In this way, we will be able to find the optimal welding parameters that would maximize TL, while minimizing the HI of the fiber laser welded dissimilar HSLA and MART steel joints. In addition, for the selected samples, the microstructural and microhardness examinations were discussed.

2. Experimental Details

In this study, all experiments were carried out on 1.5 mm-thick cold rolled MART and HSLA steel sheets. The mechanical and chemical properties of the materials are shown in Table 1 [28]. The steel sheets were sheared into 250 mm × 80 mm coupons, which had the sheared edges placed together for running welds in butt joint configuration to make 250 mm × 160 mm, as shown in Figure 1a.
The IPG ytterbium fiber laser attached to a Kuka robotic arm was used for welding experiments. The maximum power of the laser was 3 kW, and the wavelength was 1070 nm. The laser transmitted through the fiber optic cables and then came to a welding head. The fiber laser had a fiber core diameter of 0.2 mm with a laser beam spot diameter of 0.6 mm. The focal length was 300 mm. During the fiber laser welding process, no shielding gas was used.
In this study, for optimizing the process parameters, the Taguchi method was used. The parameter design is the key step in this method to achieving high quality without increasing cost. Firstly, a suitable orthogonal array should be selected depending on the total degree of freedom (DOF), which can be calculated by summing the individual DOF of each process parameter. The DOF for each parameter is the number of parameter levels minus 1. Then, the experiments were run based on the orthogonal array, analyzing the data and identifying the optimum parameters and, finally, if necessary, conducting confirmation trials with the optimal levels of the parameters. In this study, experiments were designed using an L25 orthogonal array, which means 25 rows and three columns. Five levels were considered for each of the three process parameters, which were laser power, welding speed and focal position. The levels of the parameters were chosen based on previous works in the literature and considering the laser system capabilities. Furthermore, trial experiments were applied to determine the operating range of each process parameter in order to produce an acceptable quality welding. The levels of the process parameters are shown in Table 2. A negative defocus is obtained when the focal point position is below the specimen surface.
In the data analysis, in order to evaluate the effect of the selected parameters on the response, the signal-to-noise (S/N) ratios are calculated. In addition, S/N ratios are used to reduce the response variability. In this work, the larger-the-better S/N ratio was chosen in order to maximize the responses. The S/N ratio for the larger-the-better for the responses was calculated as follows:
S / N = 10 log ( 1 n i = 1 n 1 y i 2 )
where yi is the response data from the experiment for the i-th parameter and n is the number of experiments. A higher S/N ratio indicates superior consideration for the optimal parameter combination, since the major signal dominates the noise. Equation (2) is used to calculate the parameter effects:
S / N i , j = 1 n k = 1 n S / N k
where S/Ni,j is the average S/N value of the j-th level of the i-th parameter and n is the number of the experiment, which includes the j-th level of the i-th parameter. Additionally, the S/Nk is the value of the k-th experiment S/N. Finally, a statistical analysis of variance (ANOVA) was used to indicate the relative effect of each process parameter on the responses.
At the metallographic examination stage of the study, the samples were cut from the weld cross-section using an electrical discharge cutting machine, then mounted in Bakelite, ground and polished up to 0.25-μm diamond paste. Two different etching procedures were conducted to reveal the grain boundaries and weld zone microstructure. In the first stage of the etching, 3% Nital solution was used. Then, to reveal some microstructures, subsequently, tint etched using 10% Na2S2O5 was performed. Then, samples were analyzed for microstructural changes and possible defects using an optic microscope (OM, Nikon DIC, Tokyo, Japan) with the Clemex image analysis system and the scanning electron microscope (SEM, Zeiss EVO 40 XVP, Oberkochen, Germany). Vickers microhardness measurements (DUROLINE-M microhardness tester, Metkon, Turkey) were performed with a 200-g load, and 10-s dwell time. Tensile samples were machined from the perpendicular to the welding direction in accordance with ASTM, E8/E8M (Figure 1b). Tensile tests were performed using a computerized tensile testing machine (UTEST-7014, Ankara, Turkey) using a constant crosshead speed of 5 mm/min.

3. Results and Discussion

3.1. Optimization of the Process Parameters via the Taguchi Method

In this study, a Taguchi orthogonal array, which can handle five levels of the parameters with three columns and 25 rows, was used. The parameter optimization procedure was done in order to get a welded joint that has the maximum TL by minimizing the HI. HI plays a crucial role in the quality of the joint and indirectly the operation cost. The weld joint quality can be defined as weld bead geometry, mechanical properties and distortions [25]. Weld bead geometry, which means the bead width and penetration depth, is an important physical characteristic of a weldment, especially for dissimilar laser welding processes [19]. The appropriate weld bead geometry depends on the HI rate [22]. A shallower and inadequate penetration depth is related to an insufficient HI rate. Thence, the TL of the welded joint will decrease. However, a higher HI gives a slower cooling rate, and so, in the HAZ, large grain sizes can have poor toughness and decrease in TL. Hence, HI and, consequently, weld bead geometry affect the tensile strength of the joints [16,18]. Therefore, in this study, TL and HI were evaluated together as a response variable. Due to the tensile strength being the most important quality indicator of the welded joint, the effect ratio of the TL was determined to be higher, 60%. In determining the effect ratio of the HI, operational cost and weld bead geometry were considered. Namely, this ratio should not be too low because of the insufficient penetration, and also, it should not be too high in terms of cost and decreased strength of the joint. Therefore, it was determined to be 40%. In determining these effect ratios, they have also benefited from operational experience.
The TL of the laser welded joints was experimentally determined using tensile tests. At least three different specimens’ tensile test results’ average were taken. Additionally, HI was calculated by the laser power divided by the welding speed. Due to the scale of the values of TL and HI being different, a normalization process was applied to these values. Equation (3) was used for the normalization of the TL values.
X n = X i X max
where Xn is the normalized value, Xi is the value of the relevant row and Xmax is the maximum value. Since the objective function was a combination of the TL and HI, it is necessary to express it in the same form. Therefore, before applying Equation (3), the reciprocals of the HI values were taken using Equation (4) to convert the values to the larger the better form.
X p = 1 X i
where Xp is a pre-normalized value, which was used in Equation (1), and Xi is the HI value of the relevant row.
The experimental layout for the process parameters, average TL, standard deviations (SD), HI values and normalized values are shown in Table 3. The S/N ratios for the response were calculated. The response column represents the sum of 60% normalized TL and 40% normalized HI. The S/N ratios of the process parameters were calculated by using Equation (2), and the effect of each parameter level was determined. As can be seen in Table 4, welding speed was the most important parameter for the response. Laser power and focal position followed this parameter, respectively.
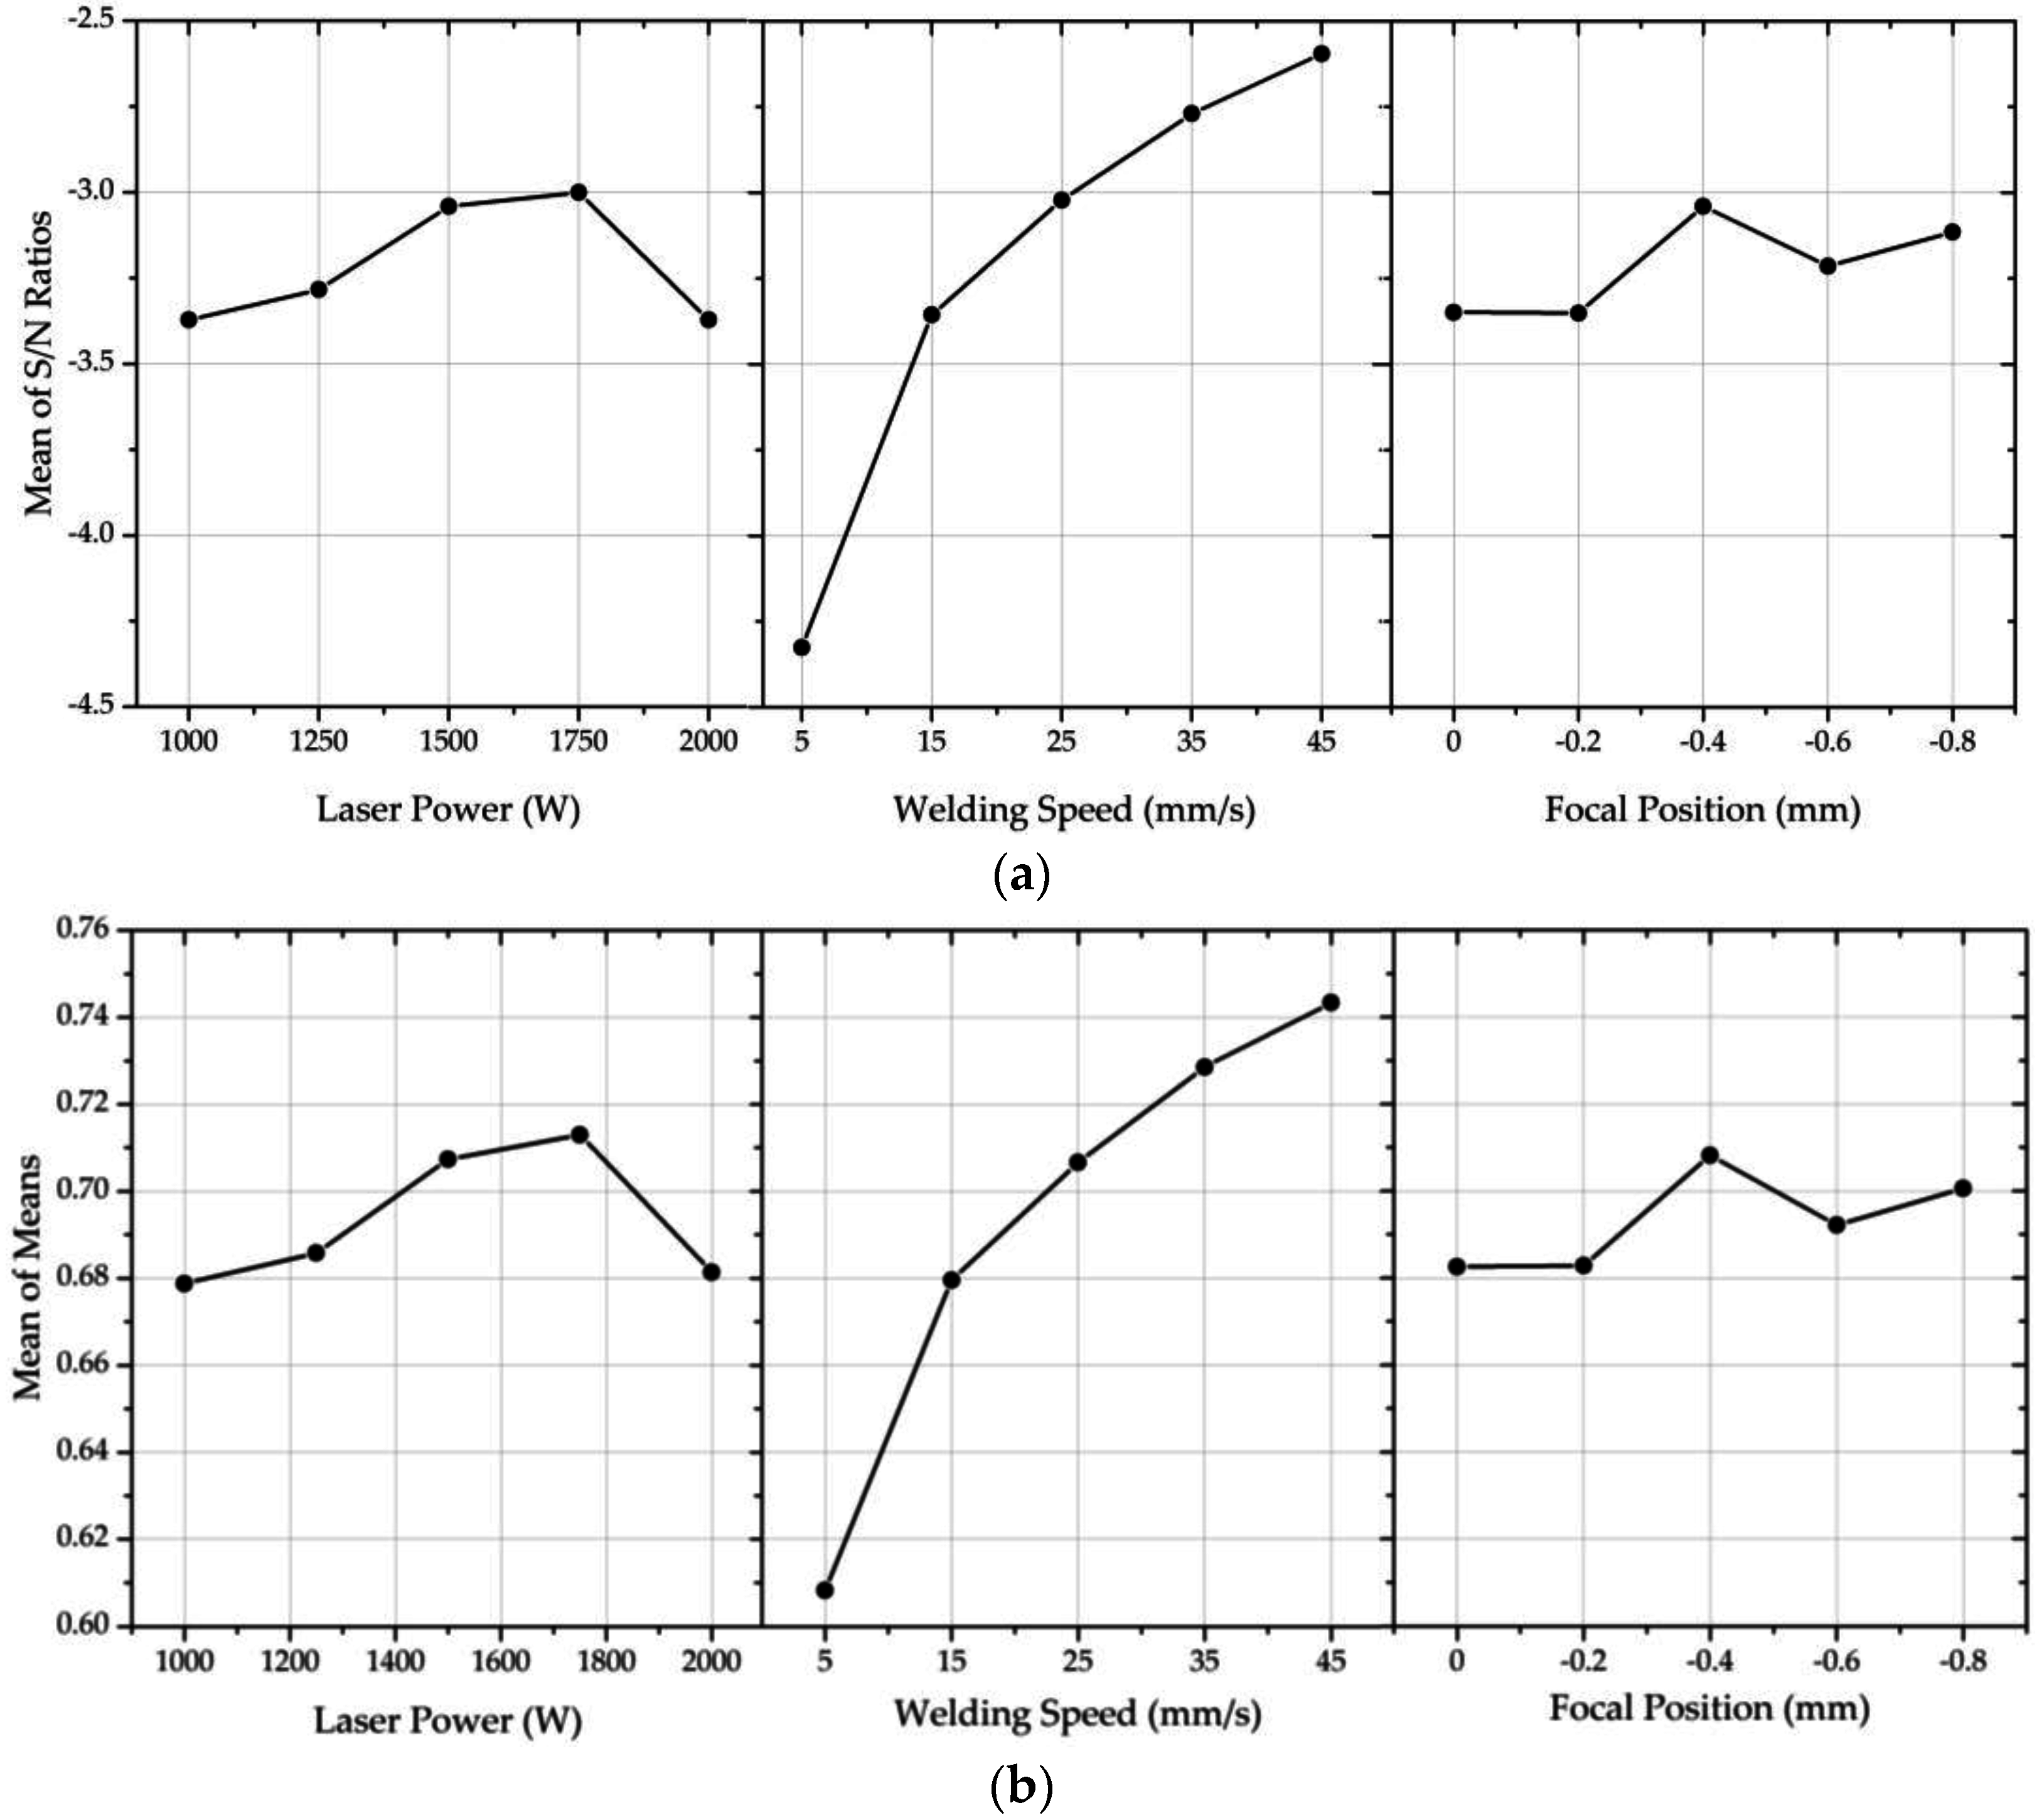
The S/N ratios’ main effect plot showed how each process parameter affects the response characteristic. The means of the S/N ratios exhibit a good correlation with the main effects of the mean of means (Figure 2). This result indicates that process parameters show higher mean values resulting in higher variability. The response seems to be mainly affected by the process parameters, as shown in Figure 2. It can be seen that the welding speed was the most important process parameter that affected the response. There was a small difference between laser power and focal position; while the focal position plots showed the lowest effect on the response to those parameters.
In this study, the optimal parameter combination was found to be 1750 W for laser power, 45 mm/s for welding speed and −0.4 mm for the focal position. This parameter combination was Sample 20 in the orthogonal array in Table 3; thus, no additional confirmation experiments were required.

3.2. Analysis of Variance

The order of importance of the parameters on the response was determined using ANOVA. By comparing the estimation of the experimental errors against the mean square, ANOVA tests the importance of all main factors and their interactions. In this study, The ANOVA shows that for the response (maximum TL and minimum HI), welding speed has the greatest effect with a contribution of 64.01 percent. Laser power and focal position effects were 5.60% and 2.82%, respectively (Table 5). This result is compatible with Table 4, which is the response table for the S/N ratios. Due to the interactions between the processes parameters not being defined, the residual error was large in ANOVA.

3.3. Effects of Process Parameters on the Response

In this study, it was observed that welding speed was a significant parameter that affects the response, which is maximum TL and minimum HI. Although the effect of laser power may seem quite small in ANOVA results, it is an important process parameter due to the associated HI. The increase of laser power causes more heat input. Under the high laser power, if the welding speed were not chosen properly, the weld bead would be broadened and the surface quality of the weld decreased. Therefore, the laser power and welding speed should be considered together to get good weld profiles and TL. When the laser power was kept constant, with increasing welding speed, HI decreased. Due to weld bead geometry related to the HI, weld bead width was increased with increasing HI. In all laser power levels, when the speed was 5 mm/s, the beads were larger due to the excessive heat input (Figure 3a). On the other side, when the speed was 45 mm/s, the beads were found to be narrower (Figure 3b).
As known weld bead dimensions directly affect the TL of the joints [25], at insufficient HI at the low laser power levels or high welding speeds, adequate penetration did not occur, and the TL of the joints was decreased. Besides, at excessive HI levels, the HAZ would be wider, and that causes a decrease in TL. According to the tensile test results, the welding speed in the range between 35 mm/s and 45 mm/s would lead to minimum HI and acceptable TL for the joints. The focal position determines the laser spot size and consequently the power density on the surface, depending on the optical path. In this study, the focal position has the lowest effect on the response. It is believed that the level range of this parameter caused this situation due to the range of the spot diameters being quite small.

3.4. Microstructure and Microhardness Evolution

The microstructural examination and microhardness evolution of the selected welds that have the highest (Sample 20) and lowest (Sample 21) response values were discussed. Three different zones, including FZ, HAZ and base metal (BM), were revealed by examining the selected sample’s cross-sections. The BM of the HSLA consisted of a ferrite matrix with carbides dispersed in the grains and at the grain boundaries (Figure 4a). As shown in Figure 4b, MART steels were comprised of martensitic microstructures and a small proportion of ferritic and bainitic grains.
In the welding process, final microstructures are affected by peak temperature and the cooling rate of the relevant zones, and carbon equivalent (CE) value resulted from the chemistry of the steels [29,30,31,32]. Although there are numerous formulae for calculating CE, Yurioka’s formula was used in this study because of its suitability for C-Mn steels [33]. The CE values of steels were calculated using Yurioka’s formula given by Equation (5) and shown in Table 6 [34,35]. The Ti element was considered as the Nb element because of their similar effect on the steels’ hardenability.
C E = C + f ( C ) [ Si 24 + Mn 6 + Cu 15 + Ni 20 + ( Cr + Mo + Nb + V ) 5 ]
where f(C) is the accommodation factor and is calculated as;
f ( C ) = 0.75 + 0.25 tanh [ 20 ( C 0.12 ) ]
The microstructure of the FZ of Sample 20, with a 0.391 CE value (average of MART and HSLA steels), is predominantly martensite with a bainitic structure (Figure 5). With the effect of the heat exchange gradient, in the vicinity of the fusion boundary, grains were elongated towards the weld center. However, in the center of the FZ, equiaxed grains were observed (Figure 5a). Furthermore, due to the lack of shielding gas, as a possible result of the diffusion of some elements, i.e., oxygen and nitrogen from the air, it is thought to be some inclusions in the FZ, which were marked with yellow arrows in Figure 5b.
Weld zone microstructures of Sample 21, which have the highest heat input and, of course, slowest cooling rate, are completely different from Sample 20 and not associated with the CE values due to the slow cooling conditions. The FZ of Sample 21 consisted of ferritic microstructures with multiple morphologies, e.g., grain boundary, acicular and Widmanstatten (Figure 6a). Due to the oriented solidification and slow cooling rate, elongated and extremely coarse grains were revealed. In Figure 6b, grain boundaries were dashed with yellow, which contain different ferritic structures. Acicular ferritic microstructures can also be seen in Figure 6. The yellow arrows show the inclusions where acicular ferrites nucleated (Figure 6c).
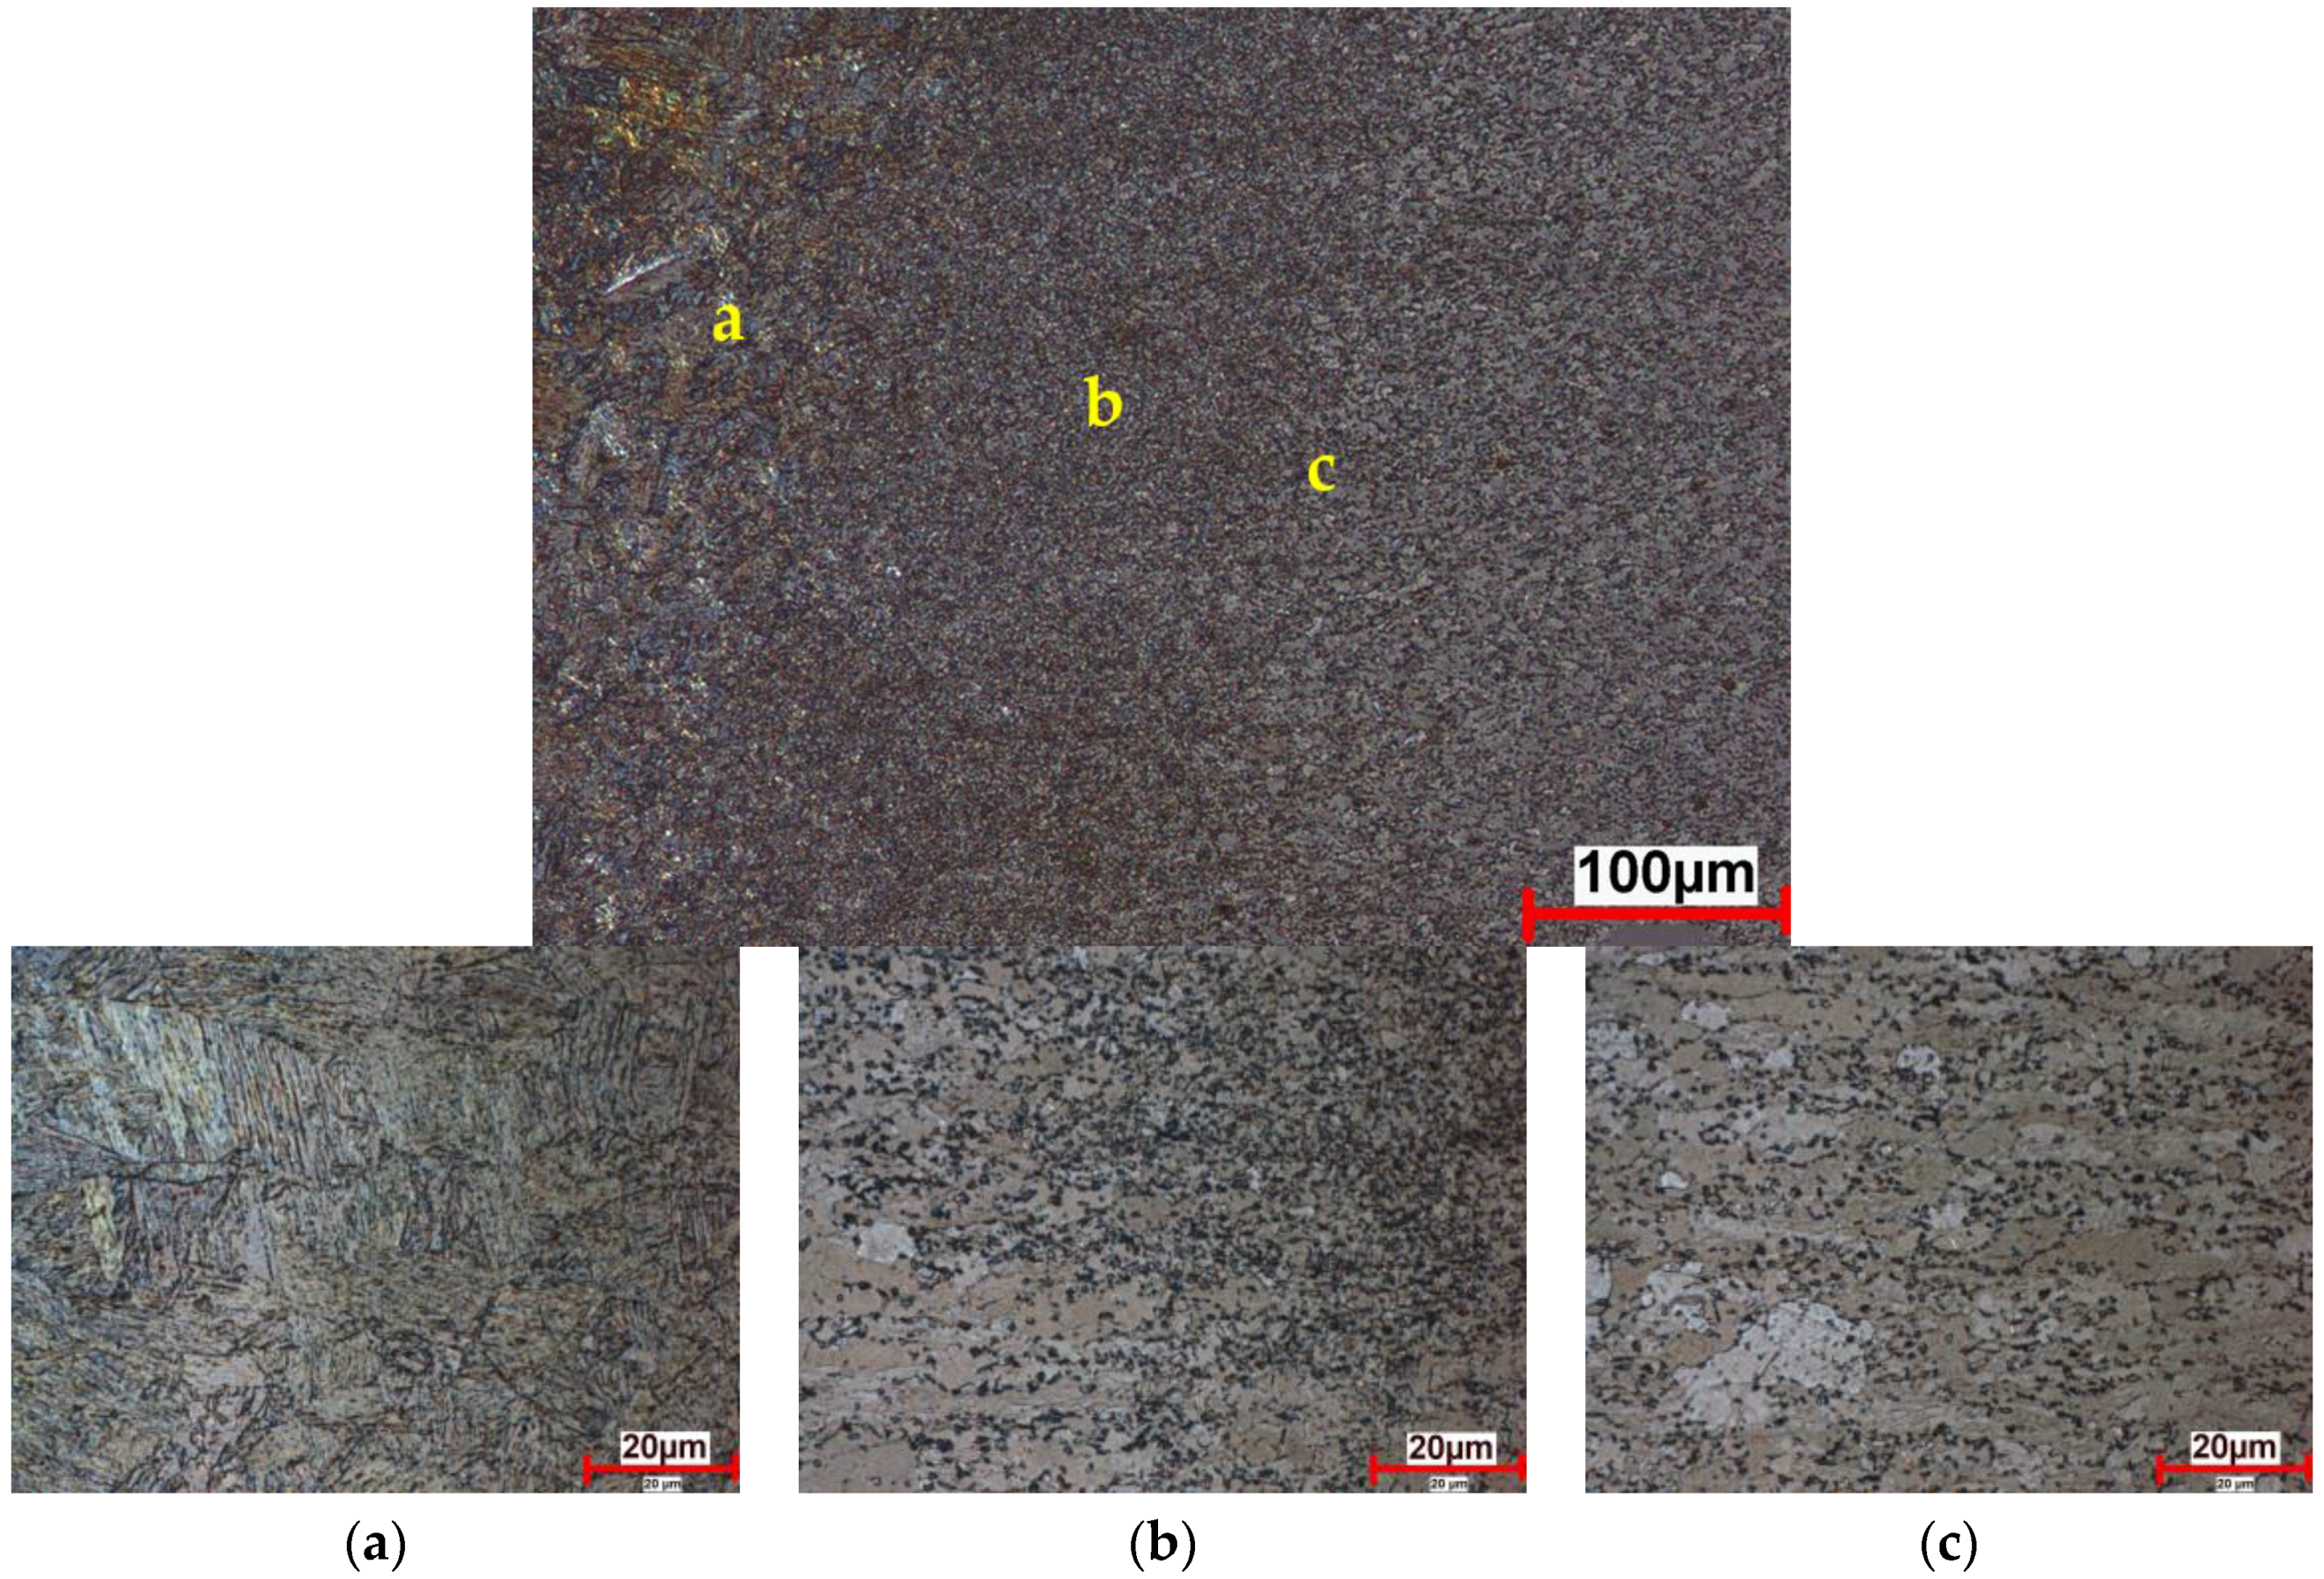
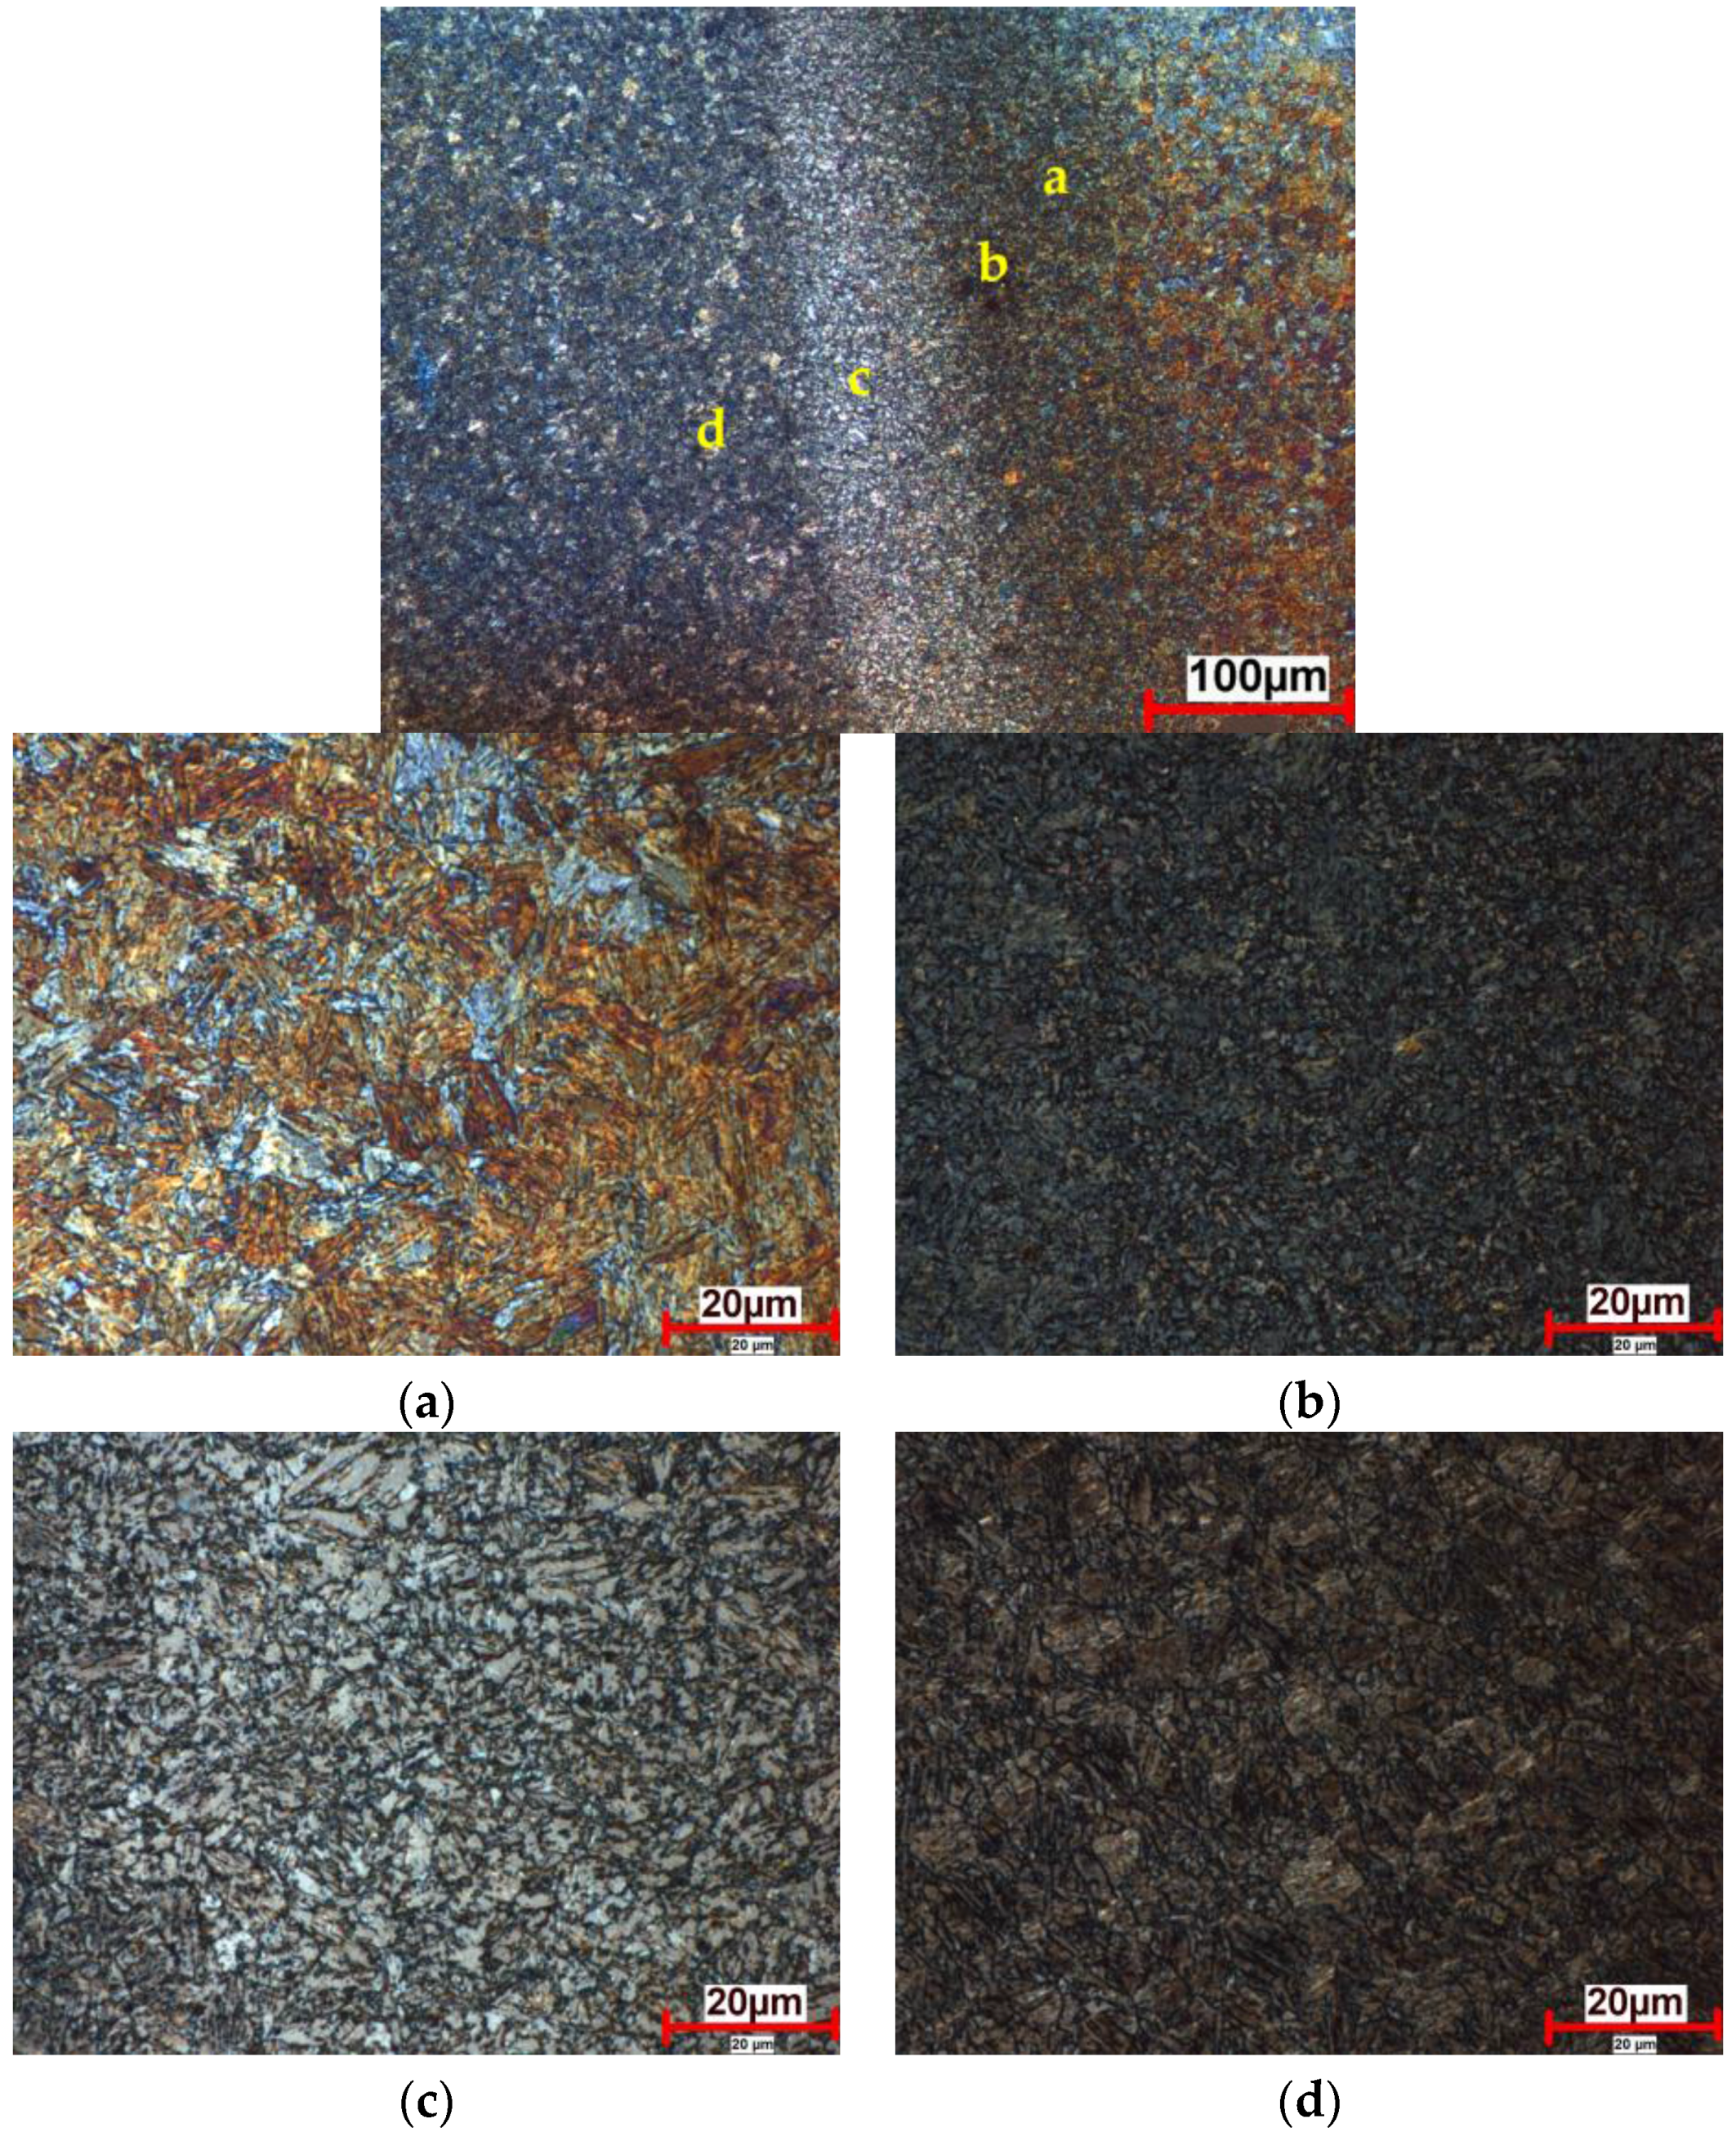
The HAZ of Sample 20 can be divided into five subzones, namely partially molten zone (PMZ), coarse-grained HAZ (CGHAZ), fine-grained (FGHAZ), inter-critical HAZ (ICHAZ) and sub-critical HAZ (SCHAZ). Optical micrographs of these different subzones can be seen in Figure 7 and Figure 8. In the microstructural examinations, PMZ could not be observed. Both MART and HSLA steel, in CGHAZ, consisted of martensitic-bainitic microstructure as a result of the transformation of coarsened austenite grains (Figure 7a and Figure 8a). While the CGHAZ of MART steel shows a higher proportion of martensitic and lower proportion of bainitic microstructures, HSLA steel shows a higher proportion of bainitic and lower proportion of martensitic microstructures. This can be attributed to the CE values of the steels. A higher CE value promoted the formation of martensite, whereas a lower CE value promoted bainitic structures. Although the FGHAZ of MART steel’s microstructure is similar to CGHAZ, but consisted of finer grains, this zone could not be observed in HSLA steel. In the ICHAZ, where the peak temperature is between A3 and A1, the partial transformation of ferrite to a mixture of ferrite and austenite resulted in martensite islands between the fine-grained ferrite matrix and carbides in HSLA steel (Figure 7b) [2]. Figure 7b shows a transition zone towards SCHAZ.
The ICHAZ of MART steel exhibited a dual phase microstructure containing ferrite with fine and well-dispersed martensite. In addition, some portion of the acicular ferritic microstructures can be seen in Figure 8c. Since shielding gas was not used, nitrogen and oxygen absorption could promote titanium base nitrides, carbo-nitrides and oxide inclusions where acicular ferrites can nucleate [2,36,37,38]. Furthermore, the slow cooling rate of this zone could induce ferritic structures to be formed. Figure 8d shows the SCHAZ of MART steel. In this zone, tempered martensite and bainite formed due to the lower peak temperature than A1. However, it is expected that the coarsening of the carbides occurs in the HSLA side, and there is no difference identified metallographically. This can be related to the thermal stability of the HSLA, which is greater than MART and, therefore, does not have a microstructure that is distinct from its BM [2].
For Sample 21, the whole weld zone was roughly 11 mm, so only the micrographs of specific zones are presented here. The CGHAZ of HSLA side of Sample 21 consisted of ferritic and bainitic structures and it is shown with dashed lines. The FGHAZ of the HSLA side contains similar, but finer grains with respect to CGHAZ (Figure 9b). Beside the FGHAZ, coarsening of the carbides occurred in the HSLA side.
In the CGHAZ and FGHAZ of the MART side of Sample 21, as a result of the higher CE, coarse baiting, ferritic and martensitic microstructures were identified (Figure 10a,b). The ICHAZ, in accordance with the Fe-Fe3C equilibrium diagram, consisted of fine ferritic structures with small portions of pearlitic structures (Figure 10c). As expected, under the influence of a relatively high temperature, which is in the range of martensite tempering temperatures, tempered martensite formed in SCHAZ of the MART side (Figure 10d).
Microhardness measurements were conducted in the various zones of Samples 20 and 21. The microhardness of the BM of the HSLA and MART steels was measured as 213 and 404 Vickers, respectively. The hardness profile of the welded joint section varies significantly because of the phase transformations during the thermal cycle of the welding process. Figure 11 shows the microhardness map of Sample 20. Figure 11 also presents the microhardness profile across the mid-section of the sample. Due to the rapid cooling of FZ, each material showed an increase in hardness of FZ relative to BM. The average microhardness value in the FZ is 480 Vickers and varies across the section. This fluctuation is attributed to the mixed microstructure of the FZ. Different hardness of the martensitic and bainitic microstructures could cause the fluctuation of the hardness profile. In addition, various morphologies (i.e., columnar and equiaxed) in FZ could be a reason for the various hardness. However, some researchers have focused to determine an empirical formula for FZ hardness using CE values; in the present study, the measured hardness of FZ is higher than the calculated values using the mentioned formulas [31,36]. The calculated hardness values using the formulas given in the literature are 434 HV and 365 HV. In all compared zones, MART steel exhibited higher hardness values due to the higher CE value, which has a significant influence on the hardenability. While the hardness of the HSLA side exhibits a sharp increase through the HAZ up to the FZ, the MART side shows a softening zone in HAZ. The continuous increase trend in the HSLA side was due to the ferritic microstructure of HSLA steel. The tempering zone and ferritic/martensitic dual phase structures in MART steel caused a decrease in hardness.
The microhardness map and profile of Sample 21 can be seen in Figure 12. The highest and the lowest microhardness values were measured in the BM of MART and HSLA, respectively. The highest value is related to the predominantly martensitic microstructure of the BM of MART steel. Among the weld zone of the MART steel, the ICHAZ showed the lowest microhardness corresponding with the ferritic-pearlitic microstructure. The measured microhardness values through the FZ showed a fluctuation, which can be a result of multiple morphologies of ferritic structures. In the HSLA side, microhardness values showed a decreasing trend up to the BM.

4. Conclusions

In this study, fiber laser welded dissimilar MART and HSLA steels have been evaluated with respect to tensile properties, microstructure and hardness profile. As the first step of this study, the process parameters of laser welded dissimilar steel joints have been optimized to maximize the TL and minimize the HI of the welded joints using the Taguchi method. The order of importance of the process parameters on the response was welding speed, laser power and focal position. The welding speed was found to be the most effective process parameter, and its interaction with the laser power should be monitored for the HI and TL of the joints. It was observed that, if the HI was not sufficient due to high speed or low laser power, the weld bead geometry was not formed appropriately. In addition, when applying excessive HI, the HAZ would be wider, and that causes a decrease in TL. The optimum combination of laser welding process parameters was a welding speed of 45 mm/s, a laser power of 1750 W and the focal position of −0.4 mm.
In the second step, the microstructural examination and microhardness evolution of the selected welds that have the highest and lowest response values were discussed. Weld zone microstructures of selected samples were completely distinct due to the different HI and consequently not associated with CE values due to slow cooling rates. The HAZ of the samples was divided into five subzones, namely PMZ, CGHAZ, FGHAZ, ICHAZ and SCHAZ, due to the grain transformations. Due to the phase transformations during the thermal cycle of the process, the hardness profile of the welded sections varies significantly. Due to the rapid cooling of FZ, each sample showed an increase in hardness of FZ relative to BM. While the hardness of the HSLA side exhibits a sharp increase through the HAZ up to the FZ, the MART side shows a softening zone in HAZ.

Acknowledgments

The authors acknowledge the Uludağ University Commission of Scientific Research Projects under Contract No. OUAP (MH)-2016/6 for supporting this research. Additionally, a part of this research was supported by the Coskunoz Holding Research and Development Department at Bursa, Turkey.

Author Contributions

Celalettin Yuce and Fatih Karpat conceived of and designed the experiments. Celalettin Yuce and Mumin Tutar performed the experiments and microstructural examination. Celalettin Yuce, Mumin Tutar and Nurettin Yavuz analyzed the data. All of the authors discussed the results and commented on the manuscript at all stages. All co-authors contributed to the manuscript proofing and submissions.

Conflicts of Interest

The authors declare no conflict of interest.

References

  1. Kuziak, R.; Kawalla, R.; Waengler, S. Advanced high strength steels for automotive industry. Arch. Civ. Mech. Eng. 2008, 8, 103–117. [Google Scholar] [CrossRef]
  2. Saha, D.C.; Westerbaan, D.; Nayak, S.S.; Biro, E.; Gerlich, A.P.; Zhou, Y. Microstructure-properties correlation in fiber laser welding of dual-phase and HSLA steels. Mater. Sci. Eng. A 2014, 607, 445–453. [Google Scholar] [CrossRef]
  3. Liu, Y.; Dong, D.; Wang, L.; Chu, X.; Wang, P.; Jin, M. Strain rate dependent deformation and failure behavior of laser welded DP780 steel joint under dynamic tensile loading. Mater. Sci. Eng. A 2015, 627, 296–305. [Google Scholar] [CrossRef]
  4. Benasciutti, D.; Lanzutti, A.; Rupil, G.; Haeberle, E.F. Microstructural and mechanical characterisation of laser-welded lap joints with linear and circular beads in thin low carbon steel sheets. Mater. Des. 2014, 62, 205–216. [Google Scholar] [CrossRef]
  5. Casalino, G.; Dal Maso, U.; Angelastro, A.; Campanelli, S.L. Hybrid laser welding: A review. DAAAM Int. Sci. Book 2010, 38, 413–430. [Google Scholar]
  6. Xu, W.; Westerbaan, D.; Nayak, S.S.; Chen, D.L.; Goodwin, F.; Zhou, Y. Tensile and fatigue properties of fiber laser welded high strength low alloy and DP980 dual-phase steel joints. Mater. Des. 2013, 43, 373–383. [Google Scholar] [CrossRef]
  7. Parkes, D.; Xu, W.; Westerbaan, D.; Nayak, S.S.; Zhou, Y.; Goodwin, F.; Bhole, S.; Chen, D.L. Microstructure and fatigue properties of fiber laser welded dissimilar joints between high strength low alloy and dual-phase steels. Mater. Des. 2013, 51, 665–675. [Google Scholar] [CrossRef]
  8. Parkes, D.; Westerbaan, D.; Nayak, S.S.; Zhou, Y.; Goodwin, F.; Bhole, S.; Chen, D.L. Tensile properties of fiber laser welded joints of high strength low alloy and dual-phase steels at warm and low temperatures. Mater. Des. 2014, 56, 193–199. [Google Scholar] [CrossRef]
  9. Wang, J.; Yang, L.; Sun, M.; Liu, T.; Li, H. Effect of energy input on the microstructure and properties of butt joints in DP1000 steel laser welding. Mater. Des. 2016, 90, 642–649. [Google Scholar] [CrossRef]
  10. Wang, J.; Yang, L.; Sun, M.; Liu, T.; Li, H. A study of the softening mechanisms of laser-welded DP1000 steel butt joints. Mater. Des. 2016, 97, 118–125. [Google Scholar] [CrossRef]
  11. Rossini, M.; Spena, P.R.; Cortese, L.; Matteis, P.; Firrao, D. Investigation on dissimilar laser welding of advanced high strength steel sheets for the automotive industry. Mater. Sci. Eng. A 2015, 628, 288–296. [Google Scholar] [CrossRef]
  12. Němeček, S.; Mužík, T.; Míšek, M. Differences between laser and arc welding of HSS steels. Phys. Proced. 2012, 39, 67–74. [Google Scholar] [CrossRef]
  13. Zhao, Y.Y.; Zhang, Y.S.; Hu, W. Effect of welding speed on microstructure, hardness and tensile properties in laser welding of advanced high strength steel. Sci. Technol. Weld. Join. 2013, 18, 581–590. [Google Scholar] [CrossRef]
  14. Arslanoglu, N.; Yigit, A. Experimental investigation of radiation effect on human thermal comfort by Taguchi method. Appl. Therm. Eng. 2016, 92, 18–23. [Google Scholar] [CrossRef]
  15. Tutar, M.; Aydin, H.; Yuce, C.; Yavuz, N.; Bayram, A. The optimisation of process parameters for friction stir spot-welded AA3003-H12 aluminium alloy using a Taguchi orthogonal array. Mater. Des. 2014, 63, 789–797. [Google Scholar] [CrossRef]
  16. Benyounis, K.Y.; Olabi, A.G. Optimization of different welding processes using statistical and numerical approaches—A reference guide. Adv. Eng. Softw. 2008, 39, 483–496. [Google Scholar] [CrossRef] [Green Version]
  17. Anawa, E.M.; Olabi, A.G. Optimization of tensile strength of ferritic/austenitic laser-welded components. Opt. Lasers Eng. 2008, 46, 571–577. [Google Scholar] [CrossRef] [Green Version]
  18. Anawa, E.M.; Olabi, A.G. Using Taguchi method to optimize welding pool of dissimilar laser-welded components. Opt. Laser Technol. 2008, 40, 379–388. [Google Scholar] [CrossRef] [Green Version]
  19. Sathiya, P.; Jaleel, M.Y.A.; Katherasan, D.; Shanmugarajan, B. Optimization of laser butt welding parameters with multiple performance characteristics. Opt. Laser Technol. 2011, 43, 660–673. [Google Scholar] [CrossRef]
  20. Casalino, G.; Campanelli, S.L.; Ludovico, A.D. Laser-arc hybrid welding of wrought to selective laser molten stainless steel. Int. J. Adv. Manuf. Technol. 2013, 68, 209–216. [Google Scholar] [CrossRef]
  21. Acherjee, B.; Kuar, A.S.; Mitra, S.; Misra, D. A sequentially integrated multi-criteria optimization approach applied to laser transmission weld quality enhancement—A case study. Int. J. Adv. Manuf. Technol. 2013, 65, 641–650. [Google Scholar] [CrossRef]
  22. Benyounis, K.Y.; Olabi, A.G.; Hashmi, M.S.J. Effect of laser welding parameters on the heat input and weld-bead profile. J. Mater. Process. Technol. 2005, 164, 978–985. [Google Scholar] [CrossRef] [Green Version]
  23. Ruggiero, A.; Tricarico, L.; Olabi, A.G.; Benyounis, K.Y. Weld-bead profile and costs optimisation of the CO2 dissimilar laser welding process of low carbon steel and austenitic steel AISI316. Opt. Laser Technol. 2011, 43, 82–90. [Google Scholar] [CrossRef]
  24. Olabi, A.G.; Alsinani, F.O.; Alabdulkarim, A.A.; Ruggiero, A.; Tricarico, L.; Benyounis, K.Y. Optimizing the CO2 laser welding process for dissimilar materials. Opt. Lasers Eng. 2013, 51, 832–839. [Google Scholar] [CrossRef]
  25. Reisgen, U.; Schleser, M.; Mokrov, O.; Ahmed, E. Optimization of laser welding of DP/TRIP steel sheets using statistical approach. Opt. Laser Technol. 2012, 44, 255–262. [Google Scholar] [CrossRef]
  26. Zhao, Y.; Zhang, Y.; Hu, W.; Lai, X. Optimization of laser welding thin-gage galvanized steel via response surface methodology. Opt. Lasers Eng. 2012, 50, 1267–1273. [Google Scholar] [CrossRef]
  27. Benyounis, K.Y.; Olabi, A.G.; Hashmi, M.S.J. Multi-response optimization of CO2 laser-welding process of austenitic stainless steel. Opt. Laser Technol. 2008, 40, 76–87. [Google Scholar] [CrossRef] [Green Version]
  28. SSAB Products. Available online: http://www.ssab.com/products/brands/docol (accessed on 22 August 2016).
  29. Guo, W.; Crowther, D.; Francis, J.A.; Thompson, A.; Liu, Z.; Li, L. Microstructure and mechanical properties of laser welded S960 high strength steel. Mater. Des. 2015, 85, 534–548. [Google Scholar] [CrossRef]
  30. Khan, M.I.; Kuntz, M.L.; Biro, E.; Zhou, Y. Microstructure and mechanical properties of resistance spot welded advanced high strength steels. Mater. Trans. 2008, 49, 1629–1637. [Google Scholar] [CrossRef]
  31. Oyyaravelu, R.; Kuppan, P.; Arivazhagan, N. Metallurgical and Mechanical properties of Laser welded High Strength Low Alloy Steel. J. Adv. Res. 2016, 7, 463–472. [Google Scholar] [CrossRef] [PubMed]
  32. Coelho, R.S.; Corpas, M.; Moreto, J.A.; Jahn, A.; Standfuß, J.; Kaysser-Pyzalla, A.; Pinto, H. Induction-assisted laser beam welding of a thermomechanically rolled HSLA S500MC steel: A microstructure and residual stress assessment. Mater. Sci. Eng. A 2013, 578, 125–133. [Google Scholar] [CrossRef]
  33. Talaş, Ş. The assessment of carbon equivalent formulas in predicting the properties of steel weld metals. Mater. Des. 2010, 31, 2649–2653. [Google Scholar] [CrossRef]
  34. Yurioka, N. Carbon Equivalents for Hardenability and Cold Cracking Susceptibility of Steels. In Proceedings of the Select Conference on Hardenability of Steels, Derby, UK, 17 May 1990.
  35. Santillan Esquivel, A.; Nayak, S.S.; Xia, M.S.; Zhou, Y. Microstructure, hardness and tensile properties of fusion zone in laser welding of advanced high strength steels. Can. Metall. Q. 2012, 51, 328–335. [Google Scholar] [CrossRef]
  36. Midawi, A.R.H.; Santos, E.B.F.; Huda, N.; Sinha, A.K.; Lazor, R.; Gerlich, A.P. Microstructures and mechanical properties in two X80 weld metals produced using similar heat input. J. Mater. Process. Technol. 2015, 226, 272–279. [Google Scholar] [CrossRef]
  37. Beidokhti, B.; Kokabi, A.H.; Dolati, A. A comprehensive study on the microstructure of high strength low alloy pipeline welds. J. Alloys Compd. 2014, 597, 142–147. [Google Scholar] [CrossRef]
  38. Beidokhti, B.; Dolati, A.; Koukabi, A.H. Effects of alloying elements and microstructure on the susceptibility of the welded HSLA steel to hydrogen-induced cracking and sulfide stress cracking. Mater. Sci. Eng. A 2009, 507, 167–173. [Google Scholar] [CrossRef]
Figure 1. (a) Schematic illustration of the fiber laser welded steel sheets; (b) dimensions of the tensile test specimens. MART, martensitic steel.
Metals 06 00245 g001
Figure 2. Effects plots of (a) S/N ratios; and (b) mean of means for the response.
Metals 06 00245 g002
Figure 3. Transverse sections of the joints using different heat inputs: (a) 300 J/mm, Sample 11; (b) 44 J/mm, Sample 25.
Metals 06 00245 g003
Figure 4. Optical micrograph and SEM views of the: (a) HSLA base metal (BM); (b) MART BM.
Metals 06 00245 g004
Figure 5. (a) Optical micrograph; and (b) SEM micrograph showing the FZ of the Sample 20.
Metals 06 00245 g005
Figure 6. Detailed different magnifications of FZ microstructures of Sample 21: (a) FZ at ×100 magnification; (b) extremely coarse grains in FZ; and (c) inclusions in FZ.
Metals 06 00245 g006
Figure 7. Detailed heat affected zone (HAZ) microstructures and subzones of the HSLA side of Sample 20: (a) coarse-grained HAZ (CGHAZ); (b) inter-critical HAZ (ICHAZ); and (c) sub-critical HAZ (SCHAZ).
Metals 06 00245 g007
Figure 8. Detailed HAZ microstructures and subzones of the MART side of Sample 20: (a) CGHAZ; (b) fine-grained (FGHAZ); (c) ICHAZ; and (d) SCHAZ.
Metals 06 00245 g008
Figure 9. Microstructures of the HAZ zone for HSLA side of Sample 21: (a) CGHAZ and (b) FGHAZ.
Metals 06 00245 g009
Figure 10. Detailed HAZ microstructures and subzones of the MART side of Sample 21: (a) CGHAZ; (b) FGHAZ; (c) ICHAZ; and (d) SCHAZ.
Metals 06 00245 g010
Figure 11. Microhardness map and profile of Sample 20.
Metals 06 00245 g011
Figure 12. Microhardness map and profile of Sample 21.
Metals 06 00245 g012
Table 1. Mechanical properties and chemical composition of the steels.
MaterialCSiMnPSAlNb + TiYield Strength (MPa)Ultimate Strength (MPa)Elongation (min %)
Docol 1200M0.140.42.00.020.010.0150.19501200–14003
HSLA *0.10.51.80.0250.0250.0150.15500570–71014
* HSLA: high strength low alloy.
Table 2. Laser welding process parameters and levels.
VariablesUnitSymbolLevel 1Level 2Level 3Level 4Level 5
Laser PowerWP10001250150017502000
Welding Speedmm/sS515253545
Focal PositionmmF0−0.2−0.4−0.6−0.8
Table 3. Design matrix with experimental results. TL, tensile load; HI, heat input.
Exp. No.ParametersOutputs and CalculationsResponseS/N Ratio
Power (W)Speed (mm/s)Focal (mm)TL (kN)SDNormalized TLHI (J/mm)Normalized HI
11000505.920.040.995200.0000.1110.642−3.849
2100015−0.25.490.050.92366.6670.3330.687−3.260
3100025−0.44.610.220.77540.0000.5560.687−3.260
4100035−0.63.430.110.57828.5710.7780.658−3.635
5100045−0.83.180.200.53422.2221.0000.720−2.853
612505−0.25.880.020.990250.0000.0890.629−4.026
7125015−0.45.820.060.97883.3330.2670.694−3.172
8125025−0.65.320.080.89450.0000.4440.714−2.926
9125035−0.84.440.080.74635.7140.6220.697−3.135
1012504503.710.140.62527.7780.8000.695−3.160
1115005−0.45.730.040.964300.0000.0740.608−4.321
12150015−0.65.930.050.997100.0000.2220.687−3.260
13150025−0.85.930.060.99760.0000.3700.746−2.545
1415003505.820.000.97942.8570.5190.795−1.992
15150045−0.24.300.100.72333.3330.6670.701−3.085
1617505−0.65.520.060.929350.0000.0630.583−4.686
17175015−0.85.900.020.992116.6670.1900.671−3.465
1817502505.790.100.97470.0000.3170.712−2.950
19175035−0.25.870.020.98750.0000.4440.770−2.270
20175045−0.45.950.011.00038.8890.5710.829−1.628
2120005−0.85.520.070.929400.0000.0560.579−4.746
2220001505.870.100.987133.3330.1670.659−3.622
23200025−0.25.580.080.93880.0000.2780.674−3.426
24200035−0.45.620.040.94657.1430.3890.723−2.817
25200045−0.65.670.050.95344.4440.5000.772−2.247
Table 4. Response table for the S/N ratios for the objective.
LevelLaser PowerWelding SpeedFocal Position
1−3.372−4.326−3.349
2−3.284−3.356−3.351
3−3.041−3.022−3.040
4−3.000−2.770−3.214
5−3.372−2.595−3.115
Delta0.3721.7310.311
Rank213
Table 5. Analyses of variance table for means.
SourceDegrees of Freedom (DF)Sum of Squares (Seq SS)Adjusted Mean Squares (Adj MS)FpContribution (%)
Laser Power40.0049750.0012440.610.6635.60
Welding Speed40.0568130.0142036.970.00464.01
Focal Position40.0025060.0006270.310.8672.82
Residual Error120.0244500.002038 27.55
Total240.088745
Table 6. The carbon equivalent (CE) values of the HSLA and MART steels. FZ, fusion zone.
Calculated ZoneHSLAMARTFZ
CE0.3300.4530.391