1. Introduction
Electrical discharge machining, also known as EDM, is one of the non-traditional machining processes most commonly used in industry for high precision machining [
1]. Its greatest field of application is in the manufacture of molds and dies [
2]. In this process, the material removal mechanism uses electrical energy and turns it into thermal energy through a series of discrete electrical discharges that occur between the electrode and the workpiece immersed in an insulating dielectric fluid [
3].
Inconel
®600 alloy (Ni–Cr–Fe) is a registered trademark of Special Metals Corporation Group of Companies. Nickel-based alloys contain at least 50% nickel [
4] and are characterized by their high heat resistance, corrosion resistance [
5] and excellent thermal stability [
6]. Compared to titanium alloys, these alloys have a broader range of operational temperatures, which makes them more attractive materials for use under extreme temperature conditions [
7]. In addition, all of these properties make them unique materials with a high demand in critical components of aerospace engines [
8] and gas turbines [
9] and in the chemical, medical and nuclear industries, among others, in the present day [
4]. Concretely, this alloy contains 72% min. nickel and is mainly used in furnace components, chemical processes, nuclear engineering [
10], steam generator tubes [
11] and, generally, in applications where strength is required at high temperatures [
12].
In the existing bibliography, there are very few research works dealing with the EDM of Inconel
®600, while none have been found that use a Cu-C electrode. Following this line, the authors of this present study carried out different studies on the machinability and surface roughness of an Inconel
®600 alloy using copper [
13] and graphite electrodes [
14]. In addition, the effect of electrode polarity was also analyzed and compared, and some remarkable results were found. In the case of copper electrodes, negative polarity and low values of current intensity are recommended in order to obtain a good surface roughness. In contrast, when high rates of material removal are needed, positive polarity should be selected. On the other hand, when graphite electrodes were used, experiments subjected to negative polarity reached higher values of MRR rather than those obtained with positive polarity. For the case of surface roughness, positive polarity turns out to be more suitable when good surface quality is required.
Material removal rate (MRR), electrode wear (EW) and surface roughness (SR) play an important role in industrial performances. Moreover, these features are generally influenced by EDM electrical parameters, such as pulse time, current intensity, open-circuit voltage, duty cycle, etc. [
15], which should be optimized to attain the best conditions. Therefore, this great influence has motivated some research work. Many of these studies analyze the influence of these parameters on MRR, EW and SR and also try to achieve machining strategies that maximize MRR, or minimize EW and SR.
In their research work, Beri et al. [
16] studied the influence of current intensity during electrical discharge machining of Inconel 718 alloy with a copper tungsten-processed electrode. The results showed that MRR and SR increased with the increase in current intensity with both positive and negative polarities, and also, that increase was higher with positive polarity as compared to the negative one.
Another notable study is the one carried out by Barenji et al. [
17], where an analysis of the influence of pulse time, current intensity and voltage on MRR and tool wear rate (TWR) was carried out on an AISI D6 tool steel. The results indicated that MRR increased with the increase in pulse time, while TWR decreased. In addition, high values of both pulse time and current lead to high amounts of MRR and TWR.
Furthermore, Verma and Sajeevan [
18] studied the influence of different EDM process variables on various performance characteristics, such as material removal rate, tool wear rate and surface roughness, when machining a titanium alloy (Ti6Al4V).
Straka et al. [
19] investigated the heat affected zone of an eroded surface after die sinking EDM. According to their experimental results, they found that the main technological parameters that affect the quality of the machined surface in terms of microstructural changes were peak current, pulse on-time and pulse off-time.
Dhanabalan et al. [
20] made an attempt to analyze the form tolerances in EDM of Inconel 718 and Inconel 625. To do so, current intensity, pulse time, pause time and fluid pressure were chosen as input parameters. Kuppan et al. [
21] reported on an experimental investigation of small deep hole drilling of Inconel 718 using the EDM process. The results revealed that MRR is more influenced by peak current, duty factor and electrode rotation, whereas depth averaged surface roughness is strongly influenced by peak current and pulse time.
D’Urso et al. [
22] investigated the influence of MRR and the thermal and electrical properties of workpiece and electrode materials on the performance of micro-EDM drilling. According to their experimental results, they found that MRR is directly proportional to the thermal conductivity of both the workpiece and electrode and is indirectly proportional to melting temperature and electrical resistivity.
Apart from electrical parameters, other parameters such as the polarity and material of the electrode have a big influence on the machinability, surface roughness and, ultimately, on process performance. Due to their importance in the EDM process, both have become the focus of many experimental studies in parallel with the electrical ones.
Gostmirovic et al. [
23] focused on the influence of the polarity in the EDM process of manganese-vanadium tool steel using a graphite electrode. According to their experimental studies, they recommend positive polarity when high rates of removed material need to be obtained because of the smaller mass of the electrons than the anions. Beri et al. [
16] also studied the polarity effect during electrical discharge machining of Inconel 718 alloy with a Cu-W electrode. Again, one of the most relevant conclusions of that study is the higher material rates when positive polarity is selected.
Ji et al. [
24] also carried out a study on the effects of tool polarity on the material removal rate, electrode wear ratio and surface roughness of a ceramic material with a copper electrode. In this case, the results were opposite those found by Gostmirovic et al. [
23] and Beri et al. [
16], resulting in higher rates of material removal and surface roughness with negative polarity. Consequently, the present literature shows that the influence of the polarity varies depending on the electrode and workpiece materials, and according to Reza et al. [
25], the wrong polarity can have significant implications on speed, wear and process stability.
Furthermore, in order to study the influence of some specific design factors on the response variables that determine the machinability and surface finish of the EDM process, many authors use statistical models based on design of experiments (DOE) techniques. With a small number of experiments, these techniques allow the effects of several parameters simultaneously on a response variable to be studied and also to quantify that influence. As can be observed in the latest research works recently published, the main models include factorial design experiments, the Taguchi method [
26] and response surface methodology (RSM) [
27], where the first ones are the most widespread techniques in these kinds of studies.
Likewise, Luis et al. used factorial design for modelling and analyzing the influence of the determined process variables over surface roughness [
28], material removal rate and electrode wear [
29] of a SiSiC ceramic machined by EDM. With the same objective, Dastagiri and Kumar [
30] selected a 2
3 factorial design with three center points and developed a mathematical model to predict MRR, average surface roughness and hardness using input parameters, such as current intensity, voltage, pulse time and duty factor. In the same way, Barenji et al. [
17] used a full factorial design including 32 experiments to determine the effects of some process parameters on MRR and TWR, and Spedding et al. [
31] selected a central composite experimental design for modelling the wire EDM process of an AISI 420 workpiece with a brass electrode.
In this present research work, an analysis and modelling of die sinking EDM in an Inconel ®600 is performed using Cu-C electrodes. To this end, analysis of variance and multiple linear regression techniques are used in order to learn which process parameter has the greatest influence and to obtain the mathematical models to predict the most influential factors on the performance characteristics, respectively. Additionally, this study is completed with a new modelling of the energy density parameter with a view to improving the EDM process.
2. Experimental Procedure
This section describes the materials and equipment used to carry out the experiments, as well as the methodology selected to plan and analyze the experimentation.
In this present research work, the equipment used for conducting the experiments was a conventional EDM machine, Model ONA DATIC D-2030-S (ONA electroerosión S.A., Durango, Spain), with a jet flushing system. As a dielectric fluid, mineral oil was chosen so as to improve the stability and the efficiency of the EDM process.
In addition, ground plates of Inconel
®600 of 50 mm × 50 mm × 5 mm in dimensions were used as a workpiece material. Inconel
®600 is a registered trademark of Special Metals Corporation Group of Companies. The density value of the Inconel
®600 workpiece is 8.47 g/cm
3. This alloy is characterized by its high heat resistance and corrosion resistance [
5].
The electrode material selected was Poco EDM-C3
®, a registered trademark of Poco Graphite, Inc. (Decatur, TX, USA) [
32]. The EDM-C3 is a copper infiltrated graphite (C-Cu) with an ultrafine grain (average particle size <5 µm) that provides good wear resistance and large material removal rates with good surface finishes. Its density is 3.05 g/cm
3, and it has a high sublimation temperature (3600 °C–3700 °C). All of the electrodes had a rectangular section (12 mm × 8 mm) and were milled before every run.
In addition, in this present study, the EDM machining was performed for 3 h or for a depth of cut of 1 mm (whichever is earlier). This was selected in this way so as to ensure a stable process and, consequently, more reliable results. Initial and final weights of both the workpiece and the electrode were measured by an electronic weighting balance having a precision of 0.04 mg + 2 × 10⁻⁷ weight. Every measure was repeated three times, and then, the average value was calculated. Weight loss of both the workpiece and electrode was used to calculate the material removal rate and electrode wear.
In order to obtain the surface roughness values, a profile rugosimeter ALPA RT-70 (Alpa srl, Pontoglio, Italy) with a mobile stylus was used. The stylus tip of the rugosimeter consisted of a diamond cone whose angle was 90°, and it had a tip radius of 3 µm. The static force applied by this stylus was 0.12 mN. Furthermore, a Gaussian filter that is defined in accordance with UNE-EN-ISO 16610-21 [
33] was used to evaluate the
Ra parameter. To do so, the rugosimeter parameters selected were as follows: evaluation length = 4 mm, cut-off = 0.8 mm and the number of sampling lengths = 5. Every run was measured at five different locations equally distributed, and then, the average value was calculated.
In this present research, a 4
3 factorial design was selected, with three factors and four levels under consideration, giving a total of 64 experiments. All of the experiments were conducted for both positive and negative polarity.
Table 1 presents the design factors and the levels selected. All of the experiments were performed for both polarities. No replication was carried out.
There are a large number of variables that influence the machinability and the surface roughness in EDM processes. However, as mentioned in the Introduction, the literature [
16,
17,
18,
19,
20,
21] reveals that the following parameters are the most widely used among researchers: current intensity supplied by the generator of the EDM machine (
I), pulse time (
ti), duty cycle (η) and polarity. Accordingly, these four factors have been considered in this particular research work. In addition, open-circuit voltage (
U0) and flushing pressure (
P) were kept constant at 200 V and 30 kPa for all of the experimentation.
Due to the lack of previous experiences on the EDM of Inconel
®600 using a Cu-C electrode, preliminary tests were performed in order to achieve a stable process. To do so, the values used in the machining of this alloy with copper [
13] and graphite [
14] electrodes were taken as a reference. However, it was observed that, despite being the same workpiece material, the same machining conditions led to an unstable process and, sometimes, to the formation of electric arcs. Therefore, new ranges had to be studied. After having performed this experiment, it should be remarked that macroscopic craters on the surface of the workpiece were observed when very low pulse time was selected, whatever the current intensity and duty cycle were. In addition, when high values of duty cycle and pulse time were selected, the process became unstable.
The response variables considered in the present study are: material removal rate (MRR), electrode wear (EW) and, finally, surface roughness (SR). The first two are defined in Equations (1) and (2), respectively.
where ΔΩ
p, ΔΩ
e and
tm are the volume of material removed from the workpiece, the volume of material removed from the electrode and the time machining, respectively.
On the other hand, surface roughness is characterized by the amplitude parameter
Ra (arithmetic average of the roughness profile), as it is one of the most widespread parameters among industries to evaluate the EDM’ed surface. This parameter can be found in UNE-EN-ISO 4287:1999 [
34].
3. Modelling of the Energy Density Parameter
The energy density parameter (ρ
e) was formerly proposed in [
35] in order to analyze the influence of the EDM process on an Inconel
®718 alloy. In that case, the parameter was defined for just one machining cycle. The literature reveals that the mechanism of material removal in the EDM process is not yet very well understood. Undoubtedly, phenomena involved in the EDM process need to be investigated further in order to improve the process [
36]. Because of that and based on [
35], this present study makes an attempt to further investigate the EDM process and proposes a new energy density parameter (ρ
E) that takes into account the whole process. In addition, this new definition lets us quantify the energy density that absorbs the workpiece and the one that absorbs the electrode.
To differentiate the new proposed energy density parameter from the one found in [
35], it has been renamed as (ρ
E). This parameter, defined as the amount of energy needed to get a unit volume of material removed, can be calculated from Equation (3):
where
U0,
I and η are the open-circuit voltage, current intensity and duty cycle, respectively.
A detailed description follows on how this expression has been obtained. As seen in [
35], during the EDM process, the material is removed by melting and vaporization from both the workpiece (Ω
p) and the electrode (Ω
e), and the total volume of material removed (ΔΩ) during the process can be expressed from the definitions of MRR and EW shown before in Equations (1) and (2), respectively.
Considering that all of the energy is spent on removing material, the energy density can be defined as the ratio between energy and volume and expressed in kJ/mm
3. Unlike the parameter defined in [
35], in this case, the new parameter takes into account all of the cycles produced in the process, so that the machining time can be replaced by multiplying the pulse time and the number of cycles (
nc), as Equation (4) indicates.
In turn, as mentioned before, ΔΩ can be replaced in terms of MRR and EW so that the energy density is defined according to Equation (5).
Moreover, the number of cycles (
nc) and the duty cycle (η) can be defined according to Equations (6) and (7), respectively.
Replacing in Equation (5) the machining time by Equation (6) and arranging terms taking into account Equation (7), the final expression of the energy density as a function of the design variables is obtained, as shown in Equation (5).
Since a portion of that energy density is used in removing material from the workpiece and the other portion in removing material from the electrode, ρ
E can be decomposed into the energy density on the workpiece (ρ
p) and on the electrode (ρ
e). In turn, both terms can be calculated as the ratio between energy and volume, as shown in Equations (8) and (9).
Consequently, Equations (3), (8) and (9) can be expressed as shown in Equation (10).
4. Results and Discussion
The average values obtained for each of the response variables and for both polarities are listed in
Table 2. Subsequently, these results have been analyzed by using DOE techniques, and the models for each of the response variables have been obtained. In order to determine them, the model with the highest value of
R2adj has been selected. Moreover, the adequacy of the models has been analyzed by using the analysis of variance (ANOVA) technique.
4.1. Results and Analysis of MRR
Table 3 and
Table 4 represent the ANOVA tables for the material removal rate response and for both polarities. As can be seen, for the positive polarity, six effects have
p-values less than 0.05, indicating that they influence the MRR variable at a confidence level of 95%. In the case of negative polarity, seven effects are considered to be statistically significant. Furthermore, for both polarities, the effects of current intensity, duty cycle and the interaction effect between them are the most significant for MRR.
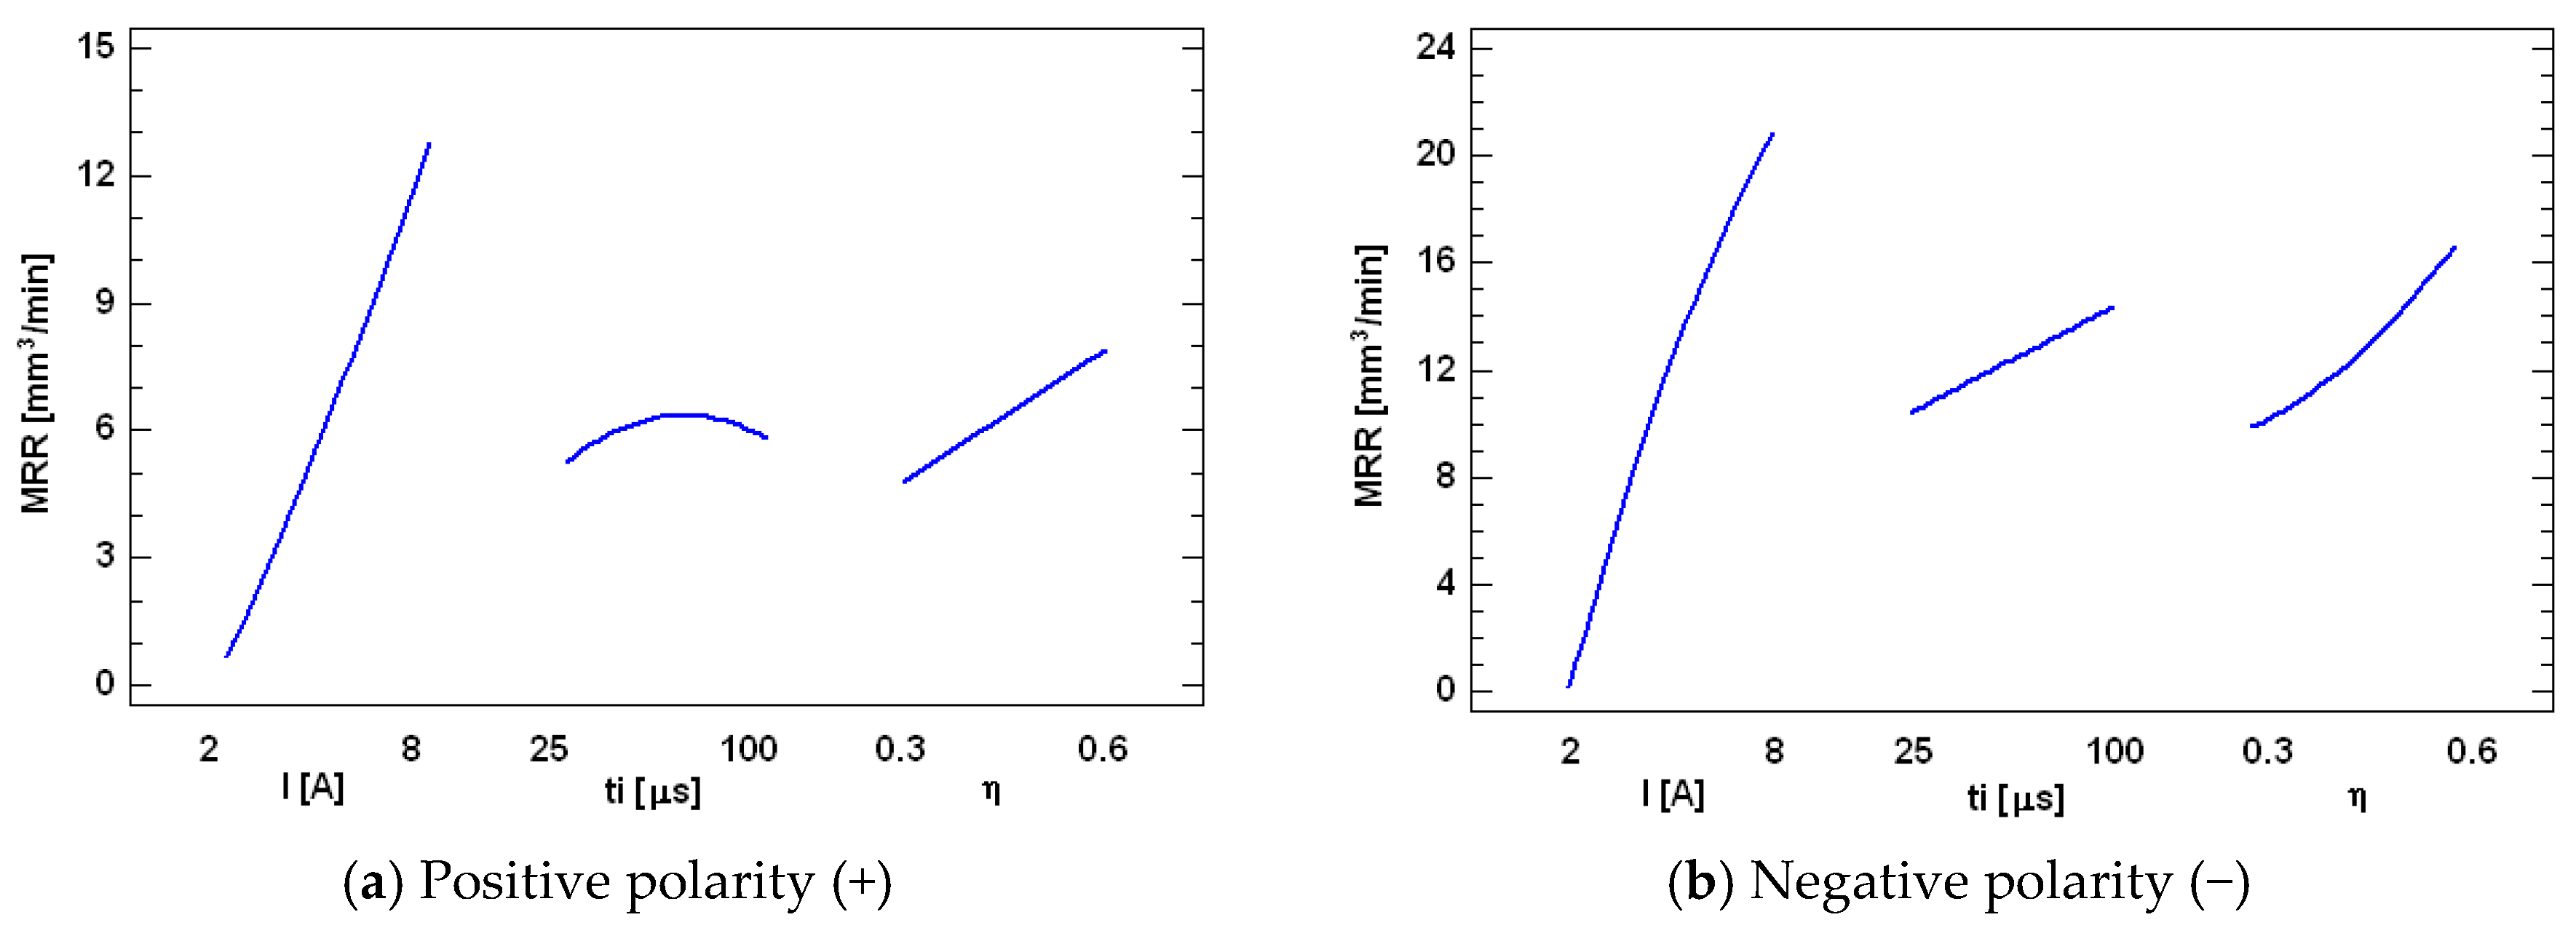
Figure 1 depicts the main effects plot for MRR. As can be observed, in both polarities, current intensity is the factor that most influences MRR. Material removal rate increases by increasing the current intensity value because each pulse takes more power, making the temperature rise and the workpiece melt faster. Thus, at 8 A, the material removal rate is around 13 mm
3/min for positive polarity and 21 mm
3/min for the negative one, whereas at 2 A, in both cases, MRR drops to 1 mm
3/min.
Moreover, the second most influential factor on MRR is duty cycle, and similarly to the current intensity effect, the MRR value increases when the duty cycle increases due to a larger number of pulses per unit time. Furthermore, it is also appreciated that with negative polarity, MRR values are higher than those obtained with positive polarity. With negative polarity, a maximum MRR of 30.4894 mm3/min is obtained, while with positive polarity, the maximum MRR value is 19.1347 mm3/min. In both cases, the values of current intensity and duty cycle were the maximum values considered in this study (8 A and 0.6).
In addition, the results of material removal rate obtained in the EDM of Inconel
®600 with the copper-graphite electrode have been compared to those obtained with graphite [
14] and copper [
13] electrodes. According to these results, it can be stated that the highest removal rate of all of the cases under consideration was produced with the copper-graphite electrode and negative polarity, which is 30.4894 mm
3/min, as mentioned earlier.
Regarding polarity, similar results were found with the graphite electrode. However, in this case, the maximum MRR values obtained were lower than those obtained with the copper-graphite electrode. With negative polarity, a maximum MRR of 22.2854 mm3/min was reached, while with positive polarity, the maximum MRR value was 15.3602 mm3/min. In the case of the copper electrode, the polarity trend turned out to be the opposite. The maximum MRR value was 22.4729 mm3/min, and it was obtained with positive polarity, while with negative polarity, the highest rate was only 1.8621 mm3/min. Finally, it should be noted that in the three cases under study, these high rates were performed to 8 A.
For the positive polarity experiments, the
R2 statistic has a value of 0.9785, indicating that the model represents 97.85% of the variability of MRR, whereas
R2adj is 97.54%. Meanwhile, for the negative polarity case,
R2 and
R2adj are 97.12% and 96.71%, respectively. The equations of the adjusted models for the MRR variable are shown in Equation (11) for the positive polarity and in Equation (12) for the negative one.
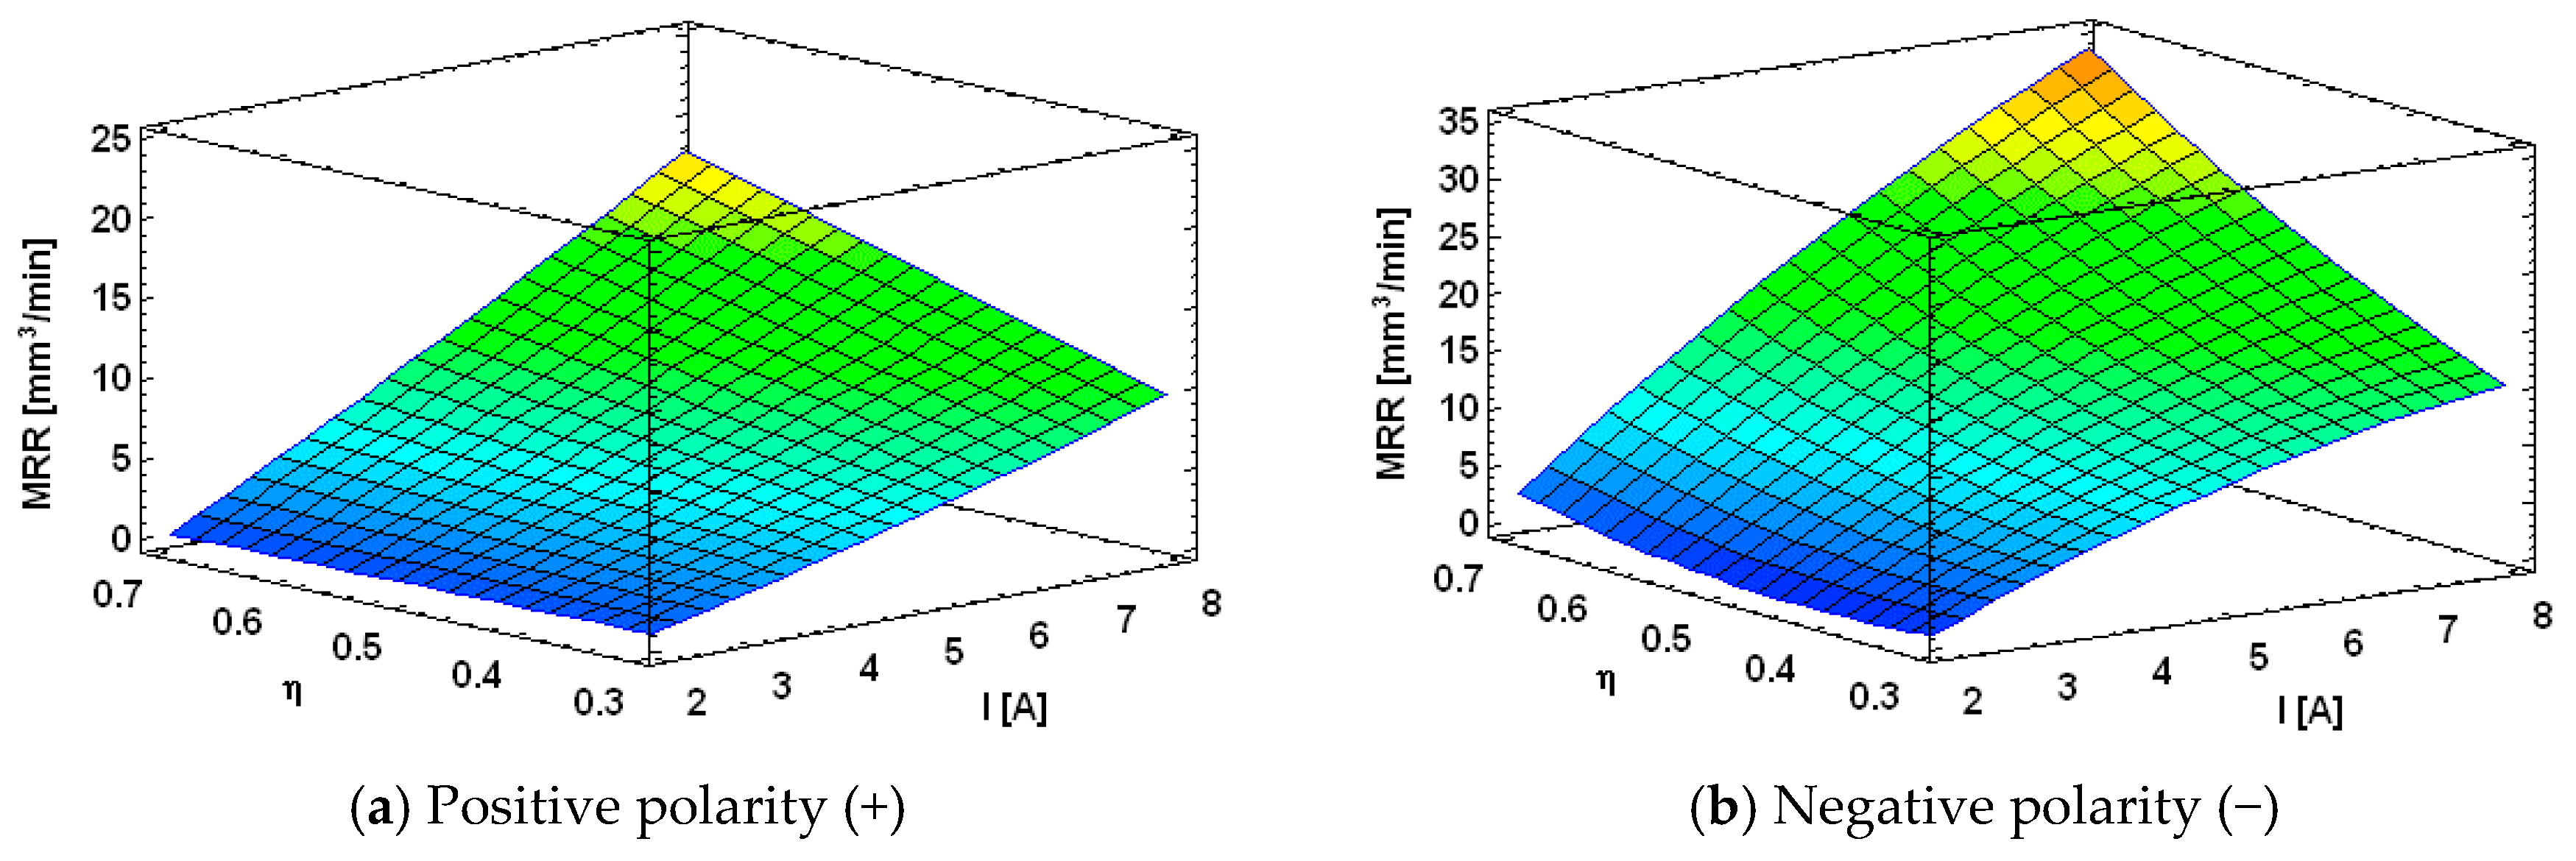
Figure 2 represents, for both polarities, the estimated response surface of MRR versus current intensity and duty cycle, while pulse time remains constant at its central value. As can be observed in
Figure 2a, there is a tendency for MRR to increase for high values of current intensity (5 A–8 A) as a function of duty cycle. However, when low values of current intensity are selected (2 A–3 A), the tendency is the opposite. In the case of negative polarity, as shown in
Figure 2b, at low values of current intensity (2 A), MRR tends to slightly decrease if duty cycle increases up to a minimum, situated approximately at 0.5, after which it starts to increase. Moreover, as previously mentioned, in both cases, the highest values of MRR are reached when both current intensity and duty cycle are maximum (8 A and 0.6).
4.2. Results and Analysis of EW
The ANOVA tables of EW are shown in
Table 5, for positive polarity, and in
Table 6, for negative polarity. As can be seen, for both polarities, four effects are statistically significant for the EW response. In the case of positive polarity, these effects, arranged in order of importance, are: pulse time, current intensity, the interaction effect between current intensity and pulse time and, finally, the quadratic effect of current intensity. Likewise, in the negative polarity case, these effects are: current intensity, the quadratic effect of current intensity, pulse time and duty cycle.
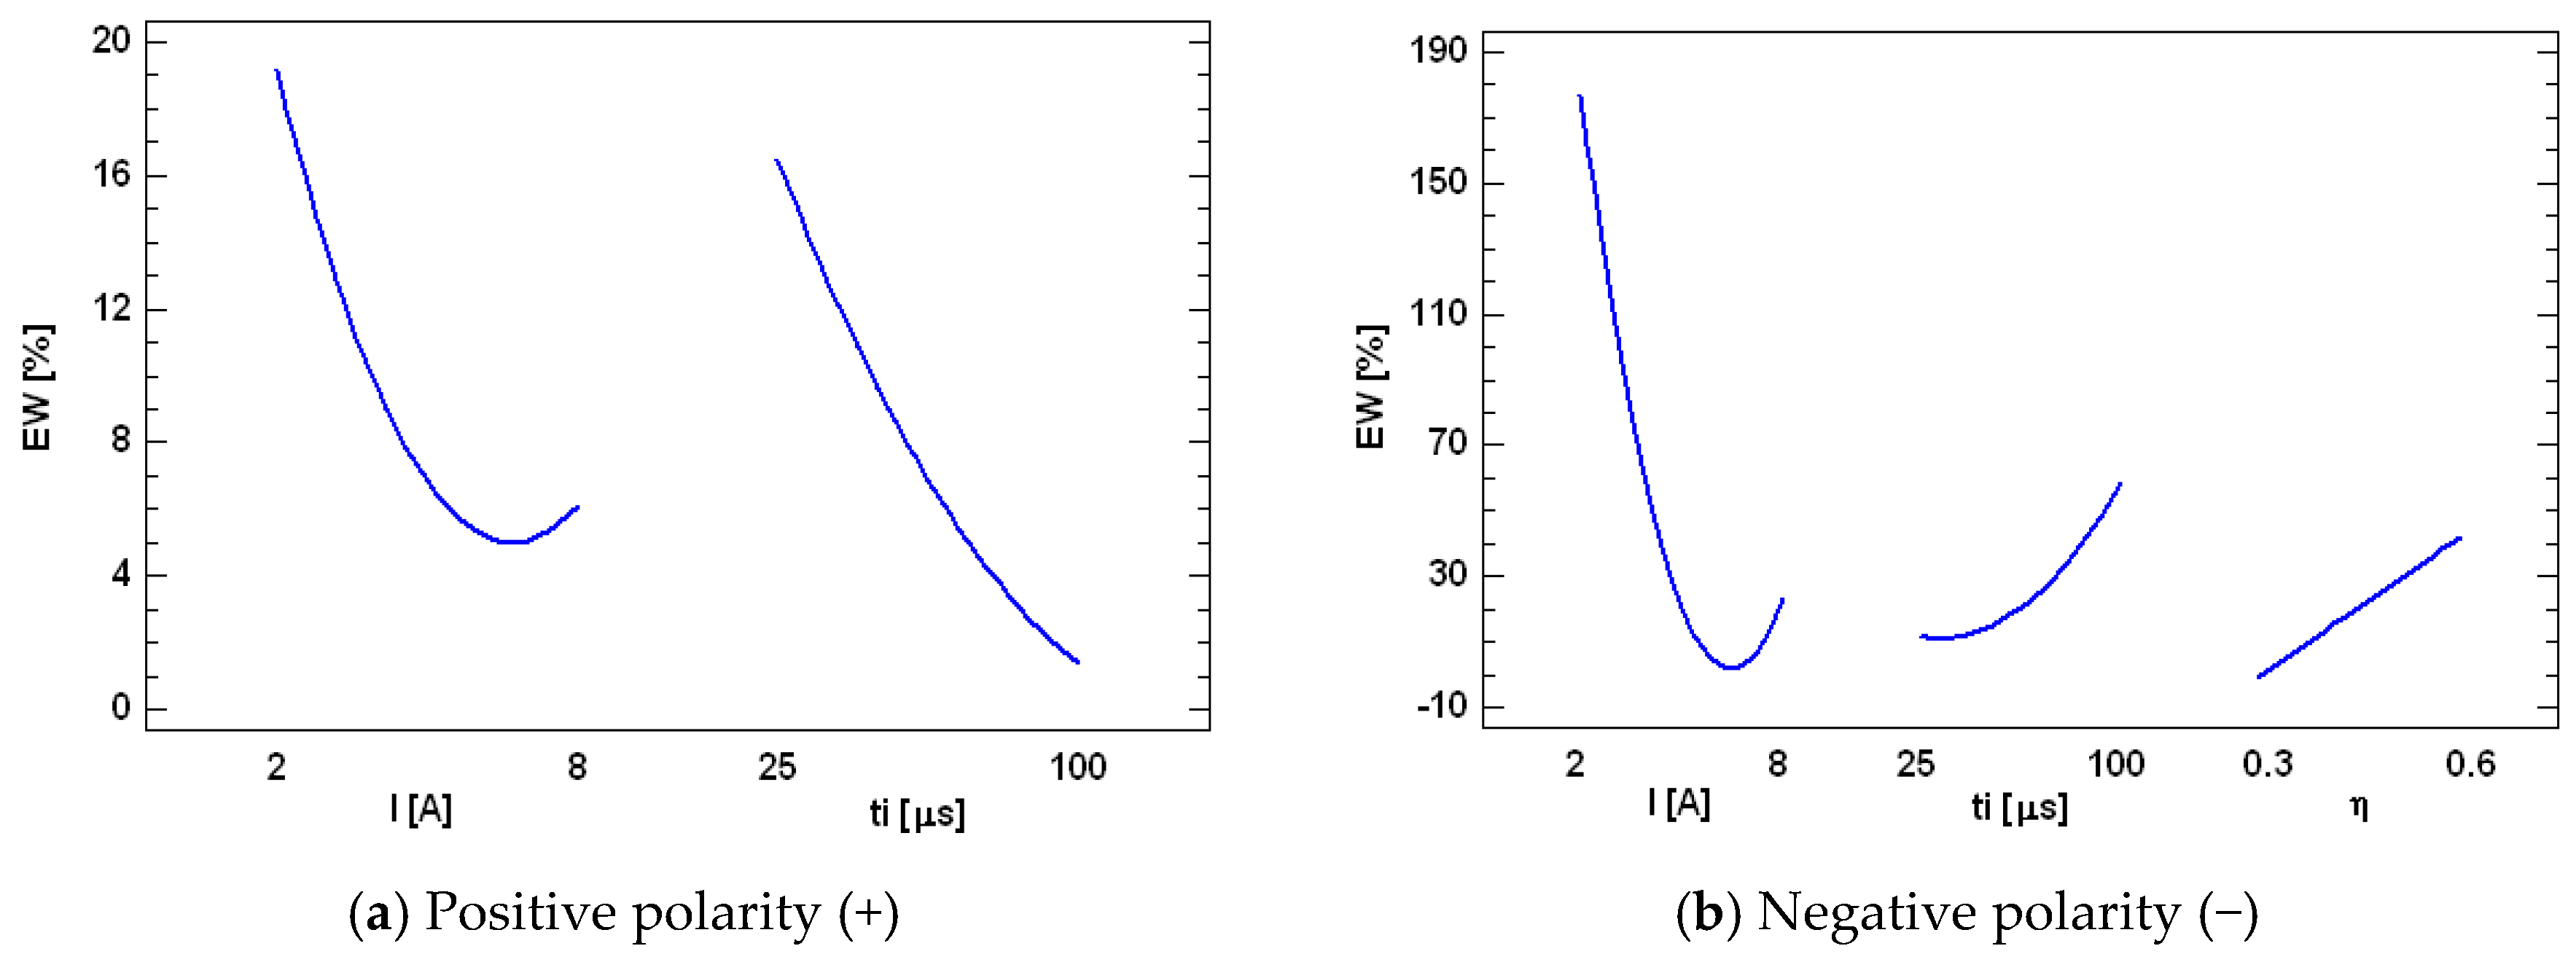
ANOVA results are plotted in
Figure 3, which shows the main effects plot for EW and for both polarities. With respect to pulse time, it is noted that the behavior of EW differs depending on the polarity selected. As shown in
Figure 3a, as pulse time increases from 25 µs–75 µs, lower rates of electrode material wear occur. However, with negative polarity, the lowest values of EW are reached when pulses of a short duration (25 µs–40 µs) are given, as shown
Figure 3b. Furthermore, it may be seen that, for both polarities, EW value decreases as the current intensity increases down to a value of about 7 A, after which it begins to increase.
On the other hand, it can be observed that with positive polarity, the electrode wear is much lower than that obtained with the negative one. For example, as shown in
Figure 3, under the same conditions, the EW in negative polarity is 3.3–9.5-times higher than that with positive polarity. Thus, in this case, the maximum EW value reached is 42.84%, while with negative polarity, it has reached a value of 320.70%. These results agree with those obtained in the EDM of an Inconel
®600 alloy with graphite [
14] and copper [
13] electrodes. In addition, it should be noted that the lowest electrode wear of the three cases under consideration was produced with the graphite electrode (−1312.96%). However, as discussed in [
14], this “negative” wear is not desirable because it is due to the deposition of particles from the dielectric.
Furthermore, for the EW variable and positive polarity, the
R2 statistic has a value of 72.44%, and
R2adj is 68.99%. For the negative polarity case, the values of
R2 and
R2adj are 69.65% and 65.85%, respectively. The simplified equations of the models are those shown in Equation (13) for positive polarity and in Equation (14) for negative polarity.
Due to the great variability of the results obtained for EW and shown in
Table 2, the values obtained for the adjusted model of EW are much lower than those obtained for MRR and the parameters of surface roughness.
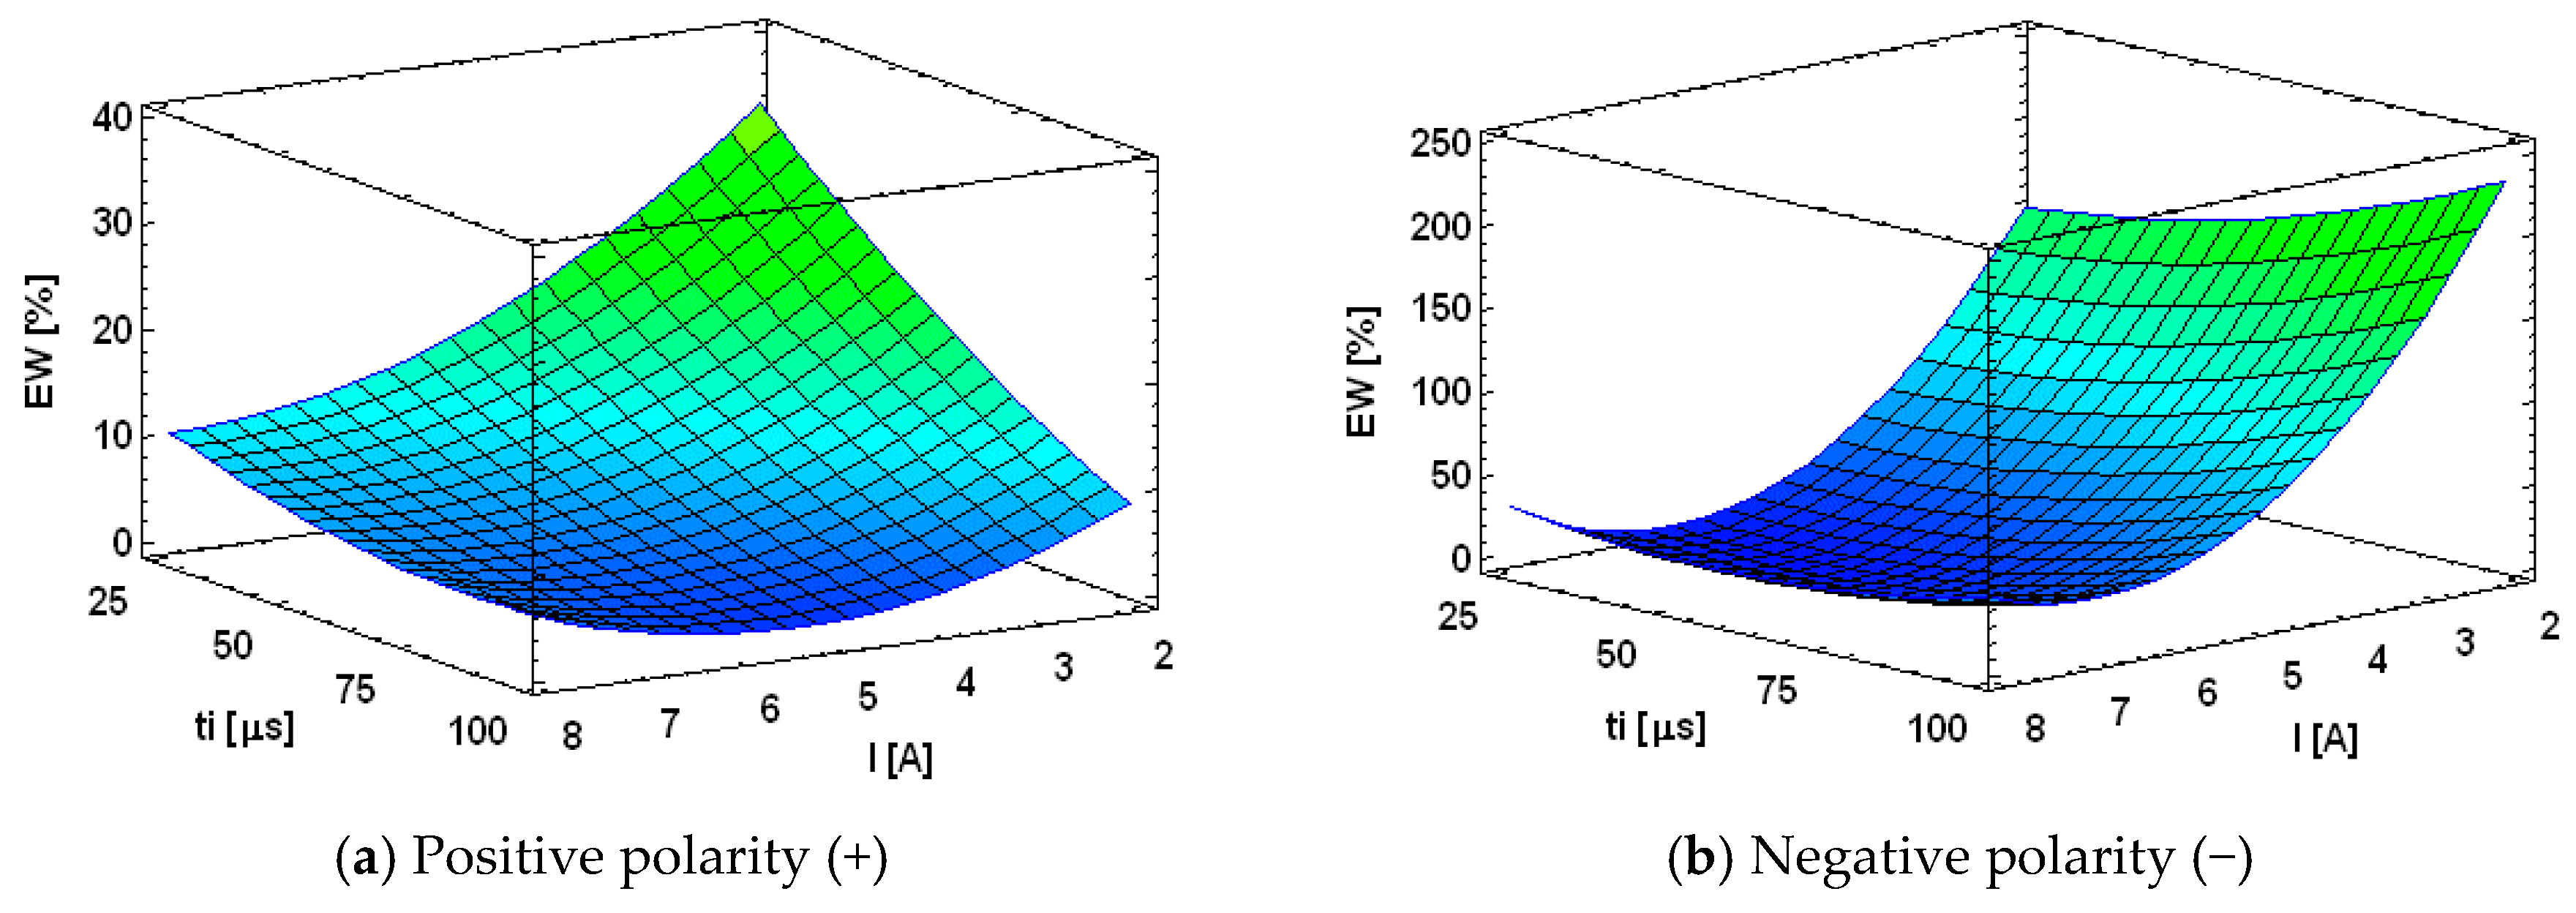
Figure 4 represents, for both polarities, the estimated response surface of EW as a function of the two factors, current intensity and pulse time, while duty cycle remains constant at its central value. As can be observed in
Figure 4a, the highest values of EW are reached with the lowest values of both, current intensity and pulse time (2 A and 25 µs). However, with negative polarity, the maximum EW is obtained by combining low current intensity values and high pulse time values (2 A and 100 µs), as shown
Figure 4b.
With positive polarity, the electrons strike the electrode surface by removing material from it. Due to their light weight, they accelerate from the workpiece and hit the electrode surface, removing much material [
28]. The more discharges are produced (short pulse duration), the greater the number of electrons that are able to hit the electrode surface and, consequently, the higher its wear. However, in the case of negative polarity, the cations impact on the electrode. In this case, due to their greater mass, they make an impact on the electrode surface with less force, so they need a longer time to wear down the material.
4.3. Results and Analysis of SR
As was previously mentioned, surface roughness is characterized by the amplitude parameter
Ra due to its extensive use and importance in industry.
Table 7 and
Table 8 represent the ANOVA tables for the
Ra models for both polarities. As can be observed, for the positive polarity, it can be deduced that the process parameters, current intensity, pulse time, the quadratic effect of current intensity and, finally, the interaction effect between current intensity and pulse time are more significant than any other process parameters on
Ra. These factors, as well as the quadratic effect of pulse time, are also significant for
Ra when negative polarity is selected.
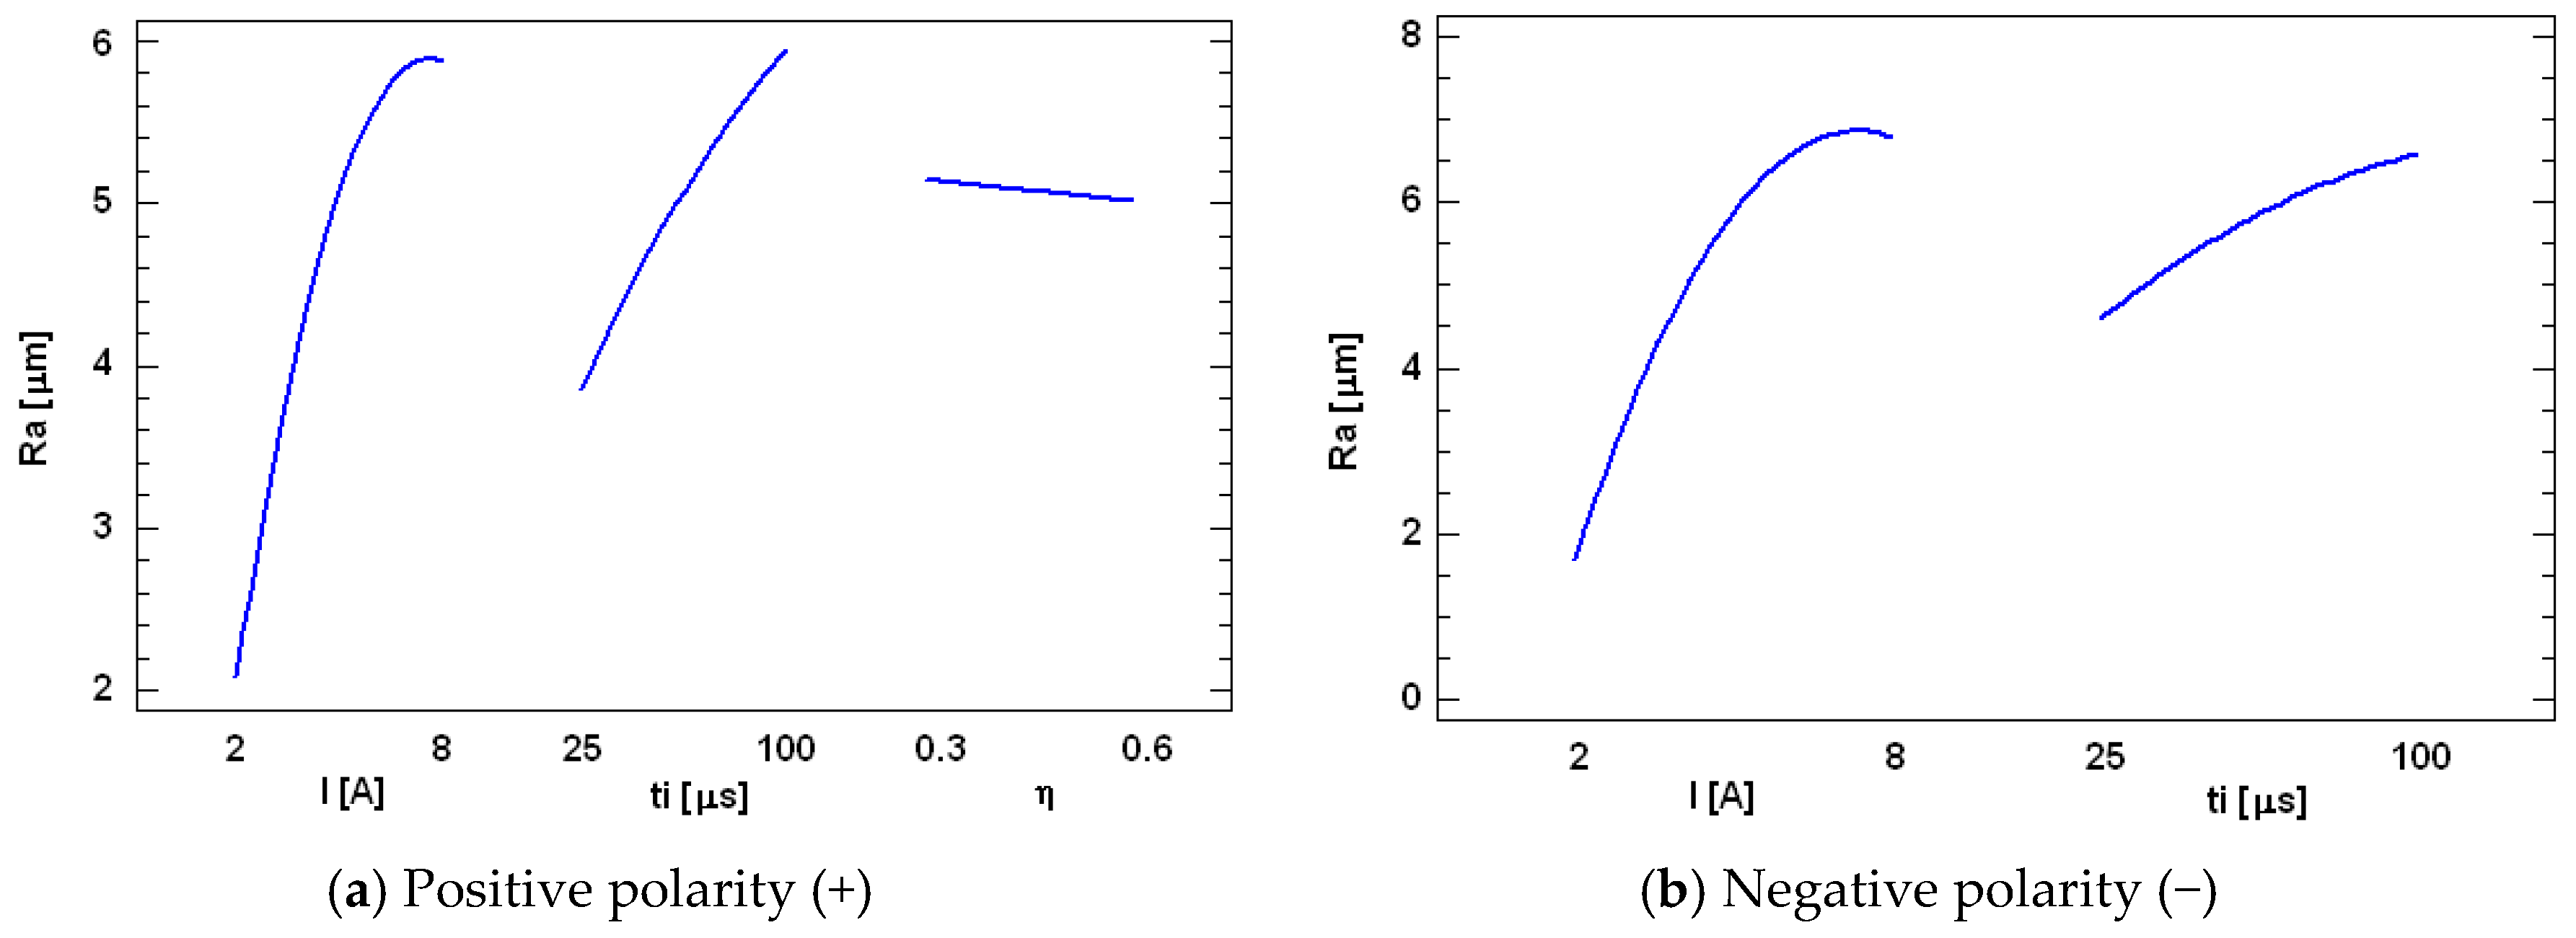
Figure 5 depicts the main effects plot for
Ra. As can be seen, the current intensity and the pulse time are the most influential factors on
Ra for both polarities. Besides, surface roughness becomes better and smoother when numerous electric sparks at low energy and short duration are applied. Under these conditions, small cavities that are homogeneously distributed on the surface are produced. This fact can be clearly observed in the experiments E33 (2 A and 25 µs), for the positive polarity, and E21 (2 A and 50 µs), for the negative polarity. These experiments had the minimum
Ra values, which were 1.17 µm and 1.28 µm, respectively.
On the other hand, by increasing both parameters, sparks become more energetic and affect the surface over a longer period, leading to greater and deeper craters. In this case, the maximum Ra values were 7.41 µm and 8.33 µm, which correspond to the experiments E16 (8 A and 100 µs) and E48 (8 A and 100 µs), for positive and negative polarities, respectively.
These results agree closely with those obtained for MRR, where 0.2650 mm3/min and 0.4136 mm3/min are the material removal rates obtained from the experiments E33 (positive polarity) and E21 (negative polarity), and 10.0405 mm3/min and 23.8906 mm3/min from E16 (positive polarity) and E48 (negative polarity).
Furthermore, from these results, and as shown in
Figure 5, higher surface roughness values are obtained when negative polarity is selected.
In addition, surface roughness results have been compared to those obtained with graphite [
14] and copper [
13] electrodes. In general terms, it can be seen that, under similar energy conditions (
I,
ti, η) and polarity, the copper-graphite electrode produces a slightly rougher surface compared to that obtained by the graphite electrode. This indicates that the addition of copper in the electrode leads to a greater melting of the workpiece material and, consequently, to a worsening of the surface roughness.
In addition, it should be pointed out that in the case of the graphite electrode, lower values of pulse time can be selected, which result in the lowest values of surface roughness. This is the case of E1 (2 A, 5 µs and 0.4) whose minimum value of Ra was 0.94 µm. In the case of the copper electrode, minimum Ra was 1.11 µm, and it was reached at 2 A and 50 µs.
Hence, with positive polarity, the values of
R2 and
R2adj are 96.56% and 96.13%, indicating that the model is good enough to characterize the relation between
Ra and the EDM parameters. Meanwhile, with negative polarity,
R2 and
R2adj are 96.06% and 95.72%. The equations of the adjusted models for the
Ra variable are those shown in Equations (15) and (16).
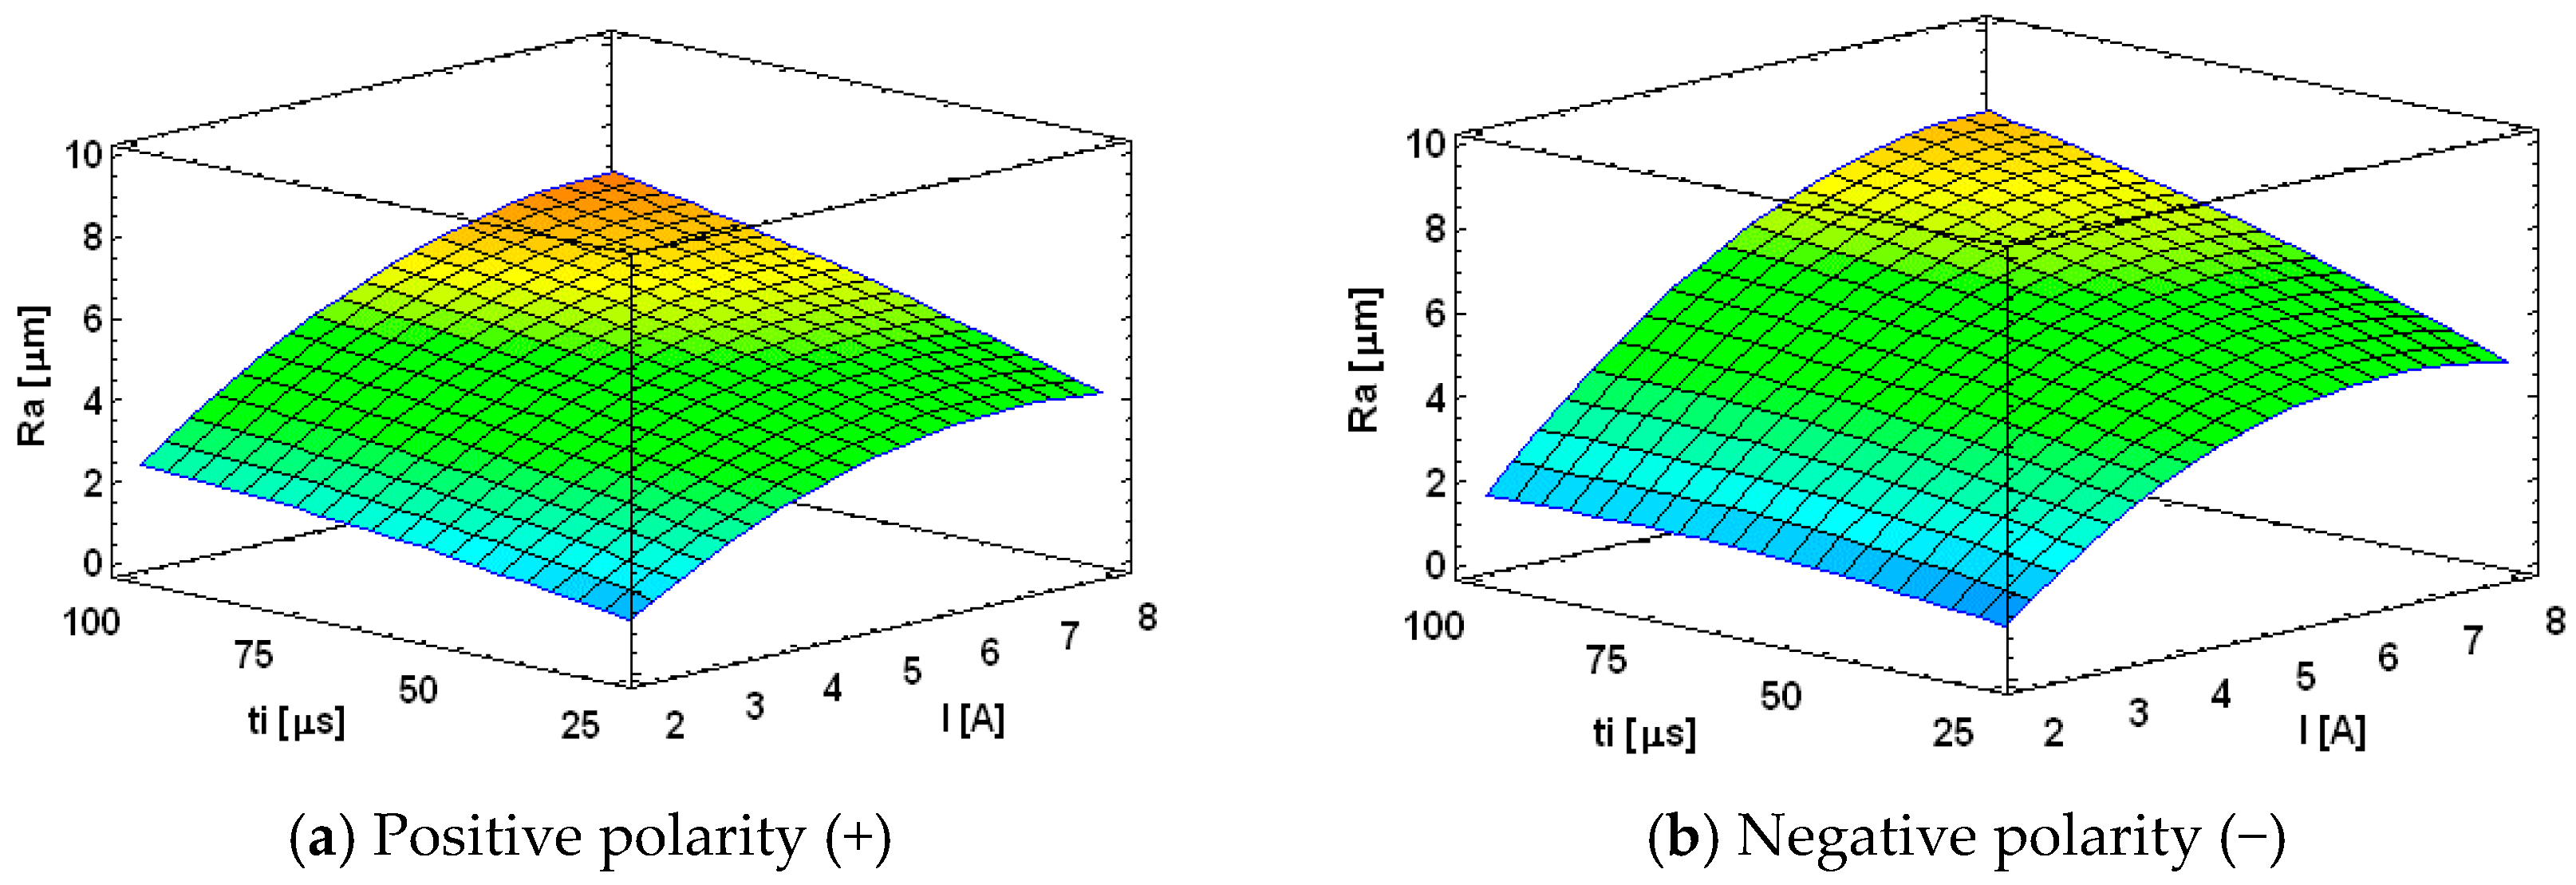
Figure 6 illustrates the estimated response surface of
Ra versus current intensity and pulse time. As shown, with both polarities, there is a tendency for
Ra to increase as the current intensity is increased up to a point, situated approximately at 5 A, after which it starts to slightly decrease. In addition, this increase is more pronounced at high values of pulse time (100 µs), due to the existence of an interaction effect between current intensity and pulse time.
4.4. Results and Analysis of ρE
The following sub-section analyzes the energy density results obtained for each of the response variables and for both polarities. To do so, first, the behavior of the total energy density versus MRR, EW and Ra parameter is studied. Secondly, the ratio of energy density on the workpiece and on the electrode is analyzed.
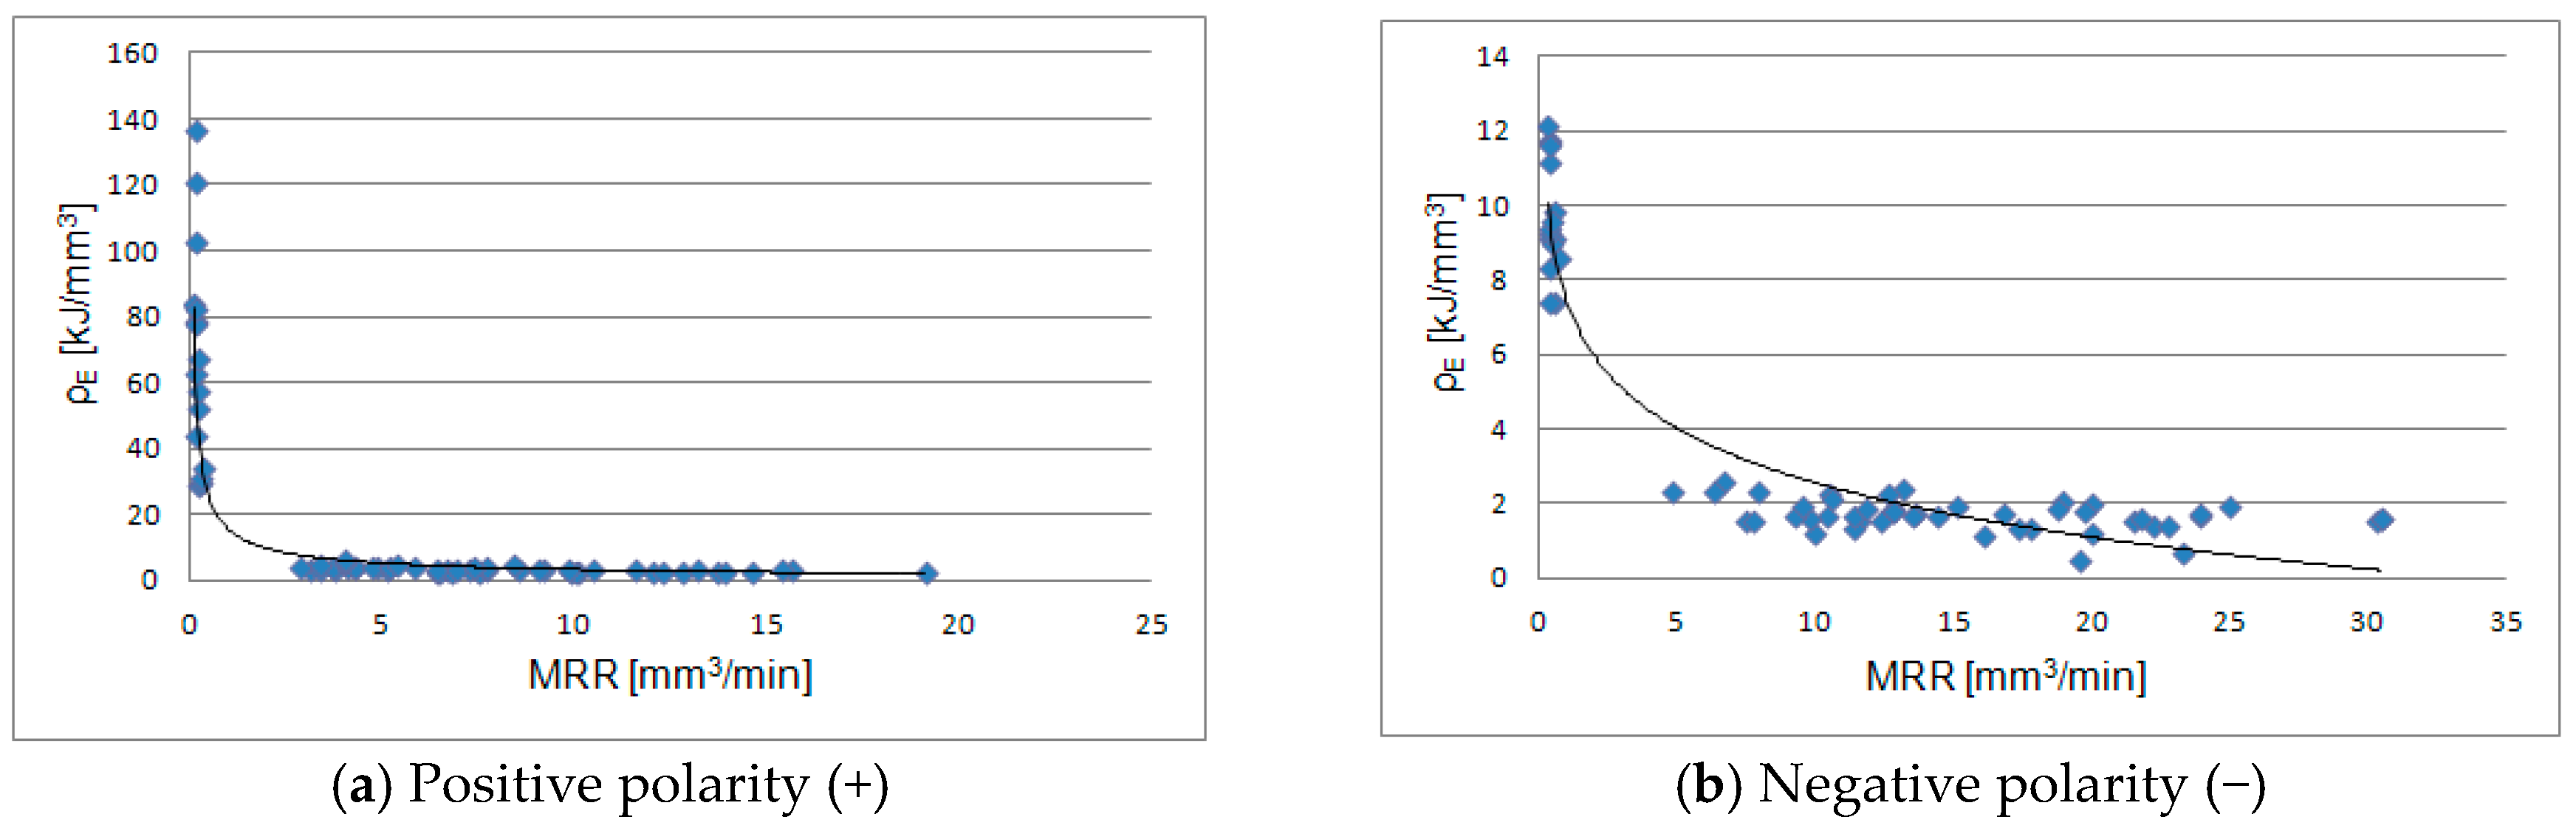
Figure 7 shows the values of ρ
E depending on MRR and for both polarities. As can be observed, in both cases, the value of ρ
E tends to decrease significantly with an increase in material removal rate. That is to say, a smaller amount of energy is required when the volume of material removed is greater. With positive polarity, the lowest values of energy density are around 2 kJ/mm
3–5 kJ/mm
3, and the material removal rates vary from 2.5 mm
3/min–18 mm
3/min. However, for energy density values between 30 kJ/mm
3 and 140 kJ/mm
3, the removal rate values drop drastically to values close to 1 mm
3/min.
Furthermore, according to
Figure 7a and the experimental results, it is seen that all experiments performed with a current intensity value of 2 A are the ones that have obtained the highest values of ρ
E, where these values are also much higher than those obtained with other current intensities values. For example, with positive polarity, the maximum ρ
E values were 136.86 kJ/mm
3 and 121.14 kJ/mm
3 which correspond to the experiments E61 (2 A, 100 µs, 0.6) and E41 (2 A, 100 µs, 0.5), respectively. However, the minimum ρ
E values were obtained in experiments E16 (8 A, 100 µs, 0.4) and E4 (8 A, 25 µs, 0.4), whose ρ
E values were 3.28 kJ/mm
3 and 3.39 kJ/mm
3. A priori, this is the expected result since, as indicated earlier, the lower the energy of the sparks, the less material removed and, thus, the higher the energy density in the workpiece. This tendency also occurs with negative polarity, as can be seen in
Figure 7b.
Furthermore, as can be observed in
Figure 7a, the highest values of ρ
E are obtained in the case of positive polarity, where these values are 11.6-times higher than those obtained with negative polarity. This result is in line with the lower MRR obtained with this polarity and can be attributed to the fact that, in rough conditions, the main goal is to remove as much material as possible in the shortest time. Therefore, the EDM parameters are programmed to achieve the lowest possible power consumption and the highest performance process possible.
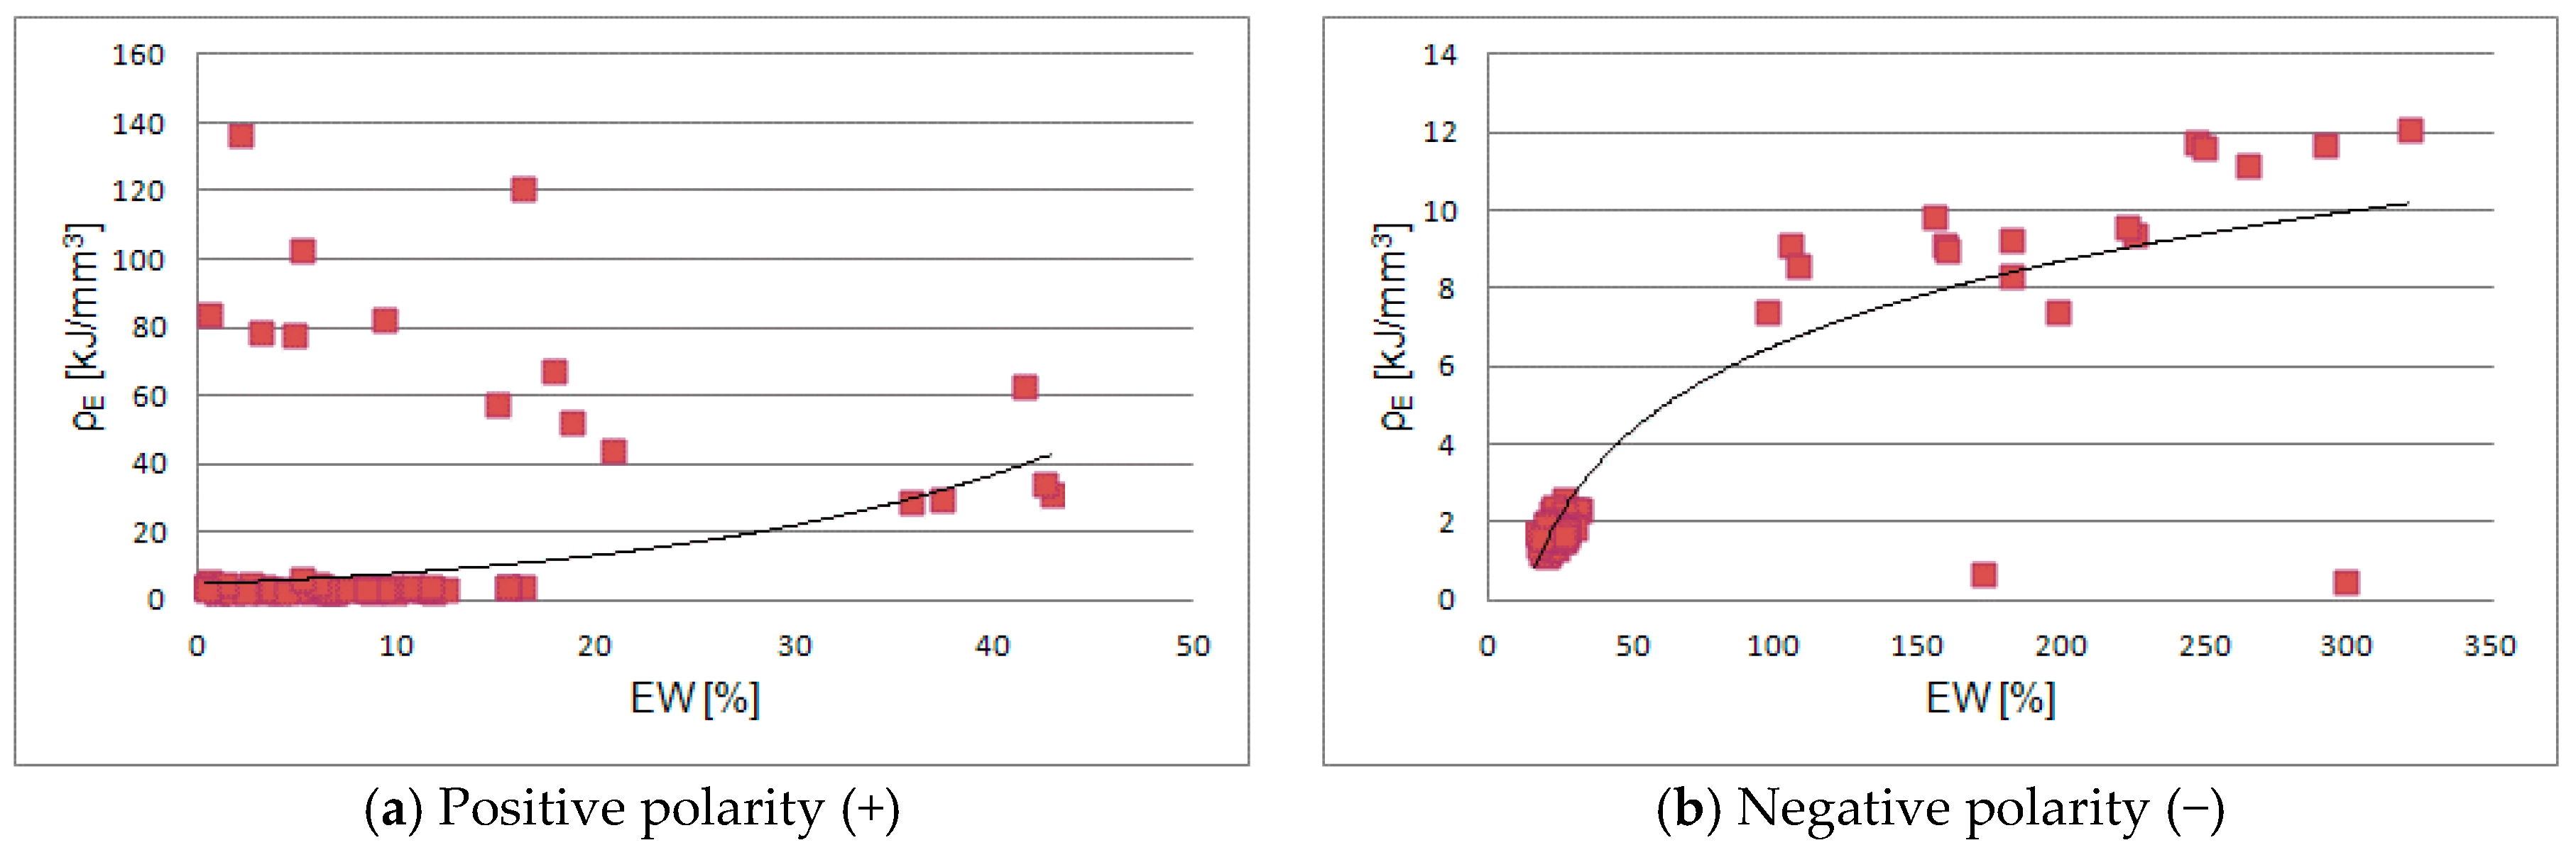
Figure 8 depicts the energy density versus EW for both polarities. As can be seen in
Figure 8b, the value of ρ
E tends to increase slightly when the electrode wear increases. This result agrees with that obtained in
Figure 7b. When the material rate from the workpiece is very low, the electrode wear tends to be very high due to an increase in the melting on it. Consequently, the energy invested in melting the electrode is, comparatively, greater than that of the workpiece. This fact can be observed in experiments E45 and E61 whose MRR and EW values were as follows: MRR
(E45) = 0.2949 mm
3/min, EW
(E45) = 263.47%, MRR
(E61) = 0.2823 mm
3/min, EW
(E61) = 320.70%.
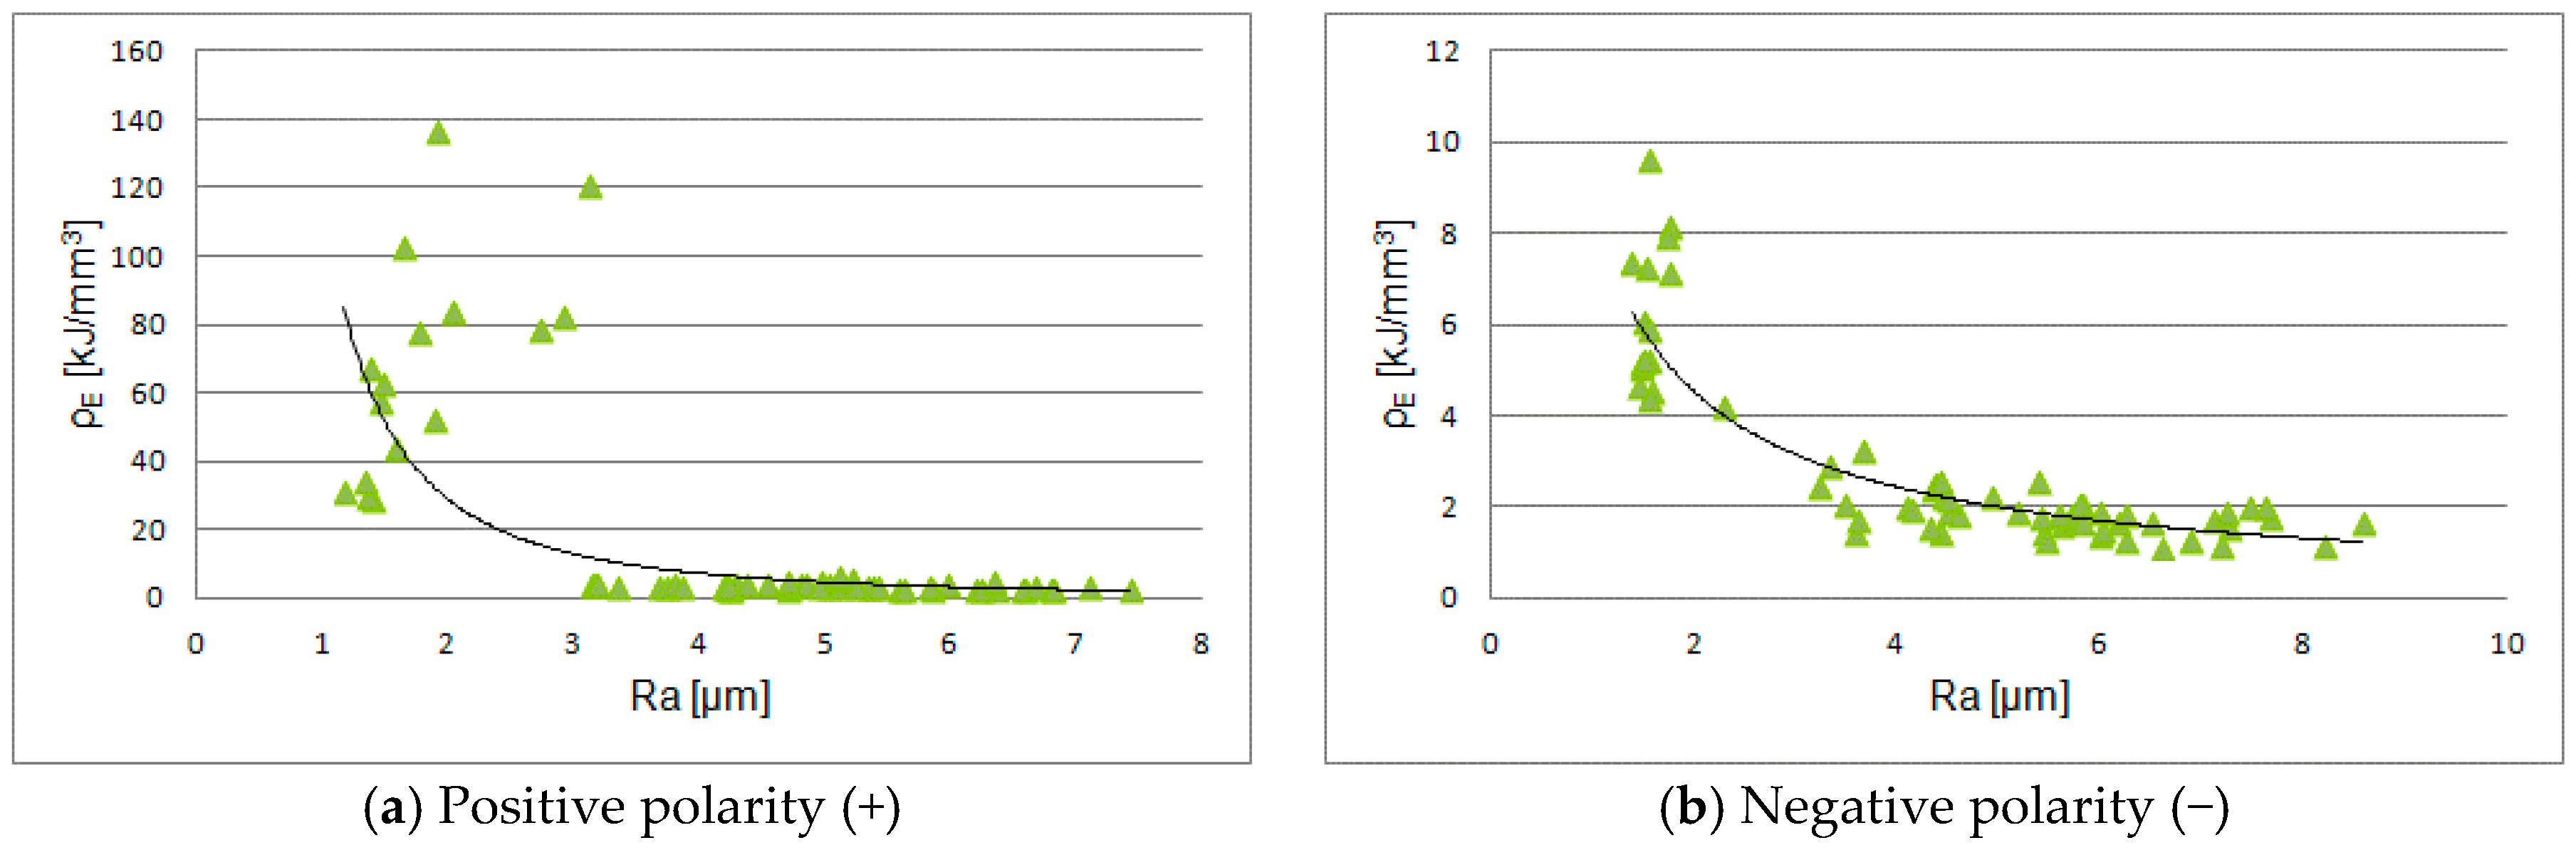
Regarding the behavior of ρ
E with respect to the
Ra parameter, it can be observed from
Figure 9 that energy density increases if surface roughness increases. In finishing stages, the main aim is to get a good surface roughness and an electrode wear as low as possible (in this kind of processes, it is often very high). To do this, much energy is invested in getting a low rate of material wear that results in a homogeneous and smooth surface. In this case, the time spent is very high, and the energy density is high because the material wear rate from the workpiece in relation to the total volume is low. For instance, in the case of positive polarity, ρ
E in the minimum
Ra (1.17 µm) was 11.2-times lower than that obtained in the maximum
Ra (7.41 µm). In the first case, the machining time was 180 min, whereas in the second case, it was 14 min.
With regard to negative polarity, the tendency is the same, where ρE in the minimum Ra (1.28 µm) is 5.2-times lower than that obtained in the maximum Ra (8.33 µm). In the first case, the machining time was 119 min, while in the second case, it was only 5 min.
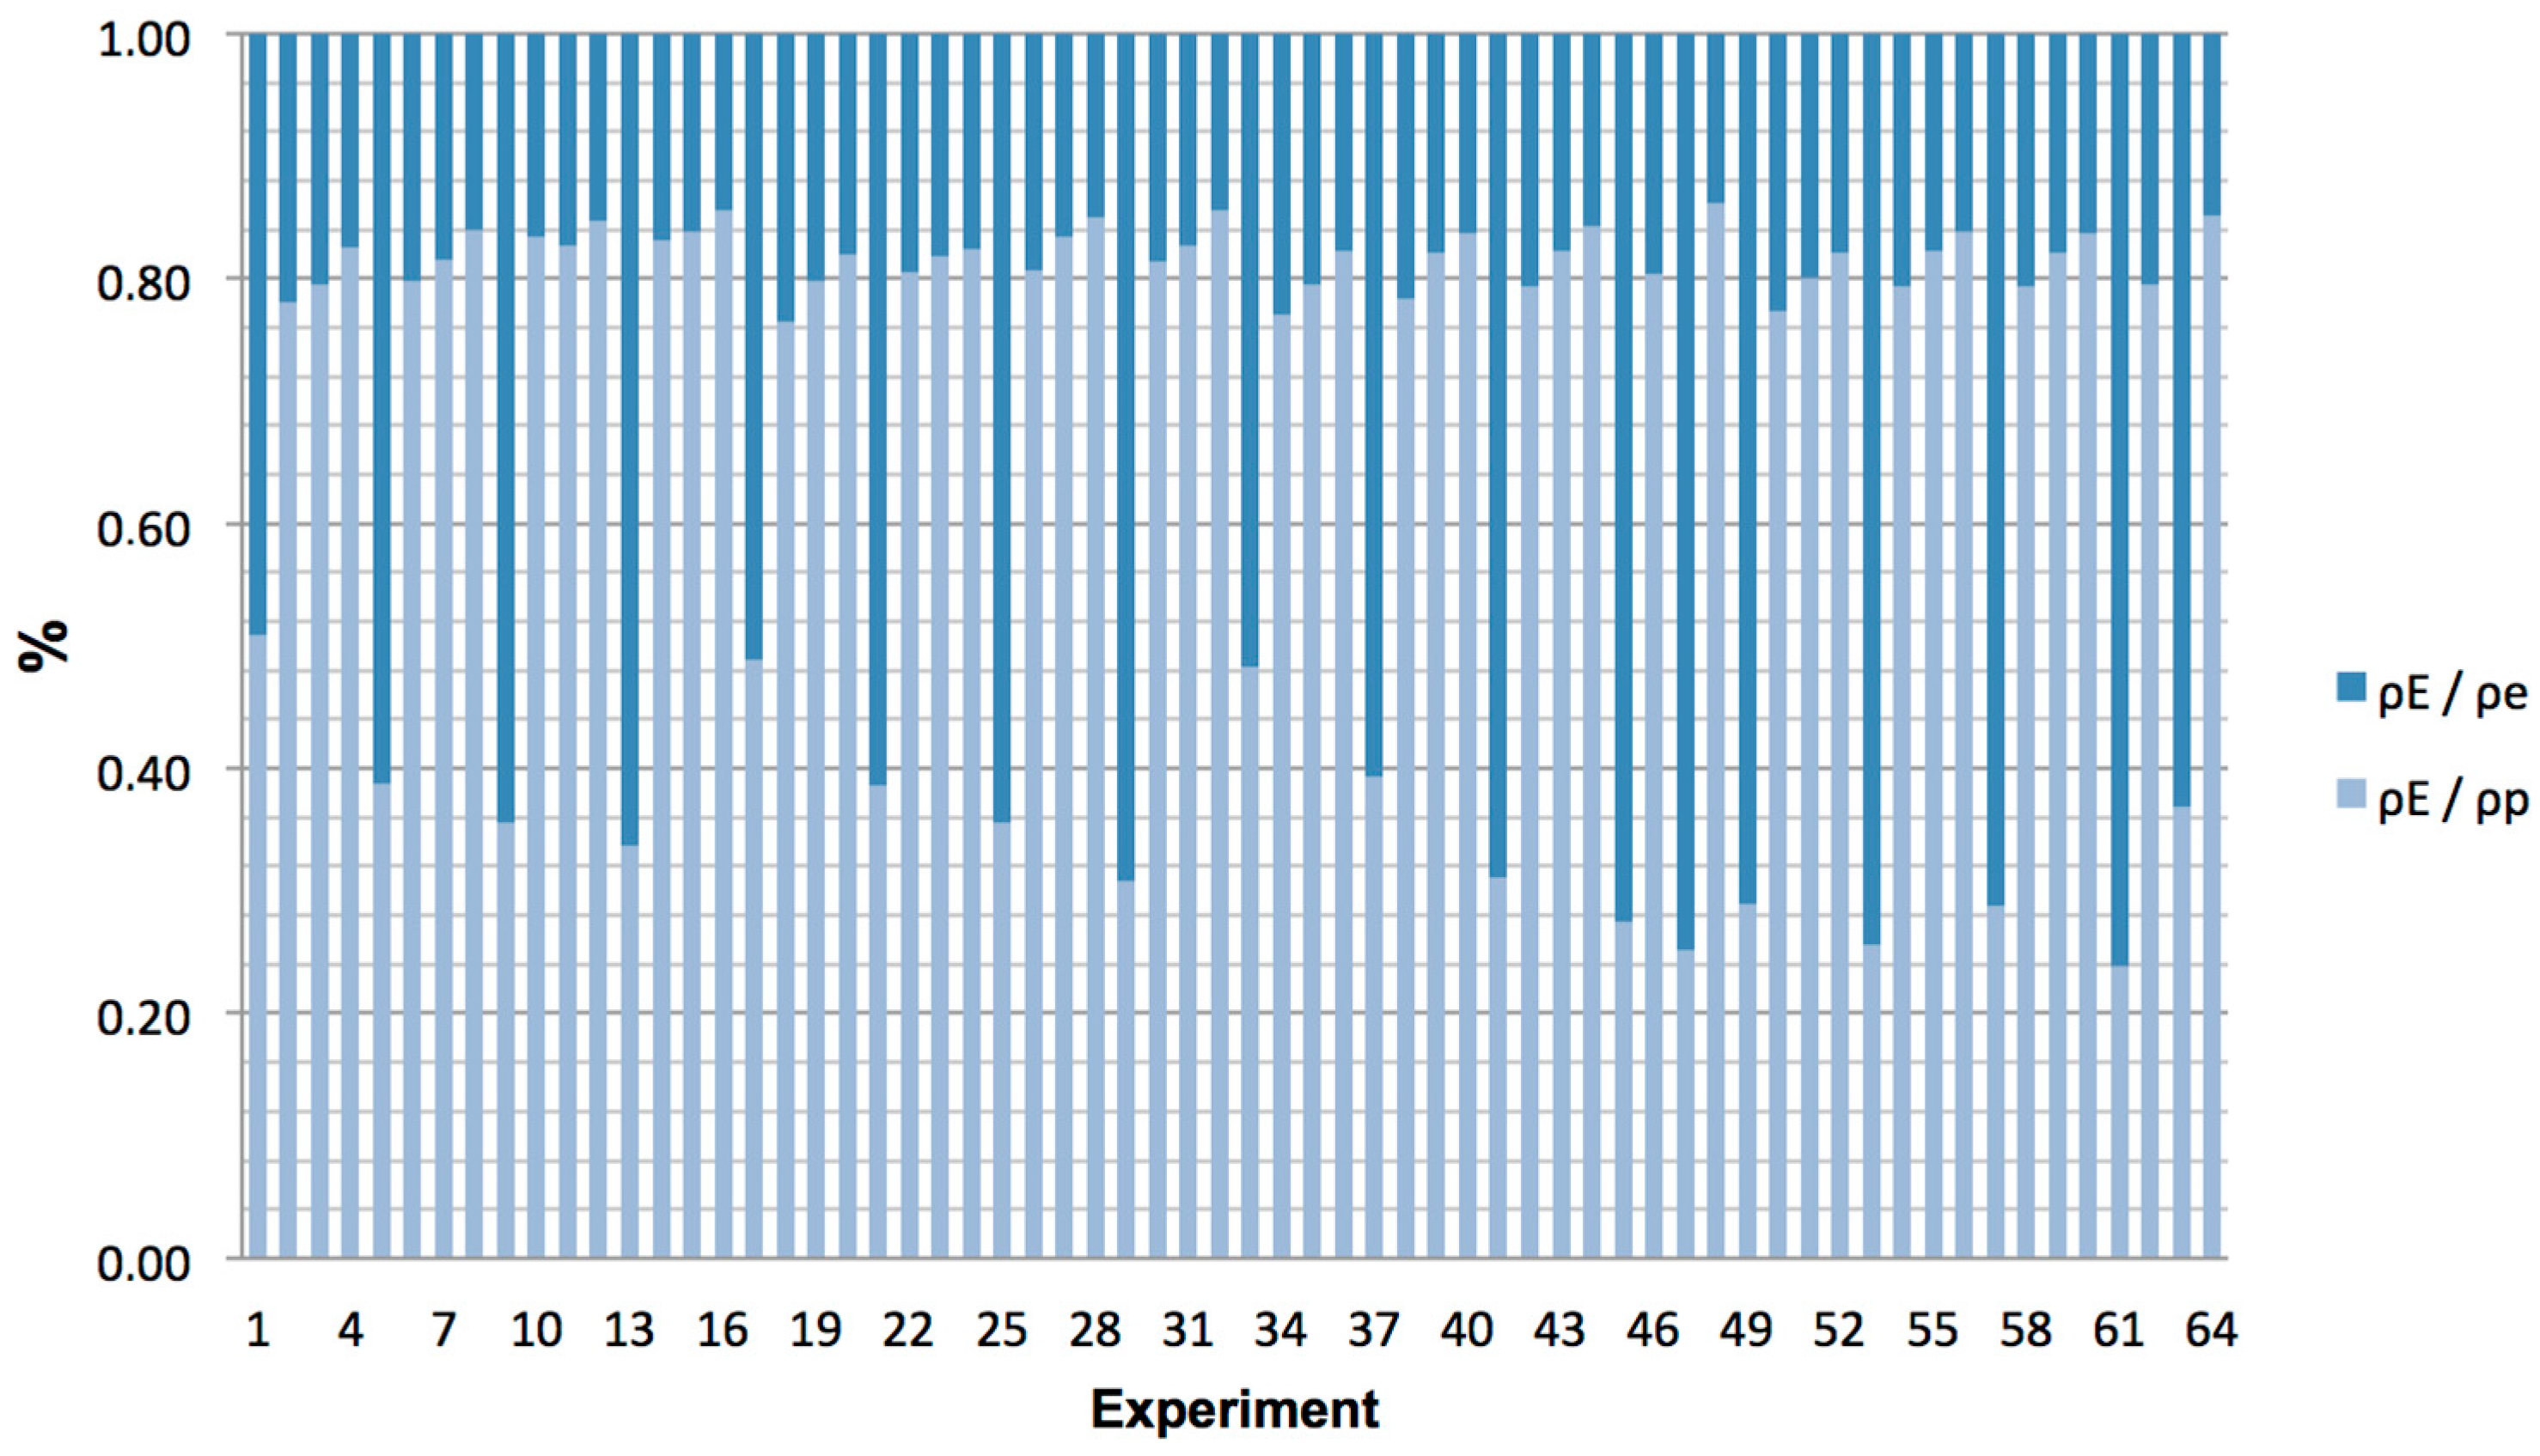
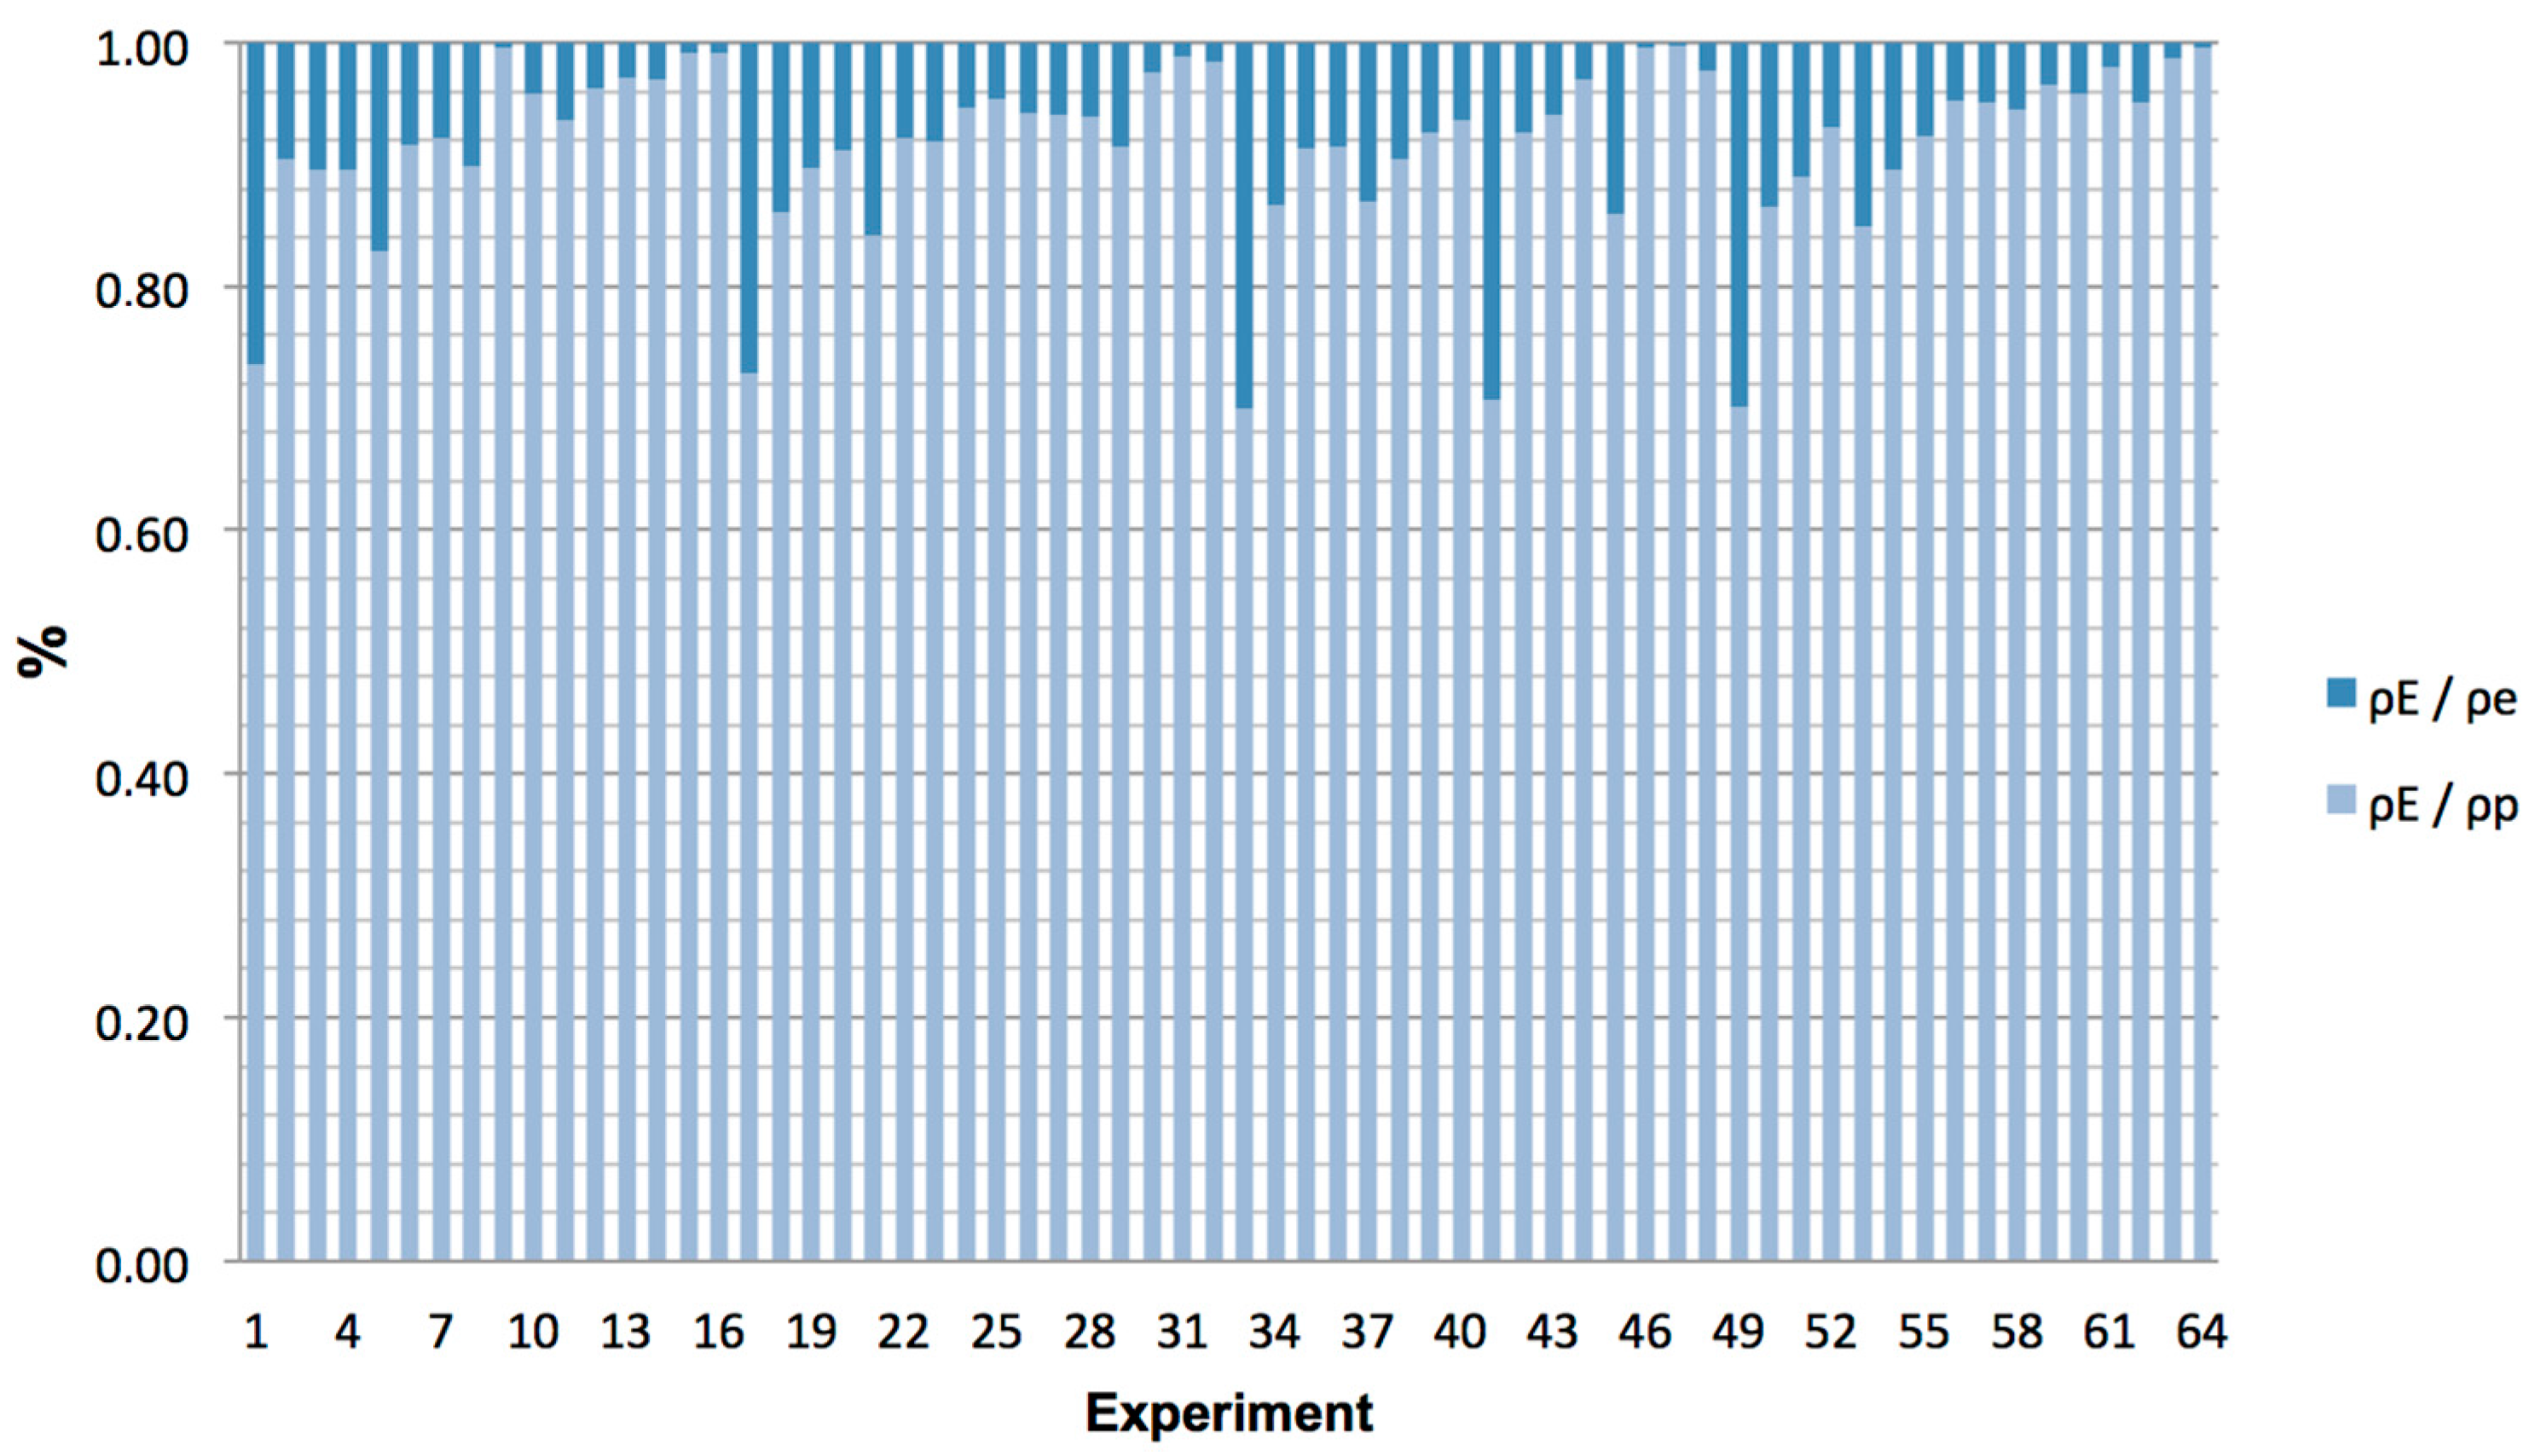
Figure 10 and
Figure 11 represent, for each of the experiments and for positive and negative polarities, respectively, the energy density ratio of the workpiece (ρ
E/ρ
p) and of the electrode (ρ
E/ρ
e). From these figures, it can be clearly appreciated that experiments carried out with negative polarity present a higher energy density ratio in the electrode compared to their counterparts with positive polarity. For example, in the case of E66 (maximum MRR), ρ
E/ρ
p was 3.88-times higher with negative polarity than with positive polarity, whereas for E33 (minimum
Ra), ρ
E/ρ
p was 1.72-times.
In addition, it should be noted that the experiments performed at 2 A get the highest values of energy density in the electrode, whatever the polarity. As has been pointed out before, this is due to the lower energy of the sparks that are not able to remove much material from the workpiece and to the low energy density of the process. As an example, this fact can be observed in experiments E1 and E4 whose ρE/ρp values for positive polarity were as follows: ρE/ρp(E1) = 0.2637 and ρE/ρp(E4) = 0.1718; and for negative polarity: ρE/ρp(E1) = 0.4915 and ρE/ρp(E4) = 0.6128.
4.5. SEM Analysis
In this subsection, the resulting surfaces after the EDM process are analyzed by using scanning electron microscopy (SEM). To do that, the experiments that have obtained the minimum and maximum Ra values have been selected. All SEM imaging and EDX analyses were conducted using a low vacuum SEM with a resolution of 3 nm. Moreover, an accelerating voltage of 20 kV and a working distance of 10 mm were used.
The EDM’ed surfaces, at different magnifications, are shown from
Figure 12,
Figure 13 and
Figure 14. In general terms, it can be appreciated that all surfaces show a matte appearance, covered by small overlapping craters, debris particles that are re-solidified after the discharge and irregularities formed by entrapped gases escaping from the re-solidifying material [
37]. Furthermore, the number, size and depth of these craters depend on the conditions selected in each of the experiments, as detailed below.
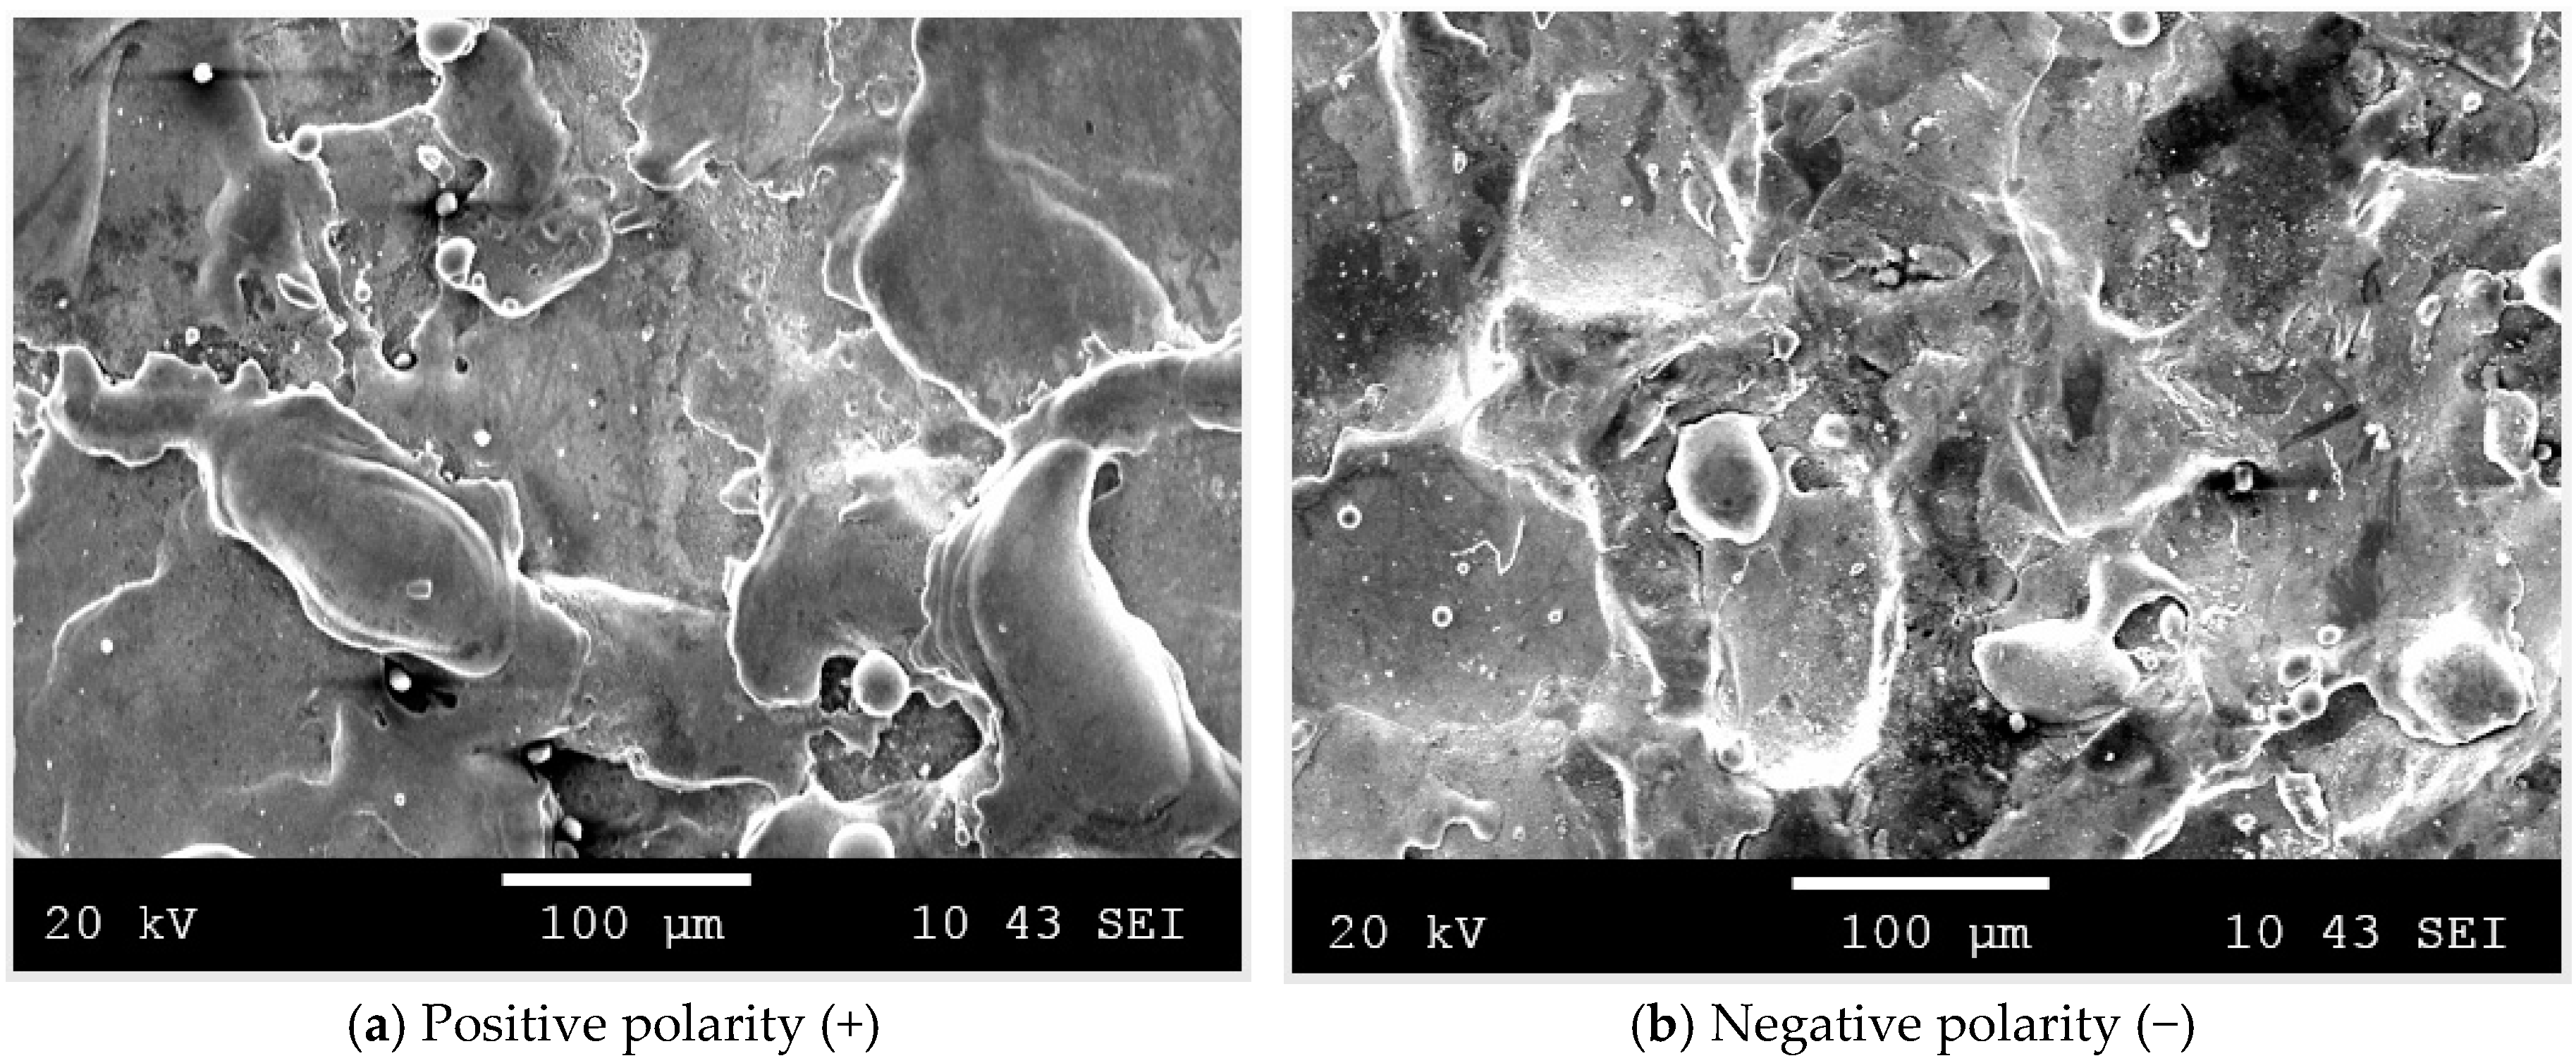
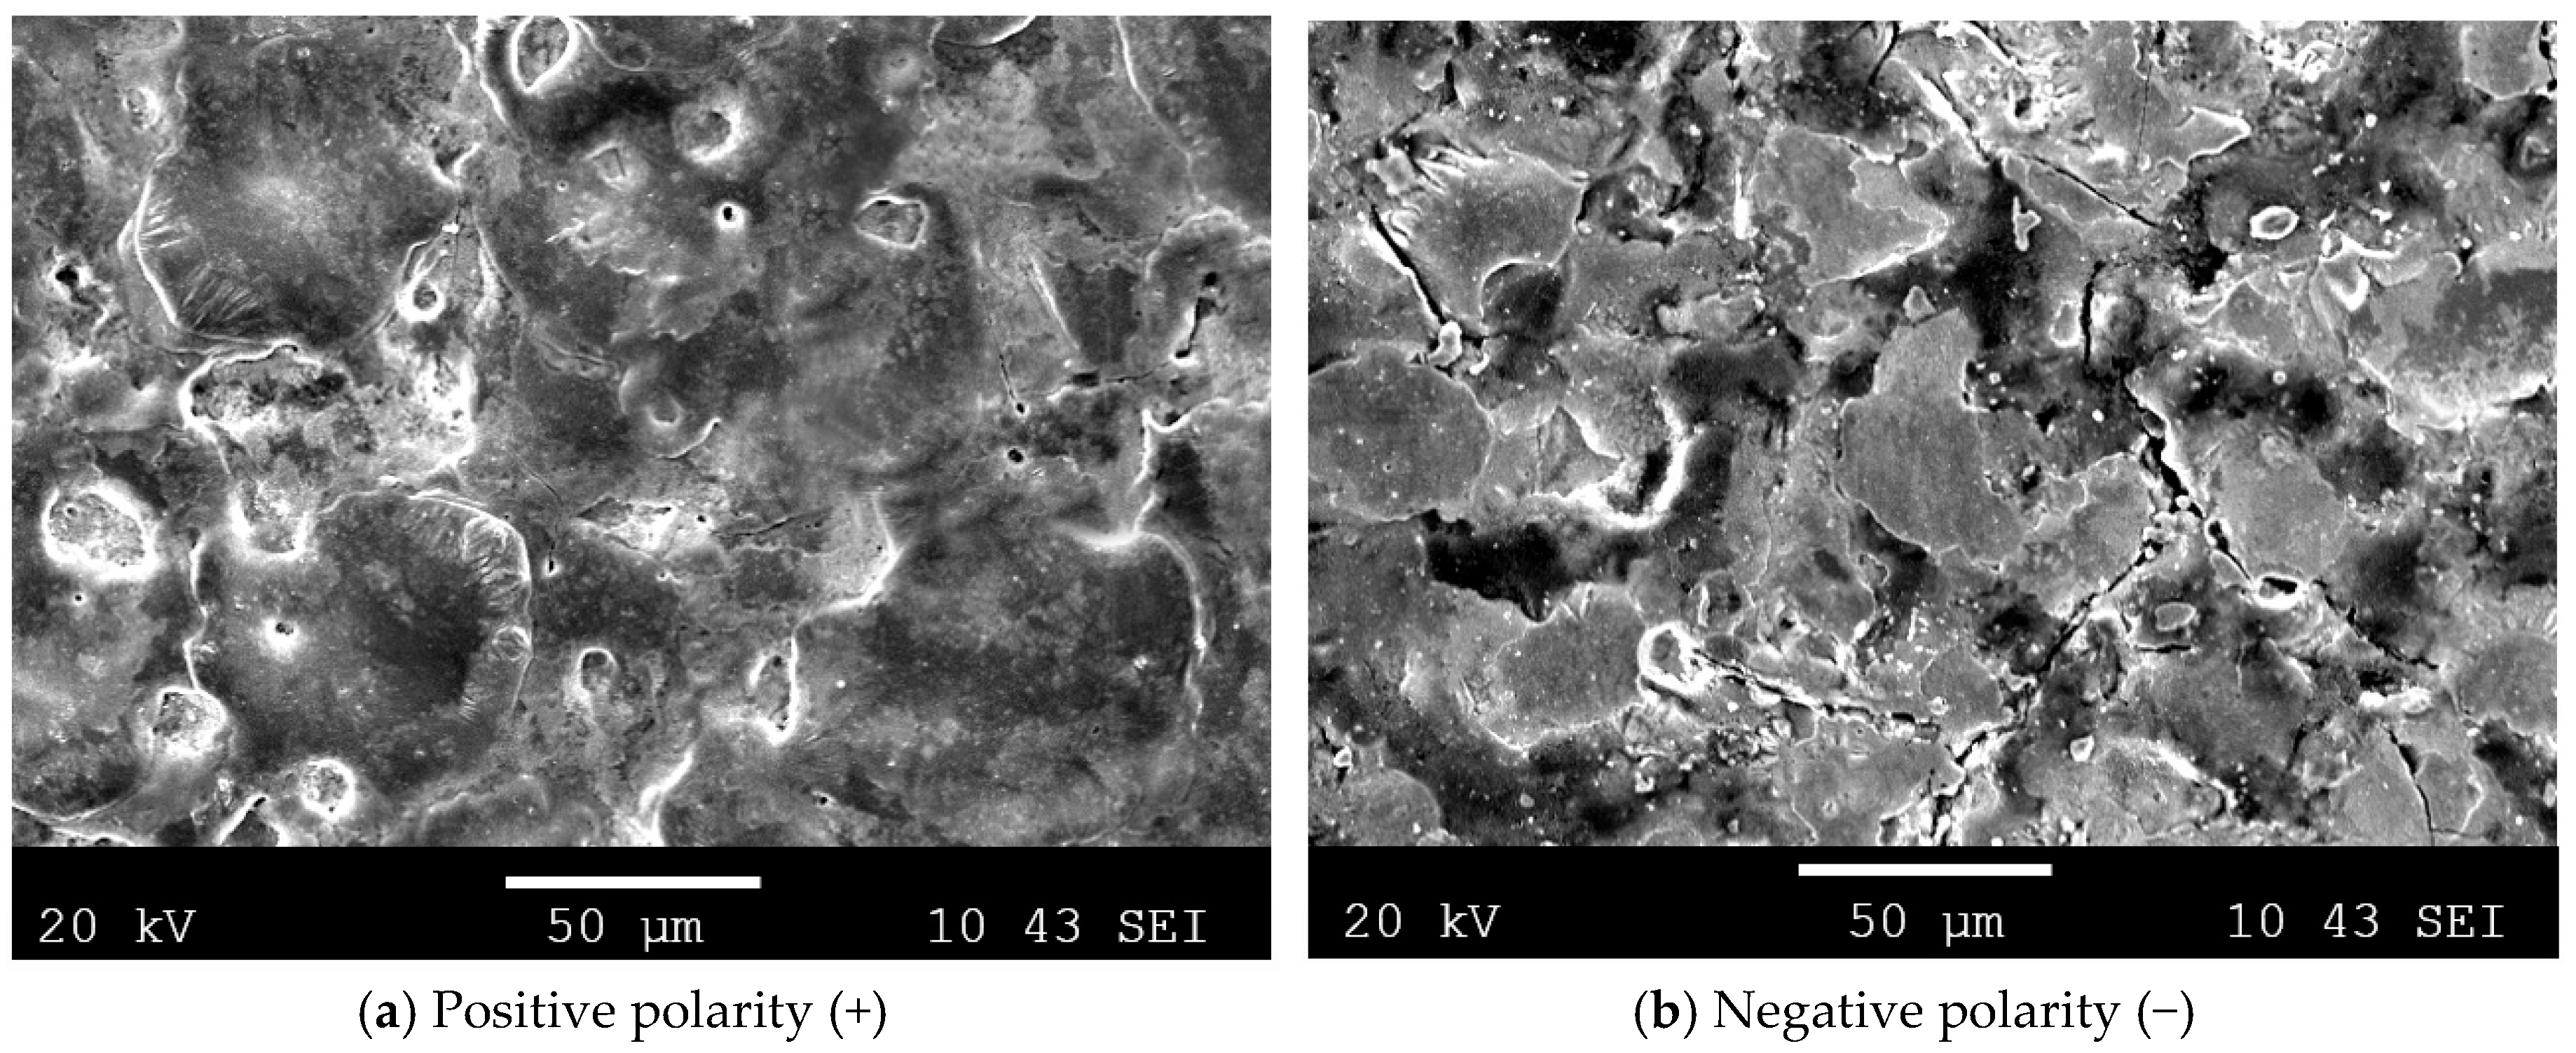
As is depicted in
Figure 12a, which shows the micrograph of the experiment with the lowest value of
Ra (1.17 µm) and positive polarity, the EDM’ed surface has a flat and uniform appearance. Furthermore, small defects, such as pores and micro-cracks, may be seen, resulting from the contractions during the EDM process. However, the fissures are superficial and are found around the folds of the re-solidified material.
With regard to negative polarity, in spite of having a similar
Ra value, the surface is more damaged and is full of deeper cracks, as can be observed in
Figure 12b. These cracks are no longer around the grain boundaries, but they cross, which makes their presence in the material more dangerous and undesirable.
Moreover,
Figure 13 shows the EDM’ed surface with the highest values of
Ra for both polarities (
Ra(a) = 7.41 µm and
Ra(b) = 8.33 µm). As shown, with positive polarity, the resulting surface is fairly homogeneous, and the amount of molten material is, in this case, much higher than that obtained for the minimum
Ra case. This is because the pulse time has increased to 100 µs, which causes a decrease in the frequency of the pulses and, also, because of the more energetic sparks as a consequence of increasing the current intensity to 8 A. These data are in line with the high material removal rate reached in these experiments: MRR
(a) = 10.0405 mm
3/min and MRR
(b) = 23.8909 mm
3/min.
With regard to surfaces subjected to negative polarity, as shown in
Figure 13b, the surface appearance is rougher than that obtained with positive polarity. However, it should be noted that, after analyzing the surface with lower value of
Ra, the surface is not as damaged as one would expect a priori. In this case, as discussed above, the presence of large cracks is very evident throughout the surface. Therefore, it can be concluded that, for the selected materials (Inconel
®600 workpiece-Cu-C electrode) and negative polarity, lower pulse time (25 µs) values lead to the appearance of large cracks on the surface, while longer pulse time (100 µs) values produce a higher melting of the workpiece, and the resulting surface has larger and deeper craters.
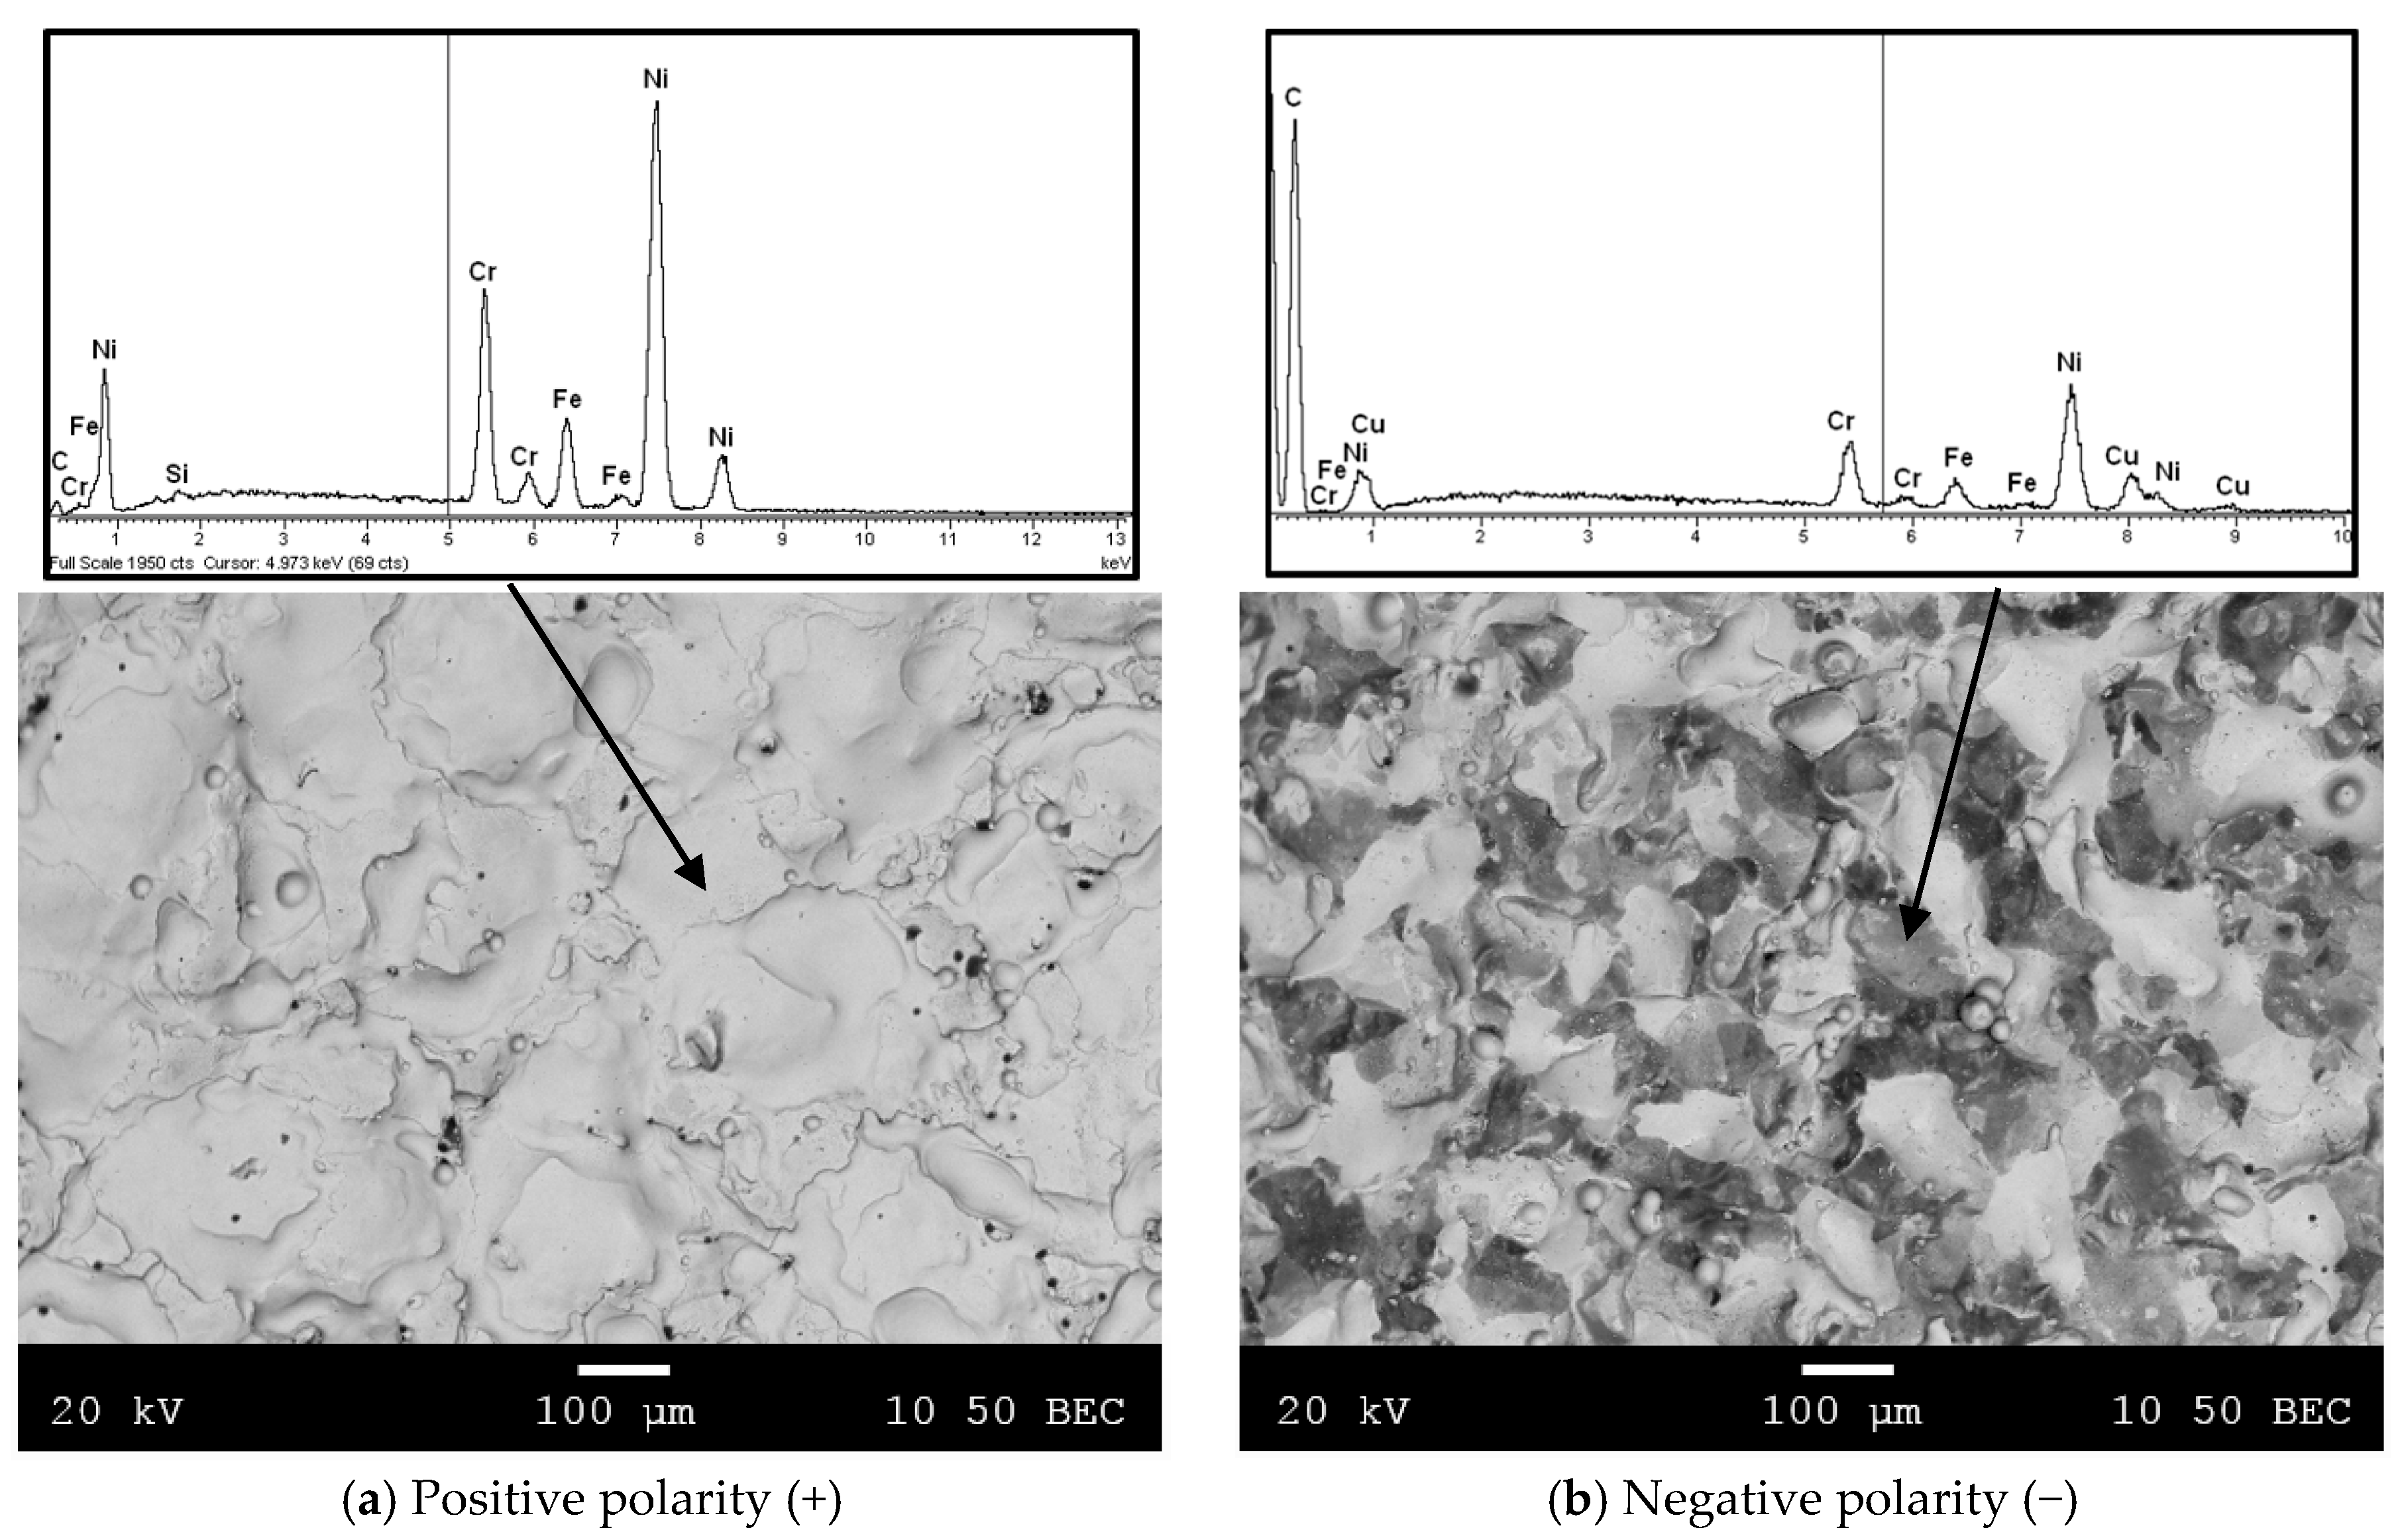
As is depicted in
Figure 14b, EDX spectra of this surface exhibit carbon enrichment to a remarkable extent as compared to the positive case. This increase in carbon content is due to the consequence of the pyrolysis of dielectric fluid during the EDM process [
38]. Additionally, the presence of some copper material can be appreciated in
Figure 14b. Both copper and carbon seem like spots adhered to the workpiece surface. In fact, it is the carbon itself that traps copper particles and causes their adhesion to the surface of the Inconel
®600 workpiece. These results agree, on the one hand, with those obtained for EW in which the greatest wear was found in negative polarity and, on the other hand, with the results obtained in the EDM’ed of Inconel
®600 with the graphite electrode [
14].
However, as shown in
Figure 14a, the positive polarity surface has the same color, indicating that its composition is homogeneous, and it was the material of the workpiece itself that had re-solidified on it during the process.
5. Conclusions
From this present research work, the following conclusions can be drawn for the selected materials and the work intervals under consideration:
With regard to the material removal rate variable, higher MRR values correspond to those obtained with negative polarity. In this case, the maximum rate is 30.4894 mm3/min, while the maximum MRR with positive polarity is 19.1347 mm3/min. In both cases, the current intensity and the duty cycle values are the maximum values considered in this case study (8 A and 0.6, respectively). Furthermore, it can be observed that the use of the copper-graphite electrode and negative polarity leads to a higher removal rate than when using copper or graphite electrodes.
In the case of electrode wear, current intensity and pulse time are found to be the most influential factors on EW for both polarities. Besides, experiments subjected to positive polarity reached the lowest EW value, that is to say 0.30. The optimal conditions to obtain this value were: 6 A, 100 µs and 0.5, respectively, for the current intensity, pulse time and duty cycle. In addition, it can be found that with positive polarity, the electrode wear is much lower than that obtained with negative polarity.
Regarding surface roughness, the highest Ra value of 8.33 µm is obtained when negative polarity is employed. Furthermore, for both polarities, the most influential factors turn out to be the current intensity and the pulse time, causing a worsening of the surface if their values are increased. Therefore, surface finish is better when numerous sparks, at low energy and short duration, are applied. Experiment E33 (Ra = 1.17 µm), for positive polarity, and E21 (Ra = 1.28 µm), for negative polarity, are those that undergo lower Ra values. In both cases, the current intensity value was the minimum selected (2 A), and the pulse time value was low within the selected range for each polarity (25 µs and 50 µs). Moreover, it can be seen that, under similar energy conditions (I, ti, η) and polarity, the copper-graphite electrode produces a slightly rougher surface compared to that obtained by the graphite electrode.
Accordingly, a new energy density parameter is proposed. This new definition lets us quantify the energy density that absorbs the workpiece and the one that absorbs the electrode.
For positive and negative polarities, the experimental results show that the value of the total energy density of the process decreases with an increase in material removal rate and, thus, in the surface roughness.
It may also be noted that the experiments performed at 2 A obtain higher values of energy density than those at other current intensity values. With positive polarity, the maximum ρE value was 136.86 kJ/mm3 (2 A, 100 µs, 0.6), whereas the minimum ρE value was 3.28 kJ/mm3 (8 A, 100 µs, 0.4). In addition, it should be pointed out that the experiments carried out with negative polarity show a greater energy density distribution in the electrode compared to those carried out with positive polarity.


