2.1. Interface Energy
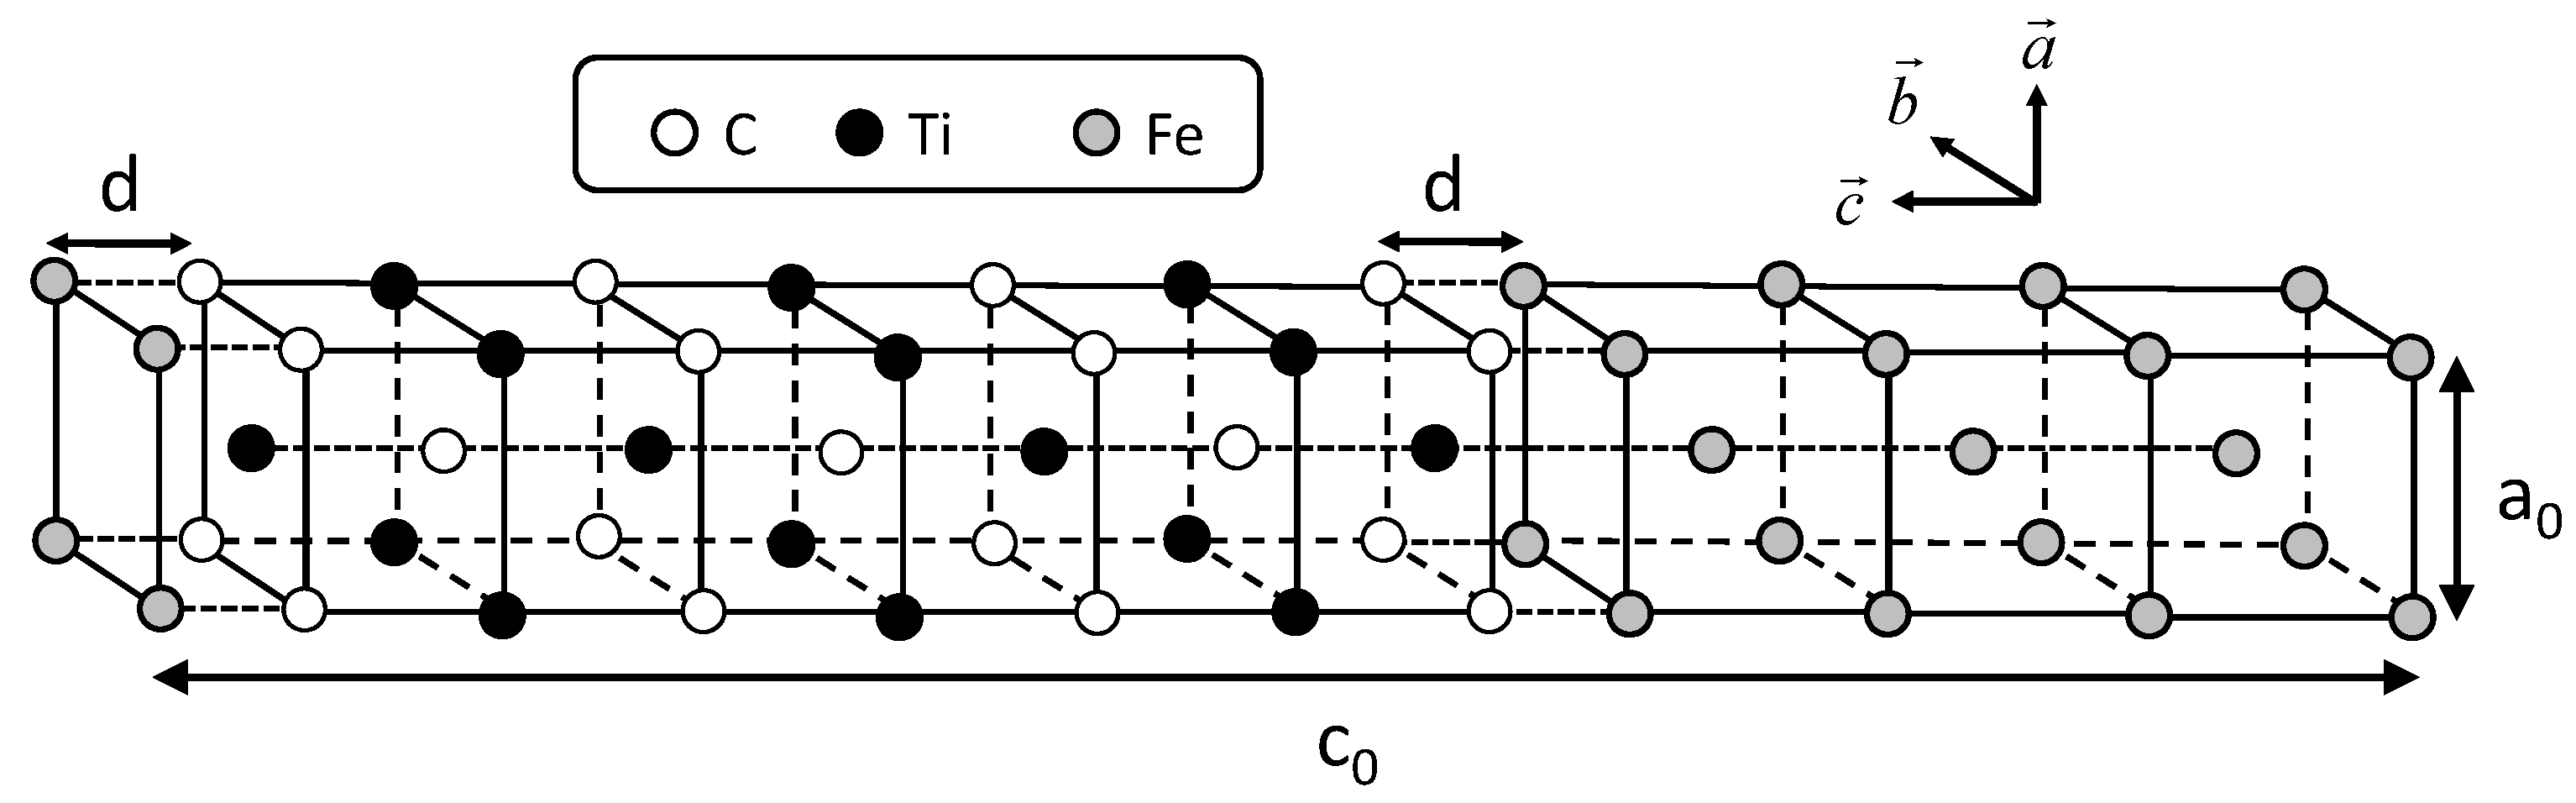
The conditions of calculating coherent interface energy, which include the shape of the unit cell shown in
Figure 1, are followed according to the previous study [
21]. Two cases of coherent interfaces are examined, as performed in the previous study. In these cases, the C atom is directly connected with the Fe atom across the interface and the Ti atom is connected with the Fe atom. The cases are hereafter referred to as the interfaces of Fe–C–Ti and Fe–Ti–C, respectively. The interface energies are calculated by subtracting the sum of the total energies of all the individual phases from the total energy of the system including the interface. The lattice parameter of the reference state of iron is chosen as follows in order to eliminate the contribution of strain energy in the estimation of the interface energy. The lattice parameter
is optimized to minimize the total energy with the
value fixed to the length of a unit cell of TiC. This procedure is conducted for both the coherent and semi-coherent interfaces. The lattice parameter
of iron for a coherent interface is
, while that for semi-coherent interface is
. In
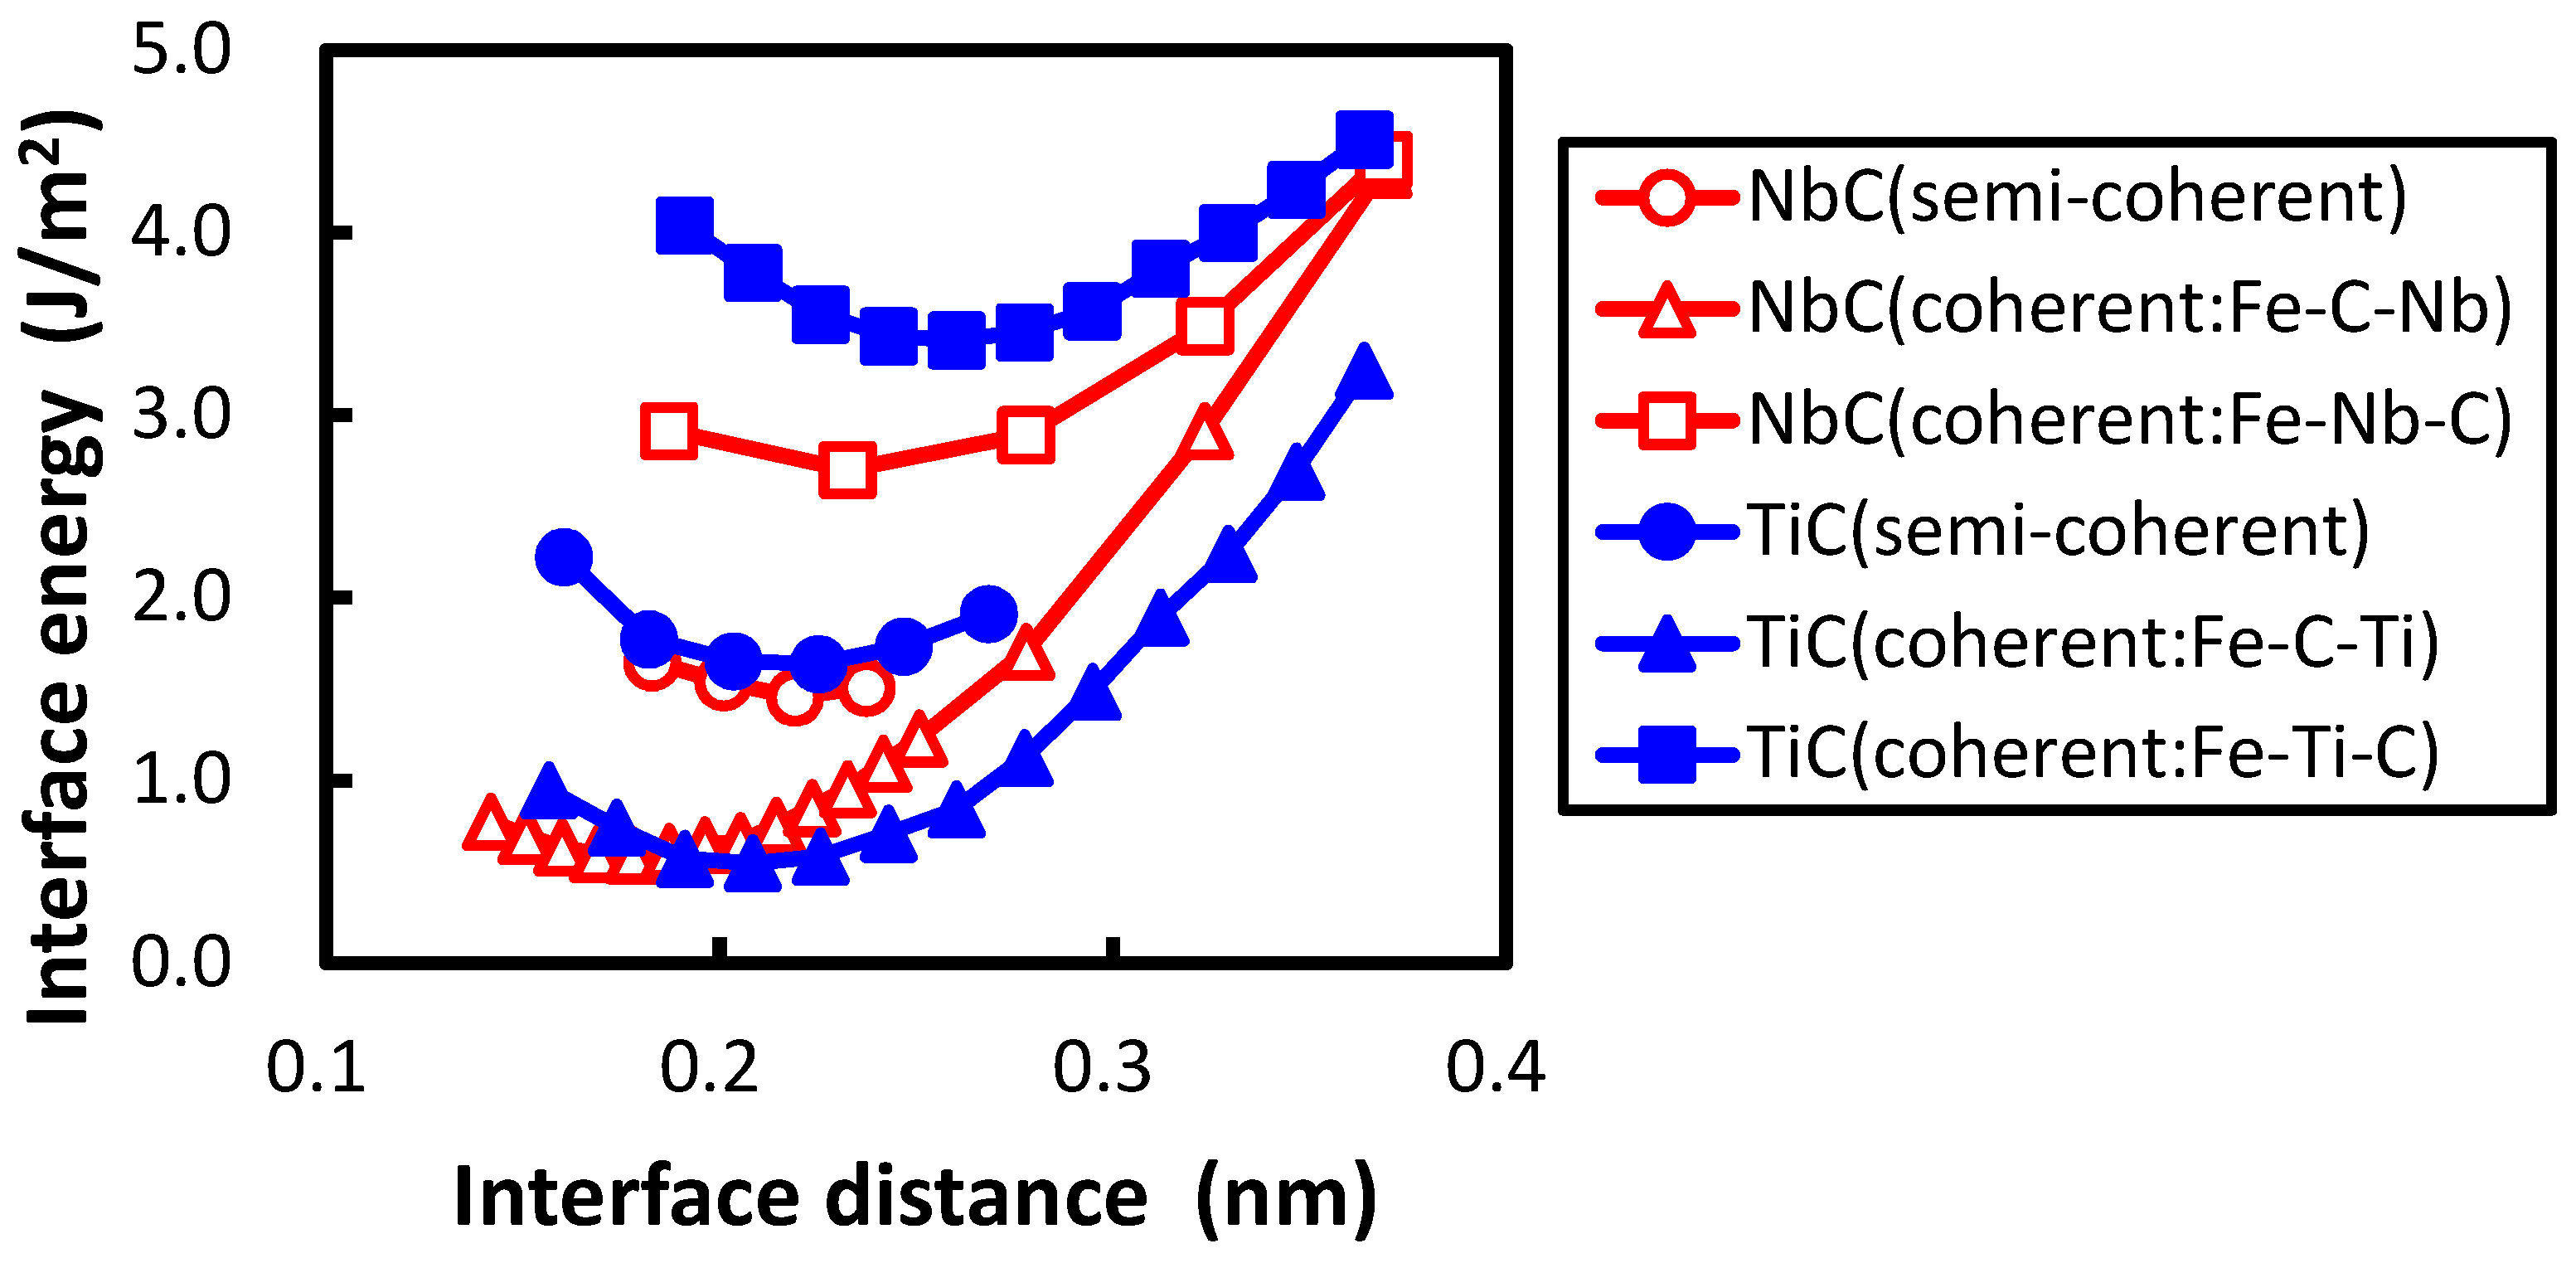
Figure 2, the calculated interface energies are shown with the previously obtained interface energies between the NbC and bcc iron. In the previous study, two coherent interfaces were treated. One is an interface where a C atom is connected with an Fe atom across the Fe–NbC interface; the other is one where a Nb atom is connected with an Fe atom across the Fe–NbC interface. These two interfaces are referred as Fe–C–Nb and Fe–Nb–C, respectively, in this paper. The horizontal and vertical axes denote the interface distance
d and interface energy, respectively. The interface distance is defined as the optimized length of
of
by subtracting the optimized lengths of
of Fe and TiC with
of TiC as follows:
The division operation in this expression is performed because of the inclusion of two interfaces in the unit cell. The interface of Fe–C–Ti is more stable than that of Fe–Ti–C. The same applies for the interface between NbC and bcc iron, which is explained as the energy of the atom at the interface of Fe–C–Nb is lower than that of Fe–Nb–C in the previous study [
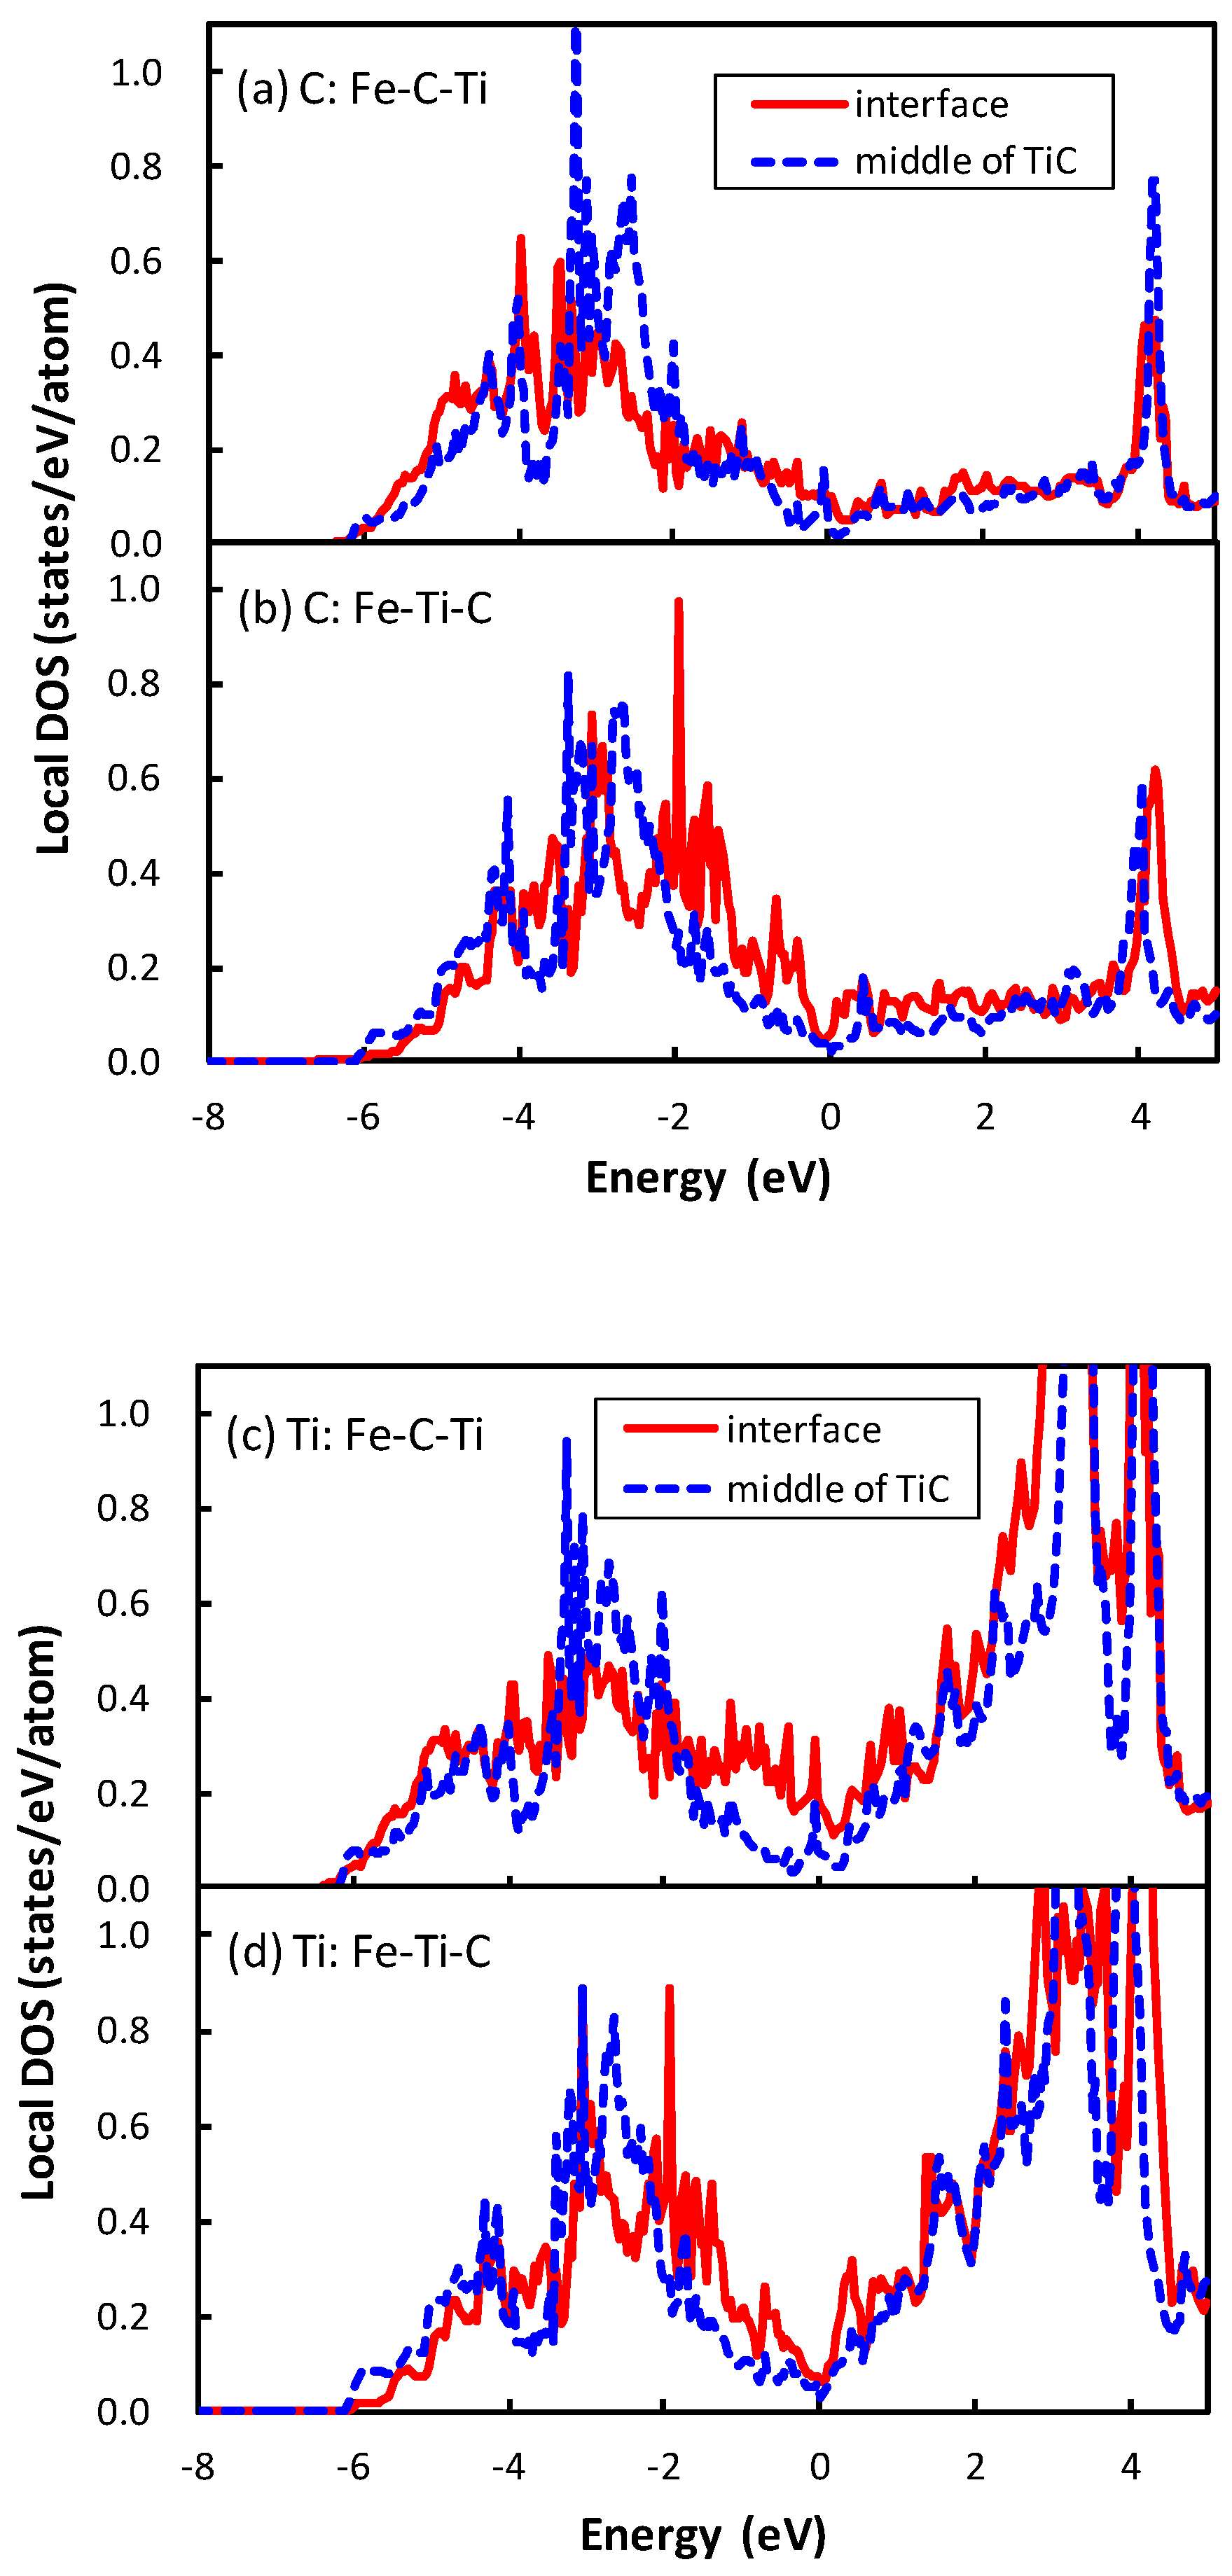
21]. The local density of states (DOSs) of the C atom of the interface between TiC and bcc iron are plotted in
Figure 3. The phenomenon that occurs in the interface between TiC and bcc iron is similar to that between the NbC and bcc iron. The local DOS of the C atom at the interface is shifted to a higher energy relative to that at the middle of the TiC region in the interface of Fe–Ti–C, while the energy region of local DOS of the C atom at the interface is close to that at the middle of the TiC region in the interface of Fe–C–Ti. The mechanism of the energy shift of the local DOS of the C atom at the interface of Fe–Ti–C can be related to the number of surrounding atoms of the C atom. In TiC with an NaCl-type structure, the C atom is surrounded by six Ti atoms. However, the C atom at the interface of Fe–Ti–C has only five surrounding atoms, i.e., the C atom has a dangling bond that destabilizes the C atom. Conversely, the C atom at the interface has six surrounding atoms at the interface of Fe–C–Ti. The local DOS of the Ti atom at the interface of Fe–Ti–C also shows the energy shift in
Figure 3d, but the shift is more clearly seen in the DOS of the C atom. Thus, the electronic effect for the interface bonding is dominated by the electrons around C rather than Ti. The states of the C atom in TiC are mainly located from
to 0 eV in
Figure 3a,b, while those in NbC are from
to
eV, as shown in the previous paper [
21]. In other words, the energy band of TiC is wider than that of NbC. This is due to the difference of lattice constants between TiC and NbC. The smaller lattice constant of TiC gives a wider energy band of the C atom in comparison with NbC. This spread electron of C atom in TiC reduces the difference of the local DOS of the C atom between the interfaces of Fe–C–Ti and Fe–Ti–C compared to that between the interfaces of Fe–C–Nb and Fe–Nb–C, because the energy shift originates from the local covalent bond character of the C atom at the interface.
The minimum of interface energy of Fe–Nb–C is much lower than that of Fe–Ti–C. In the transition metal carbide the transition metal
d states hybridize with the
states of carbon, and the bonding and anti-bonding states are separated distinctly (
Figure 3). For the interfaces of Fe–Ti–C and Fe–Nb–C, the bond across the interface is attributed to the metallic bond between the transition metal
d states and Fe
d states. In such a case, the increase in filling of the transition metal
d states increases the strength of the interface bond [
19]. Basically, Nb has one more electron than Ti in the outer-most
d orbital. Furthermore, the number of electrons in the Nb atom at the interface increases compared with that at the middle of the NbC region by approximately 0.1 due to the electron donation from the Fe atom, while the number of electrons of Ti at the interface is almost the same as that at the middle of the TiC region. The deeper electronic states of Nb in comparison to Ti cause this phenomenon. Therefore, the interface bond of Fe–Nb–C should be stronger than that of Fe–Ti–C, and the interface of Fe–Nb–C has lower interface energy than that of Fe–Ti–C. In contrast, the minimum of interface energy of Fe–C–Ti does not differ from that of Fe–C–Nb. The bond across the interface should be derived from the strong covalent bond between the Fe and C atoms for both interfaces. Therefore, there is no large deviation in the interface energy between Fe–C–Nb and Fe–C–Ti. In addition, as shown in
Figure 2, the interface separation in the interface of Fe–C–Ti is shorter than that of Fe–Ti–C, and the interface separation in the interface of Fe–C–Nb is shorter than that of Fe–Nb–C. The shorter interface separation of Fe–C–Ti in comparison with that of Fe–Ti–C originates from the strong covalent bond between the Fe and C atoms across the interface of Fe–C–Ti.
In general,
m units of bcc iron face
n units of TiC at the interface. The interface with the same
m and
n is coherent, while that with different
m and
n is semi-coherent. In many cases,
m and
n cannot be expressed by a ratio of integers, i.e., an incoherent interface. As aforementioned, precipitate nanometer sizes of TiC in iron have a flat interface represented by the Baker–Nutting orientation relationship and reveal the semi-coherent interface [
9]. It is possible to find the minimum of misfit
by searching
m and
n with lattice constant of iron
and that of TiC
.
is
of the conventional lattice constant.
For the interface between bcc iron and TiC,
and
afford a minimum misfit
. Large-scale first-principles calculations are performed for
m:
n = 15:14, 14:13, 13:12, 12:11, 11:10. The interface energies calculated for
and
are shown in
Figure 2.
The interface distance of the semi-coherent interface is defined as the same analogy of Equation (
1). The interface distance of the semi-coherent interface between the TiC and bcc iron is close to that of the coherent interface of Fe–C–Ti. In contrast, the interface distance of the semi-coherent interface between the NbC and bcc iron is closer to that of the coherent interface of Fe–Nb–C. This discrepancy occurs for two reasons. First, the interface distance of the coherent interface between NbC and bcc iron is underestimated compared with that between the TiC and bcc iron, because the lattice parameter of the iron is expanded along
a axis to the lattice parameter of transition metal carbides. In other words, the unit cell length of
for the coherent interface between the NbC and bcc iron is longer than that between the TiC and bcc iron by 5%. The second cause of the discrepancy comes from a difference in the lattice constant between TiC and NbC. The difference of lattice constants between the TiC and bcc iron is 7.2%, while that between NbC and bcc iron is 12.6%. This large difference of the lattice constants between the TiC and NbC leads to the difference of distance between the misfit dislocations of the semi-coherent interface. The coherent interface distance of Fe–C–Ti is much shorter than that of Fe–Ti–C because of the different bonding character between the covalent strong Fe–C bond and the metallic Fe–Ti bond. There are areas where a Fe atom is connected with a Ti atom across the interface near the misfit dislocation, leading to separation of the interface. The distance between the misfit dislocations of the semi-coherent interface between TiC and bcc iron is approximately 1.67 times longer than that between the NbC and bcc iron. Therefore, the expansion effect of interface by the misfit dislocation does not extend to the whole interface region for TiC.
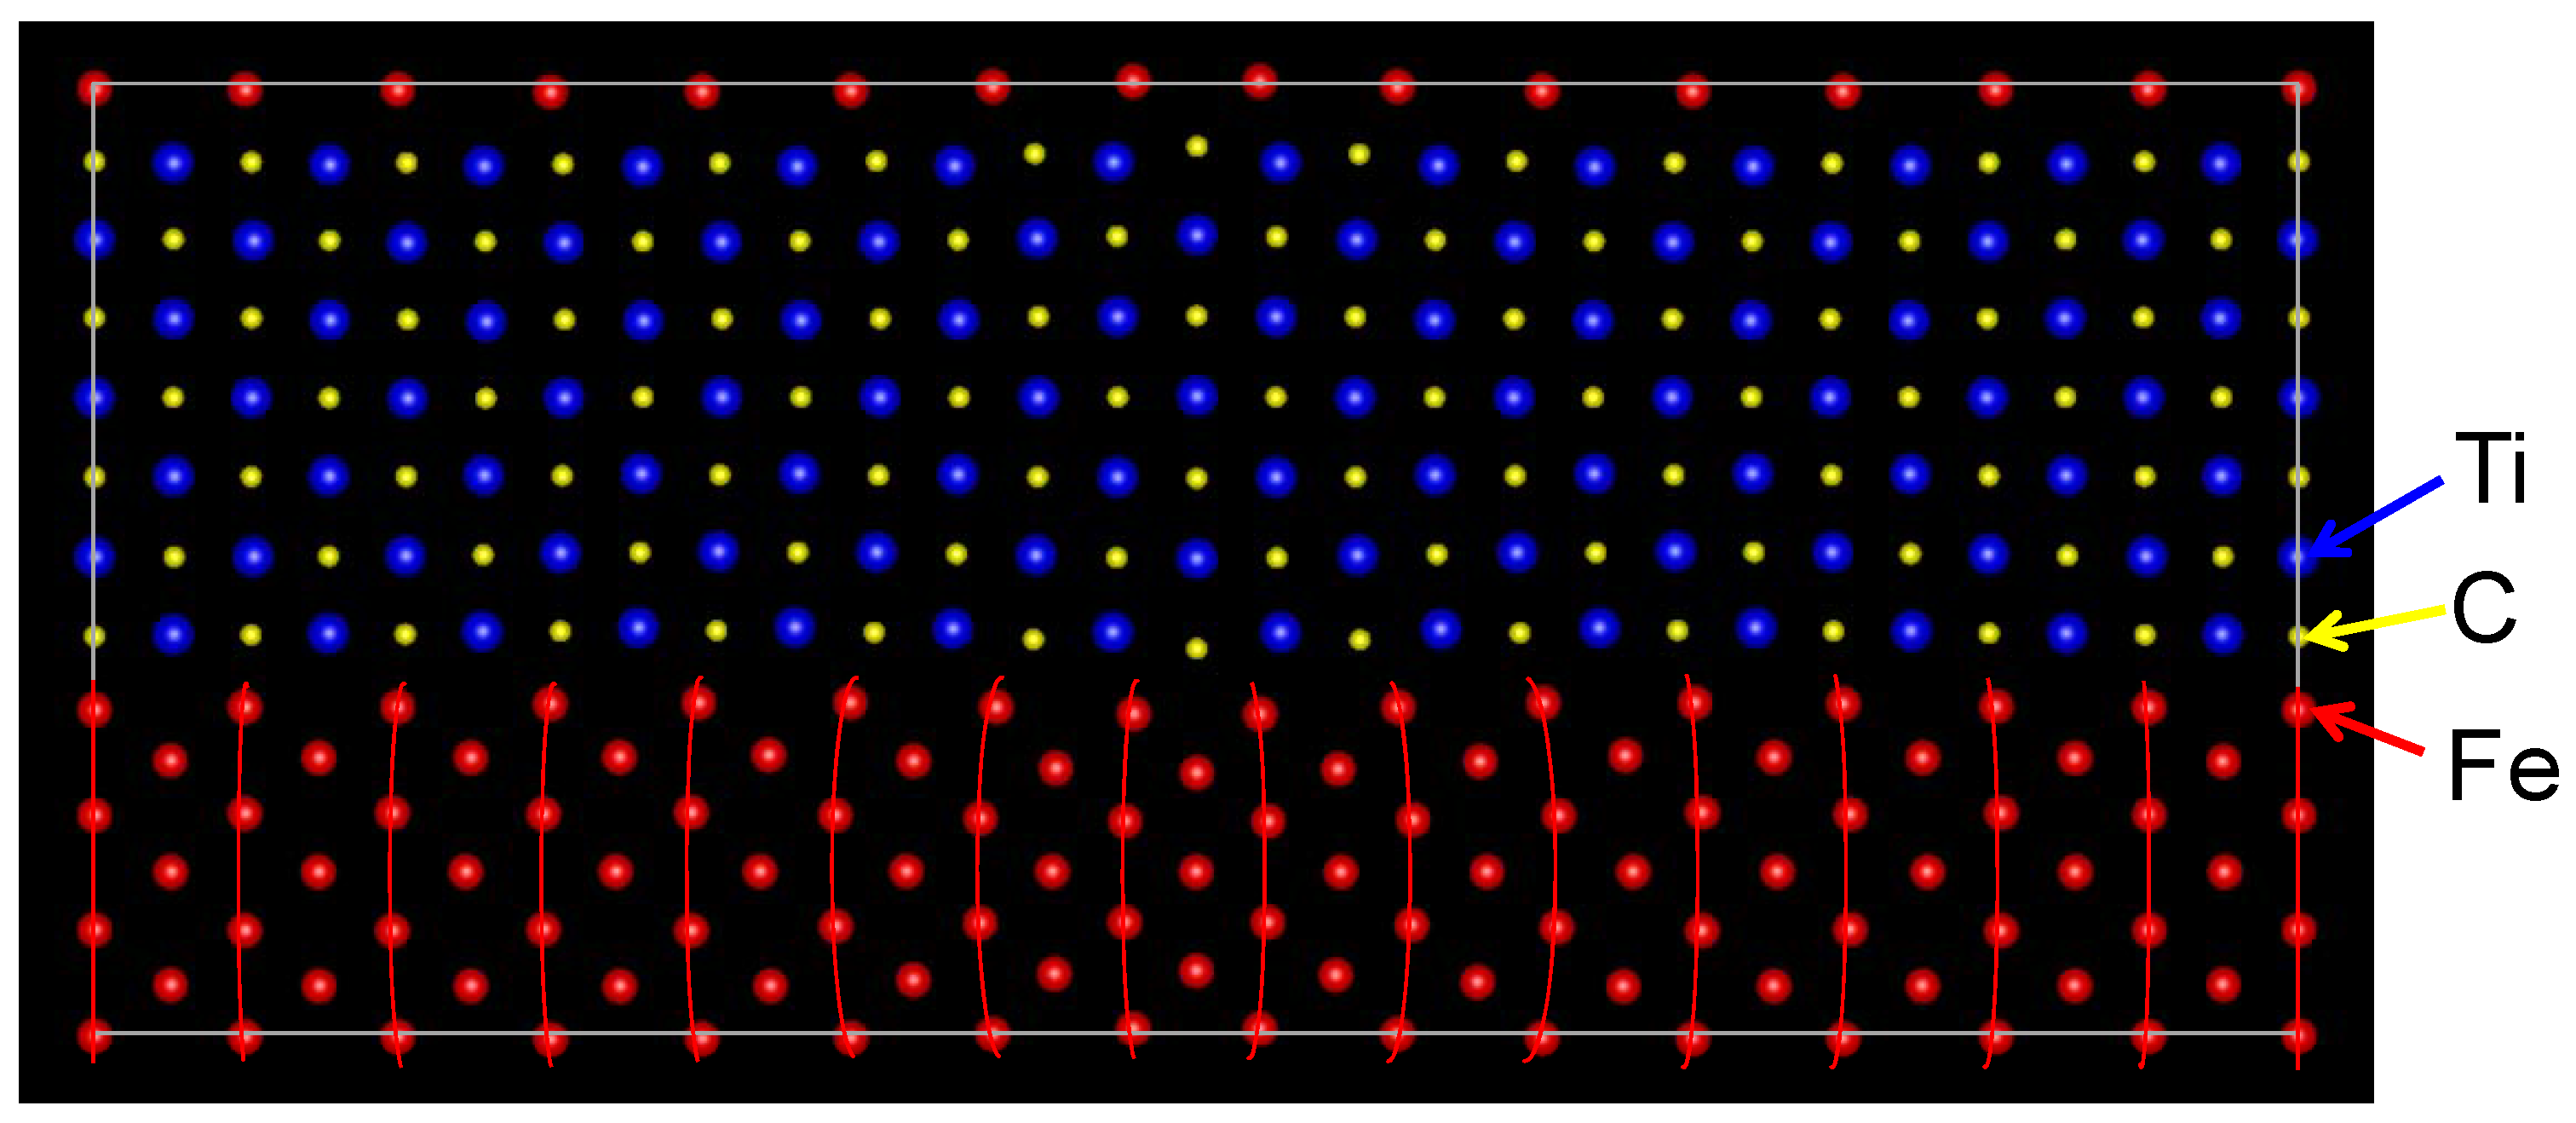
The optimized atomic positions of the semi-coherent interface are shown in
Figure 4. The Fe atoms at the interface are connected with the C atoms across the interface except for the Fe atoms near the misfit dislocation, which leads to the bending of lines of Fe atoms. A Fe atom can create a strong covalent bond with a C atom, while the bond between Fe and Ti atoms is weak, as described for the coherent interface. Therefore, the bonding character among Fe, Ti, and C atoms reflects on the atomic transfers around the semi-coherent interface.
The semi-coherent interface can be considered as a mixture of the two coherent interfaces; therefore, the interface energies of the semi-coherent interface are influenced by the interface energies of the coherent interfaces. Since the C atoms at the interface are connected with the Fe atoms at the largest part of the semi-coherent interface, the semi-coherent interface energies are mainly affected by the coherent interface energies of Fe–C–Ti or Fe–C–Nb. Based on this coherent interface energies of Fe–C–Ti or Fe–C–Nb, the coherent interface energies of Fe–Ti–C or Fe–Nb–C affect the semi-coherent interface energies. Then, the semi-coherent interface energy between TiC and bcc iron is slightly larger than that between NbC and bcc iron because the coherent interface energy between TiC and bcc iron is larger than that between NbC and bcc iron. This same tendency was also reported by Fors et al. [
19].
2.2. Strain Energy
The structure optimization using the empirical potential is performed to obtain the strain around the precipitate in bcc iron.
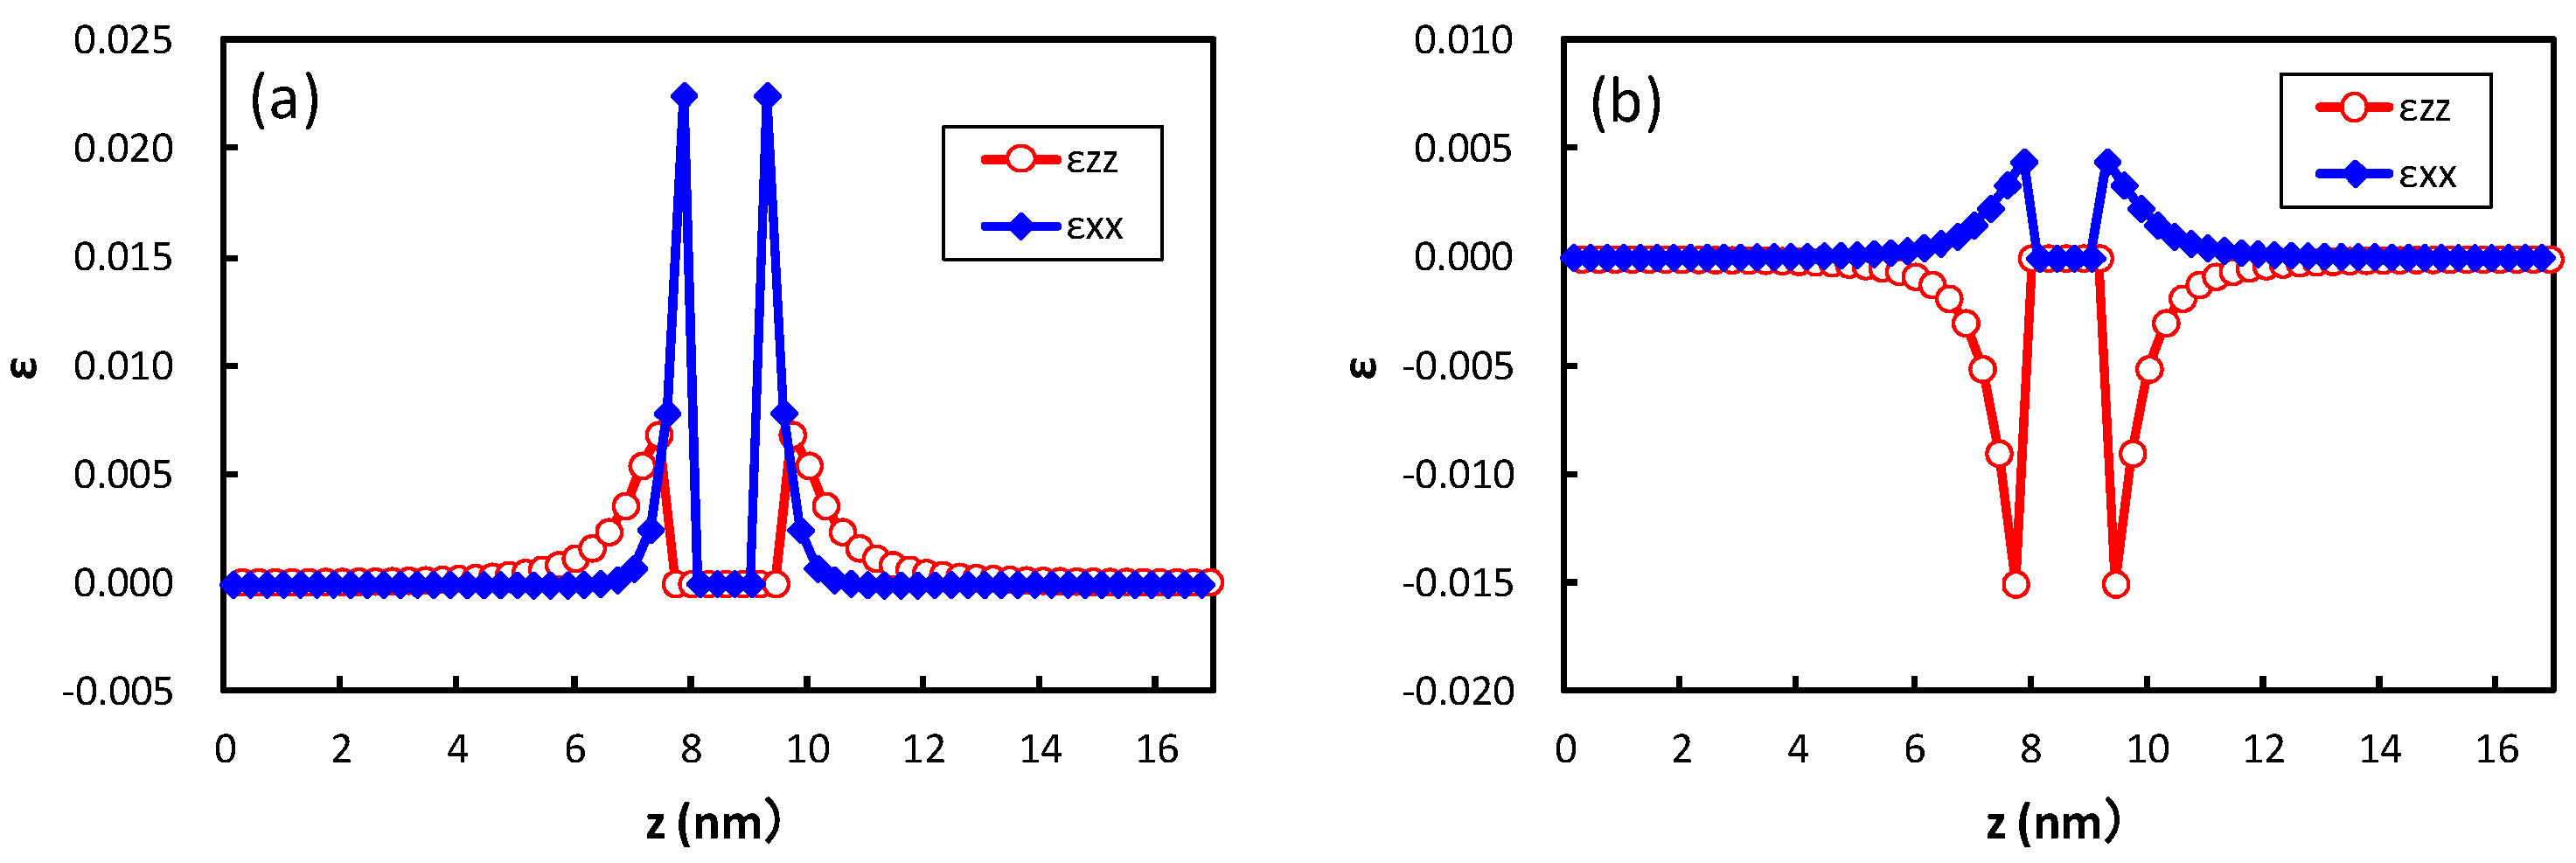
Figure 5 shows the strain obtained at the center of the broad plane of the precipitate along the perpendicular direction to the broad plane of the precipitate. Coherent and semi-coherent precipitates were assumed in
Figure 5a,b, respectively. The coherent and semi-coherent precipitates indicate much different features in the strain around the precipitates. The coherent precipitate has a much larger strain,
, than the semi-coherent precipitate. Furthermore, the coherent precipitate gives a positive
, i.e., tensile strain, while the semi-coherent precipitate exhibits compressive strain. These features can be elucidated by the atomic transfers due to precipitation.
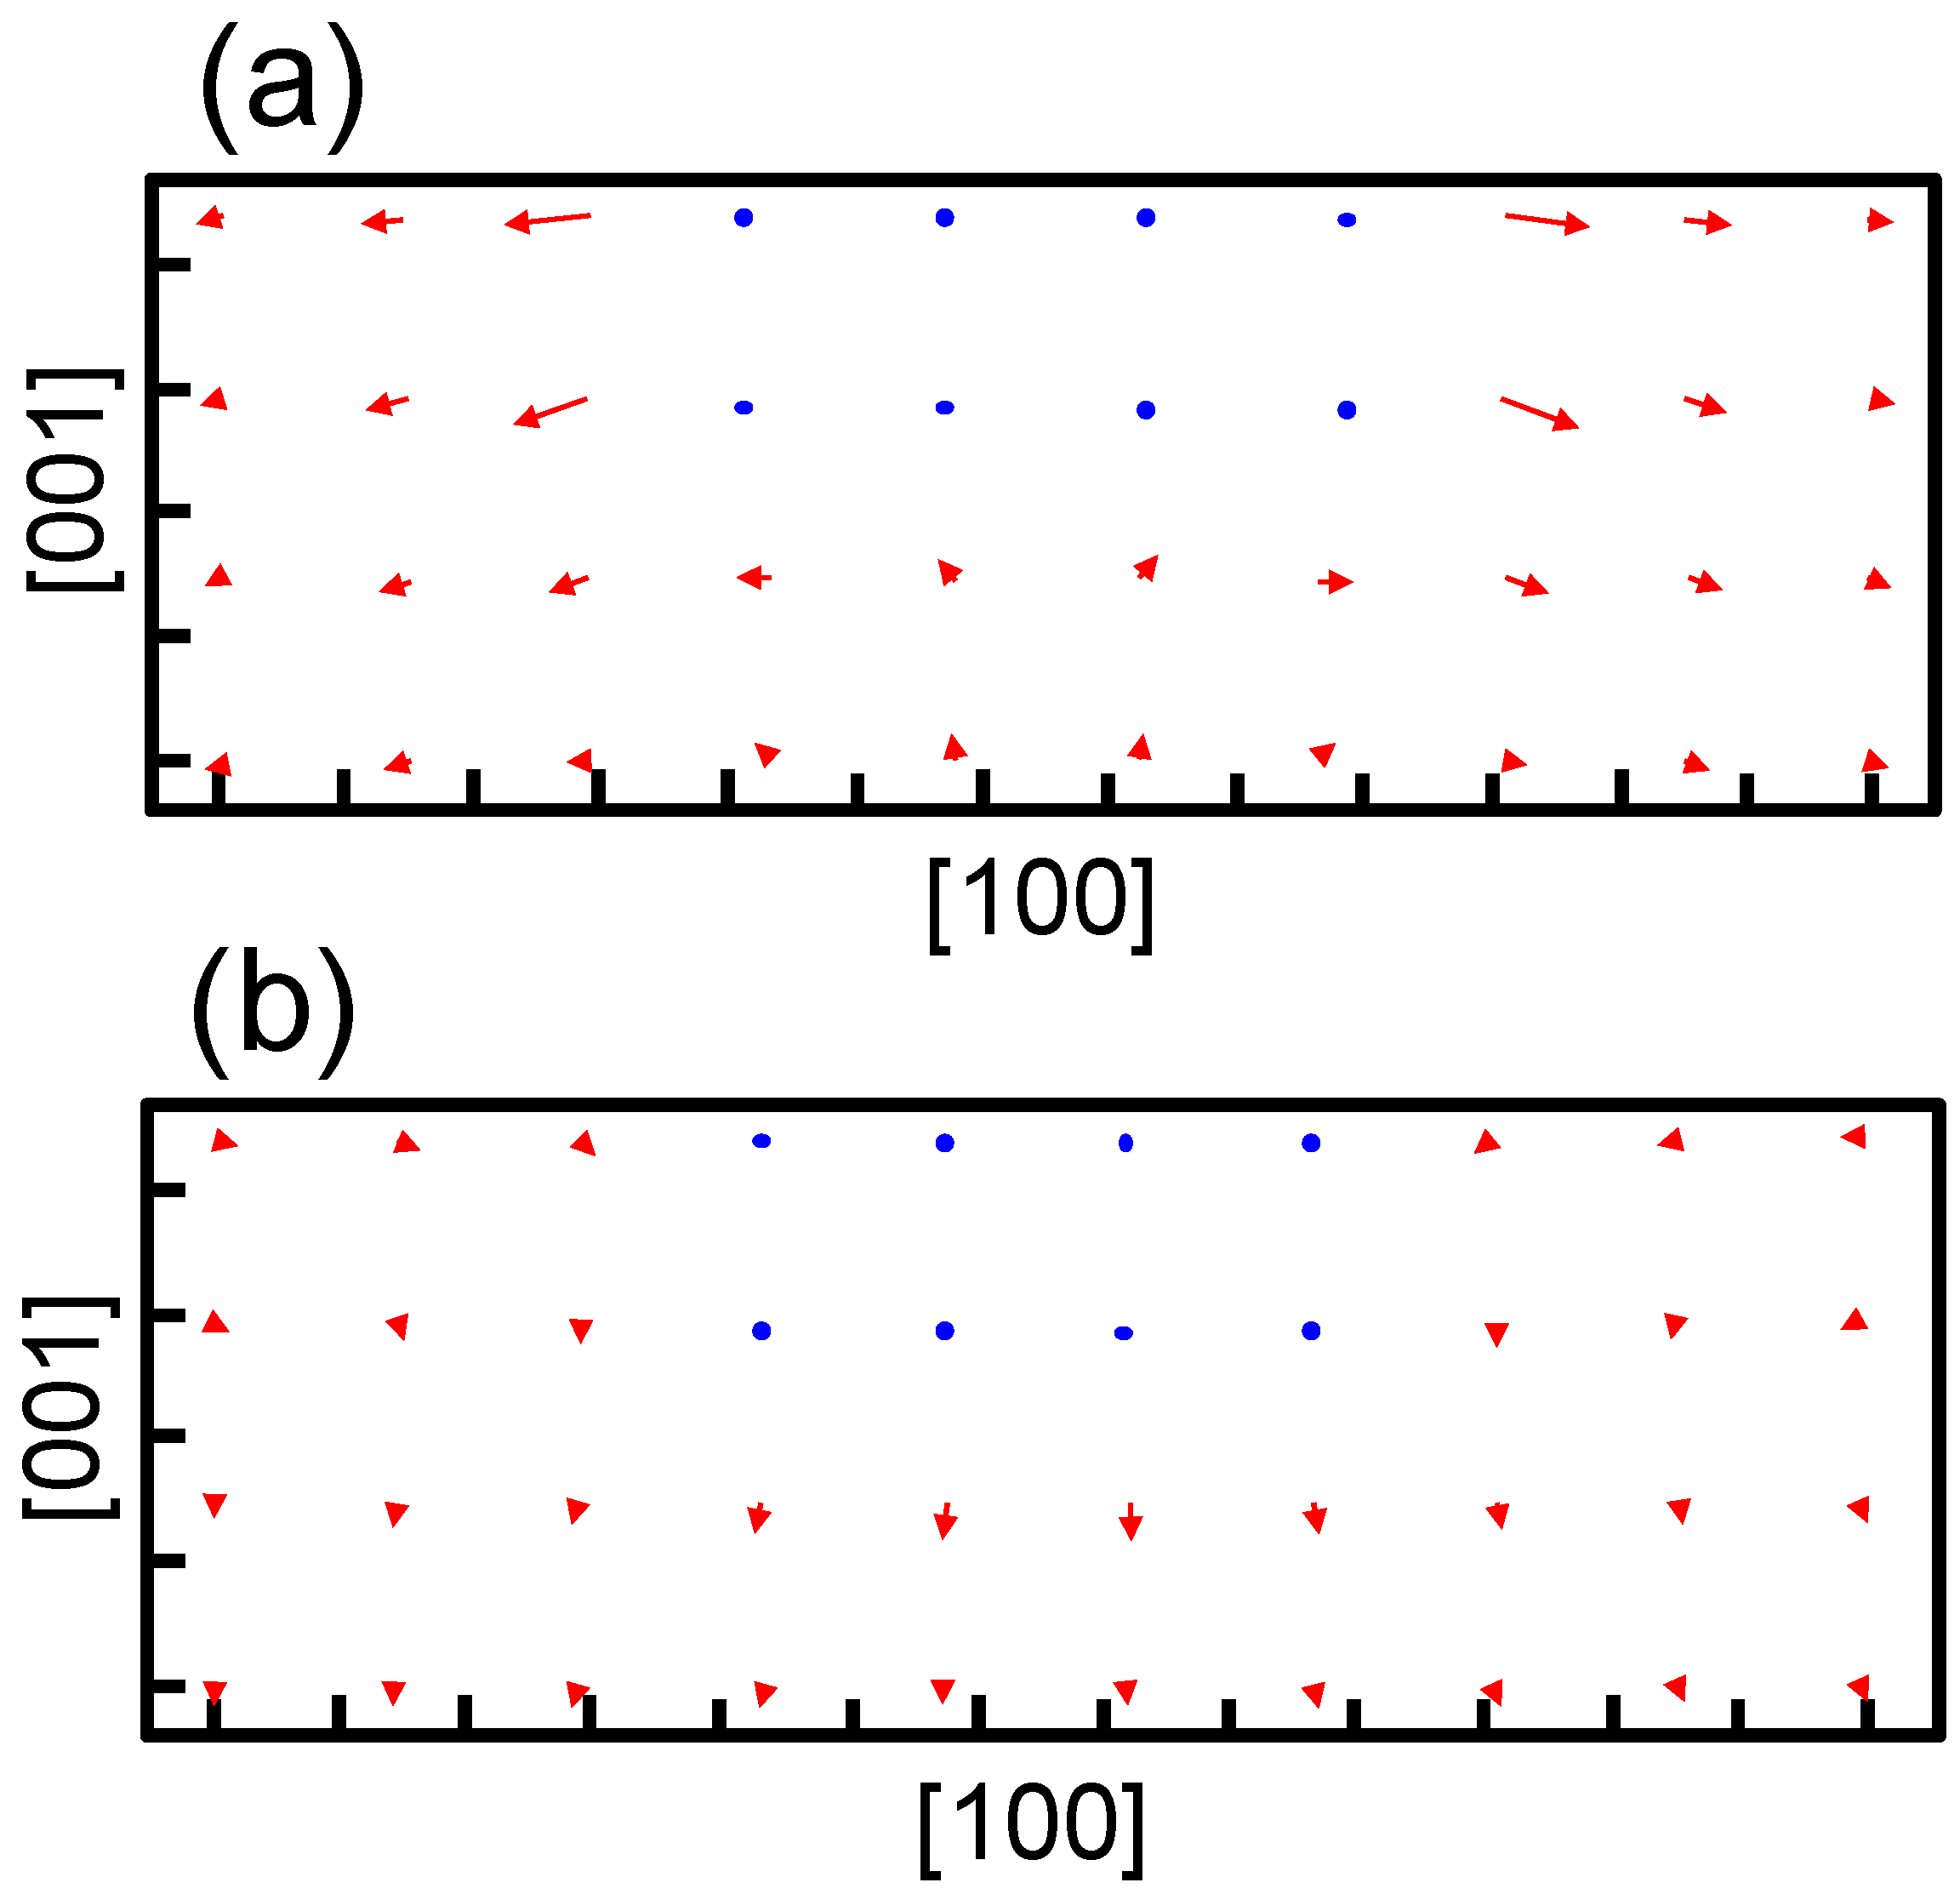
Figure 6 shows the transfers of atoms around the coherent and semi-coherent precipitate by the structure optimization from the ideal position of Fe atoms in bcc iron due to precipitation. For the coherent precipitate, the atoms at the side of the precipitate move toward [100] or [
], because the lattice constant of the precipitate is longer than that of bcc iron. Then, the atoms facing the broad plane of the precipitate also move toward [100] or [
]. Thus, atomic density decreases and the atoms move toward the precipitate near the center of broad plane of the precipitate (
Figure 6a). This is the origin of tensile strain
for the coherent precipitate. Conversely, atoms at the side of semi-coherent precipitate do not move toward [100] or [
]. Then, the decrease in atomic density does not occur near the center of the broad plane of the precipitate, and atoms depart from the precipitate along [
] due to the expansion of the precipitate along [001]. In this case, three layers of precipitate are assumed. This precipitate region is constructed using four layers of iron expanded 4% along [001]. Thus, the compressive strain is generated in
for the semi-coherent precipitate. The strain distribution evaluated from atomic arrangement via high angle annular dark-field scanning transmission electron microscopy also reveals compressive strain at the matrix region near the broad plane of precipitate [
22]. Therefore, the theoretically estimated strain around the precipitate is qualitatively in good agreement with the experimental observation. The transfers of atoms along [100] for a coherent precipitate are more prominent than those for a semi-coherent precipitate near the broad interface, which leads to larger
for a coherent precipitate than a semi-coherent precipitate.
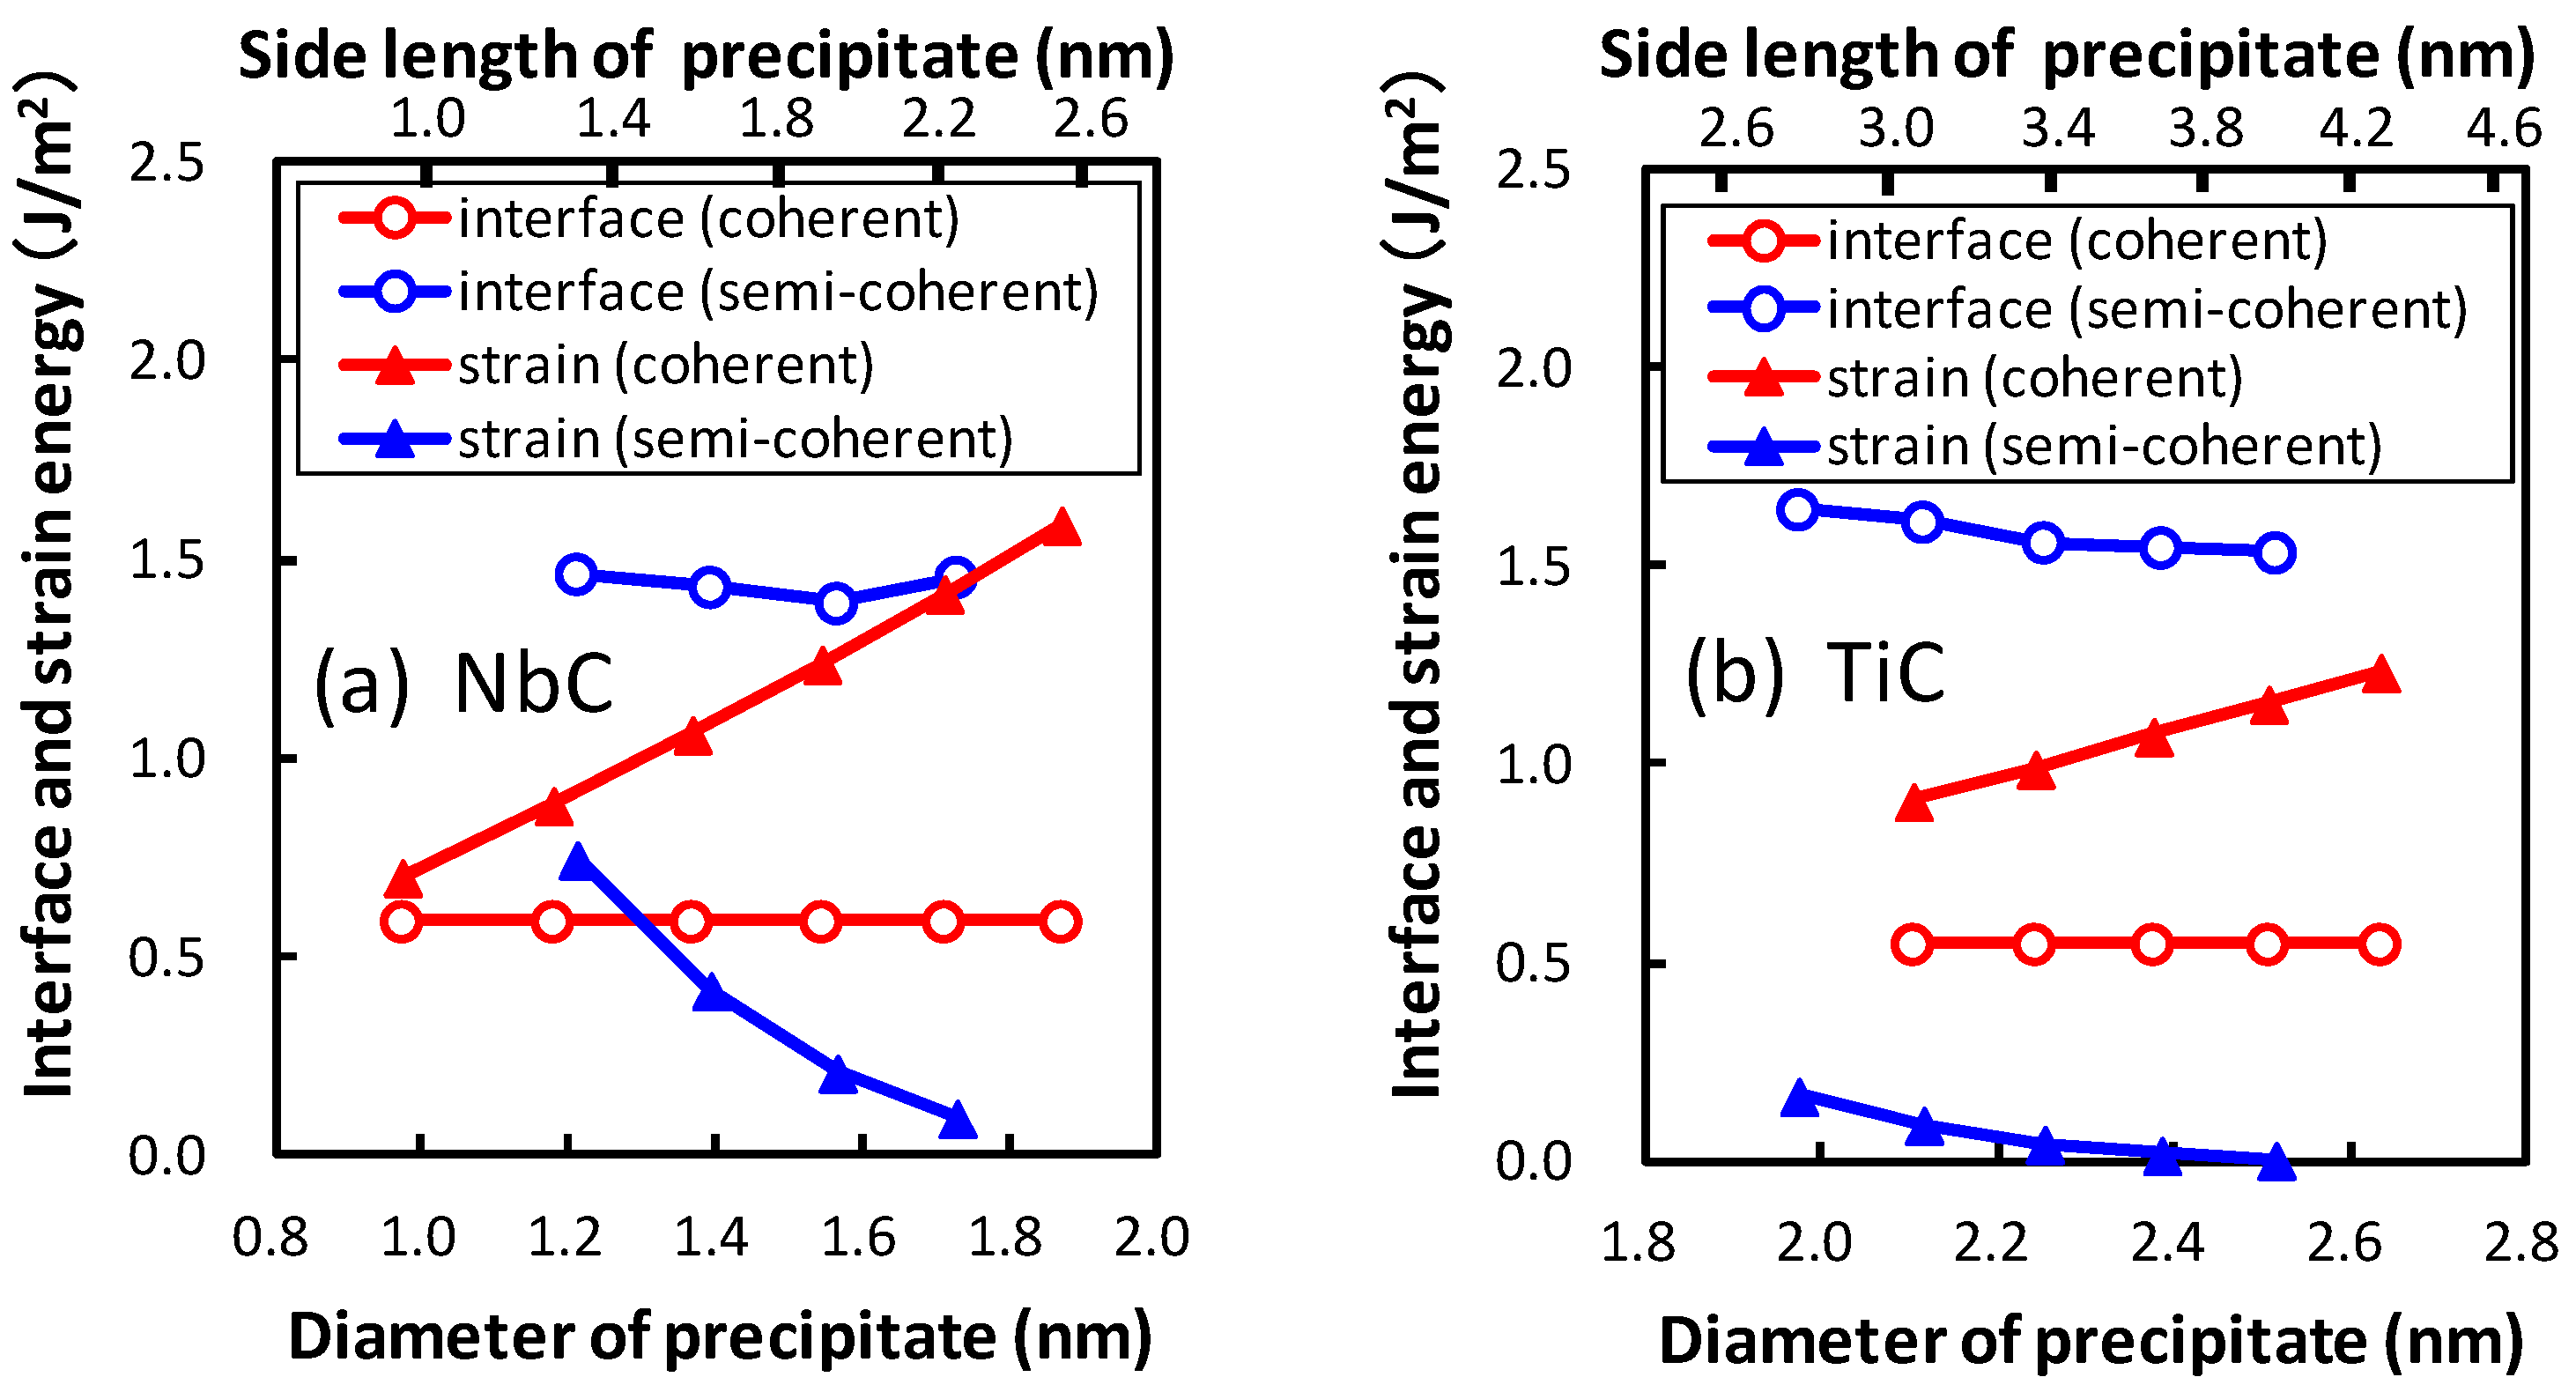
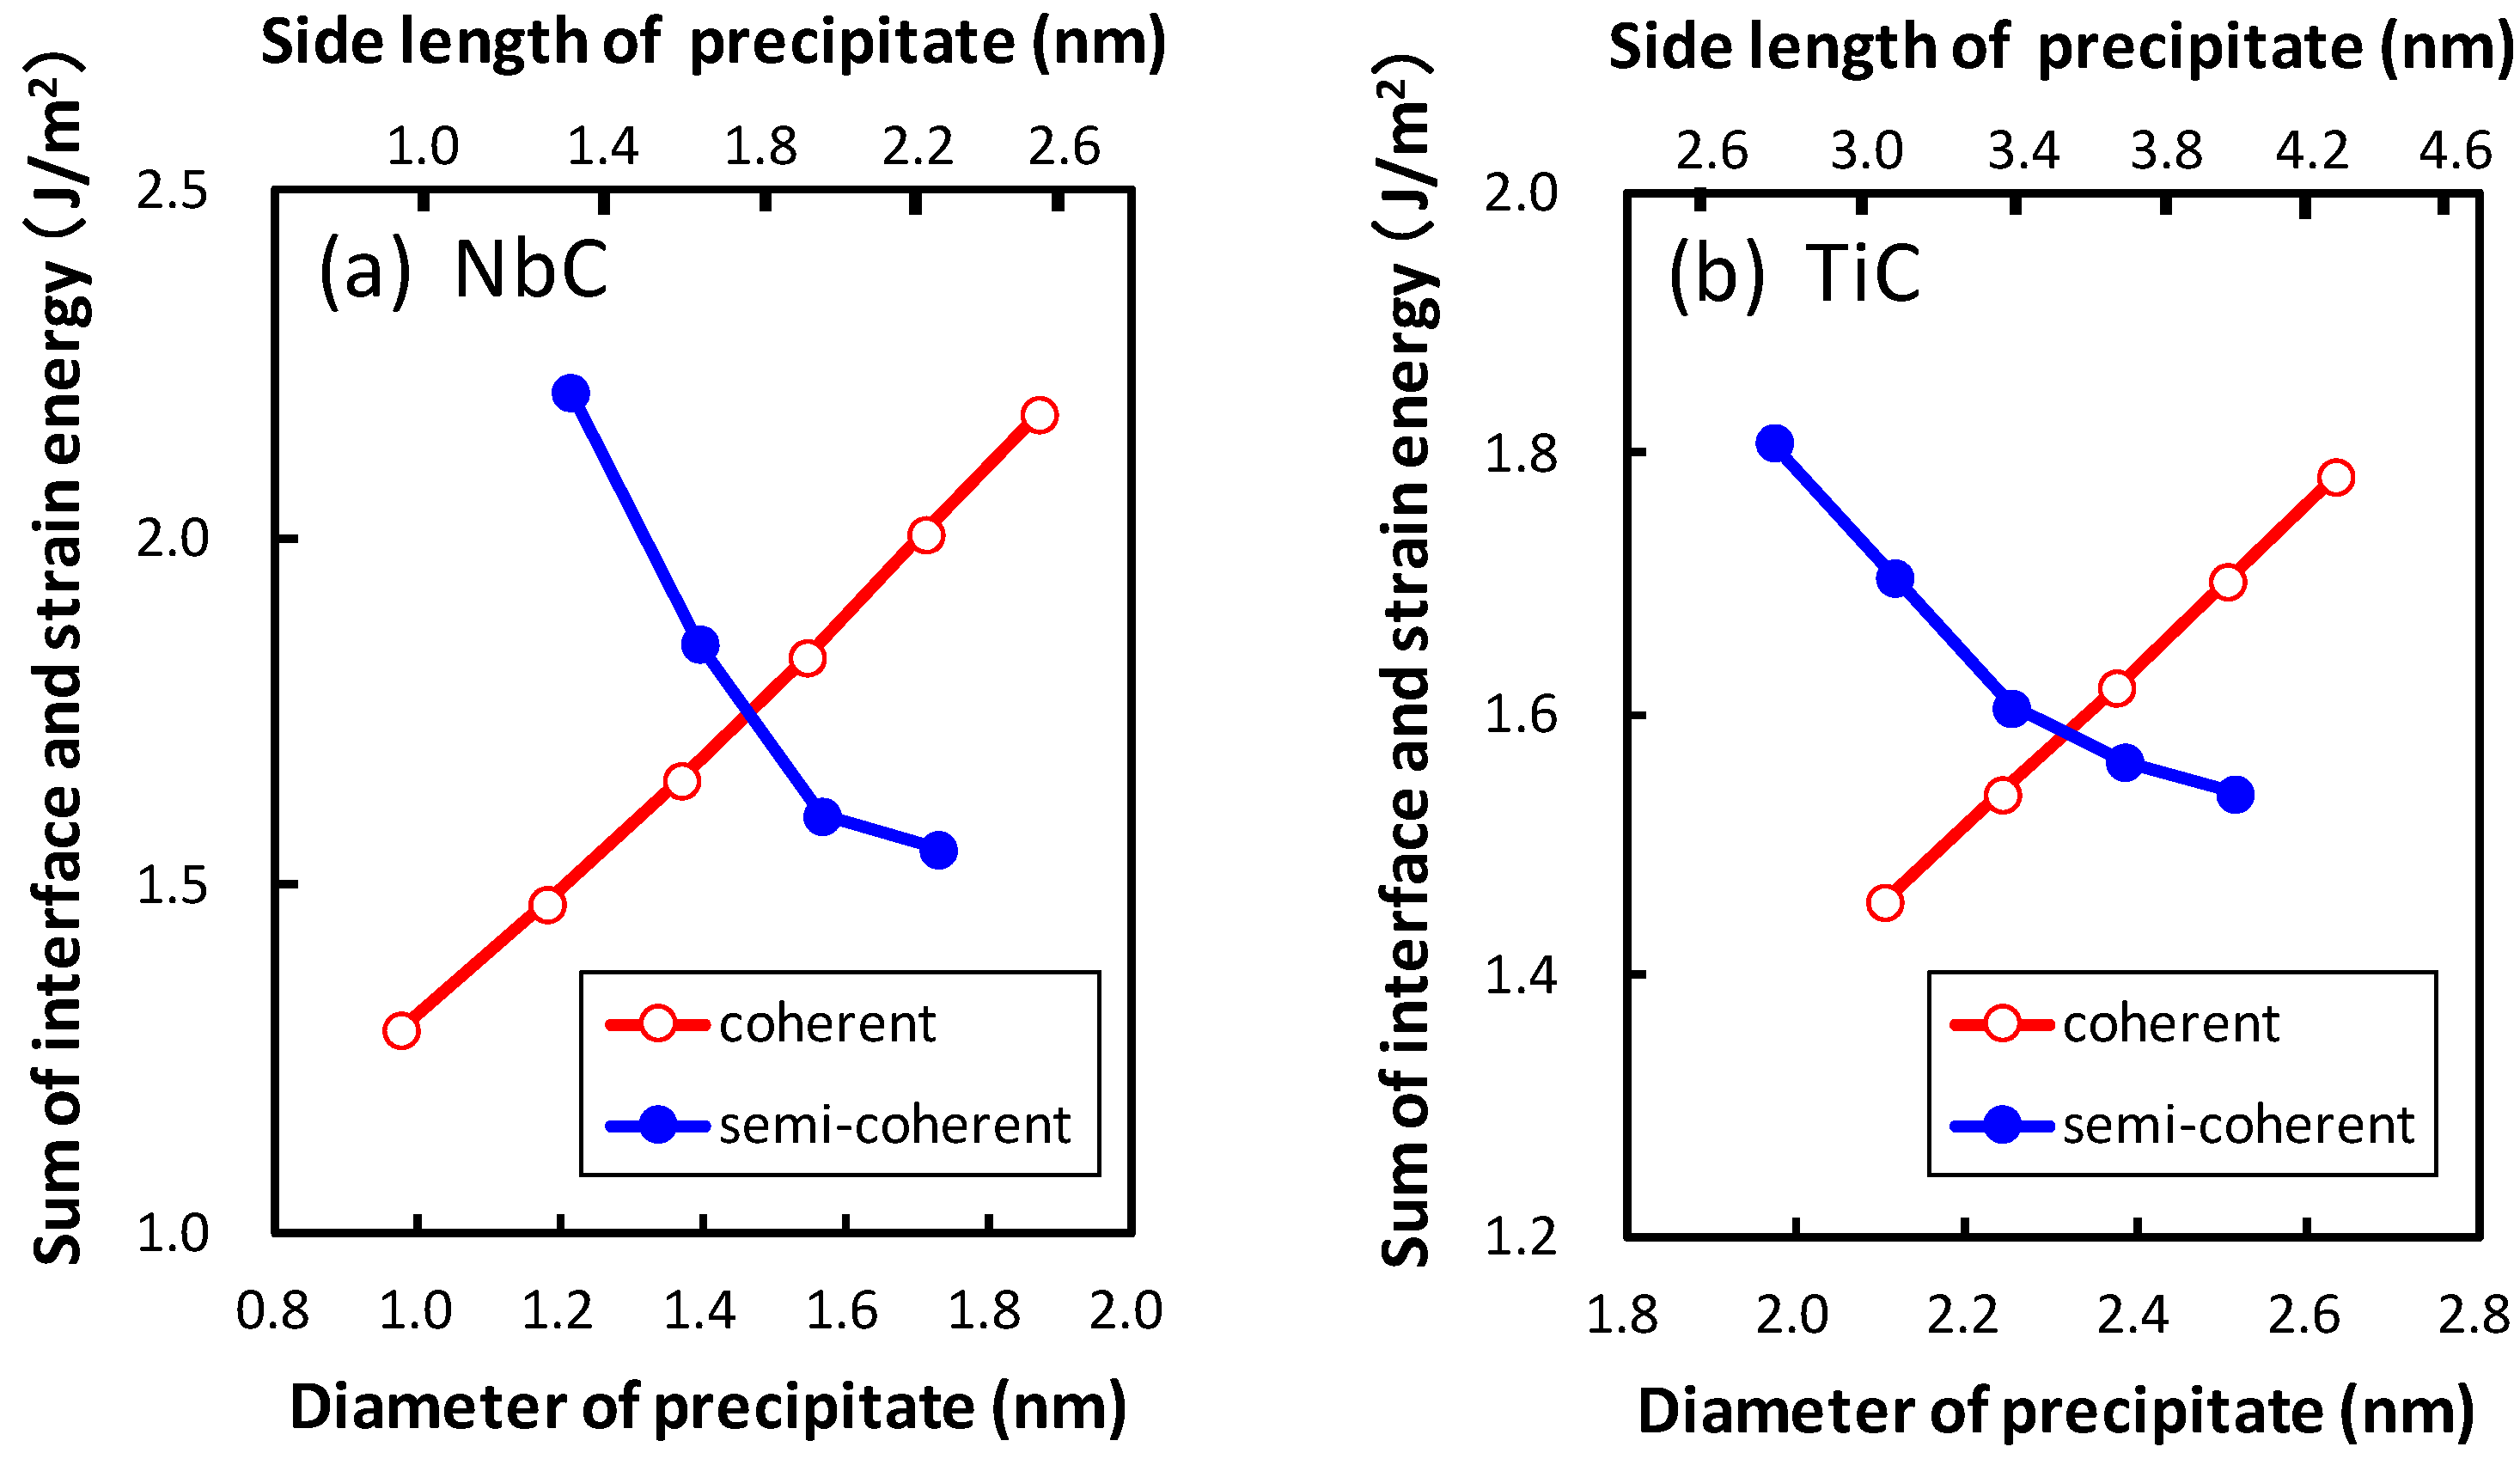
Strain energy is estimated by comparing the potential energies of the optimized atoms in the matrix region because of the virtual precipitate region to those with the original atom positions of bcc iron. The obtained strain energy is confirmed to be in good agreement with the continuous model. As mentioned above, we focus on the growth of the broad plane of the precipitate. The interface energy is obtained for the area of the broad plane. The obtained strain energy with the same area of the lateral plane is divided by the area of the broad plane and defined as a function of the area of the broad plane in order to compare it with the interface energy. In
Figure 7, the interface and strain energies of NbC and TiC are shown as functions of the diameter of the precipitate. The diameter of the plate-like rectangular parallelepiped shaped precipitate is estimated by assuming the precipitates to be spherical. The thicknesses of the precipitates are 0.54 nm and 0.52 nm for NbC and TiC, respectively. The strain energy strongly depends on the size of the precipitate, in contrast to the small precipitate size dependence of interface energies. The strain energies of coherent precipitates increase proportionally to the diameter of the equivalent sphere of the precipitate because larger strain exists around the precipitate for larger precipitates. This linear dependence of the strain energy on the diameter of the precipitate is consistent with the continuum mechanics. Conversely, for semi-coherent precipitates the strain energies decrease with an increase in the size of precipitate in these regions. In
Figure 7, the size of precipitates increases from 1.97 nm (
n = 10) to 2.51 nm (
n = 14) for TiC and from 1.22 nm (
n = 5) to 1.73 nm (
n = 9) for NbC. The misfits estimated using Equation (
2) decrease with increasing size of precipitates in these regions. From this perspective, the misfit and strain energy of semi-coherent interface increases from
n = 15 to 21 for TiC. In other words, the strain energy of the semi-coherent interface changes in a saw-like shape. The size dependence of strain energies of NbC is much steeper than that of TiC. This can be attributed to the larger lattice misfit between NbC and bcc iron than that between TiC and bcc iron.
