Article

Al-1.5Fe-xLa Alloys for Lithium-Ion Battery Package

1
School of Materials Science and Engineering, Shanghai Jiao Tong University, Shanghai 200240, China
2
Huafon NLM Al Co., Ltd., Shanghai 201506, China
3
Shanghai Huafon Materials Technology Institute, Shanghai 201203, China
*
Author to whom correspondence should be addressed.
Metals 2018, 8(11), 890; https://doi.org/10.3390/met8110890
Submission received: 13 October 2018 / Revised: 26 October 2018 / Accepted: 29 October 2018 / Published: 1 November 2018

Abstract

:
Al foil with high formability and corrosion resistance is highly desired for lithium-ion battery soft packaging. Annealing treatment has a significant impact on the performance of soft packaging Al foil. The effects of both La content and the annealing temperature on the microstructure, mechanical properties, and corrosion behavior of Al-1.5Fe-La alloy was investigated through optical microscopy (OM), scanning electron microscopy (SEM), transmission electron microscopy (TEM), tensile testing, potentiodynamic polarization testing, and electrochemical impedance spectroscopy (EIS) testing. A higher addition of La resulted in the formation of AlFeLa particles and a refinement of the Fe-rich second phase. The Al-1.5Fe-0.25La alloy had a higher formability and corrosion resistance than the Al-1.5Fe-0.1La alloy. Microstructure analysis indicated that recovery, recrystallization, and grain growth successively occurred in the Al-Fe-La alloy with the increase of the annealing temperature from 200 °C to 250 and 380 °C. After annealing at 250 °C, the Al-Fe-La alloys had the highest corrosion resistance due to refined grain and a high fraction of small-angle grain boundaries.

1. Introduction

Due to excellent performance in formability and corrosion resistance, Al foil and its composite film are widely used in the packaging industry, including food, medicine, and electronic products, especially the Li-ion battery [1,2,3]. In expansion applications, traditional 8011 alloys with low formability and corrosion resistance cannot satisfy the higher requirements of Li-ion battery packaging. Hypoeutectic Al-Fe alloys with a relatively high amount of Fe (>1.0 wt %) have been selected as packaging material for Li-ion battery soft packaging due to their high strength and plasticity.
Rare earth elements can strongly improve the mechanical properties and corrosion resistance of Al alloys [4,5,6,7,8]. Mi et al. [9] found that with 1.5 wt % La, flower-like Al3Fe replaced the original acicular phase, and an Al11La3 phase was formed in the subrapidly solidified Al-5Fe alloy. Li et al. [10] studied the effect of La on the microstructure of as-casted Al-2Fe alloys and found that Al3Fe phases were greatly refined with a 0.4 wt % addition of La. Yang [11] investigated the structure of oxide film on Al-La and its relationship with corrosion properties. That study found that La entered the oxide film, resulting in the enhancement of the binding force between Al and O atoms. The cathode and anode reactions were suppressed, leading to an improvement in corrosion resistance of the Al-La alloy.
Besides rare earth additions, heat treatment also has a significant impact on the properties of Al alloys. Deng et al. [12] and Li et al. [13] studied the effect of aging time and aging temperature on the corrosion behavior of both Sc- and Zr-modified Al-Zn-Mg alloys. The results showed that prolonging aging time and increasing aging temperature could improve corrosion resistance through coarsening and increasing the space for grain boundary precipitates. Huang et al. [14] found that high-temperature pre-precipitation processes had a similar effect on the grain boundary microstructure of the Al-Zn-Mg-Cu alloy, thus decreasing its corrosion susceptibility. Final annealing treatment plays an important role in the performance of soft packaging Al foil. However, the effect of process parameters and the addition of La on the mechanical properties and corrosion behavior of Al-Fe alloy foil have rarely been reported. Thus, in this study, the microstructure, mechanical properties, and corrosion behavior of Al-Fe-La alloys annealed at different temperatures were investigated through optical microscopy (OM), scanning electron microscopy (SEM), transmission electron microscopy (TEM), tensile testing, potentiodynamic polarization testing, and electrochemical impedance spectroscopy (EIS) testing.

2. Materials and Methods

The investigated materials were cold-rolled Al-1.5Fe-0.1La (wt %) and Al-1.5Fe-0.25La (wt %) foils with a thickness of 0.08 mm. Corresponding as-cast alloys were homogenized at 580 °C for 8 h before being hot-rolled and cold-rolled. The cold-rolled foils were then annealed at various temperatures (200, 250, and 380 °C) for 2 h.
The longitudinal section grain structure of the alloy foils was observed through optical microscopy (OM, ZEISS imageA1m, Jean, Germany) under polarized light. OM samples were successively observed through mechanical polishing, electrolytic polishing, and anodizing. Anodizing was conducted in Barker reagent with a voltage of 20 V for 2 min. The microstructure and second-phase particles of the foils were analyzed with a scanning electron microscope (SEM, FEI SIRION 200, Boston, MA, USA) under the second-electronic imaging mode, and also a transmission electron microscope (TEM, JEM-2100F, JEOL, Tokyo, Japan) operated in a bright field at an accelerating voltage of 200 kV and an emission current of around 195 μA. SEM samples were prepared using standard metallographic mechanical polishing procedures. TEM samples 3 mm in diameter and 70 μm in thickness were successively electropolished in 4 vol % HClO4 and ethanol solutions at −30 °C, and then subjected to ion beam thinning at a small angle. The composition of the second-phase particles was investigated with energy dispersive spectroscopy (EDS, Oxford INCA X-Act, Oxford, UK).
Mechanical properties were characterized through tensile testing using a Zwick/Roell Z020 (Ulm, Germany) universal tension machine at room temperature. The testing was conducted according to the standard of ASTM E8/E8M-13a at a tensile speed of 1 mm/min. Each alloy had four parallel specimens to guarantee accuracy.
Corrosion resistance of the foils was characterized through potentiodynamic polarization testing and electrochemical impedance spectroscopy testing on a CHI 660E electrochemical system. A three-electrode cell with an alloy sample, Ag/AgCl (0.1 M KCl), and Pt wire—respectively working as electrode, reference electrode, and counter electrode—was used in the study. Potentiodynamic polarization testing was conducted in a 3.5% NaCl solution with a scanning rate of 1 mV/s, ranging from −1 V to −0.3 V. EIS testing was conducted in a 3.5% NaCl solution with a perturbation voltage of 5 mV and a frequency ranging from 100 kHz to 0.01 Hz. Zsimpwin software was used to establish an equivalent circuit to fit the test data. In order to obtain stable values, each electrochemical measurement was repeated three times.

3. Results and Discussion

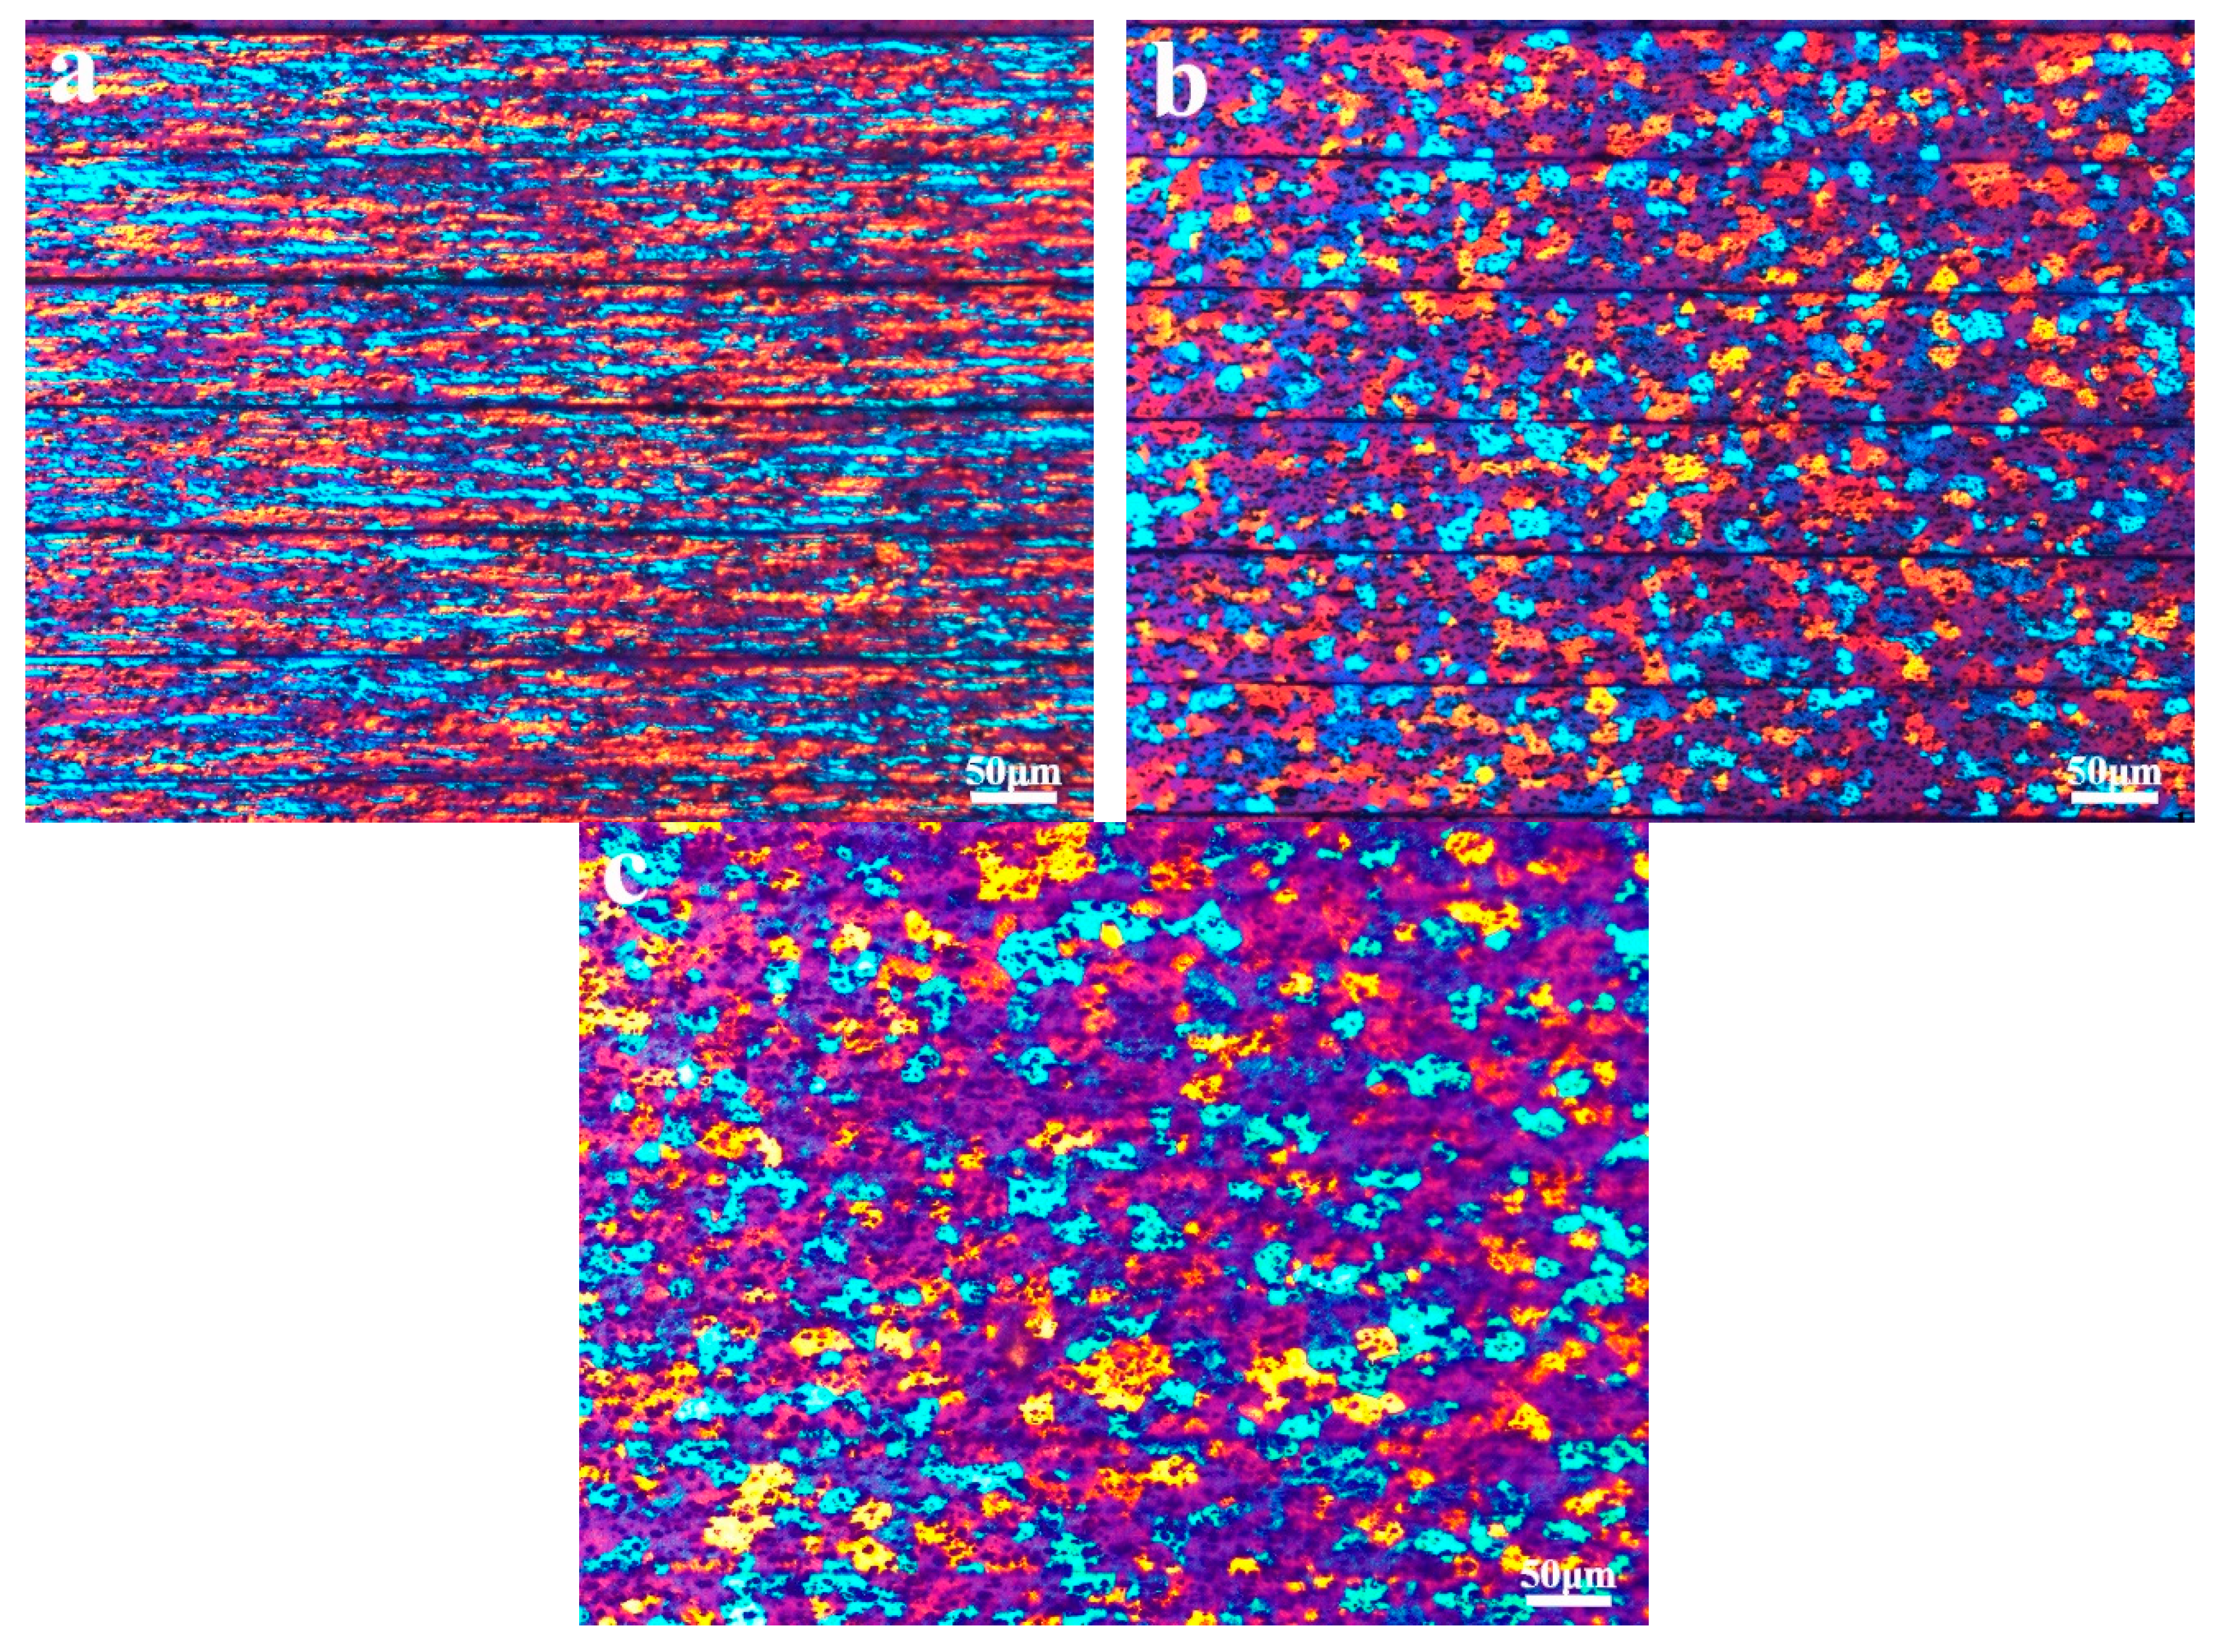
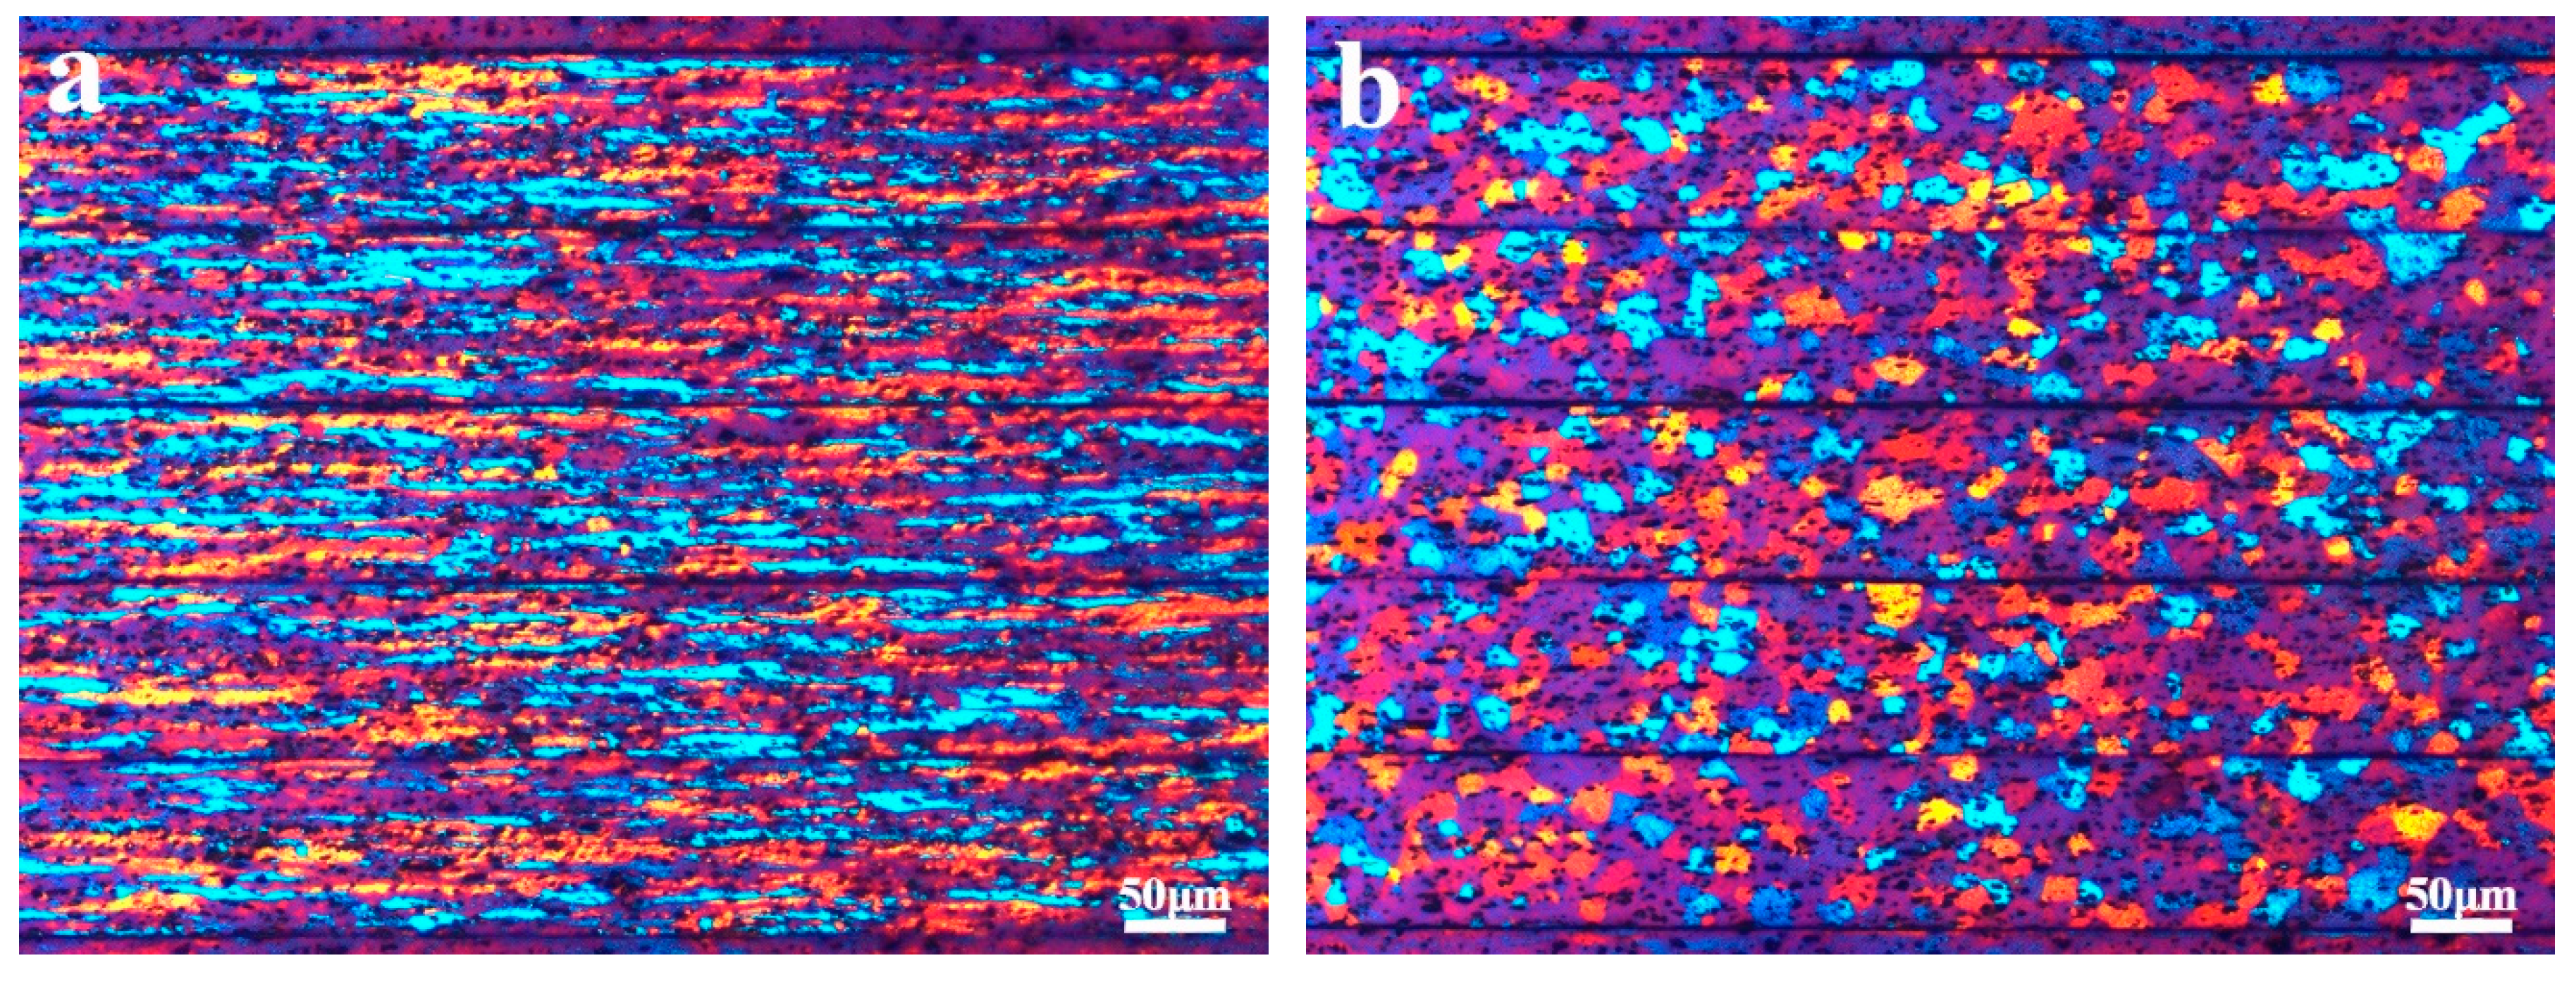
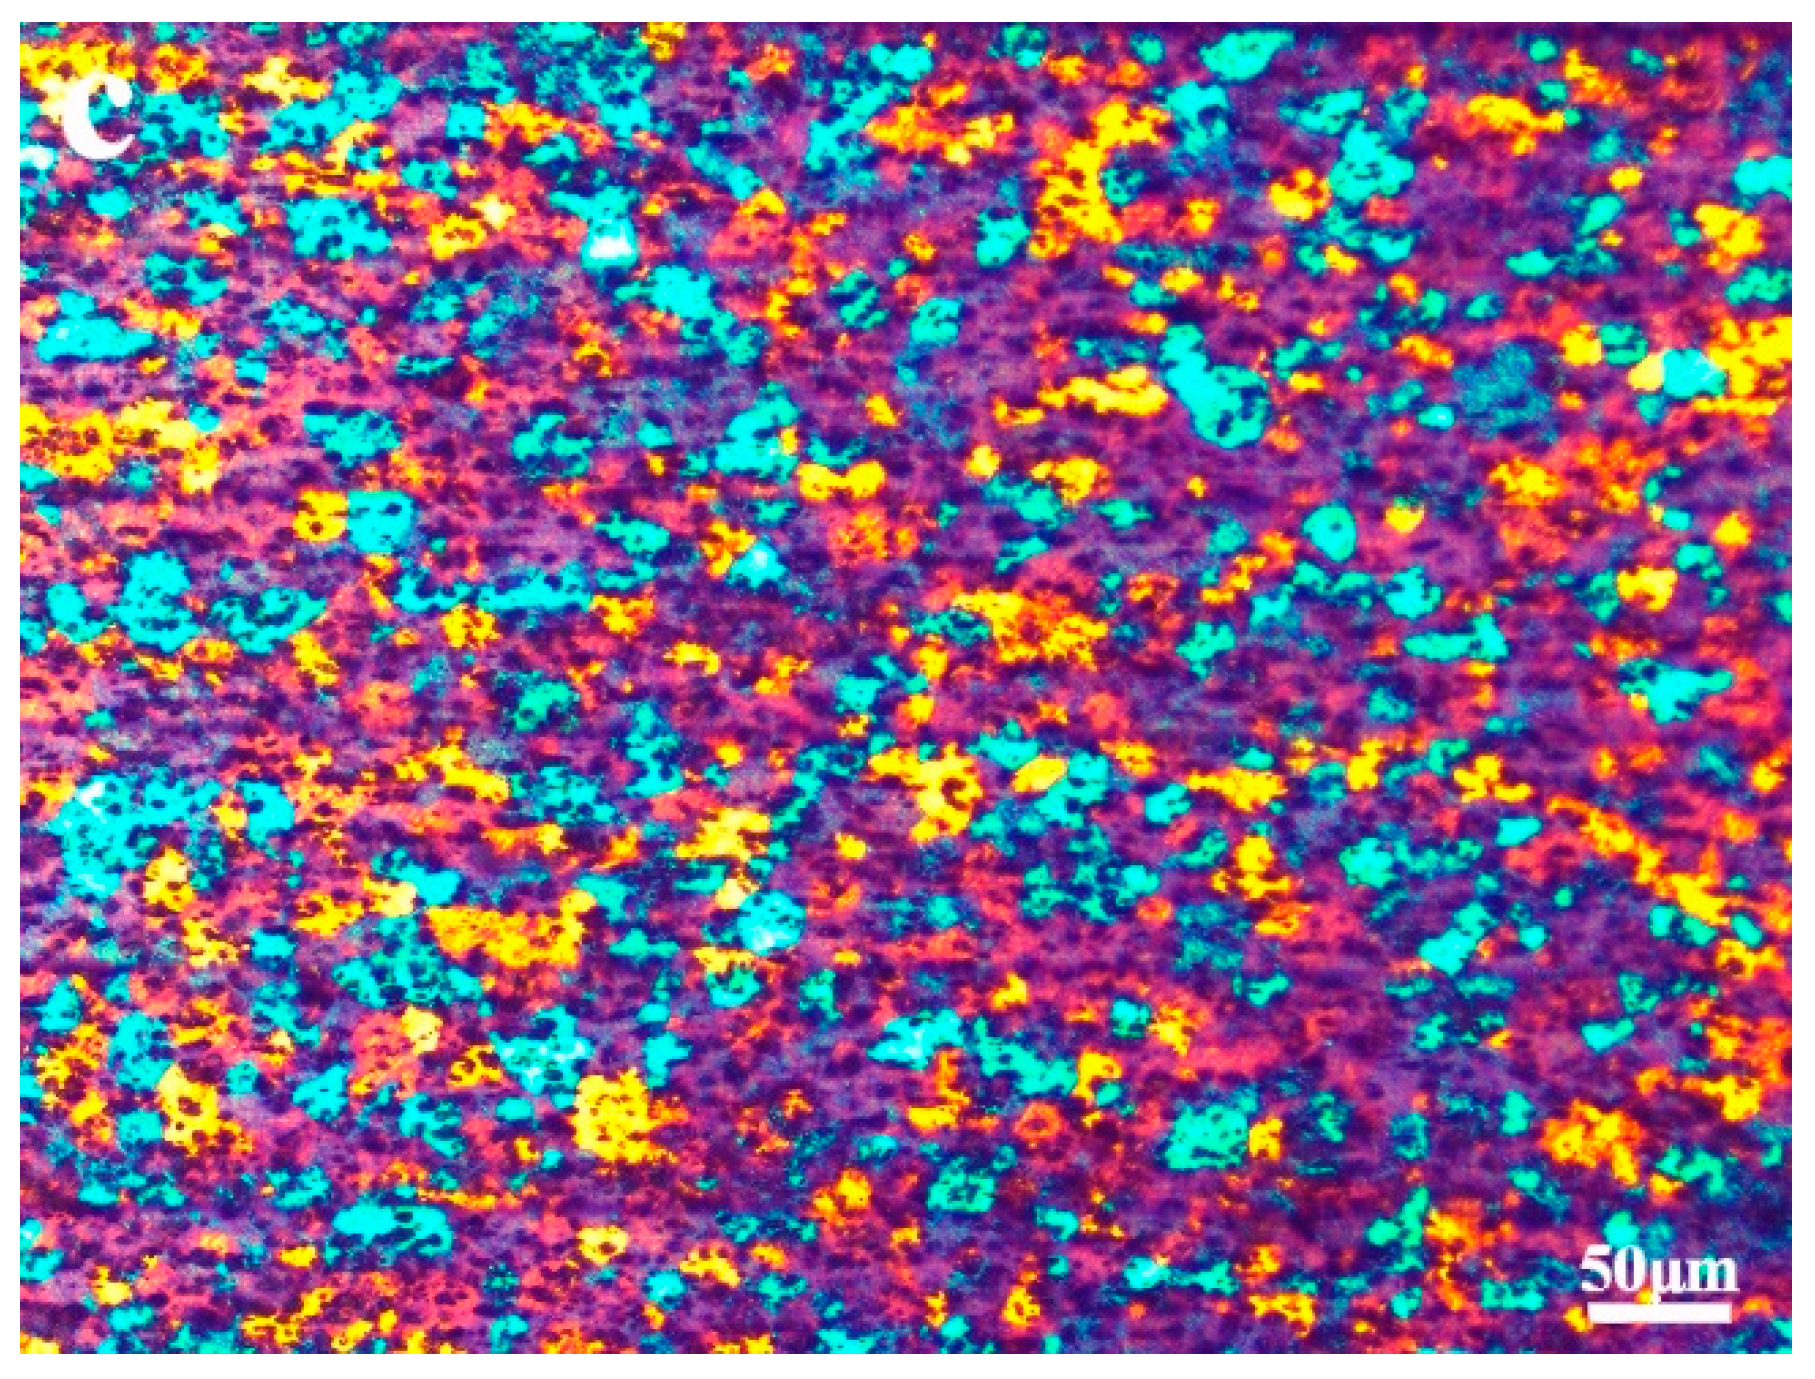
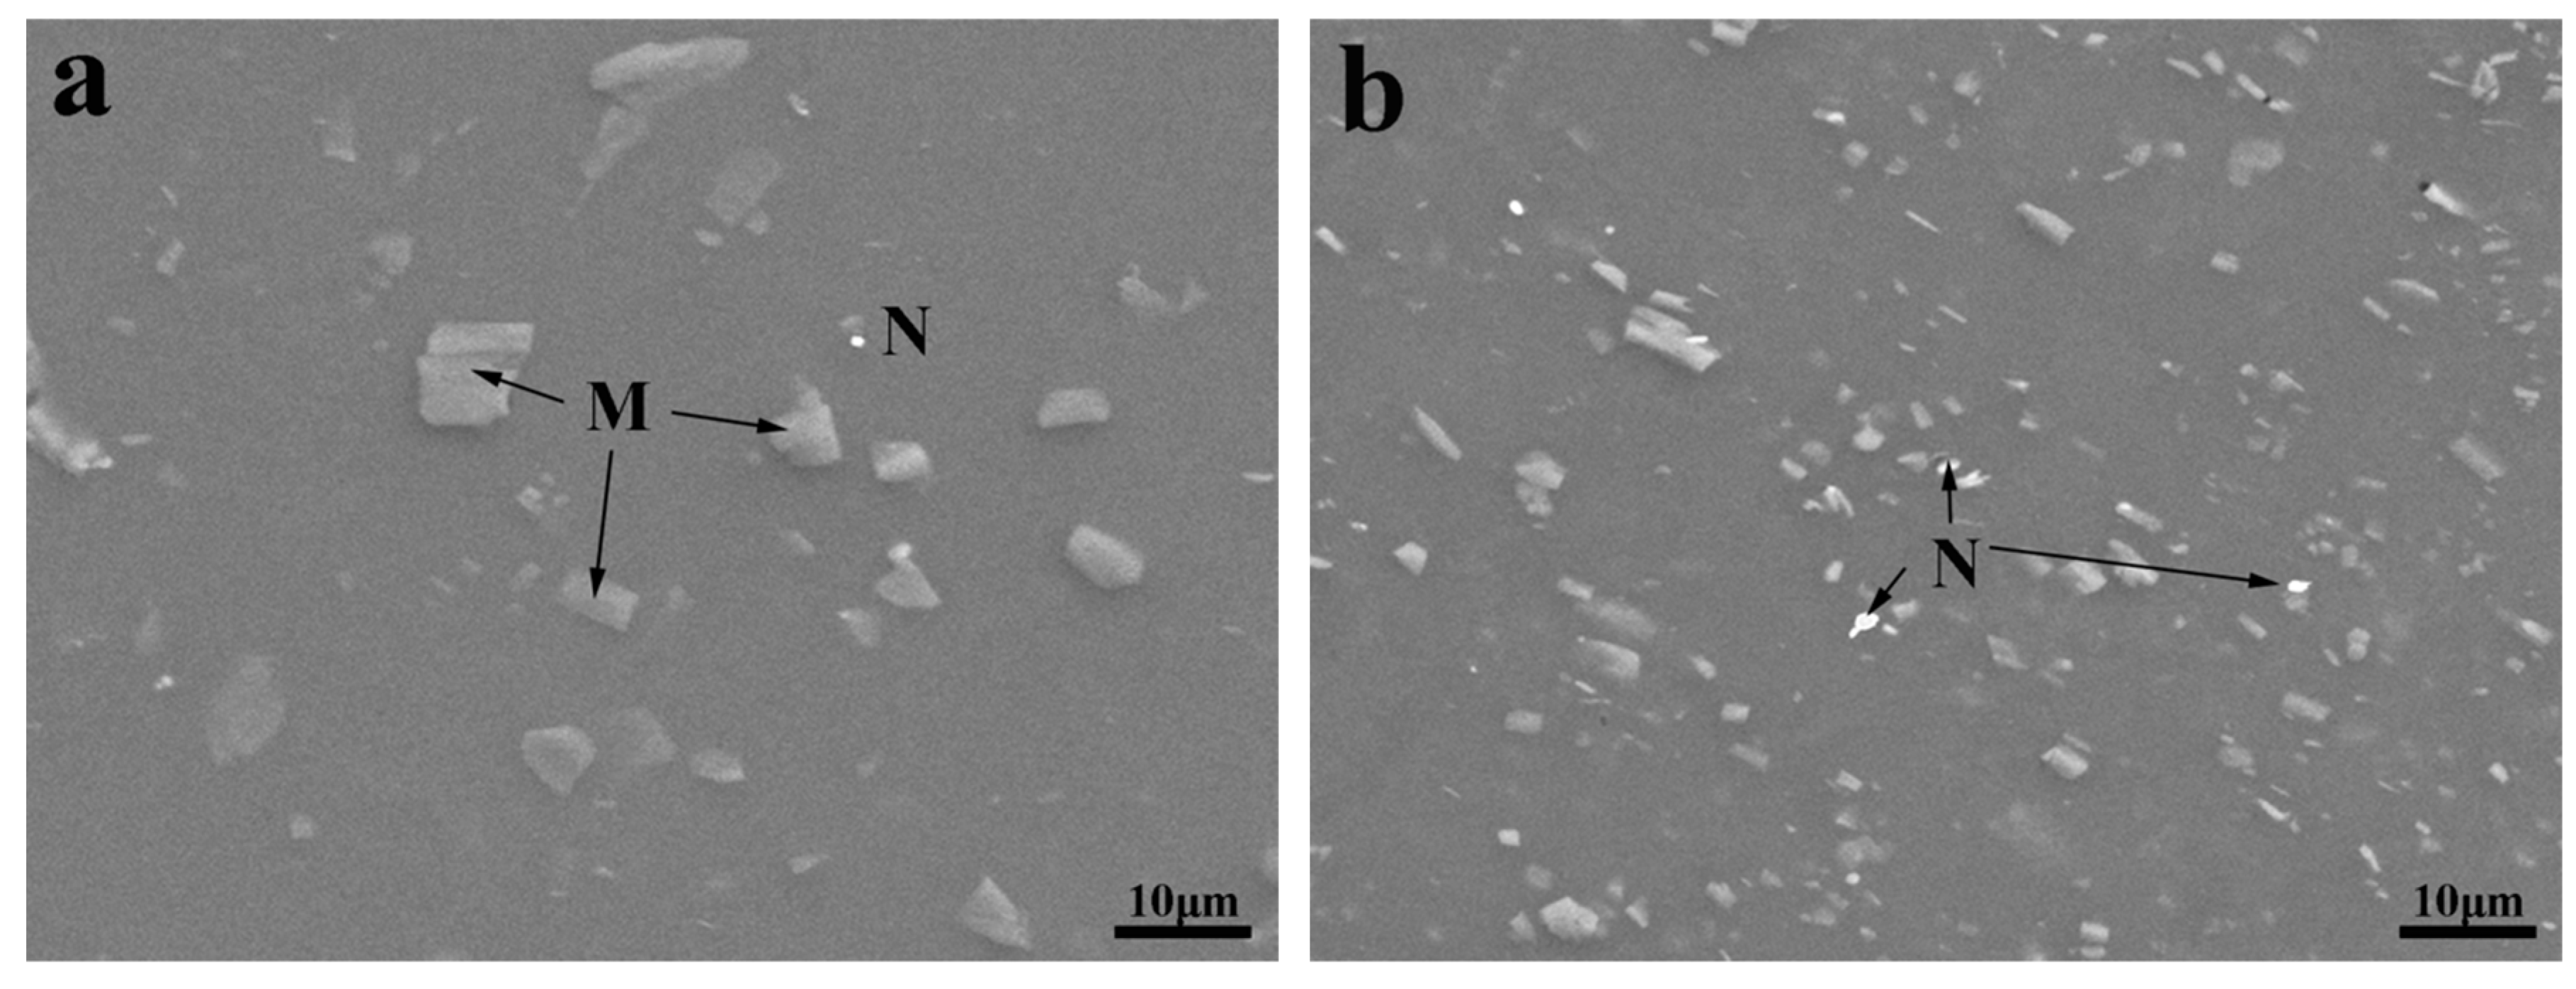
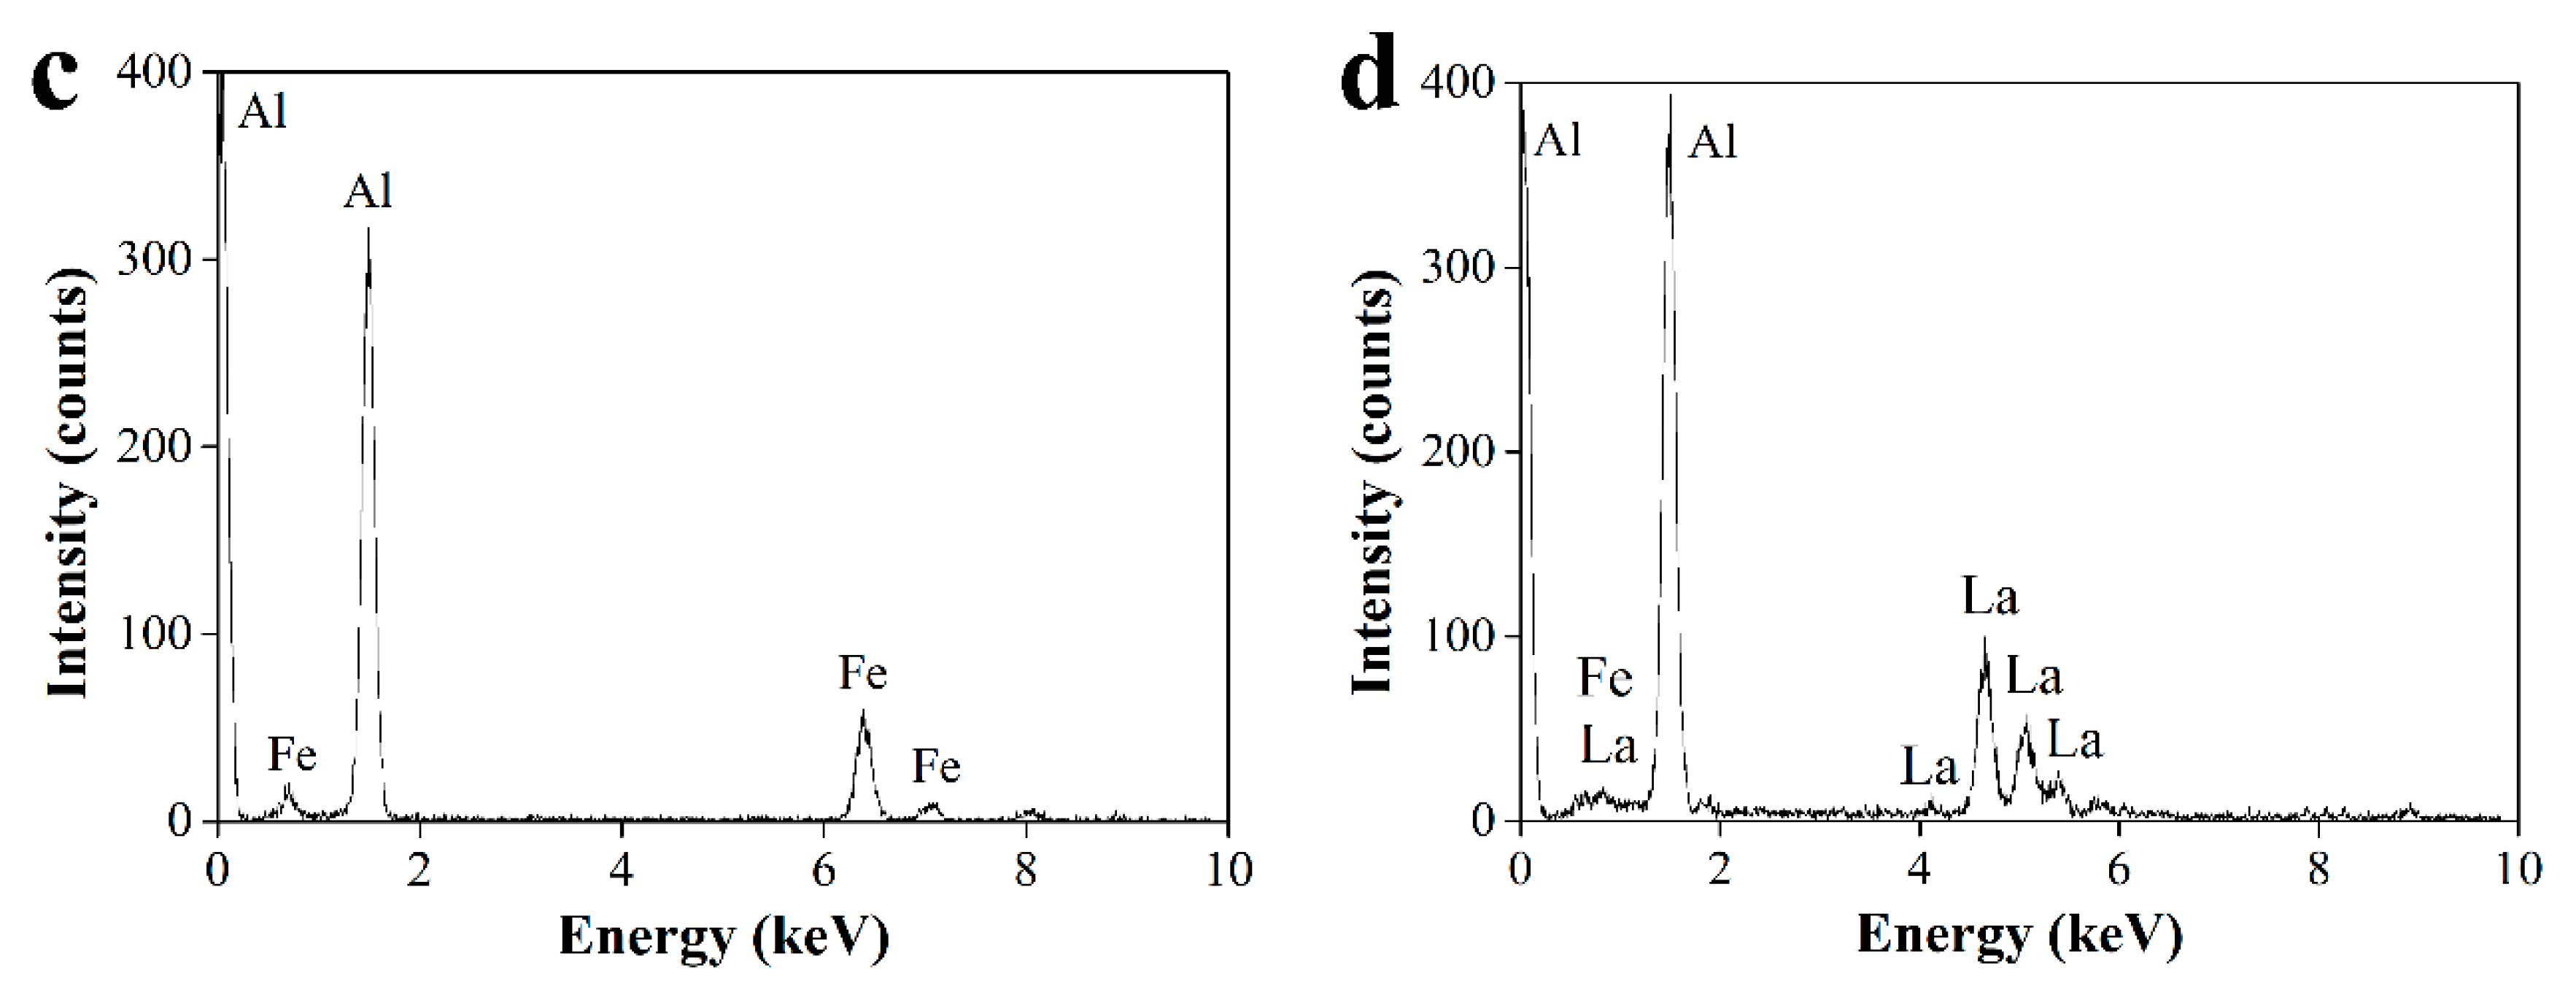
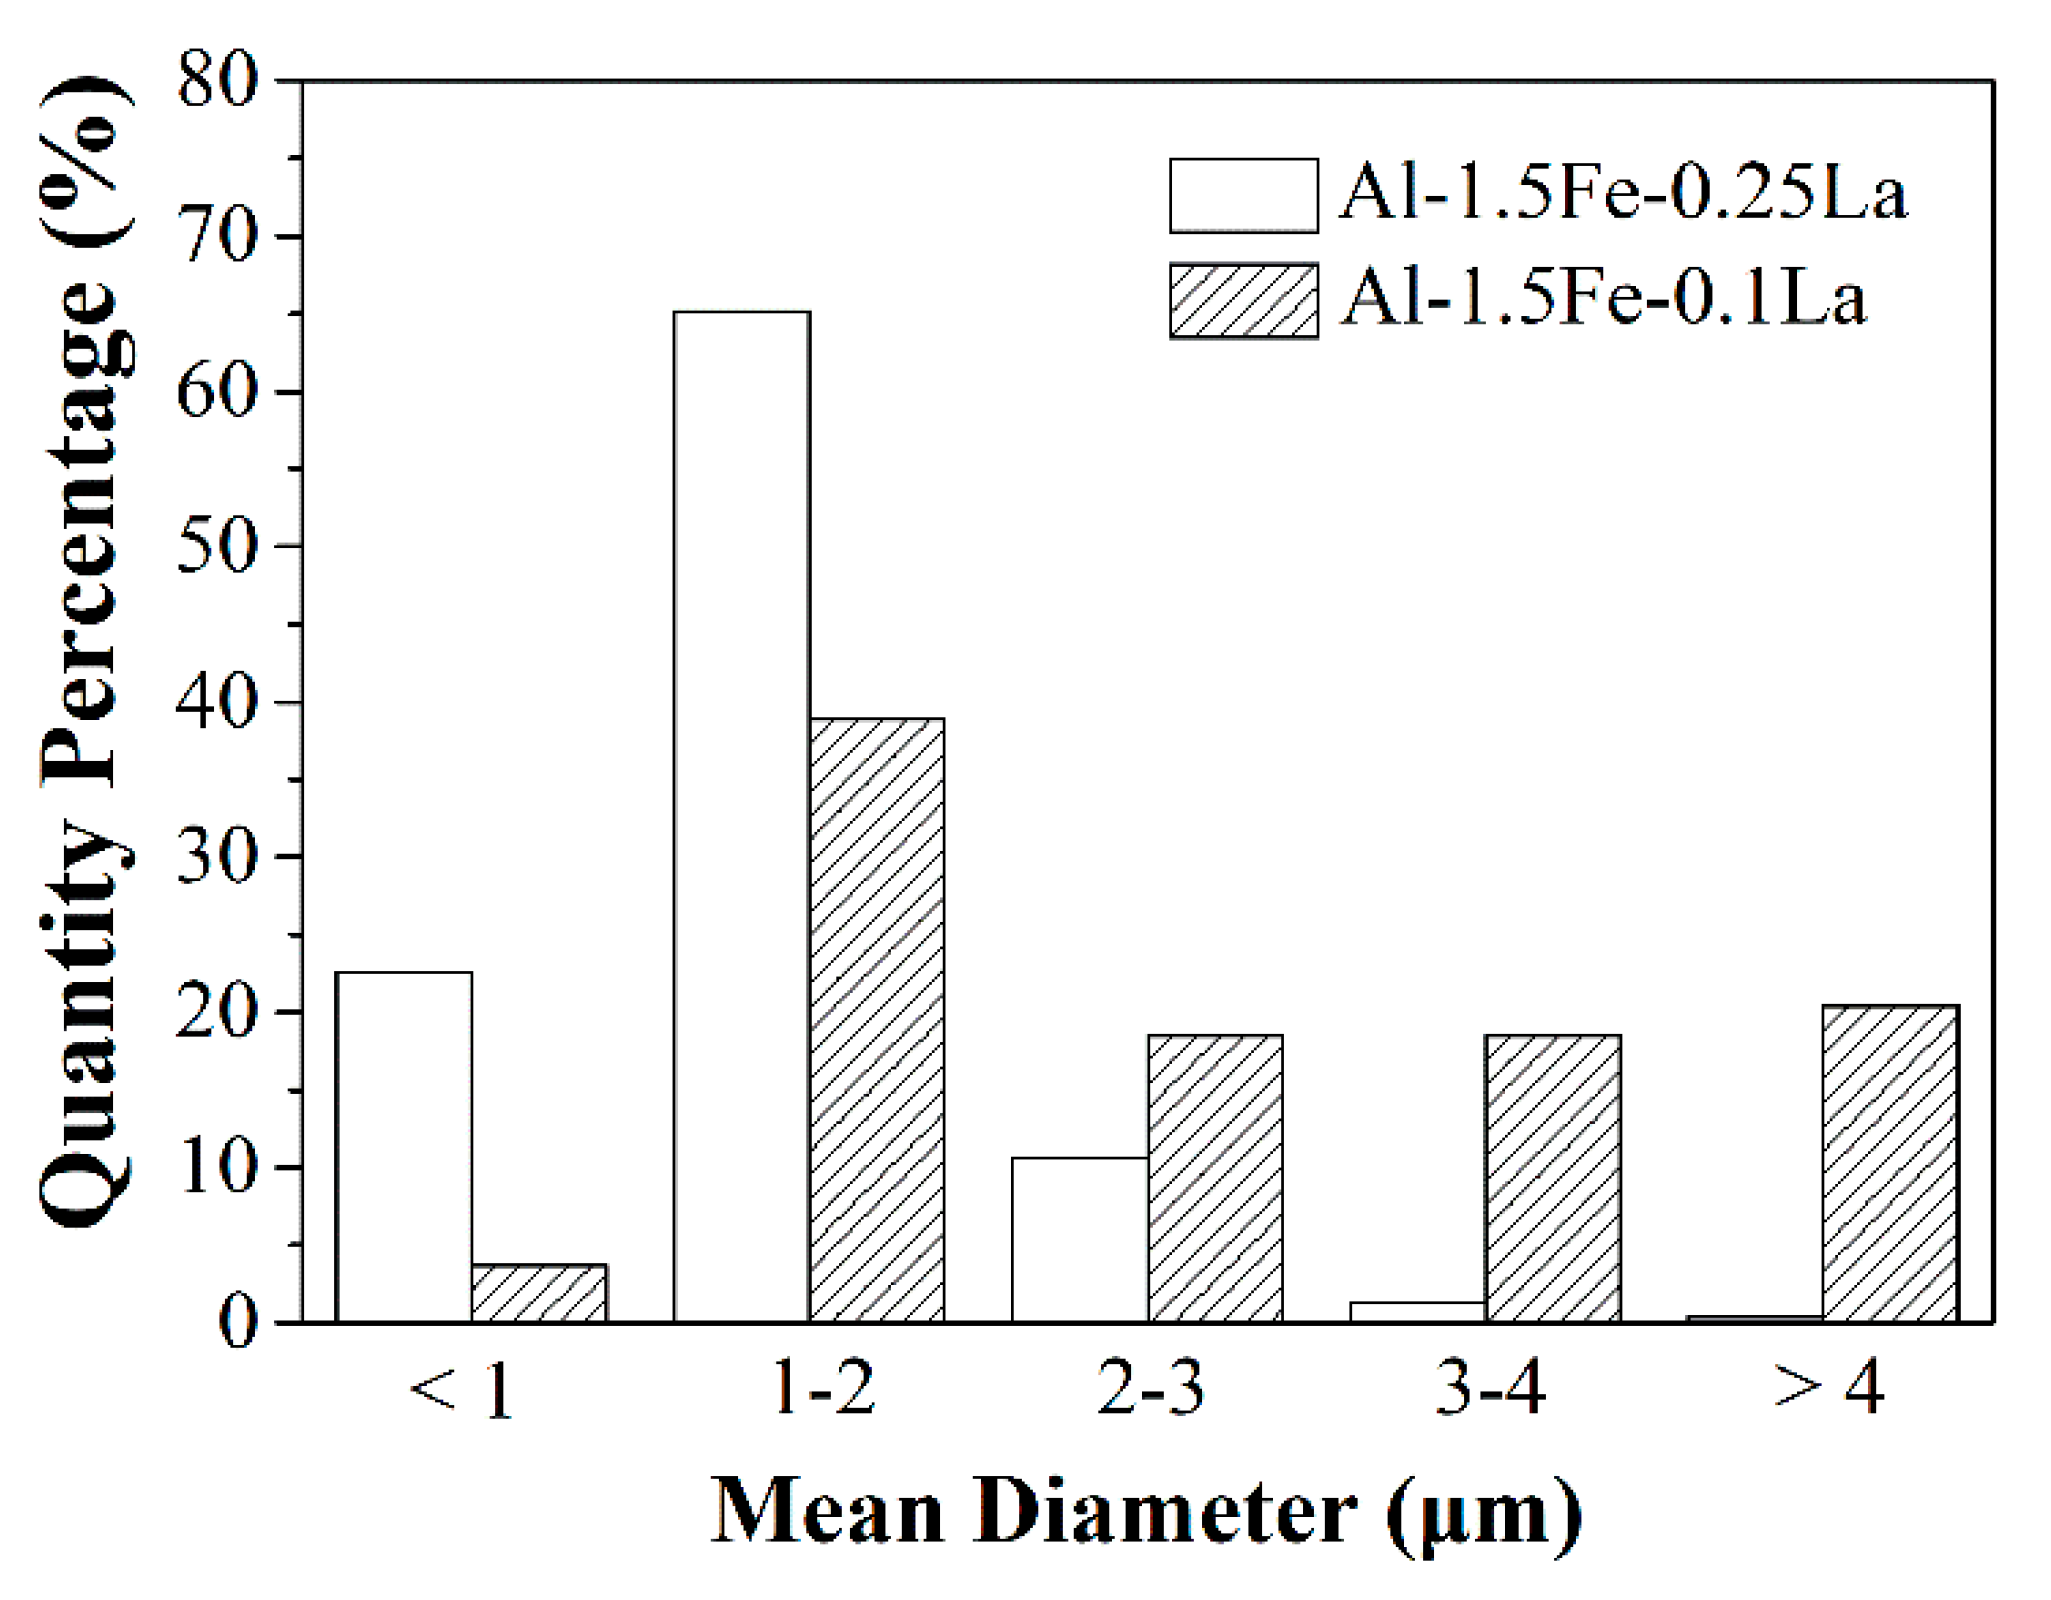
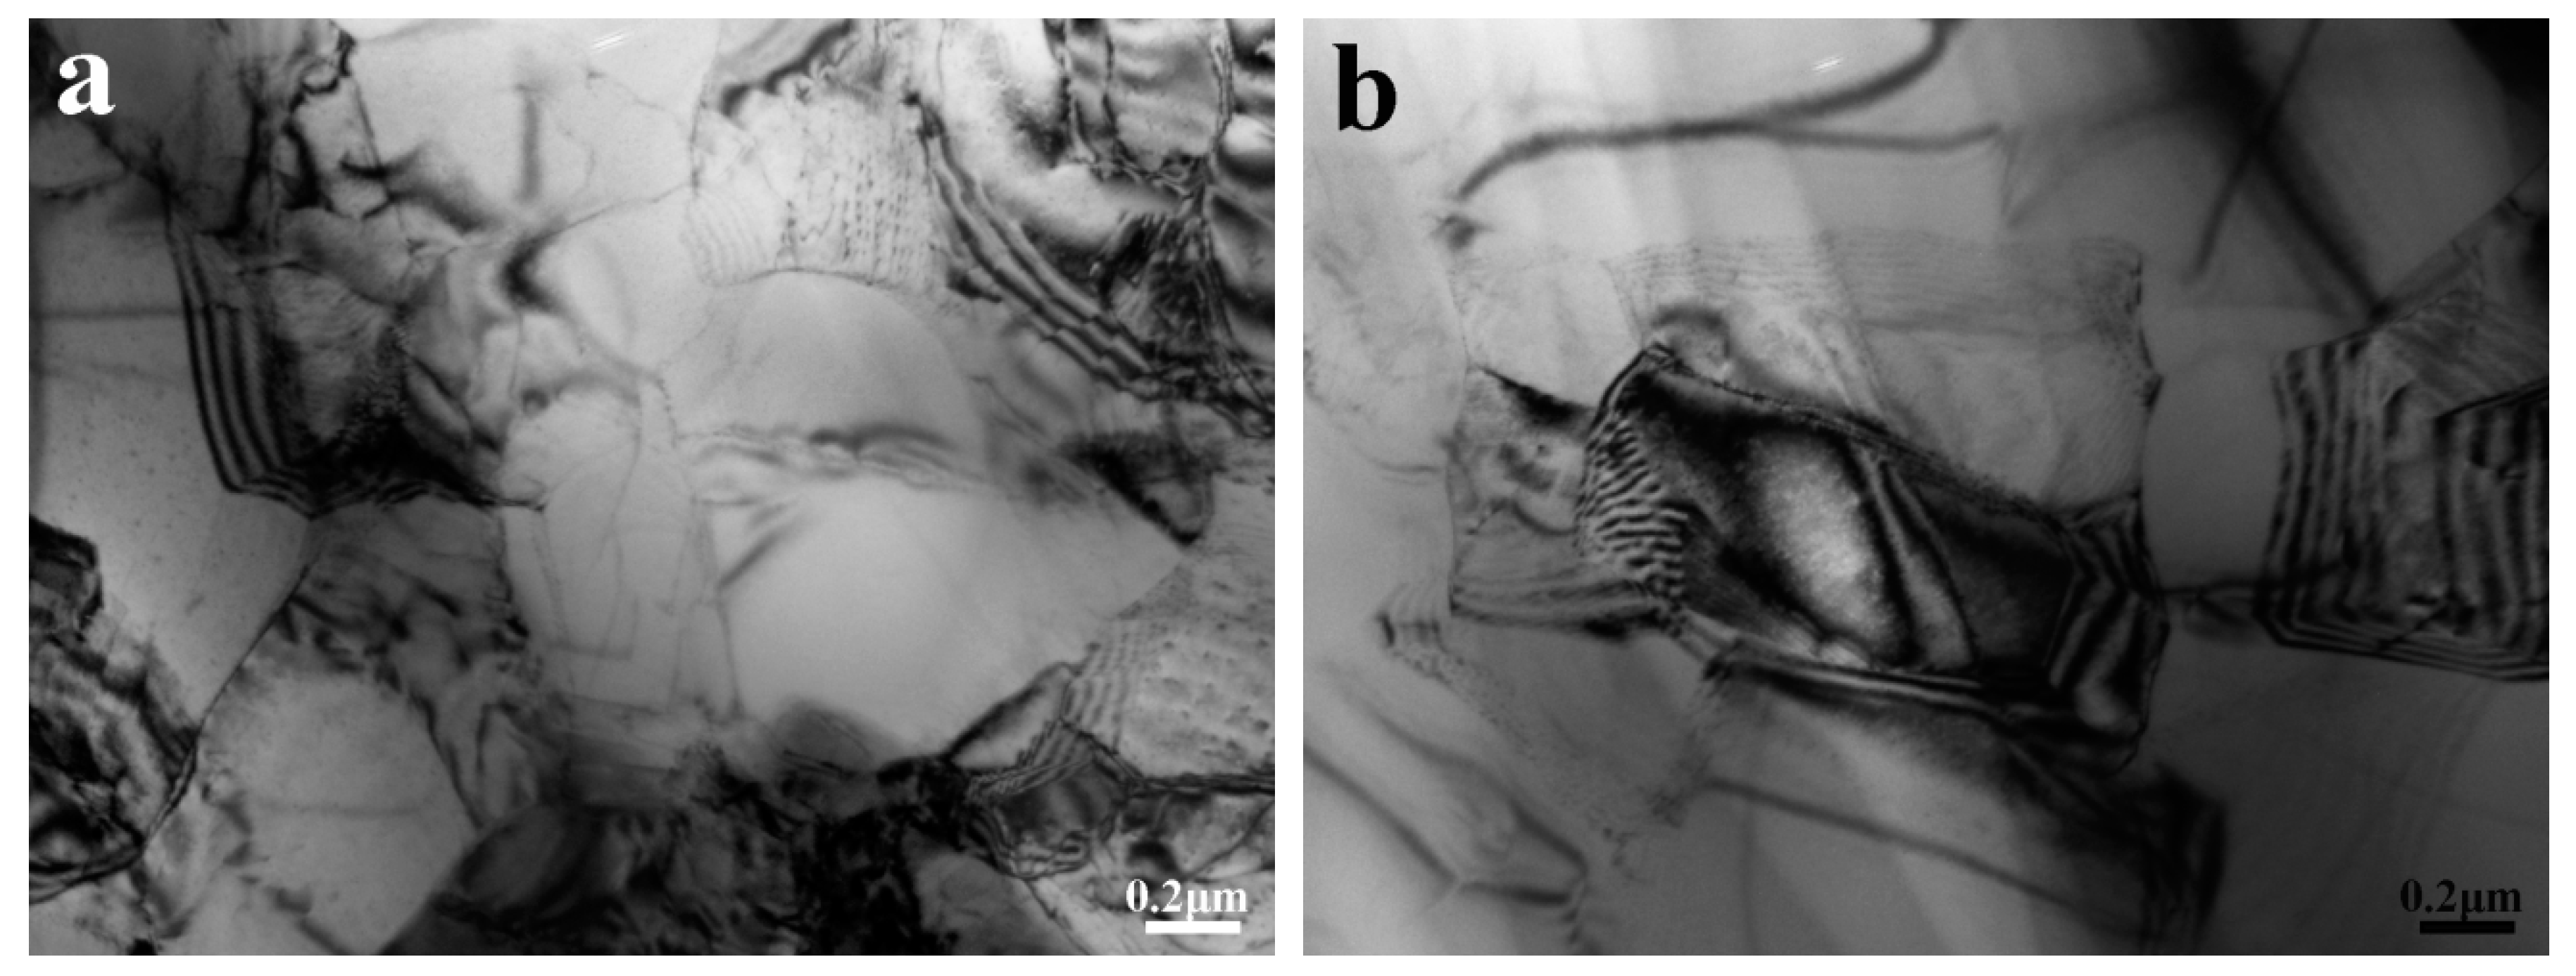
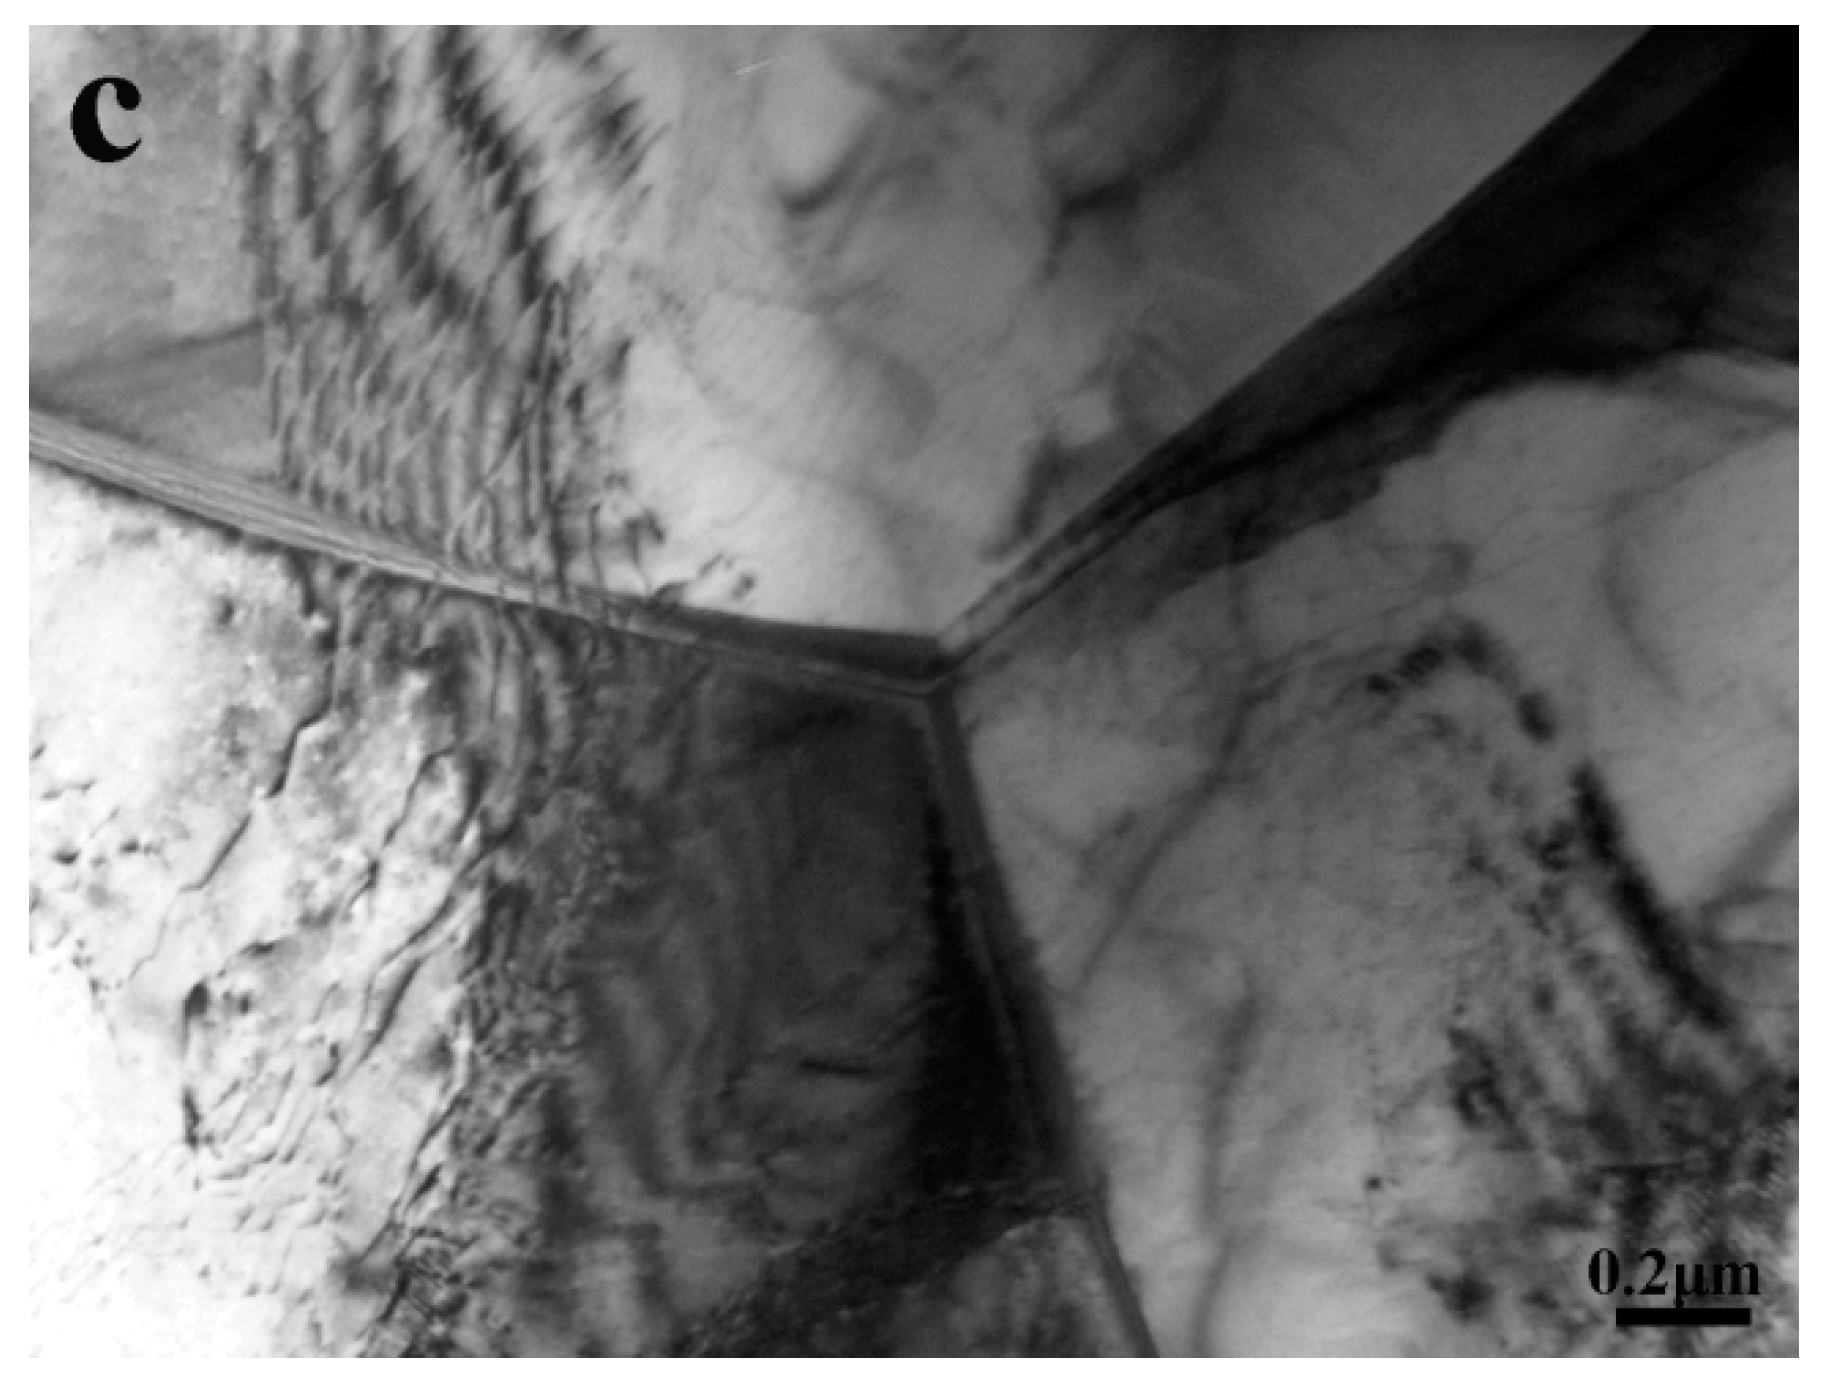
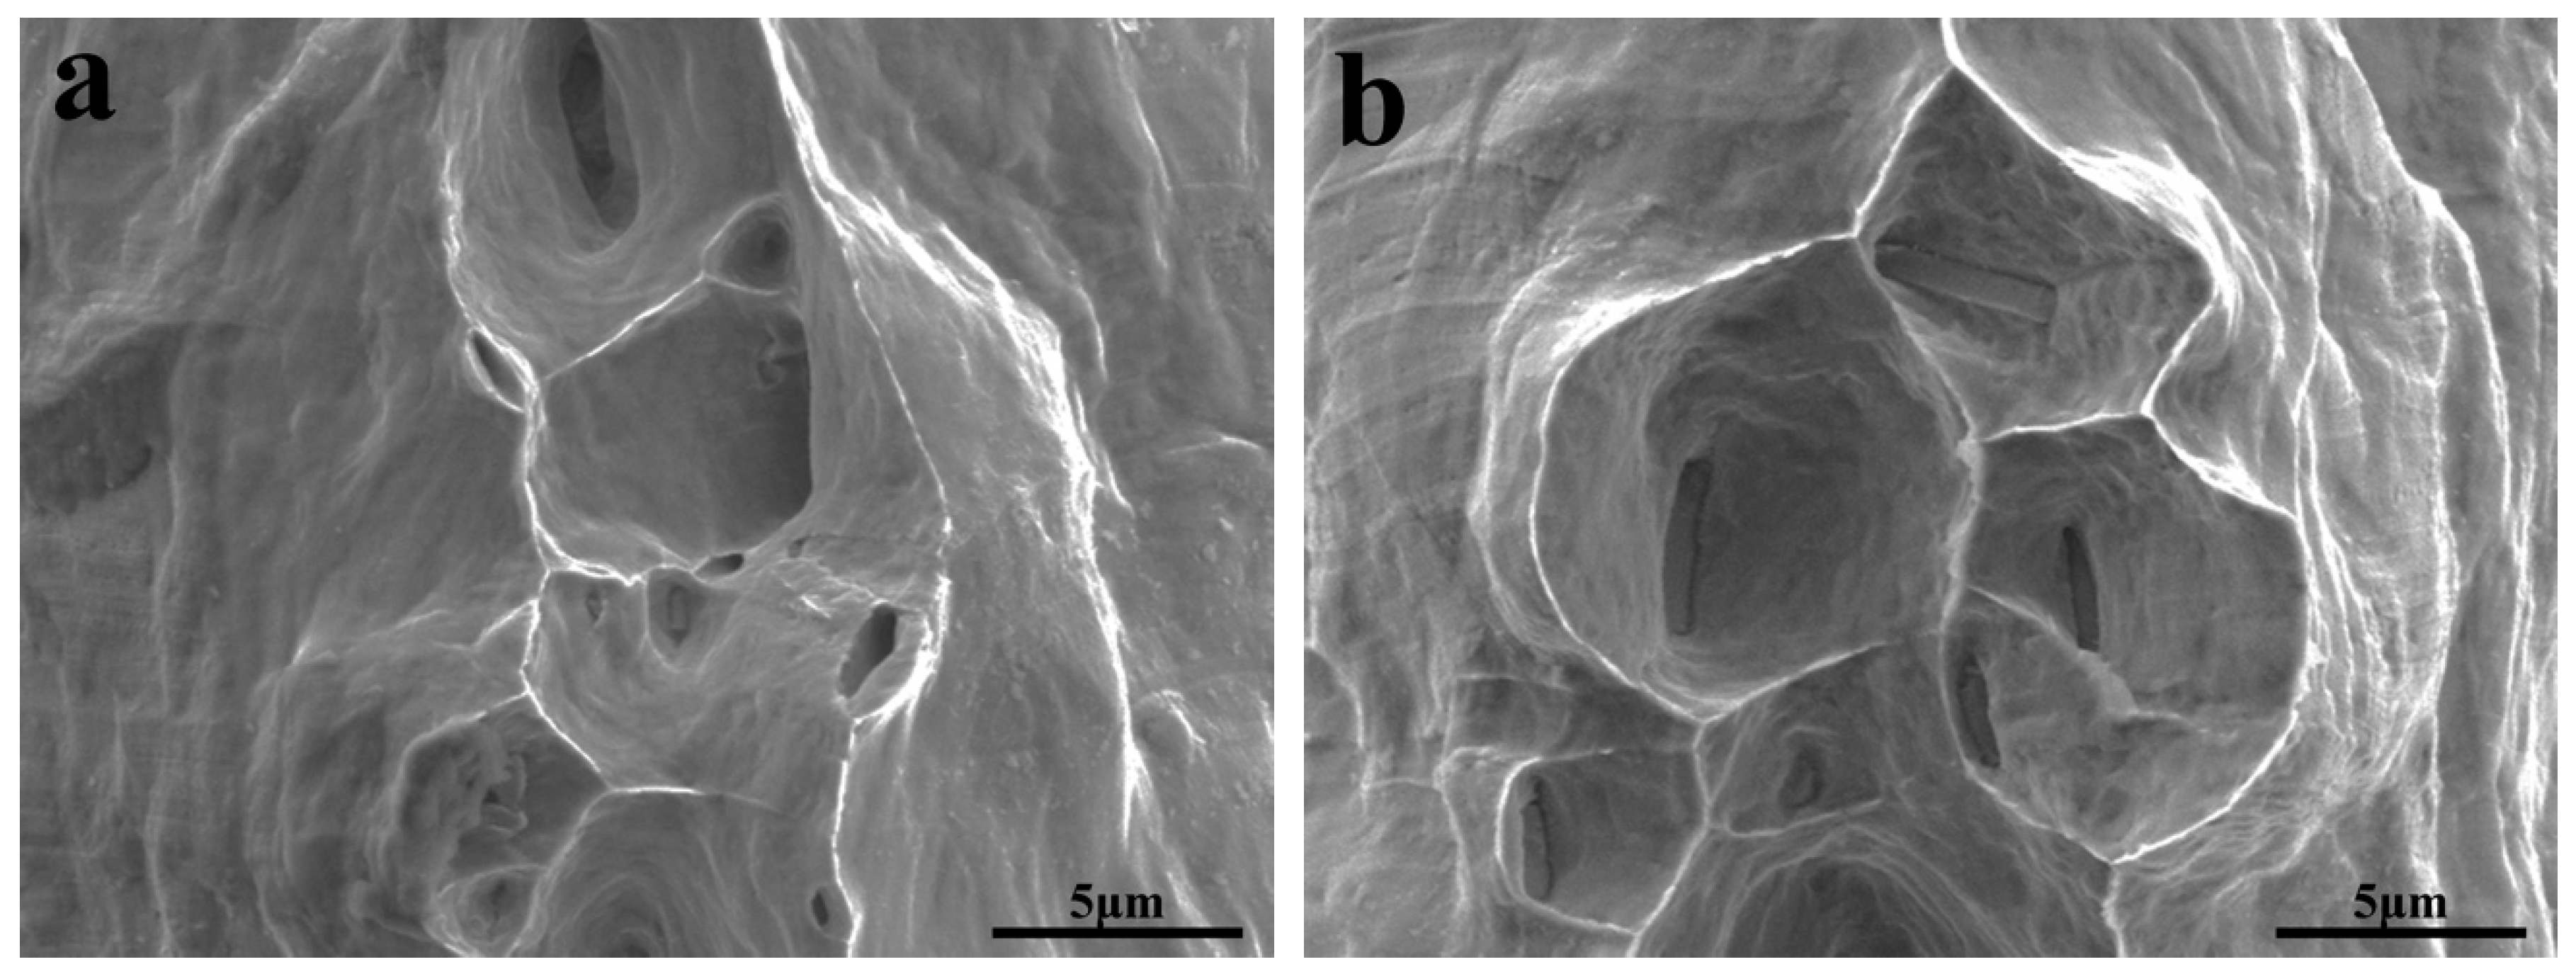
3.1. Microstructure Characterization

Figure 1 and Figure 2 show the longitudinal section microstructures of the Al-1.5Fe-0.1La and Al-1.5Fe-0.25La alloys annealed at different temperatures. The grains still presented with a slender fibrous shape after annealing at 200 °C (Figure 1a and Figure 2a), indicating only recovery rather than recrystallization. For the alloys annealed at 250 °C (Figure 1b and Figure 2b), the new equiaxed grains replaced the old elongated grains due to recrystallization. When the annealing temperature increased to 380 °C (Figure 1c and Figure 2c), finer equiaxed grains grew into coarse grains.
Figure 3 shows SEM images of the microstructure and second-phase particles of as-rolled Al-1.5Fe-0.1La and Al-1.5Fe-0.25La alloys. The short flake and rod-like particles (phase M) were an Fe-rich phase containing Al3Fe and Al6Fe. The bright particles (phase N) were an Al-Fe-La phase. The size distribution of the Fe-rich phase was statistically analyzed by Image Pro Plus (IPP, version 6.0, Media Cybernetics, Inc. Rockville, MD, USA) software (Figure 4). Compared to the Al-1.5Fe-0.1La alloy, a larger number of AlFeLa particles and Fe-rich particles with a smaller size existed in the Al-1.5-0.25La alloy. Statistical analysis showed that the quantity percentages of the Fe-rich phase (for a diameter less than 1 μm) for the alloys with a 0.1 wt % addition of La and a 0.25 wt % addition of La were 3.7% and 22.6%, respectively. Some very large particles occurred in Al-1.5Fe-0.1La, while there were few in the Al-1.5-0.25La alloy. This indicated that the Fe-rich particles could be greatly refined by a 0.25 wt % addition of La. Due to the larger atomic radius of La, La can hardly dissolve in α-Al or substitute Al, Fe atoms. During the nucleation and growth of α-Al, Fe and La enriched in the growth front, resulting in local constitutional supercooling. Fe-rich and La-rich particles occurred during the solidification process. The constitutional supercooling effect not only refined the grains and Fe-rich particles, but also modified the morphology and composition of the Fe-rich phase by forming AlFeLa compounds [6,15,16].
Second-phase particles had a strong effect on the recrystallization of Al alloys. Large particles (>1 μm) generally accelerated recrystallization by particle stimulated nucleation (PSN) [17,18], while finely dispersed precipitates strongly retarded recrystallization. Grains of Al alloy with single large particles were prone to grow up during annealing, while alloys containing both large and small particles could get fine grains under the mutual effect of PSN and the retardation of recrystallization. Compared to the Al-1.5Fe-0.25La alloy, Fe-rich particles with a small size hardly existed in the Al-1.5Fe-0.1La alloy. Thus, the grain size of the alloy with a 0.1 wt % addition of La was larger than that of the 0.25 wt % La-containing alloy after a recrystallization annealing.
TEM images of the Al-1.5Fe-0.1La alloy annealed at different temperatures are shown in Figure 5. After annealing at 200 °C, the alloy contained network dislocation (Figure 5a). With an increase of the annealing temperature to 250 °C, recrystallized grains were observed (Figure 5b). After annealing at 380 °C, triple junctions [19] were observed, indicating recrystallization was complete and the grains had grown up (Figure 5c).

3.2. Mechanical Properties

The tensile properties of the longitudinal direction of the Al-1.5Fe-xLa alloys and AA8021 are shown in Table 1. Compared to traditional AA8021 [20], Al-1.5Fe-xLa alloys had higher tensile strength and elongation. Local compositional supercooling caused by the addition of La resulted in refined Fe-rich particles and the formation of AlFeLa particles, thus improving the mechanical properties of the alloy. After annealing at 250 °C, with the increase of the addition of La from 0.1 wt % to 0.25 wt %, the σ0.2/σb of alloys decreased by 20.5% and the elongation increased by 14.4%. Low σ0.2/σb and high elongation were conductive to formability, indicating that a higher addition of La could improve the comprehensive mechanical properties of the Al-Fe alloy. With a 0.25% addition of La, Fe-rich particles with a smaller size and a rod-like shape formed, which was conductive to the mechanical properties of the alloy.
Figure 6 shows SEM images of the fracture surfaces of the tensile samples. Submicrometer-sized dimples with rod-like Fe-rich particles at the bottom of some dimples were found at the fracture surfaces, indicating that both alloys presented ductile fracture under tensile testing. Since the Fe-rich phase was a brittle compound, it could shear the matrix when undergoing deformation and become the nucleation point for the dimples. With a large addition of La, the size of the Fe-rich phase decreased and the shape of the phase tended to be rod-like. Thus the 0.25 wt % La-containing alloy presented better mechanical properties.

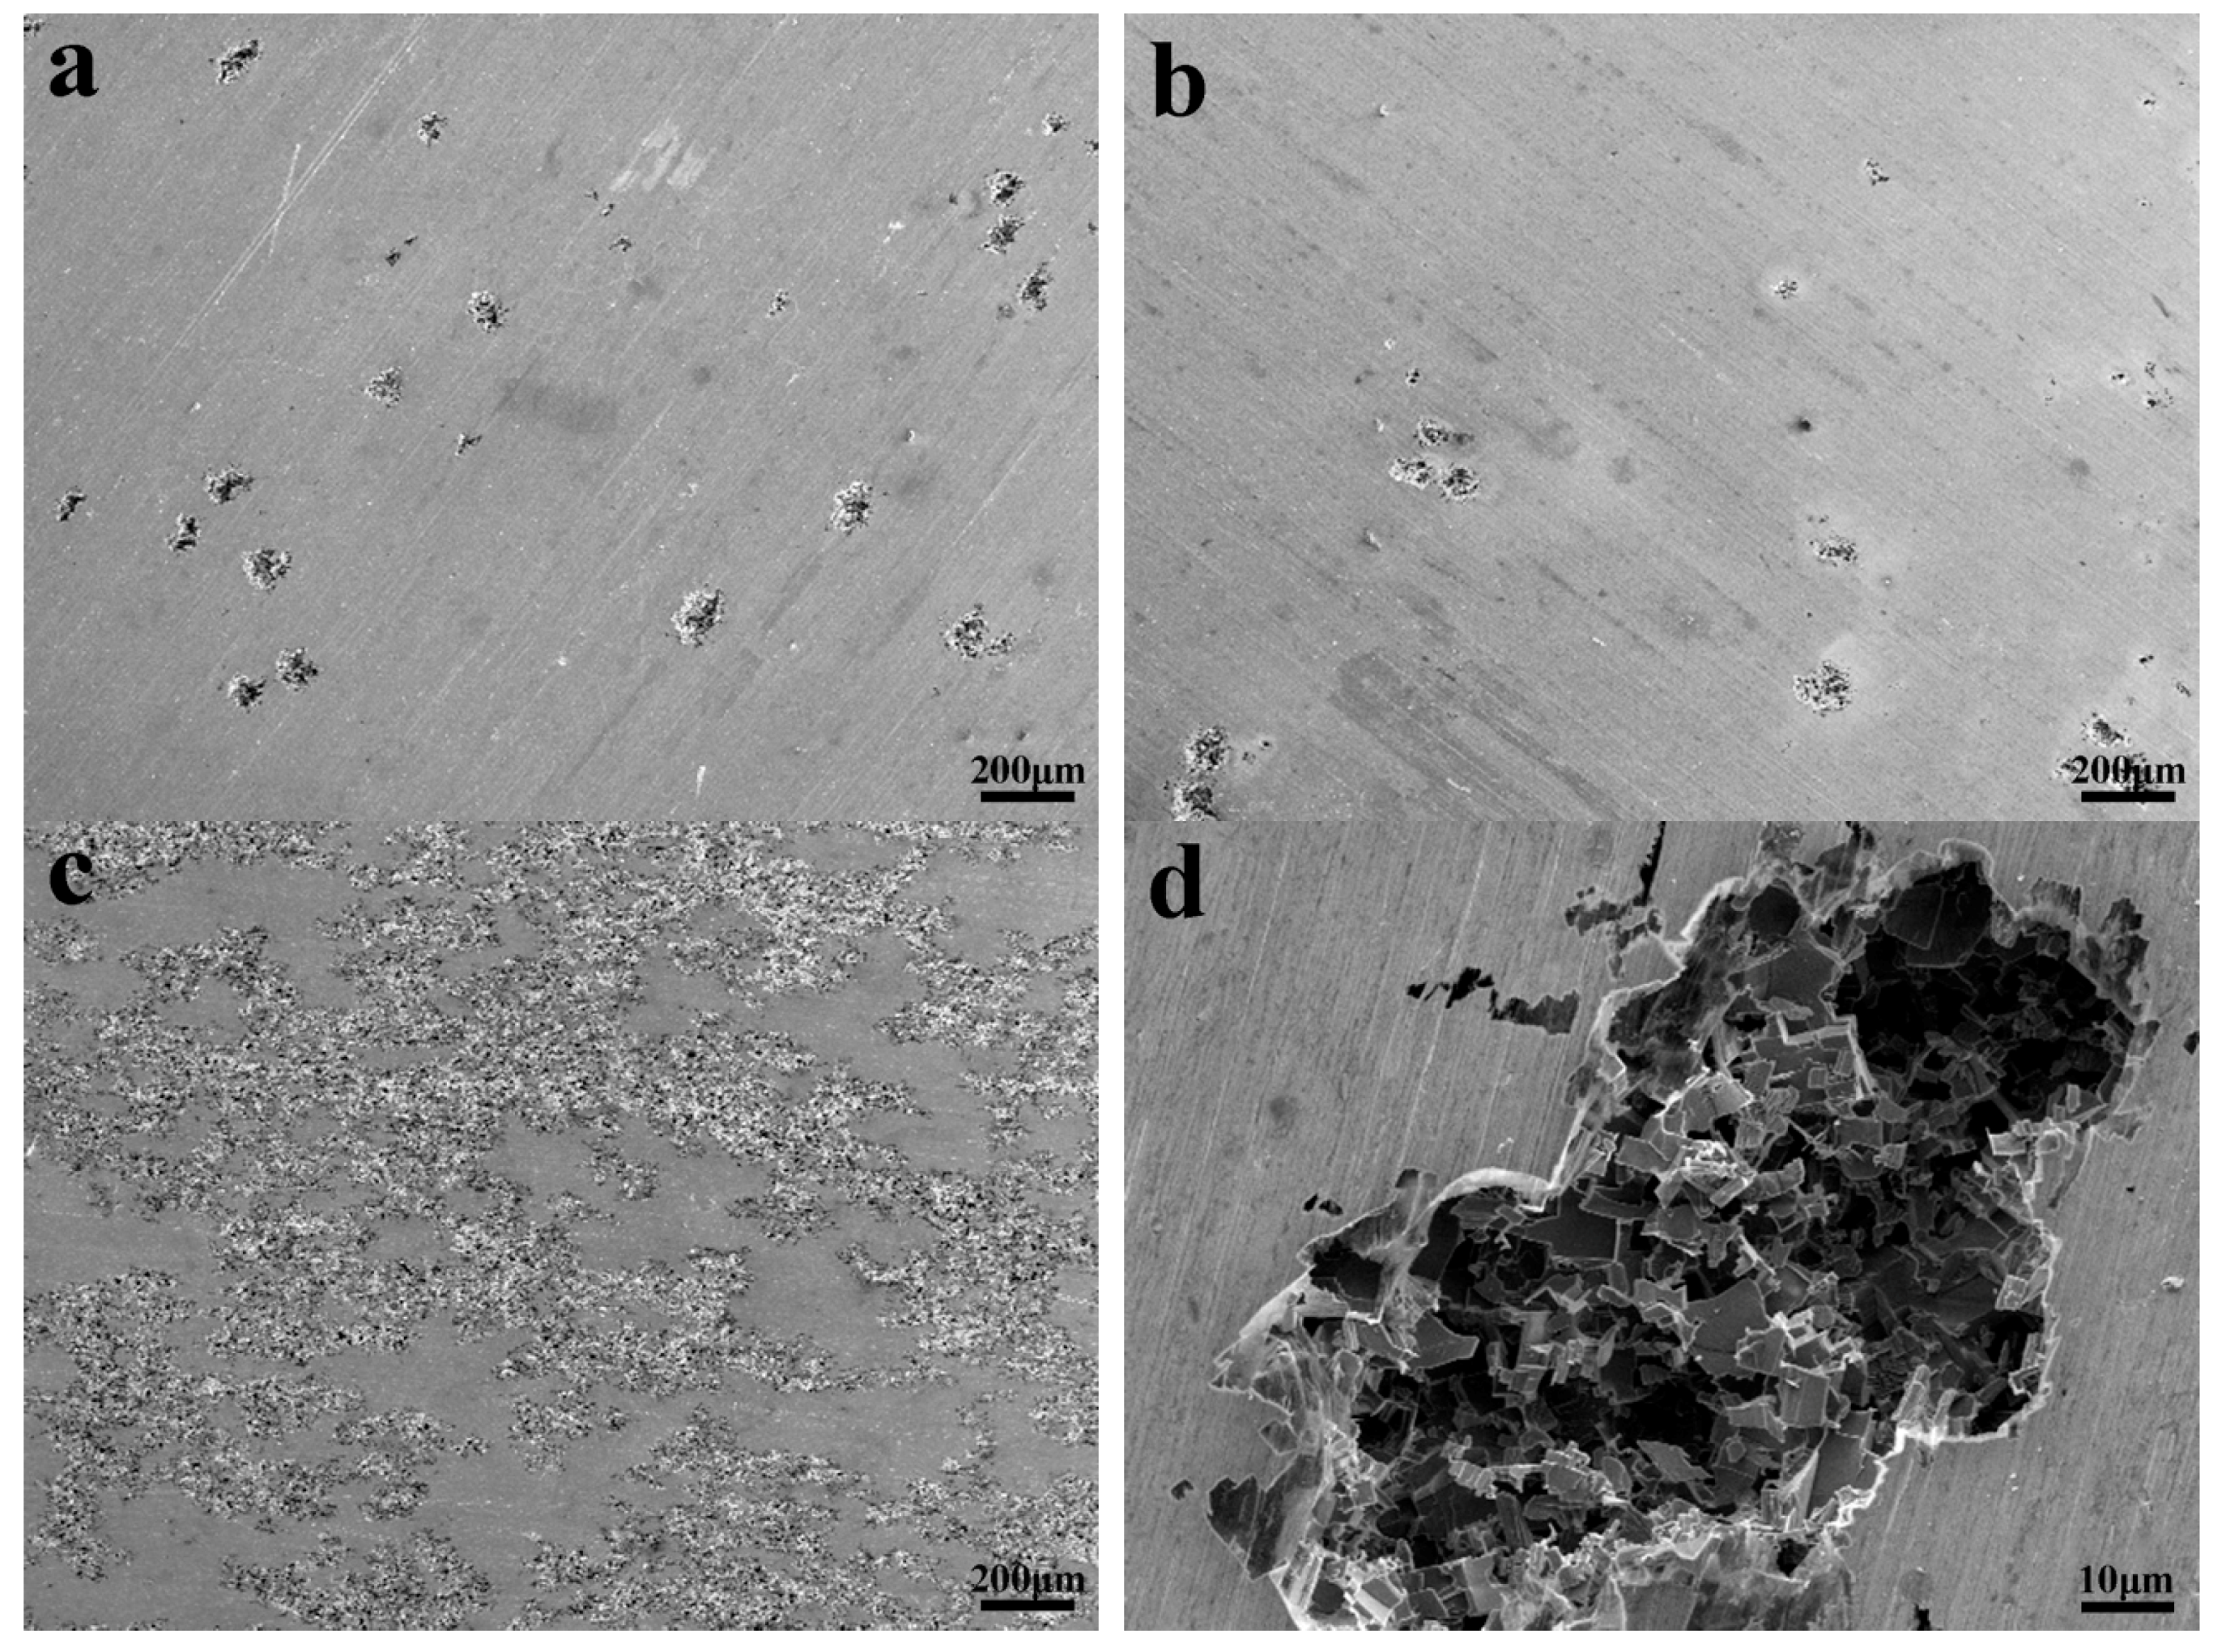
3.3. Corrosion Behavior

3.3.1. Polarization Analysis

Figure 7 shows the typical polarization curves of the as-annealed Al-1.5Fe-0.1La alloy and Al-1.5Fe-0.25La alloy tested in 3.5% NaCl solution. The corrosion potential (Ecorr) and corrosion current density (Icorr) presented in Table 2 were determined from Tafel polarization curves using Tafel analysis [21]. The polarization curves for both alloys displayed a similar shape (i.e., typical characteristic E–I behavior of aluminum alloys). The lower the Ecorr is, the easier it is for the alloy to become corroded. Icorr indicates the degree of corrosion [22]. The Al-1.5Fe-0.25La alloy had more positive Ecorr and lower Icorr compared to the Al-1.5Fe-0.1La alloy, indicating that a higher addition of La could improve the corrosion properties of the Al-Fe alloy. For both alloys, an increase in annealing temperature from 200 to 250 °C could make the Ecorr shift positively and lead to a lower Icorr. However, as the temperature continued to increase to 380 °C, the Ecorr was significantly lower and Icorr increased. This suggested that a proper annealing temperature would enhance the corrosion resistance of the Al-Fe-La alloy.
Figure 8 and Figure 9 show the surface morphology of the Al-1.5Fe-0.1La alloy and Al-1.5Fe-0.25La alloy with a different annealing temperature after the polarization test in 3.5% NaCl solution. Pitting holes with similar morphology were observed on the surface of all of the alloys. Fe-rich second-phase particles were found in the interior of the pit hole surrounded by a dissolved Al matrix [23,24]. Due to the difference in corrosion potential between the Fe-rich intermetallic phases and the matrix, corrosion pits preferred to initiate at the site of Fe-rich second-phase particles. Al3Fe particles that acted as local cathodes enhanced the cathodic reaction [25,26,27], resulting in local alkalization near Fe-rich sites. As a result, the Al host matrix dissolved preferentially near Fe-rich second-phase particles. With the increase of the addition of La from 0.1 wt % to 0.25 wt %, the number of pitting holes sharply decreased, suggesting a slighter corrosion degree. Compared to 200 °C and 380 °C, the Al-Fe-La alloy annealed at 250 °C had the smallest number of pitting holes, indicating that proper annealing temperature could improve the corrosion property of the Al-Fe-La alloy. This is consistent with the result of our Tafel polarization curve.

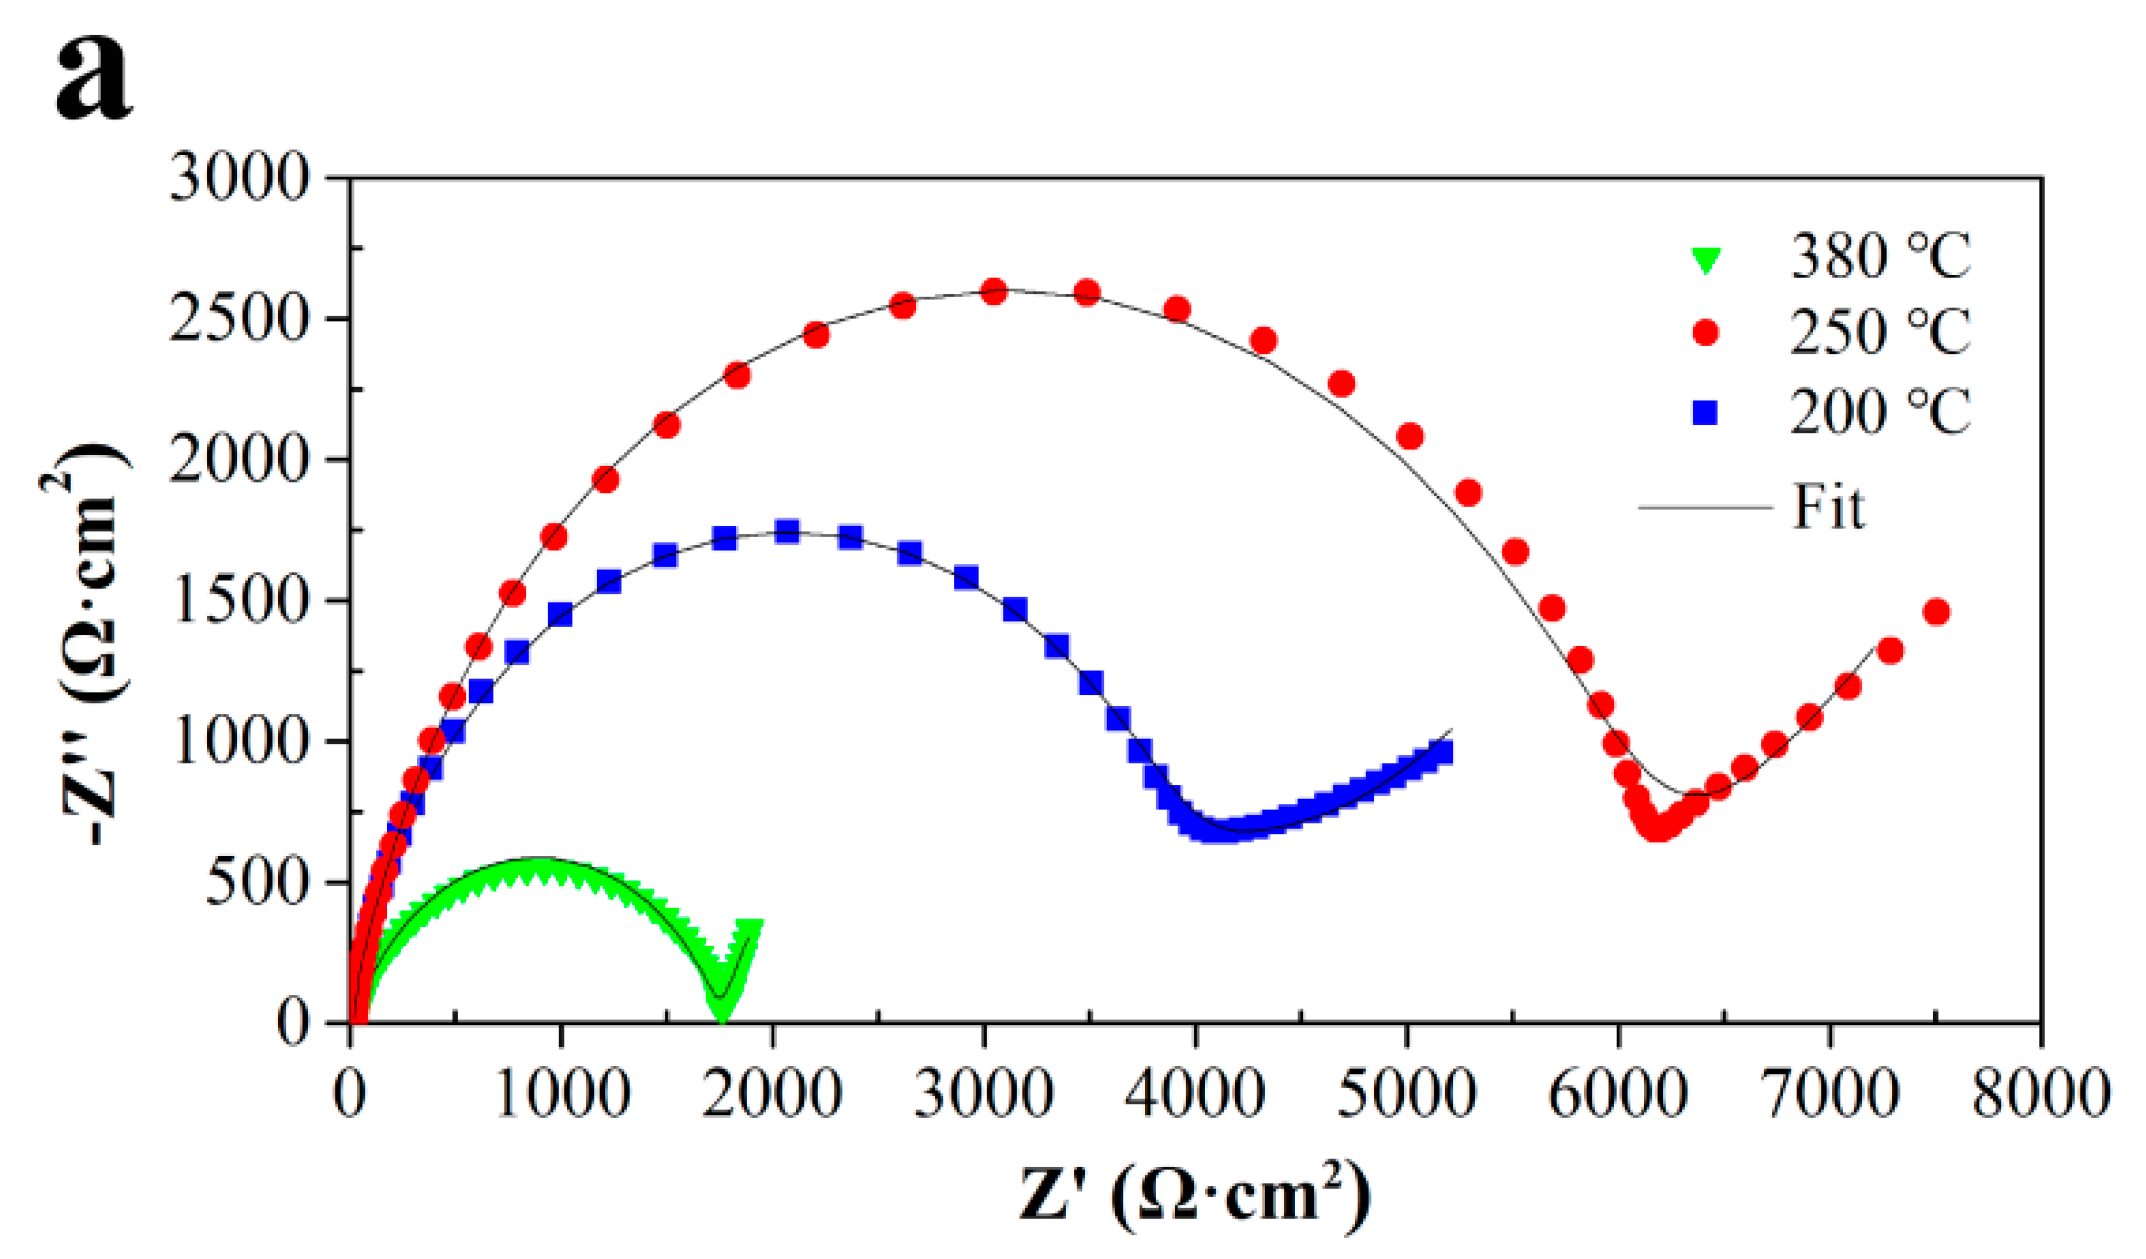
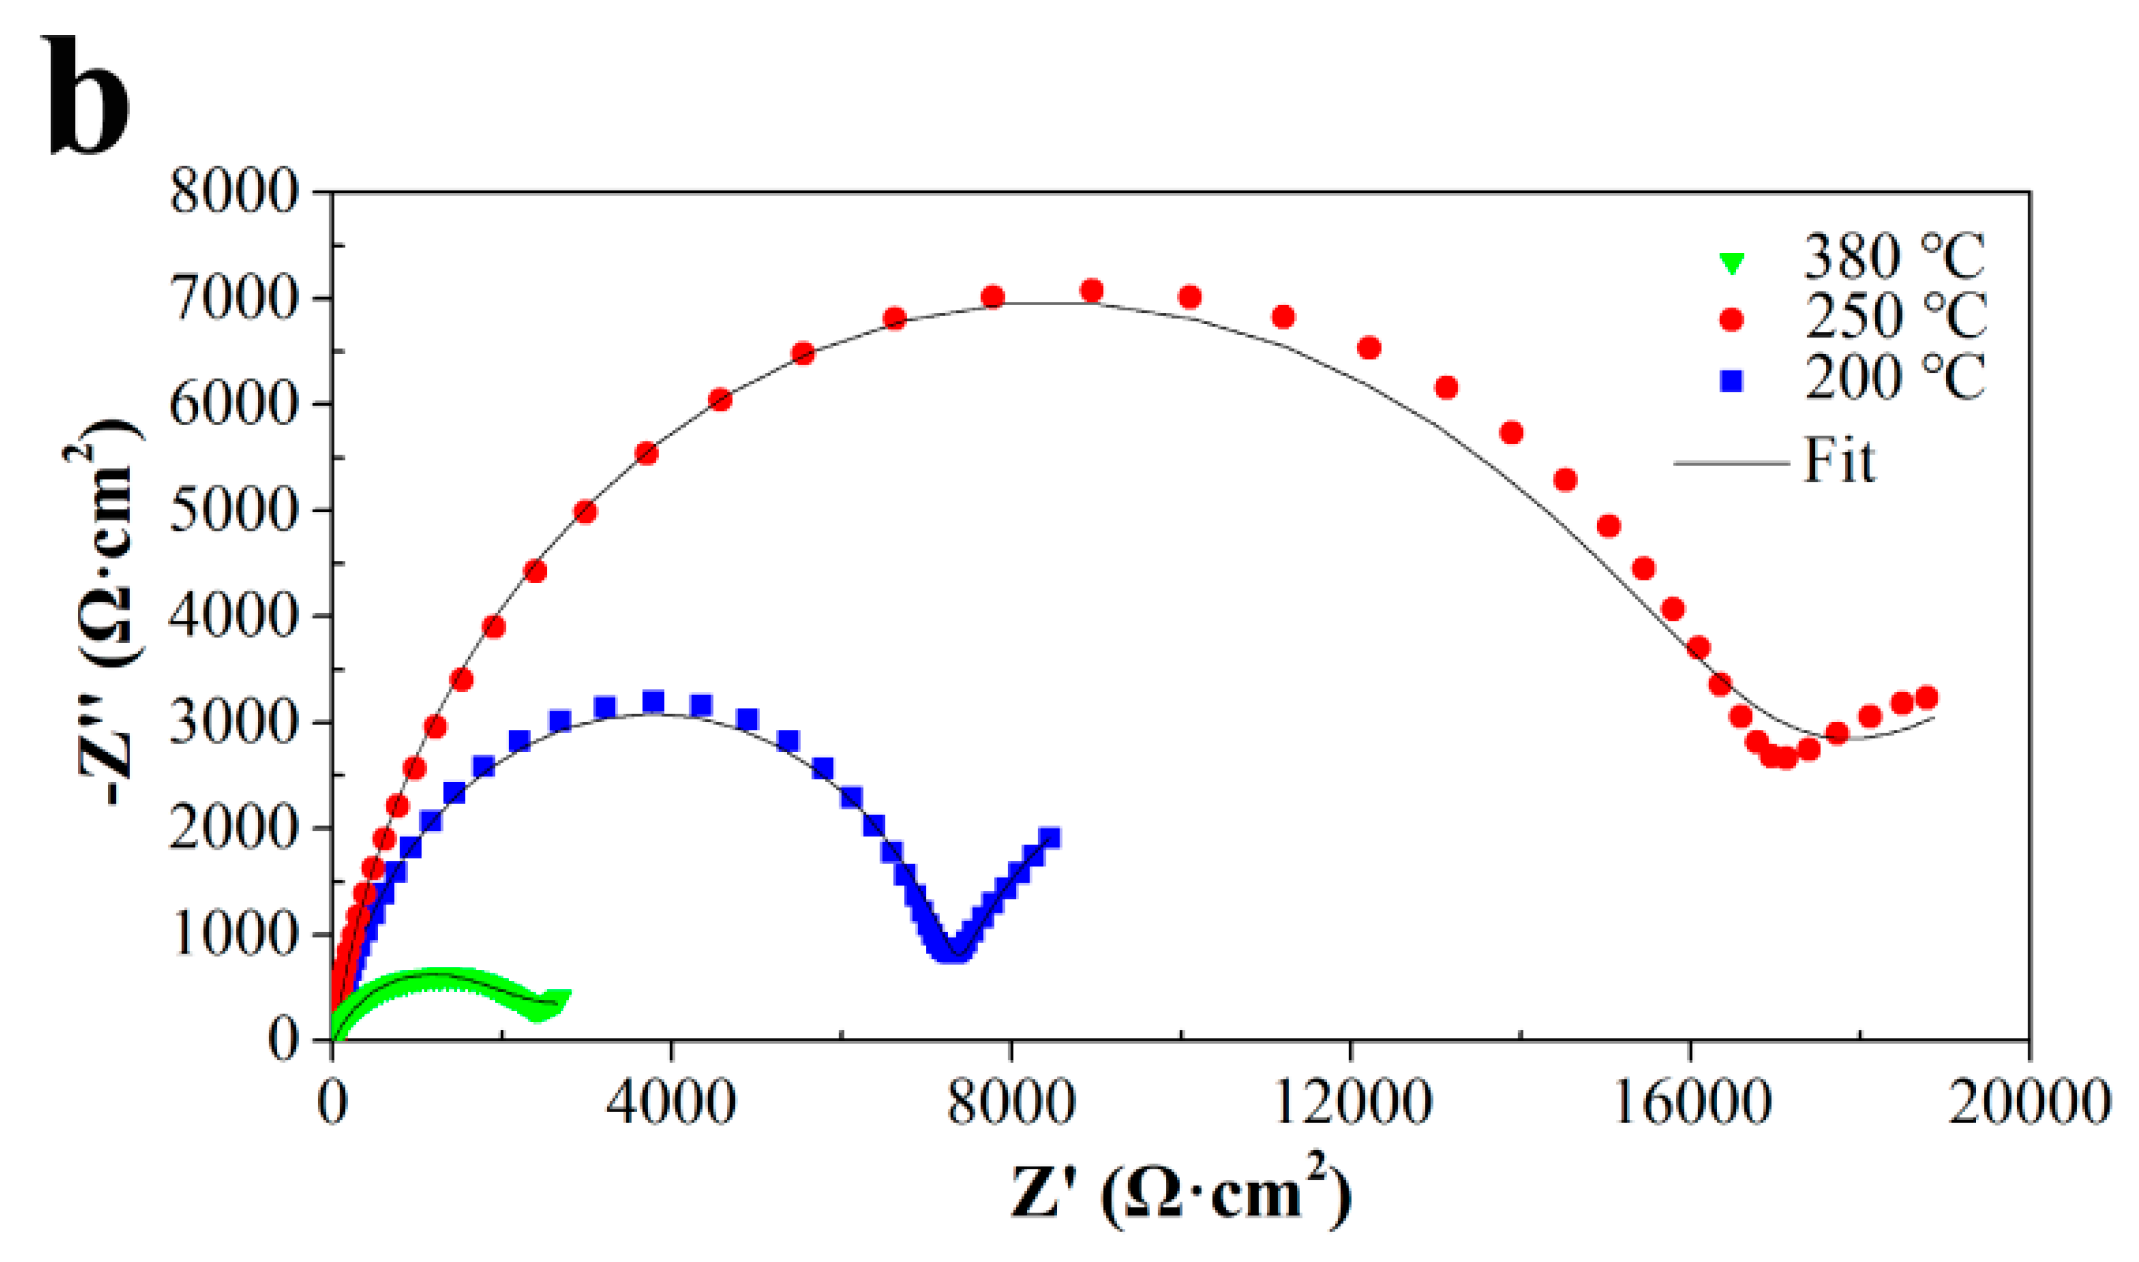
3.3.2. EIS Simulation and Analysis

EIS measurements were carried out to analyze the effects of both La addition and the annealing temperature on the electrochemical corrosion behavior of Al-Fe-La alloys in 3.5% NaCl solution. Figure 10 shows Nyquist plots of the Al-1.5Fe-xLa alloy with different annealing temperatures. The plots include one capacitance loop at a high-medium frequency region and a straight line of Warburg impedance (W), where W is mainly caused by diffusion of oxygen atoms [28]. The radius of the capacitance loop depends on the composition and microstructure of the alloy. The larger the radius, the more stable the oxide film [29]. At the same annealing temperature, the capacitance loop radius of the Al-1.5Fe-0.25La alloy was significantly larger than that of Al-1.5Fe-0.1La. With an increase in the annealing temperature from 200 to 380 °C, the radius of the capacitance loop increased first and then decreased, with a maximum value at 250 °C.
In order to further analyze susceptibility to corrosion, impedance parameters were obtained by Zsimpwin software (EChem Software, version 3.6, Ann Arbor, MI, USA) by using equivalent electrical circuits (Figure 11). Rs represents the solution resistance, while Rf and Rct correspond to the passive film resistance and charge transfer resistance, respectively. Cf and Cdl are the capacitance of the passive film and double layer, respectively. W is Warburg impedance [28,30]. Considering the non-ideal behavior of the electrochemical systems, all capacitances in the circuit were mathematically modeled by a constant phase element (CPE) [31]. Table 3 shows the impedance parameters of the as-annealed alloys, where the resistance value of (Rf + Rct) was positively correlated with corrosion resistance [32]. Compared to the alloy with a 0.1 wt % addition of La, the Al-1.5Fe-0.25La alloy had a higher (Rf + Rct) value at the same annealing temperature. It was evident that the Al-Fe-La alloy annealed at 250 °C had the highest (Rf + Rct) value, indicating a higher corrosion resistance for the alloys annealed at 250 °C.
Second-phase particles, grain size, and boundaries have significant impacts on the corrosion resistance of Al alloys. Small-size intermetallic particles had a lower influence on the corrosion of Al alloys [33,34]. Inhomogeneous distributions of intermetallic particles, especially those precipitated at a grain boundary, could constitute galvanic coupling with the interior grain, resulting in corrosion [34]. Ralston et al. [35] studied the corrosion behavior of high-purity Al with various grain sizes ranging from 100 to 2000 μm, and the results showed that the corrosion rate decreased as grain size decreased. The same tendency with respect to corrosion rate and grain size existed in the Mg-Y-RE alloy [36]. Liu et al. [37] found that a high proportion of small-angle grain boundaries improved the corrosion resistance of the A356 aluminum alloy, while large-angle grain boundaries had an opposite effect. The improvement of corrosion behavior was mainly attributed to the low interface energy of small-angle grain boundaries. Therefore, the distribution, size, and shape of second-phase particles were found to influence the corrosion behavior of Al alloys.
In this study, the Al-1.5Fe-0.25La alloy had a lower corrosion current density and higher corrosion resistance compared to the Al-1.5Fe-0.1La alloy. With a higher addition of La, Fe-rich particles were refined and AlFeLa particles with a smaller size precipitated, resulting in the improvement of corrosion properties. The improvement in the corrosion performance of the Al-1.5Fe-xLa alloy annealed at 250 °C was mainly attributed to the fine grain and high proportion of small-angle boundaries due to recrystallization. At 380 °C, the grains had already grown up and the fraction of large-angle boundaries had increased, leading to a drop in corrosion resistance. Due to the promotion effect of recrystallization caused by single coarse particles, the grain size of the Al-1.5Fe-0.1La alloy was larger than that of the Al-1.5Fe-0.25La alloy after recrystallization annealing, resulting in a decrease in corrosion resistance of annealed Al-1.5Fe-0.1La alloy. In addition, the homogeneous distribution of Fe-rich second-phase particles was also beneficial to corrosion resistance.

4. Conclusions

The effects of both the addition of La and the annealing temperatures on the mechanical properties and corrosion behavior of Al-Fe-La alloy foil were studied. The addition of La significantly affected the formation of AlFeLa particles and the size of Fe-rich second-phase particles. Grain boundaries and grain size of the alloys were strongly influenced by the annealing temperature. Recrystallisation occurred at 250 °C, resulting in refined grain and a higher fraction of small-angle grain boundaries. While annealing at 380 °C, the fine equiaxed grains grew into coarse grains.
The Al-1.5Fe-0.25La alloy had a higher formability and corrosion resistance than the Al-1.5Fe-0.1La alloy. The improvement in performance was mainly due to the stronger refinement effect on grain size and Fe-rich particles with a higher addition of La.
The Al-1.5Fe-0.25La alloy had a higher Ecorr and (Rf + Rct) and lower Icorr than the Al-1.5Fe-0.1La alloy. The improvement in corrosion behavior was mainly due to the stronger refinement effect on grain size and Fe-rich particles with a higher addition of La.
The Al-Fe-La alloy annealed at 250 °C had a higher Ecorr and (Rf + Rct) and lower Icorr than those annealed at 200 and 380 °C, indicating that a proper annealing temperature could enhance the corrosion resistance of the Al-Fe-La alloy.

Author Contributions

Conceptualization, D.D.; software, W.Z.; formal analysis, Y.G., G.C., Y.H., and J.T.; investigation, R.Z., Z.W., and R.C.; writing—original draft preparation, Z.R.; writing—review and editing, Z.R. and D.D.; project administration, D.D.

Funding

This work was supported by the Shanghai Excellent Technical Leader Project (No. 15XD1524600).

Conflicts of Interest

The authors declare no conflicts of interest.

References

  1. Xia, X.F.; Gu, Y.Y.; Xu, S.A. Titanium conversion coatings on the aluminum foil AA 8021 used for lithium–ion battery package. Appl. Surf. Sci. 2017, 419, 447–453. [Google Scholar] [CrossRef]
  2. Ohsaki, T.; Takami, N.; Kanda, M.; Yamamoto, M. High Performance Thin Lithium-Ion Battery Using an Aluminum-Plastic Laminated Film Bag. Stud. Surf. Sci. Catal. 2001, 132, 925–928. [Google Scholar] [CrossRef]
  3. Müller, K.; Schoenweitz, C.; Langowski, H.C. Thin Laminate Films for Barrier Packaging Application–Influence of Down Gauging and Substrate Surface Properties on the Permeation Properties. Packag. Technol. Sci. 2012, 25, 137–148. [Google Scholar] [CrossRef]
  4. Shi, Z.M.; Gao, K.; Shi, Y.T.; Wang, Y. Microstructure and mechanical properties of rare-earth-modified Al−1Fe binary alloys. Mater. Sci. Eng. A 2015, 632, 62–71. [Google Scholar] [CrossRef]
  5. Shi, Y.; Pan, Q.; Li, M.; Huang, X.; Li, B. Effect of Sc and Zr additions on corrosion behavior of Al–Zn–Mg–Cu alloys. J. Alloy. Compd. 2014, 612, 42–50. [Google Scholar] [CrossRef]
  6. Zhang, J.; Ding, D.; Xu, X.; Gao, Y.; Chen, G.; Chen, W.; You, X.; Huang, Y.; Tang, J. Effect of Ce addition on the mechanical and electrochemical properties of a lithium battery shell alloy. J. Alloys Compd. 2014, 617, 665–669. [Google Scholar] [CrossRef]
  7. Chen, K.H.; Fang, H.C.; Zhang, Z.; Chen, X.; Liu, G. Effect of of Yb, Cr and Zr additions on recrystallization and corrosion resistance of Al–Zn–Mg–Cu alloys. Mater. Sci. Eng. A 2008, 497, 426–431. [Google Scholar] [CrossRef]
  8. Chen, H.; Fan, C.; Liu, Y.; Wen, Y.; Zhong, X. Effect of Fe and Ce on corrosion behaviors of aluminum in 3.5% NaCl solution. Guangxi Sci. 2011, 35, 657–661. [Google Scholar]
  9. Mi, G.F.; Dong, C.F.; Zhao, D.W. Effect of Different Cooling Speed and Rare Earth La on the Microstructures and Phase Constitution of Al-Fe Alloy. Appl. Mech. Mater. 2010, 44–47, 2126–2130. [Google Scholar] [CrossRef]
  10. Li, R.; Ma, J.; Zhou, Z.; Yu, H. Effect of rare earth on microstructure of eutectic Al-2Fe alloy. J. Chin. Rare Earth Soc. 2004, 22, 722–724. [Google Scholar]
  11. Yang, H. The Structure and Property Relationship in Rare Earth Aluminum Alloy Surface Oxide Film. Master’s Thesis, Beijing University of Technology, Beijing, China, June 2002. [Google Scholar]
  12. Deng, Y.; Yin, Z.; Zhao, K.; Duan, J.; Hu, J.; He, Z. Effects of Sc and Zr microalloying additions and aging time at 120 °C on the corrosion behavior of an Al–Zn–Mg alloy. Corros. Sci. 2012, 65, 288–298. [Google Scholar] [CrossRef]
  13. Li, C.; Pan, Q.; Shi, Y.; Wang, Y.; Li, B. Influence of aging temperature on corrosion behavior of Al–Zn–Mg–Sc–Zr alloy. Mater. Des. 2014, 55, 551–559. [Google Scholar] [CrossRef]
  14. Huang, L.P.; Chen, K.H.; Li, S.; Song, M. Influence of high-temperature pre-precipitation on local corrosion behaviors of Al–Zn–Mg alloy. Scr. Mater. 2007, 56, 305–308. [Google Scholar] [CrossRef]
  15. Fu, G.S.; Sun, F.S.; Ren, L.Y.; Chen, W.Z.; Qian, K.W. Modification Behavior of trace rare earth on impurity phases in commercial purity aluminum. J. Rare Earth 2002, 20, 61–66. [Google Scholar]
  16. Zhu, M.; Jian, Z.; Yao, L.; Liu, C.; Yang, G.; Zhou, Y. Effect of mischmetal modification treatment on the microstructure, tensile properties, and fracture behavior of Al-7.0%Si-0.3%Mg foundry aluminum alloys. J. Mater. Sci. 2011, 46, 2685–2694. [Google Scholar] [CrossRef]
  17. Engler, O.; Kong, X.W.; Yang, P. Influence of particle stimulated nucleation on the recrystallization textures in cold deformed al-alloys part I—Experimental observations. Scr. Mater. 1997, 37, 1665–1674. [Google Scholar] [CrossRef]
  18. Engler, O. On the influence of dispersoids on the particle stimulated nucleation of recrystallization in an Al-Fe-Si model alloy. Mater. Sci. Forum 1998, 273, 483–488. [Google Scholar] [CrossRef]
  19. Luo, B.H.; Shan, Y.M.; Bai, Z.H. Effect of annealing temperature on microstructure and corrosive properties of cold-rolled 5083 aluminum alloy after quenching. J. Cent. South Univ. 2007, 38, 802–808. [Google Scholar]
  20. Dong, W.; Chang, B.; Yao, X.; Zhang, Y.; Wen, Z. 8021 Alloy Double Zero Foil and Its Production Process. China Patent CN103695723A, 2 April 2014. [Google Scholar]
  21. Chai, Z.; Jiang, C.; Zhu, K.; Zhao, Y.; Wang, C.; Cai, F.; Chen, M.; Wang, L. Pretreatment Behaviors and Improved Corrosion Resistance for Cu/Co-Ni-Cu Coating Electrodeposition on Magnesium Alloy. J. Electrochem. Soc. 2016, 163, D493–D499. [Google Scholar] [CrossRef]
  22. Moreira, A.H.; Benedetti, A.V.; Sumodjo, P.T.A.; Garrido, J.A.; Cabot, P.L. Electrochemical behaviour of heat-treated Al–Zn–Mg alloys in chloride solutions containing sulphate. Electrochim. Acta 2002, 47, 2823–2831. [Google Scholar] [CrossRef]
  23. Park, J.; Paik, C.H.; Huang, Y.H.; Alkire, R. Influence of Fe-Rich Intermetallic Inclusions on Pit Initiation on Aluminum Alloys in Aerated NaCl. J. Electrochem. Soc. 1999, 146, 517–523. [Google Scholar] [CrossRef]
  24. Rynders, R.M.; Paik, C.H.; Ke, R.; Alkire, R. Use of in situ atomic force microscopy to image corrosion at inclusions. J. Electrochem. Soc. 1994, 141, 1439–1445. [Google Scholar] [CrossRef]
  25. Birbilis, N.; Buchheit, R.G. Electrochemical characteristics of intermetallic phases in aluminum alloys: An experimental survey and discussion. J. Electrochem. Soc. 2005, 152, b140. [Google Scholar] [CrossRef]
  26. Ambat, R.; Davenport, A.J.; Scamans, G.M.; Afseth, A. Effect of iron-containing intermetallic particles on the corrosion behaviour of aluminium. Corros. Sci. 2006, 48, 3455–3471. [Google Scholar] [CrossRef]
  27. Speckert, L.; Burstein, G.T. Combined anodic/cathodic transient currents within nucleating pits on Al–Fe alloy surfaces. Corros. Sci. 2011, 53, 534–539. [Google Scholar] [CrossRef]
  28. Du, J.; Ding, D.; Zhang, W.; Xu, Z.; Gao, Y.; Chen, G.; Chen, W.; You, X.; Chen, R.; Huang, Y.; et al. CeLa enhanced corrosion resistance of Al-Cu-Mn-Mg-Fe alloy for lithium battery shell. Appl. Surf. Sci. 2017, 422. [Google Scholar] [CrossRef]
  29. Zhang, J.; Ding, D.; Zhang, W.; Gao, Y.; Chen, G.; Chen, W.; You, X.; Huang, Y.; Chen, R.; Tang, J. Microstructure and electrochemical property of Ce-containing Al-Cu-Mn Alloy. Nonferrous Met. Mater. Eng. 2016, 37, 78–83. [Google Scholar]
  30. Baig, M.; Ammar, H.R.; Seikh, A.H.; Alam, M.A.; Alharthi, N.H. Effect of Immersion Time and Temperature on Corrosion Behaviour of Nanocrystalline Al-Fe-Cr Alloy. J. Electrochem. Sci. 2017, 12, 3336–3349. [Google Scholar] [CrossRef]
  31. Xiao, Y.P.; Pan, Q.L.; Li, W.B.; Liu, X.Y.; He, Y.B. Influence of retrogression and re-aging treatment on corrosion behaviour of an Al–Zn–Mg–Cu alloy. Mater. Des. 2011, 32, 2149–2156. [Google Scholar] [CrossRef]
  32. Brunner, J.G.; Birbilis, N.; Ralston, K.D.; Virtanen, S. Impact of ultrafine-grained microstructure on the corrosion of aluminium alloy AA2024. Corros. Sci. 2012, 57, 209–214. [Google Scholar] [CrossRef]
  33. Dorin, T.; Stanford, N.; Birbilis, N.; Gupta, R.K. Influence of cooling rate on the microstructure and corrosion behavior of Al–Fe alloys. Corros. Sci. 2015, 100, 396–403. [Google Scholar] [CrossRef]
  34. Yasakau, K.A.; Zheludkevich, M.L.; Ferreira, M.G.S. 15-Role of intermetallics in corrosion of aluminum alloys. Smart corrosion protection. In Intermetallic Matrix Composites; Mitra, R., Ed.; Woodhead Publishing: Shaston, UK, 2018; pp. 425–462. [Google Scholar] [CrossRef]
  35. Ralston, K.D.; Fabijanic, D.; Birbilis, N. Effect of grain size on corrosion of high purity aluminium. Electrochim. Acta 2011, 56, 1729–1736. [Google Scholar] [CrossRef]
  36. Argade, G.R.; Panigrahi, S.K.; Mishra, R.S. Effects of grain size on the corrosion resistance of wrought magnesium alloys containing neodymium. Corros. Sci. 2012, 58, 145–151. [Google Scholar] [CrossRef]
  37. Liu, Z.; Zhao, M.; Wang, X.; Li, J. Effect of grain boundaries on the corrosion resistance of aluminum alloys. J. Beijing Univ. Chem. Technol. 2016, 43, 57–62. [Google Scholar] [CrossRef]
Figure 1. Longitudinal section microstructure of the Al-1.5Fe-0.1La alloy annealed at: (a) 200 °C; (b) 250 °C; and (c) 380 °C.
Metals 08 00890 g001
Figure 2. Longitudinal section microstructure of the Al-1.5Fe-0.25La alloy annealed at: (a) 200 °C; (b) 250 °C; and (c) 380 °C.
Metals 08 00890 g002aMetals 08 00890 g002b
Figure 3. Scanning electron microscopy (SEM) images of the as-rolled Al-Fe-La alloys, (a) Al-1.5Fe-0.1La and (b) Al-1.5Fe-0.25La, while (c,d) depict the energy dispersive spectroscopy (EDS) of Fe-rich phase (M) and AlFeLa phase (N).
Metals 08 00890 g003aMetals 08 00890 g003b
Figure 4. Size distribution of the Fe-rich phase in the Al-Fe-La alloys.
Metals 08 00890 g004
Figure 5. Transmission electron microscopy (TEM) images of the Al-1.5Fe-0.1La alloy annealed at: (a) 200 °C; (b) 250 °C; and (c) 380 °C.
Metals 08 00890 g005aMetals 08 00890 g005b
Figure 6. Fracture surfaces of the Al-Fe-La alloys annealed at 250 °C: (a) Al-1.5Fe-0.1La; (b) Al-1.5Fe-0.25La.
Metals 08 00890 g006
Figure 7. Polarization curves of Al-Fe-La alloys in 3.5% NaCl solution: (a) Al-1.5Fe-0.1La; and (b) Al-1.5Fe-0.25La.
Metals 08 00890 g007
Figure 8. Corrosion surface morphology of the Al-1.5Fe-0.1La alloy annealed at: (a) 200 °C; (b) 250 °C; and (c) 380 °C; and (d) morphology of the pit hole (250 °C).
Metals 08 00890 g008
Figure 9. Corrosion surface morphology of the Al-1.5Fe-0.25La alloy annealed at: (a) 200 °C; (b) 250 °C; and (c) 380 °C; and (d) morphology of the pit hole (250 °C).
Metals 08 00890 g009
Figure 10. Nyquist plots of Al-Fe-La alloys: (a) Al-1.5Fe-0.1La; and (b) Al-1.5Fe-0.25La.
Metals 08 00890 g010aMetals 08 00890 g010b
Figure 11. Equivalent electrical circuits of the alloys tested in 3.5% NaCl solution.
Metals 08 00890 g011
Table 1. Mechanical properties of the Al-Fe-La alloy and AA8021.
AlloyStateσ0.2 (MPa)σb (MPa)δ (%)
AA8021as-rolled-85–1102.6–3.2
Al-1.5Fe-0.1Laas-rolled132.6 (±0.5)143.3 (±0.8)4.0 (±0.5)
Al-1.5Fe-0.25Laas-rolled151.1 (±0.7)165.9 (±1.0)3.1 (±0.3)
Al-1.5Fe-0.1Laannealed (250 °C)35.1 (±1.2)74.0 (±1.1)21.5 (±0.8)
Al-1.5Fe-0.25Laannealed (250 °C)30.2 (±0.9)80.1 (±2.1)24.6 (±1.4)
Table 2. Tafel polarization parameters of Al-Fe-La alloys with different annealing temperatures in 3.5% NaCl solution. Ecorr (vs. Standard Hydrogen Electrode (SHE)): corrosion potential; Icorr: corrosion current density.
AlloyAnnealing Temperature (°C)Ecorr (mV vs. SHE)Icorr (μA/cm2)
Al-1.5Fe-0.1La200−775 (±11)2.41 (±0.4)
250−768 (±4)0.82 (±0.2)
380−806 (±12)2.64 (±0.7)
Al-1.5Fe-0.25La200−756 (±3)1.46 (±0.5)
250−744 (±7)0.62 (±0.1)
380−776 (±9)2.57 (±0.8)
Table 3. Impedance parameters of the Al-Fe-La alloy at different annealing temperatures in 3.5% NaCl solution. The resistance value is represented by (Rf + Rct).
AlloyAnnealing Temperature (°C)(Rf + Rct) (Ω cm2)
Al-1.5Fe-0.1La2004034
2506006
3802822
Al-1.5Fe-0.25La2009714
25015,510
3803140

