3.1. Characterization of the SG Tube Deposit Flakes Collected From the SG
The elemental composition of the SG flake samples obtained using ICP-AES (Thermo Scientific, Cambridge, UK) is given in
Table 2. The values were measured except for O. As determined by ICP-AES, the main element in the samples was Fe. Trace elements such as Mn, Ni, Cu, Ti, Al, Cr, Si, Mg, and Ca were also observed.
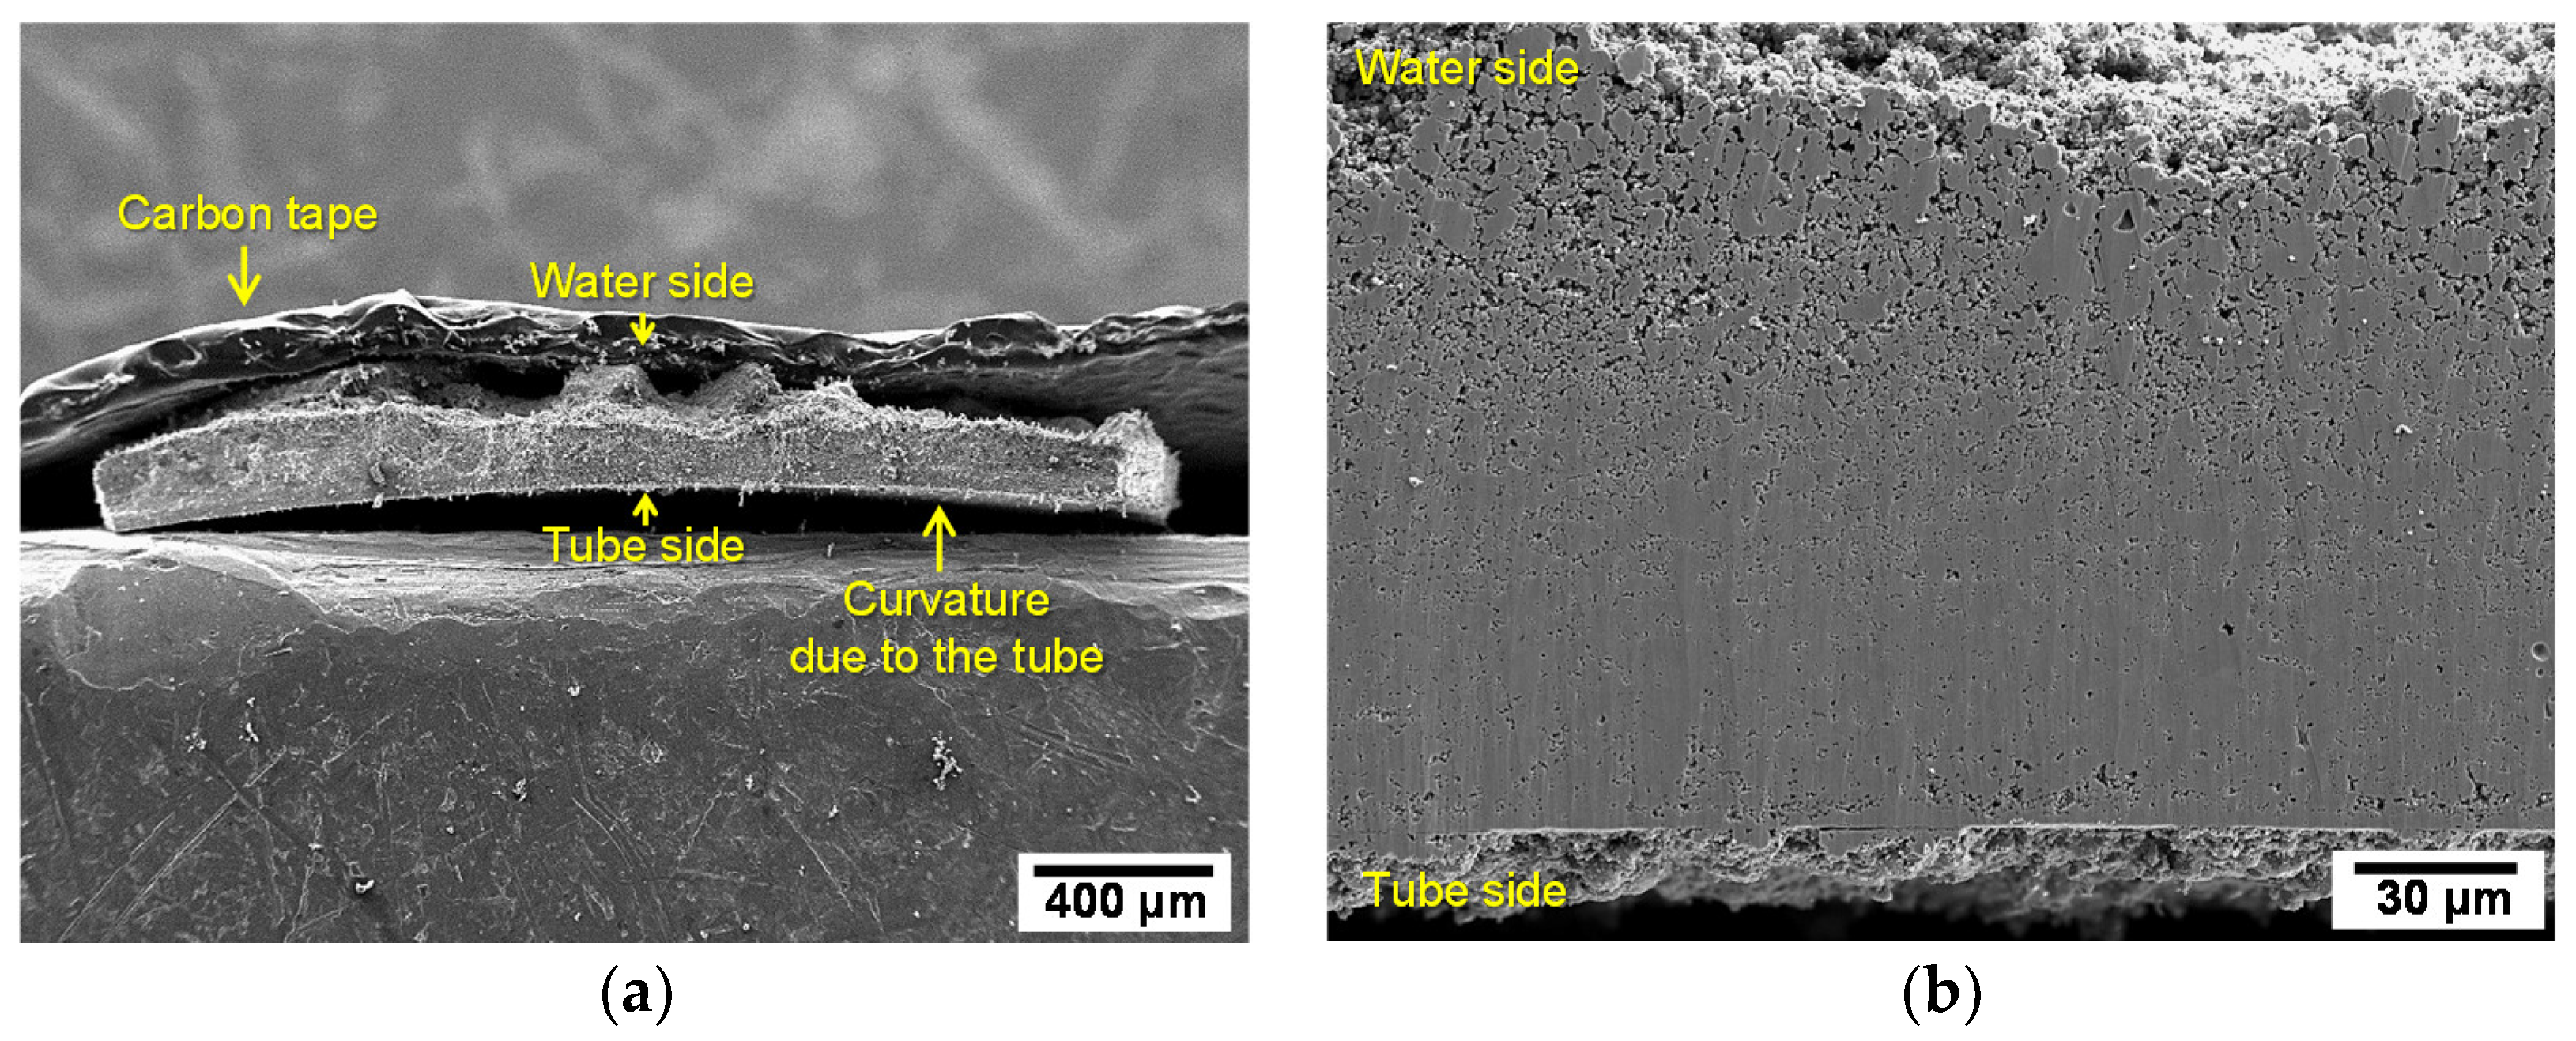
Figure 1 shows the SEM micrographs of the SG flakes. As shown in
Figure 1a, the flake sample showed a curvature compatible with the outer surface of the SG tube. The concave side of the flake was originally in contact with the outer surface of SG tubes (tube side). On the other hand, the convex side of the flake was exposed to the high-temperature secondary water of the SG (high-temperature water side). The cross-sectional images of the SG flake showed that the thickness was about 120~130 µm (
Figure 1b). A large number of the pores were observed throughout the flake sample. The number of pores and pore size increased from the tube side to the water side. These results may be closely related to the boiling behavior such as bubble growth and boiling chimney [
13,
14]. Based on the observation of many numbers of micro-pores, it is concluded that the high-temperature water could be exposed to the surface of SG tubes through the pores and caused the various corrosion phenomena such as pitting corrosion and stress corrosion cracking.
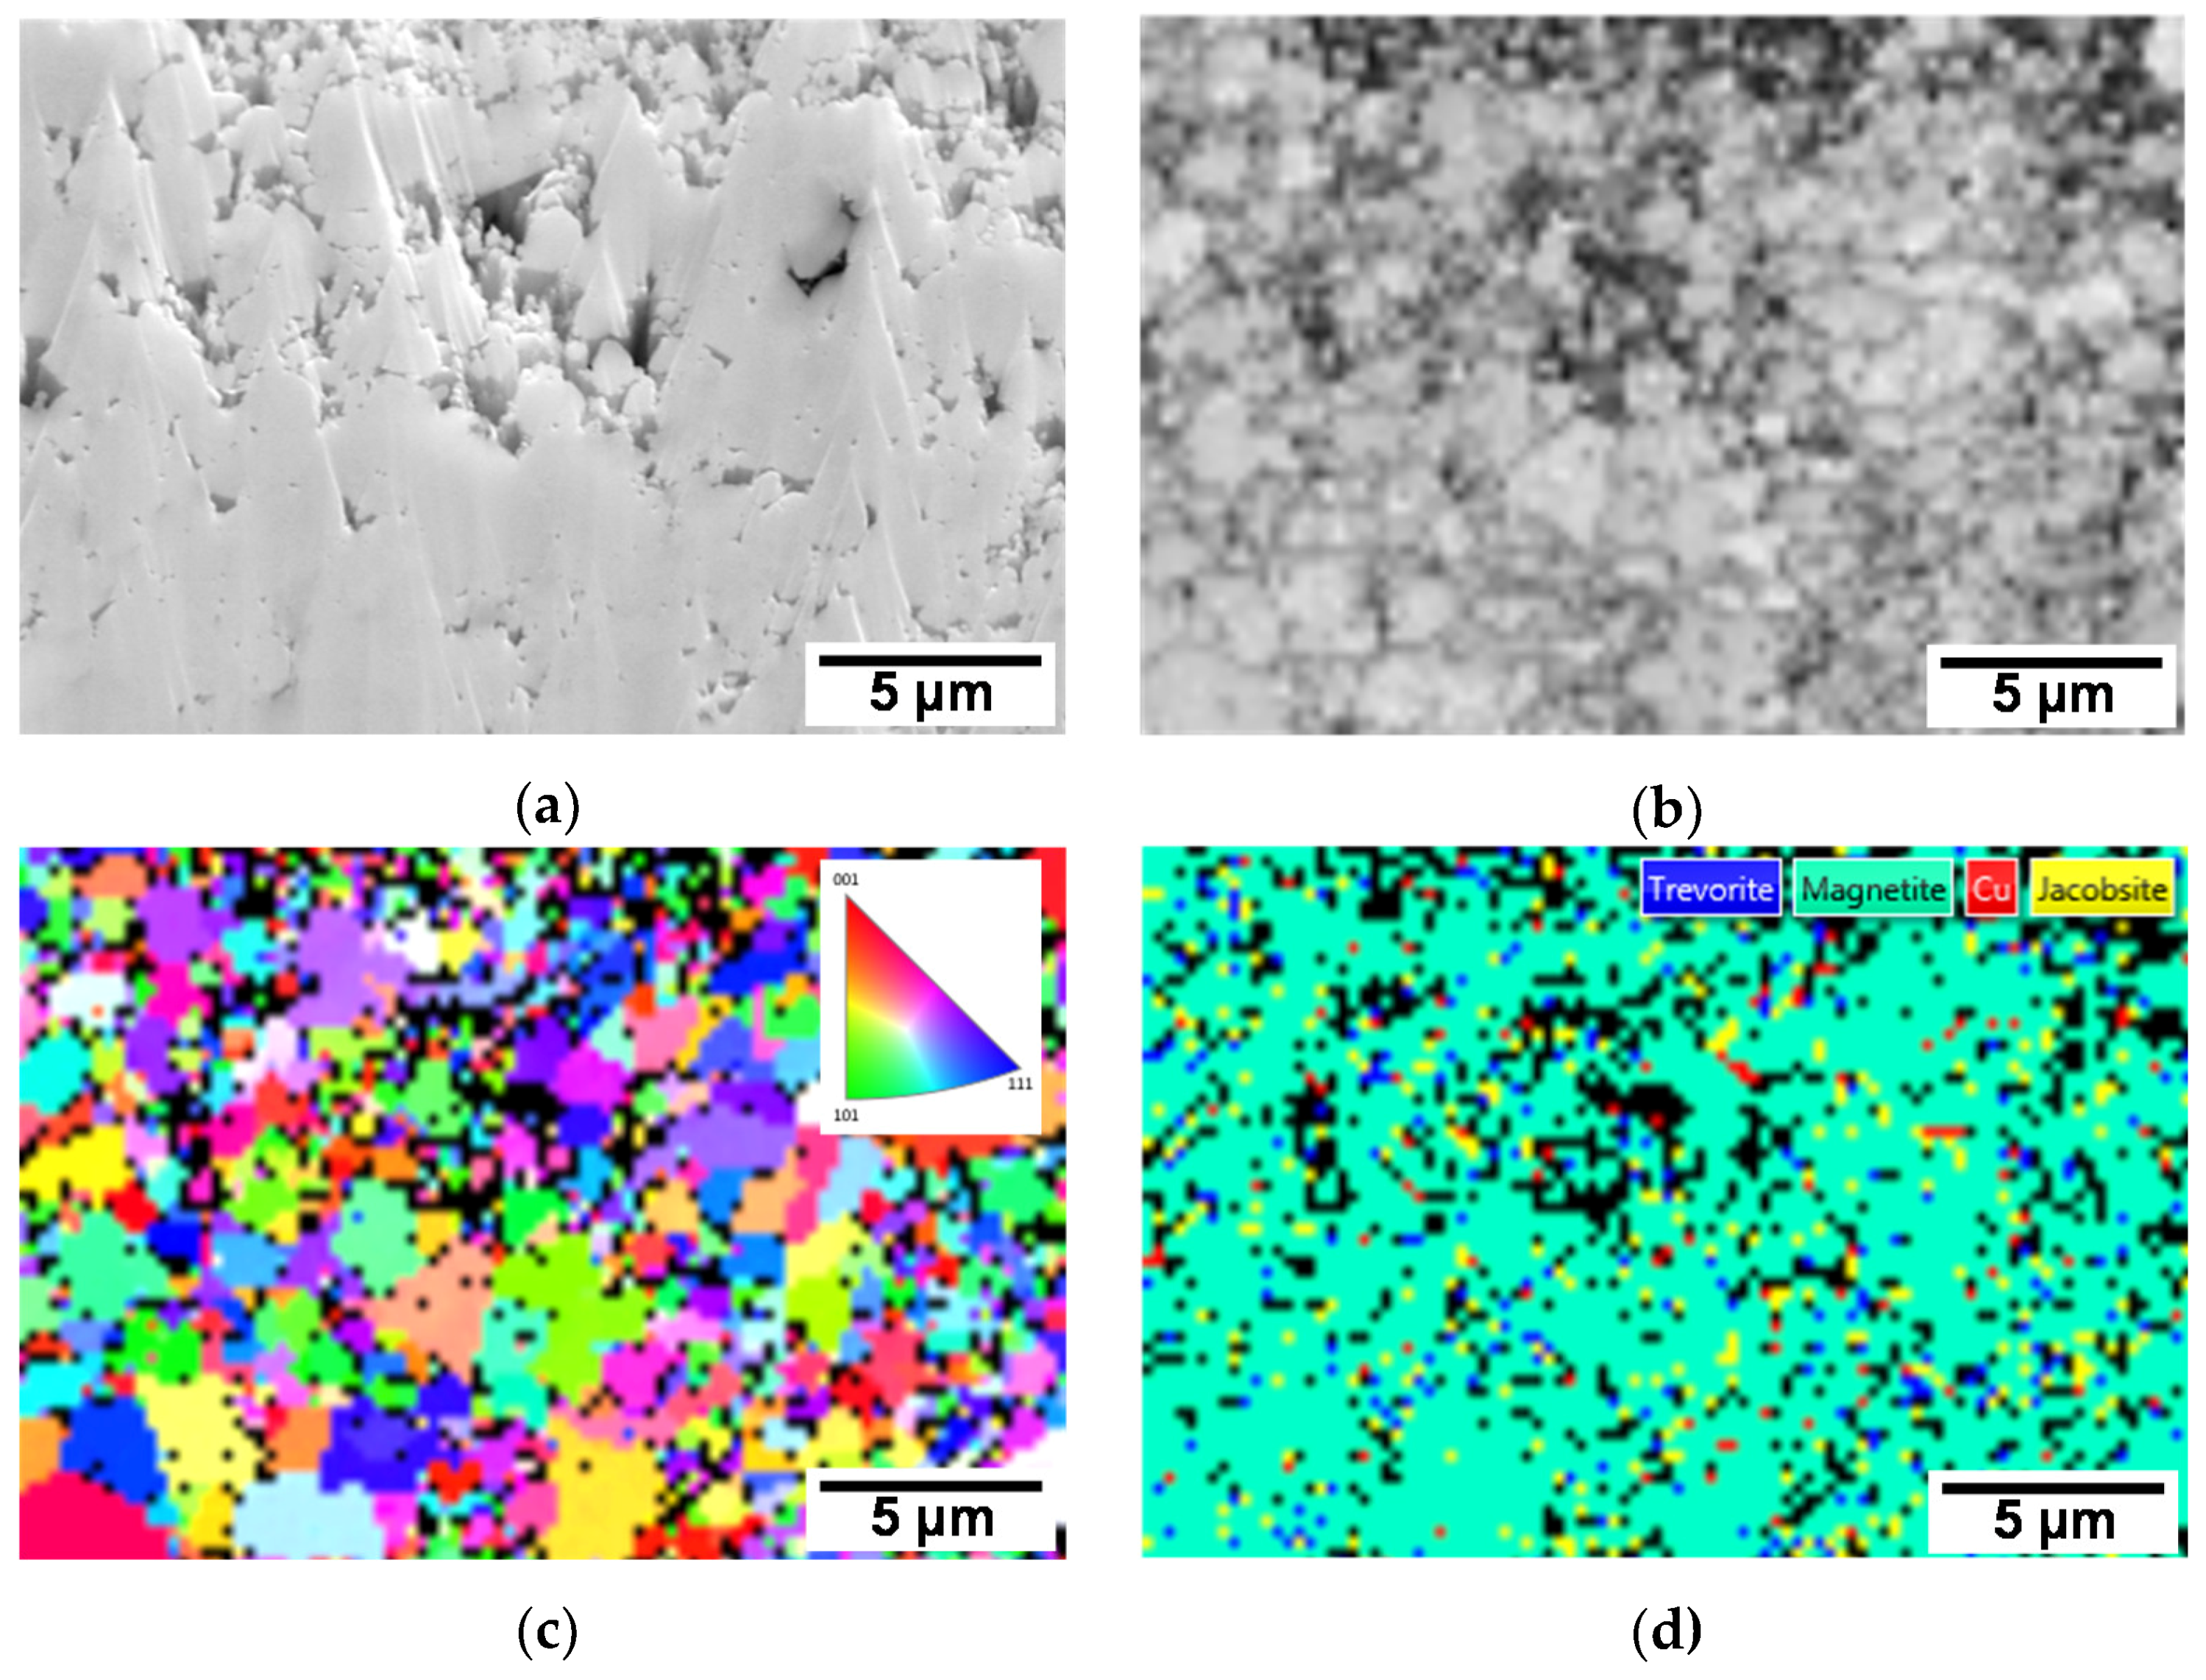
Figure 2 shows the EBSD data on the tube side of the SG flakes. As shown in
Figure 2a, the analyzed region is containing of the number of the micro-pores. A first map based on the image quality pattern (IQ) data reveals a contrast related to local variations of surface quality, crystallinity, and orientation (
Figure 2b). In the 001 inverse pole figure (IPF) orientation map (
Figure 2c), a random orientation was observed (predominant orientation color did not appear).
Figure 2d shows the phase distribution map. Four phases such as magnetite (Fe
3O
4), trevorite (Ni
2FeO
4), jacobsite (Mn
2FeO
4), Cu, and zero solutions (black regions) were observed and randomly distributed in all the analyzed regions. The detailed phase fractions of the flakes are presented in
Table 3. These results indicated that the flake samples were mainly composed of magnetite and contained only small amounts of trevorite, jacobsite, and metallic Cu particle. In these EBSD results, the micro-pores could be represented to the zero solutions (black regions). In general, zero solutions are points in the scan for which no indexing solution could be found for the corresponding pattern [
18]. From the EBSD results in this work, it could be confirmed that not only Cu particles were precipitated on the tube surface but also the particles were precipitated on the inside of pores.
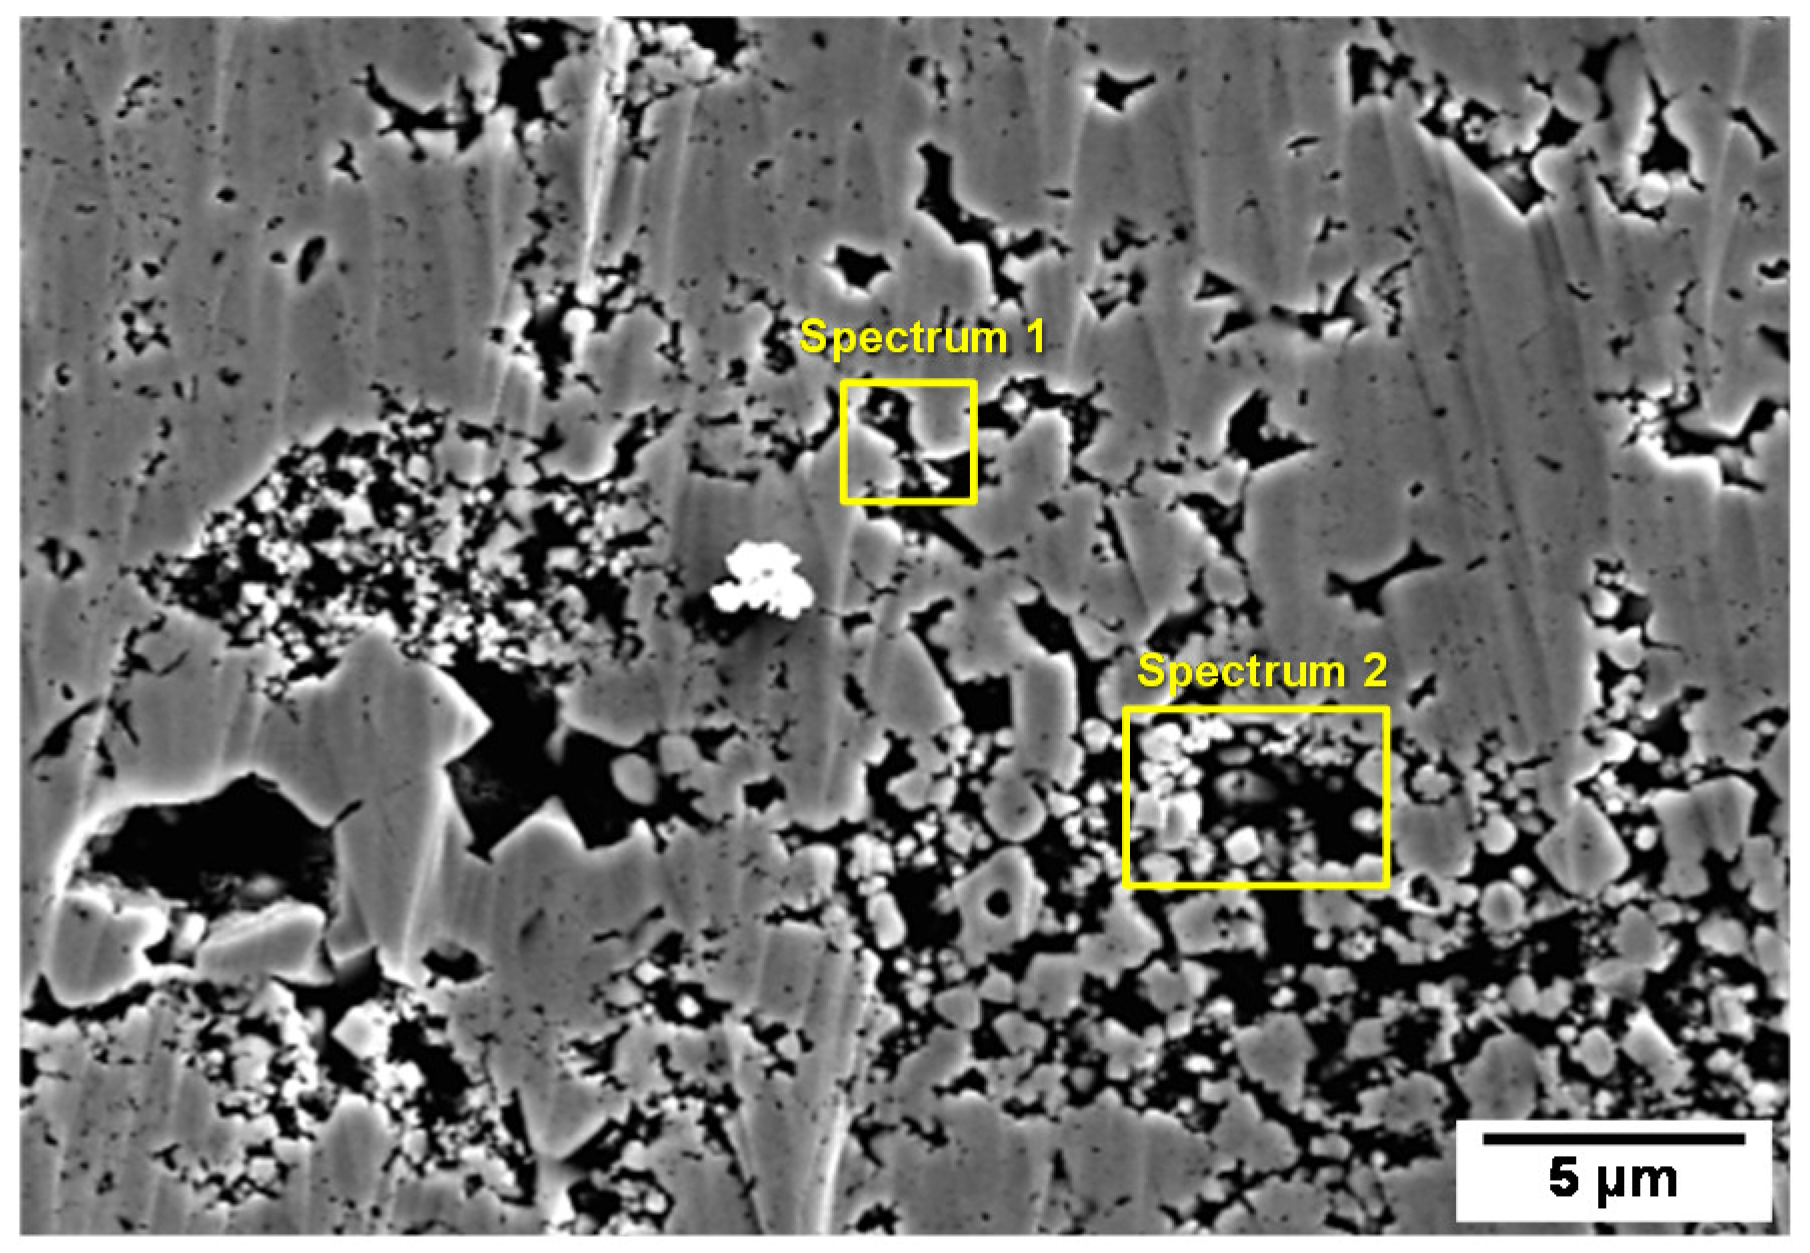
Figure 3 presents the SEM-EDS analysis of the impurities within the micro-pores on the tube side of the SG flakes. It is well known that the impurities were predominantly concentrated within the pores due to the boiling behavior. The quantitative EDS mapping results are given in
Table 4. Some impurities such as Cu, Pb, P, S, and Cl were detected within the micro-pores of the deposits. In particular, it could be seen that Cu and Pb concentrations was high.
From the potential-pH diagram (Pourbaix diagram) of the Cu-H
2O and Pb-H
2O systems at 280 °C, which was calculated using the FACT-SAGE software, Cu and Pb are soluble in secondary water of SG. The pH of the secondary water of SG (pH adjusting agent: ETA, temperature: 280 °C, pH 9.5 at 25 °C) is about 6.14, which was calculated using the MULTEQ code, which was developed by the Electric Plant Research Institute (EPRI). In the secondary system, the preferred ionic form of Cu is Cu(OH)
+ and Pb is Pb(OH)
+ [
13]. Under the secondary water condition, Cu(OH)
+ and Pb(OH)
+ can further react to form Cu(OH)
2 and Pb(OH)
2 [
13]. These soluble Cu and Pb species within the micro-pore of magnetite flake could be electrochemically reduced on the outer surface of SG materials through the following reactions (3) and (4).
The thermodynamic calculation using the HSC Chemistry 6 software [
19] gives ∆G
280 °C = −75.1 kJ/mol for reaction (1) and ∆G
280 °C = −67.2 kJ/mol for reaction (2). Based on the results, it is concluded that the formation reactions of metallic Cu and Pb are thermodynamically spontaneous in the secondary system of SG. Therefore, Cu and Pb are expected to exist in a metallic form in the micro-pores of the magnetite flakes.
3.3. Electrochemical Corrosion Behavior of the SG Materials
To elucidate the electrochemical corrosion behavior between the SG materials (Alloy 690, Alloy 600, and SA 508 Gr.3) and corrosion products (magnetite, Cu, and Pb) existed in the SG deposit flakes, the
Ecorr of the SG materials and the corrosion products was measured by using potentiostat.
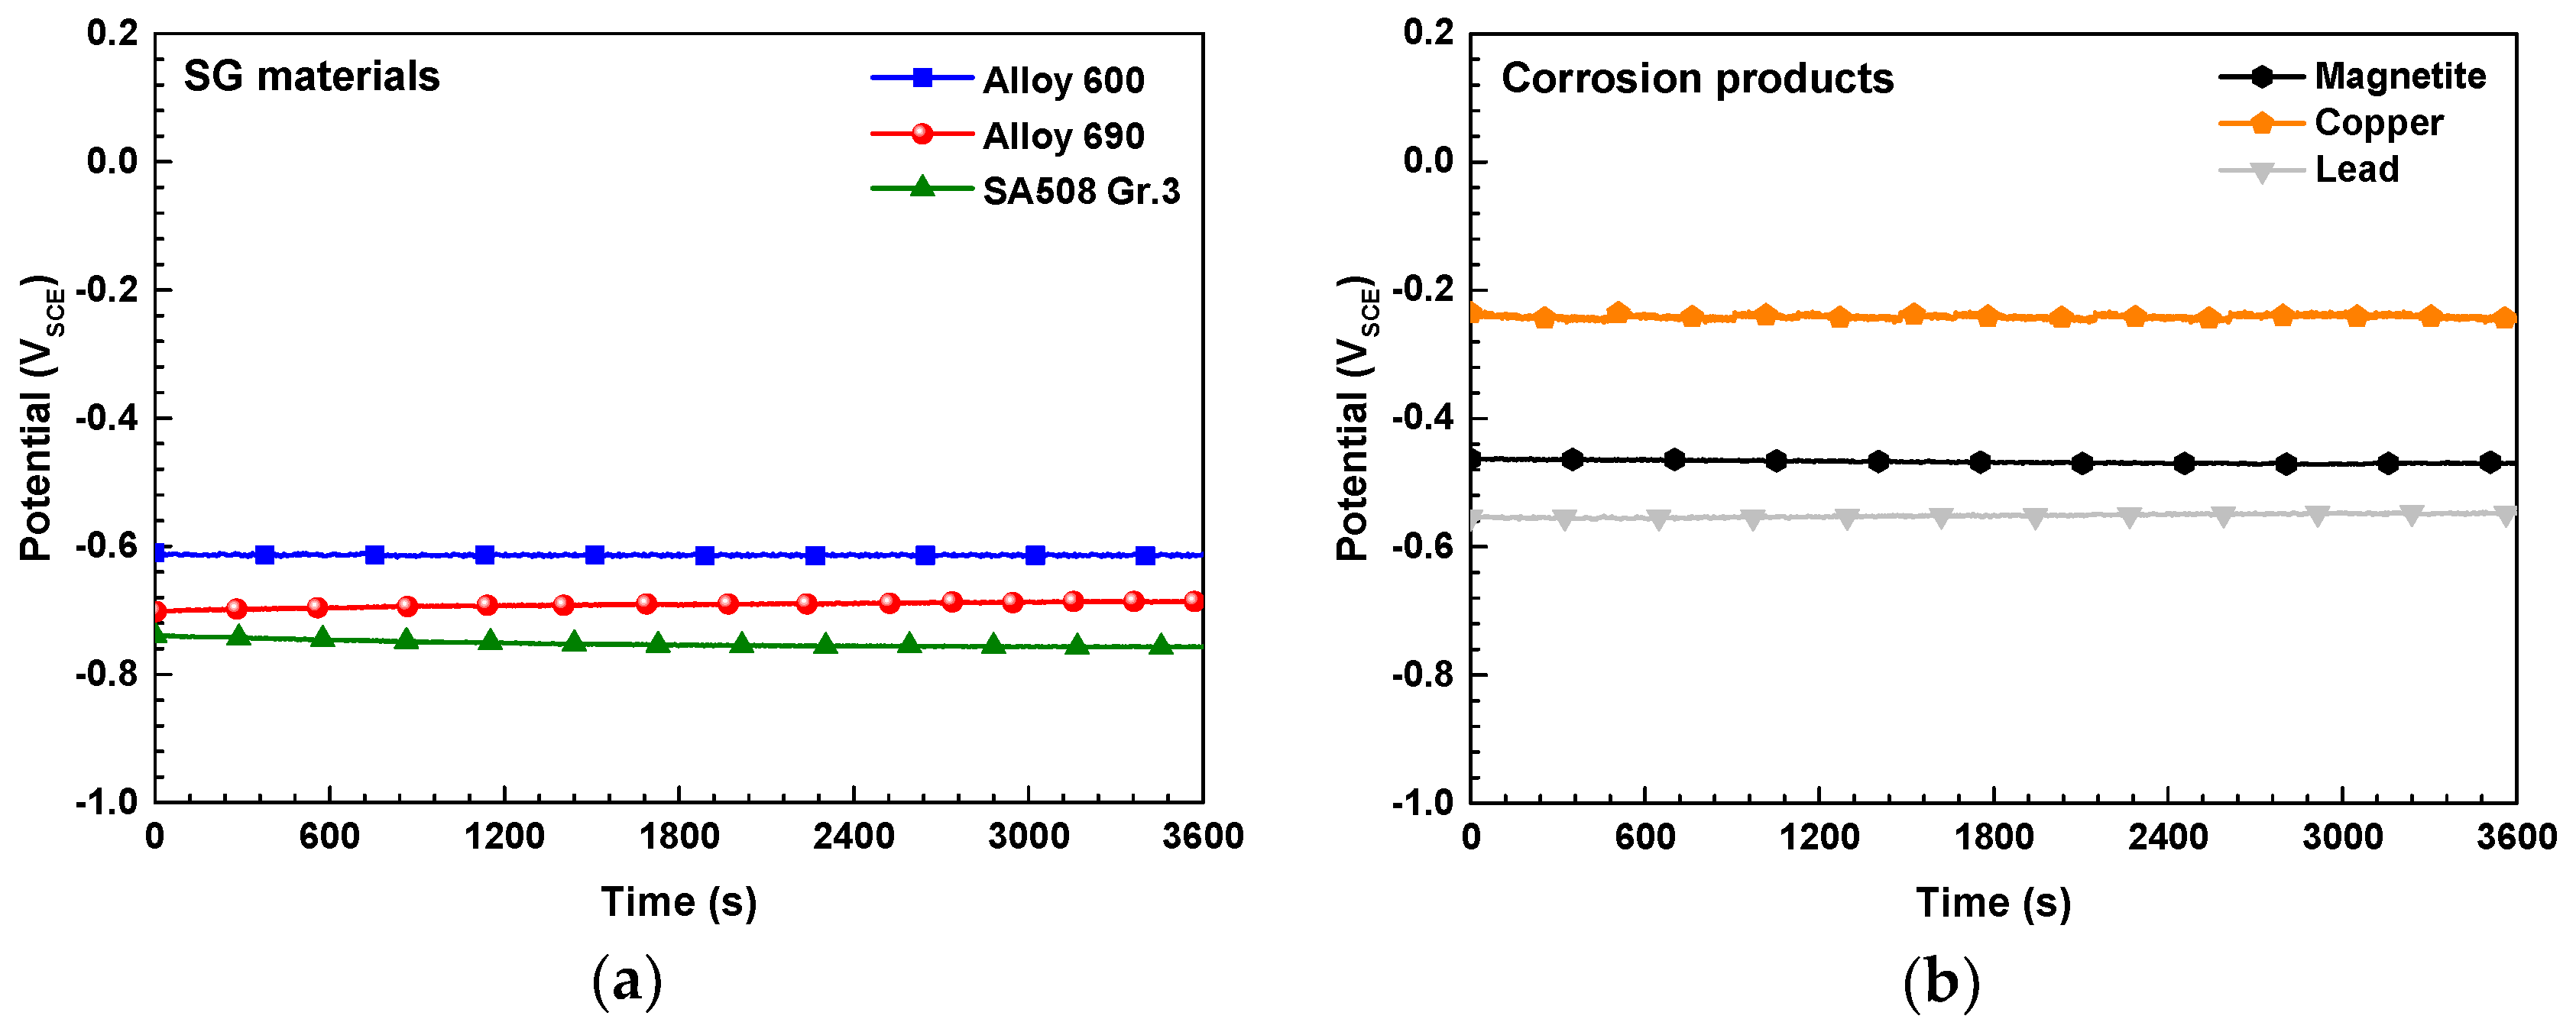
Figure 6 presents the
Ecorr of the SG materials and the corrosion products in the alkaline solution at 80 °C as a function of time. The
Ecorr of the test materials is ranked in the following order: Cu > magnetite > Pb > Alloy 600 > Alloy 690 > SA 508 Gr.3. Compare with the
Ecorr of the SG materials, the
Ecorr of the all corrosion products was higher than that of SG materials.
To cause the galvanic corrosion between the two or more dissimilar materials, a potential difference (usually > 50 mV [
20]) has to exist between the different materials. The potential difference between the Pb (the corrosion product with the lowest potential among the three corrosion products) and Alloy 600 (the highest potential materials among the three SG materials) exceeds about 60 mV. Accordingly, when the corrosion products and SG materials are electrically contacted and exposed the same electrolyte, all corrosion products will behave as the cathode of the galvanic couple, while all SG materials will be acted as the anode and is expected to undergo excessive corrosion.
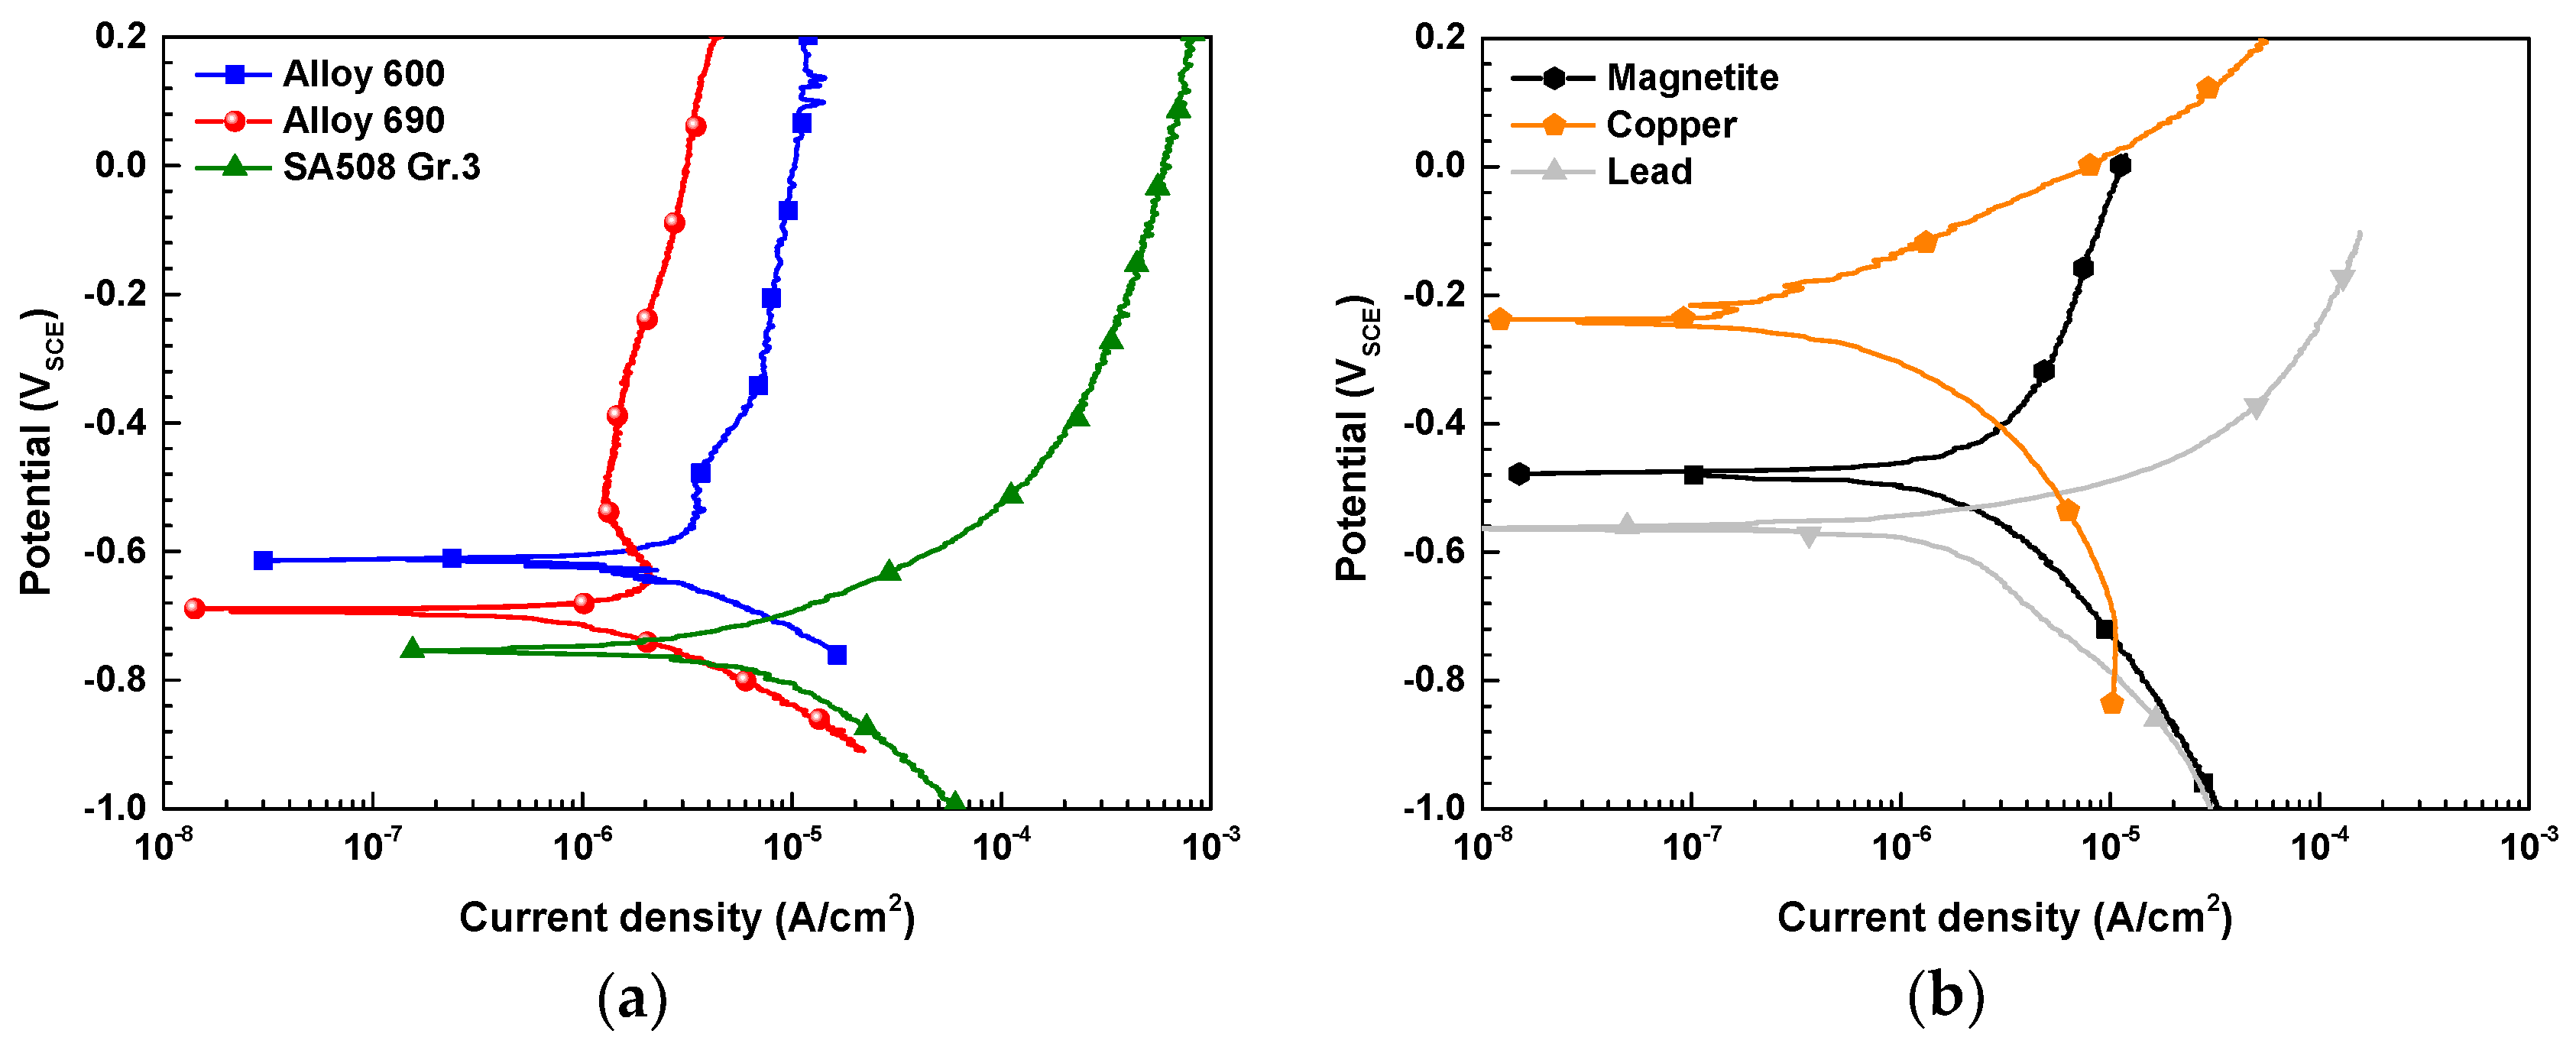
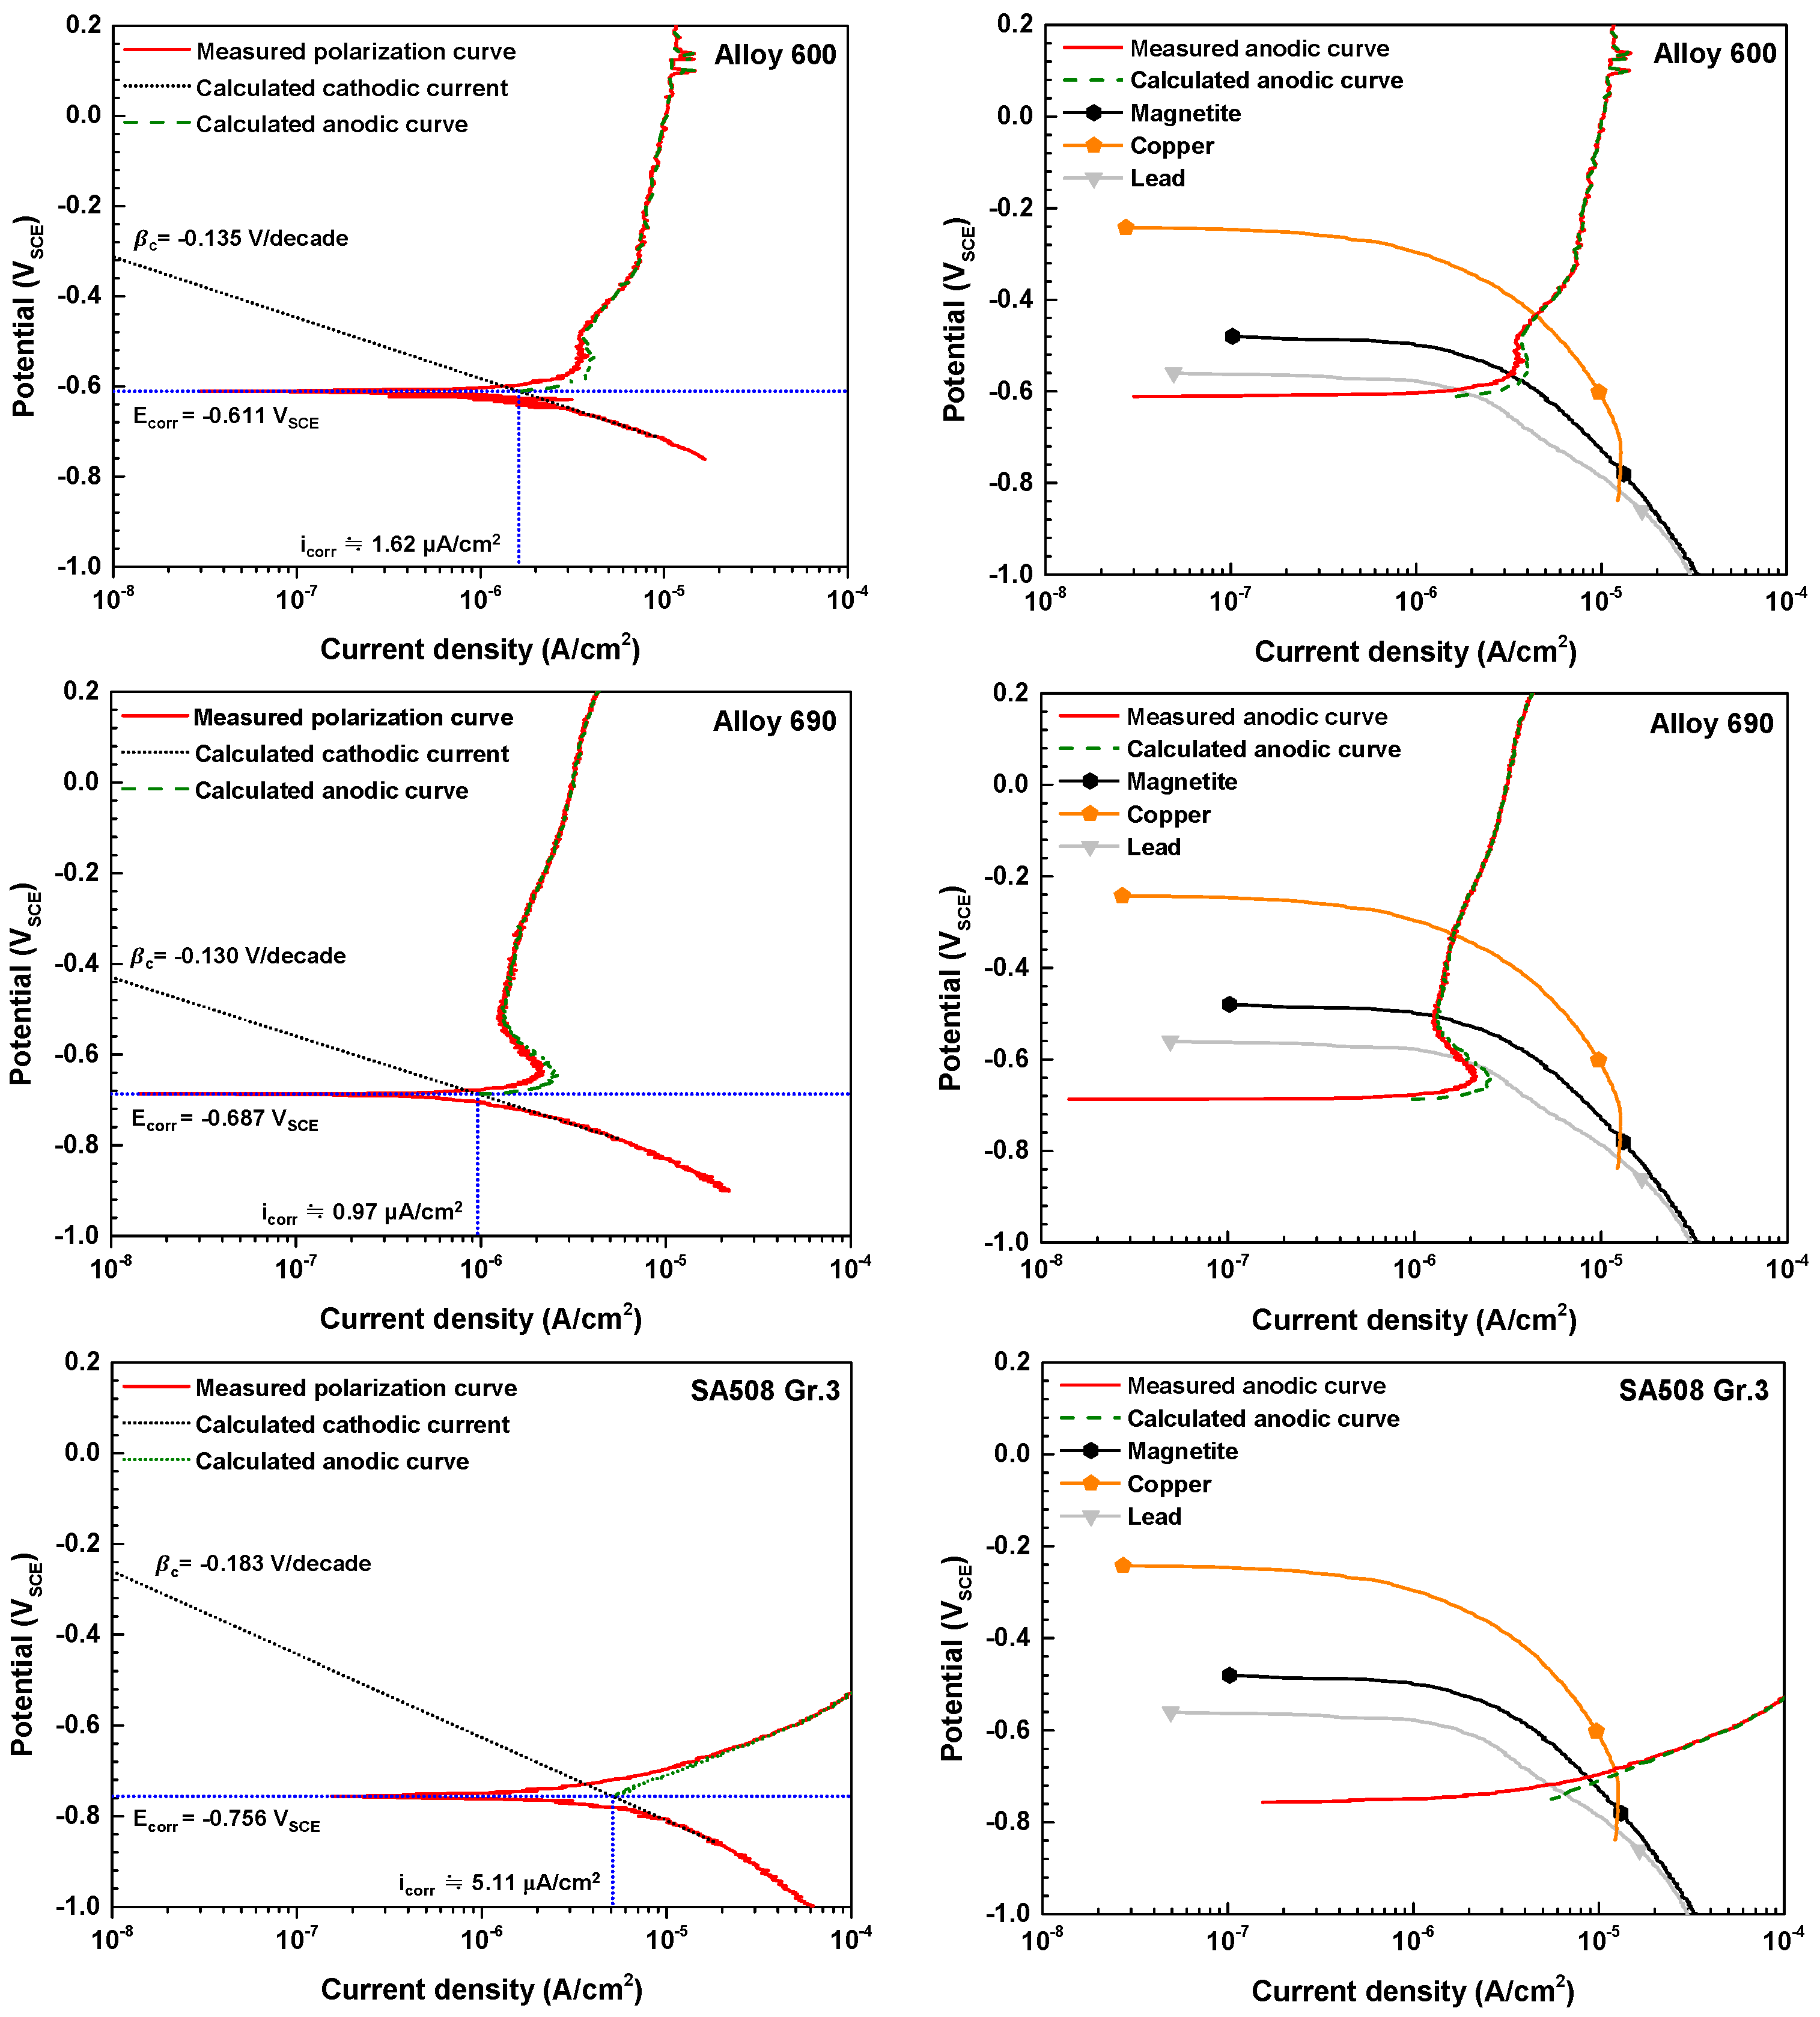
Figure 7 shows the potentiodynamic polarization curves of the SG materials and the corrosion products. The
icorr of SG materials and the corrosion products were calculated by cathodic Tafel extrapolation of polarization curved in
Figure 8. The
icorr of the test materials is ranked in the following order: Cu (0.36 µA/cm
2) > Alloy 690 (1.05 µA/cm
2) > magnetite (1.24 µA/cm
2) > Pb (1.52 µA/cm
2) > Alloy 600 (1.62 µA/cm
2) > SA 508 Gr.3 (5.11 µA/cm
2). The various electrochemical corrosion parameters of SG materials are summarized in
Table 5.
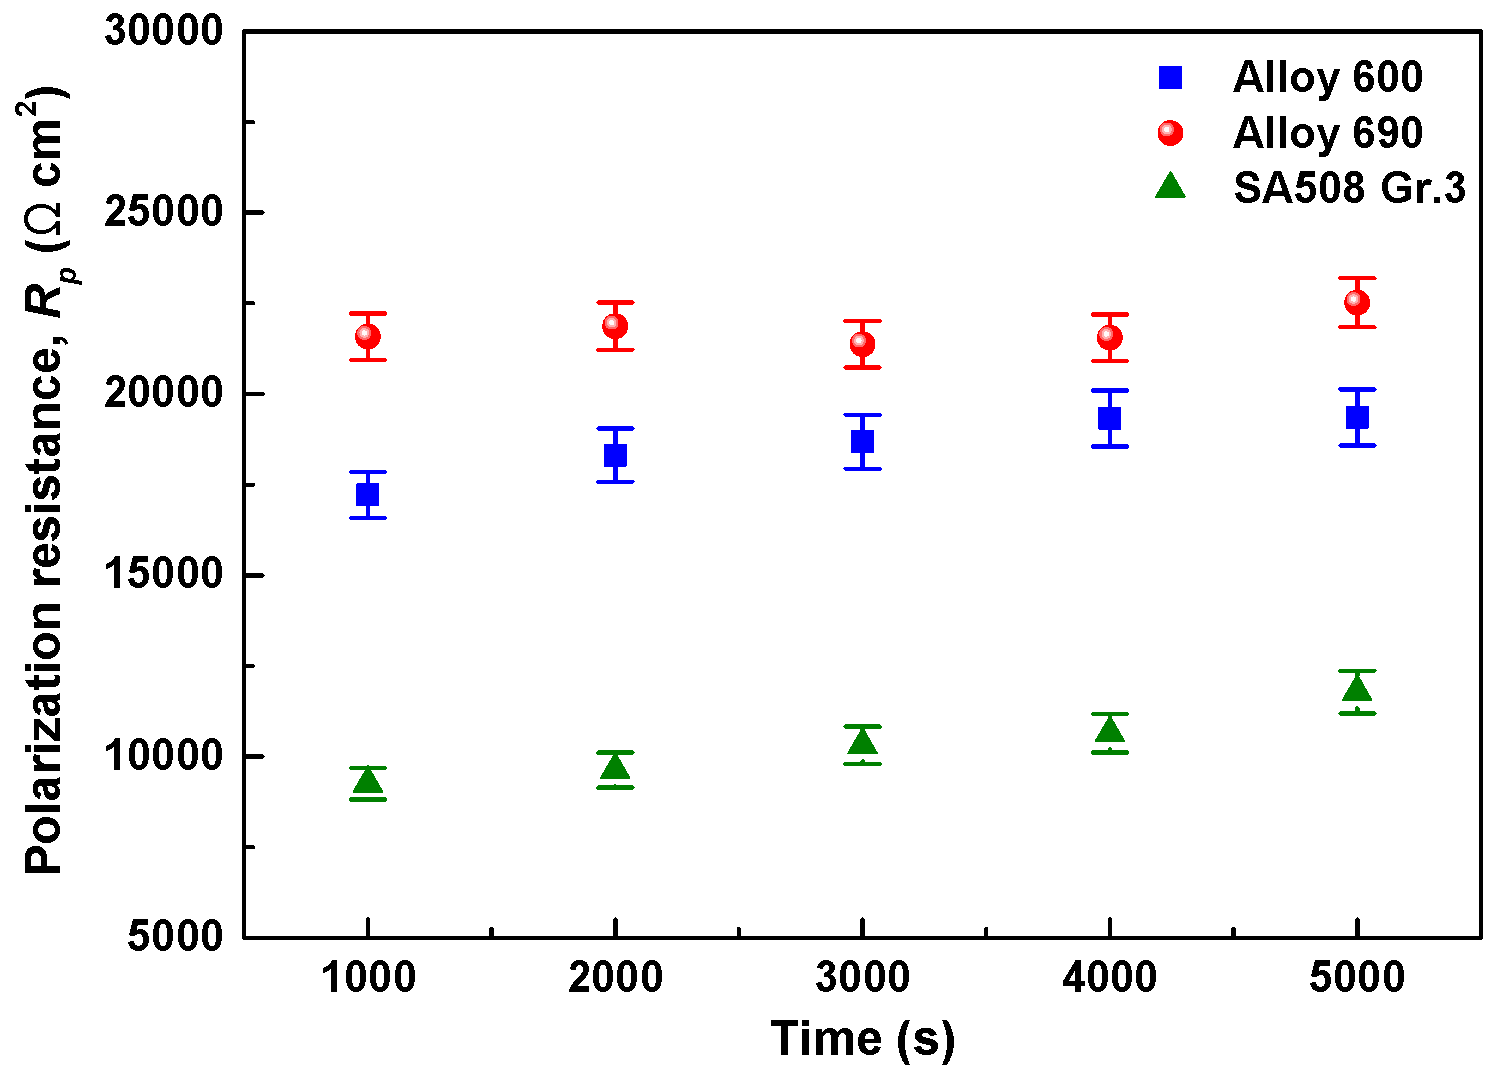
Figure 8 present the polarization resistance (
Rp) of the SG materials as a function of time calculated during linear polarization test. Although the value of
Rp was slightly increased at the early stage, the increase of
Rp value was not large. The mean value of
Rp becomes smaller in order of Alloy 690 > Alloy 600 > SA 508 Gr. 3 (
Table 5). The corrosion current density
icorr. pr calculated from polarization resistance test are similar to those of
icorr.
In secondary coolant system, the magnetite particles are accumulated on the heated surfaces of SG heat exchanger tube and thus, the deposits are very porous in nature due to boiling behavior on SG tube surface [
14,
15]. Among the aggressive impurities, the metal ions such as Cu and Pb ions are concentrated within the pores formed on the magnetite layer and will be in the metallic particle form by electrochemical reduction reaction. When the corrosion products such as Cu and Pb and SG materials are electrically contacted within the micro-pores of magnetite flake, a galvanic corrosion between SG materials and corrosion products (magnetite, Cu, and Pb) will occur because magnetite, Cu, and Pb has a high electrical conductivity. Therefore, the polarization curves of
Figure 8 were rearranged in
Figure 9 to predict the galvanic corrosion behavior between SG materials and corrosion products using the mixed potential theory. As mention above, in order to more accurately obtain the
Ecouple and the
icouple of the SG materials, the measured polarization curve were re-calculated by using Equations (1) and (2). In galvanic couple, the
Ecouple and the
icouple are determined by the intersection of the calculated anodic curve of SG materials and the measured cathodic curve of corrosion products. The galvanic corrosion parameters are presented in
Table 6. As shown in
Figure 9 and
Table 6, when SG materials and corrosion products are galvanically coupled in equal area (area ratio (AR) of cathode/anode = 1), the
Ecouple of the all galvanic couple is expected to shift in the positive direction and the
icouple of all SG materials is significantly increased by the coupling.
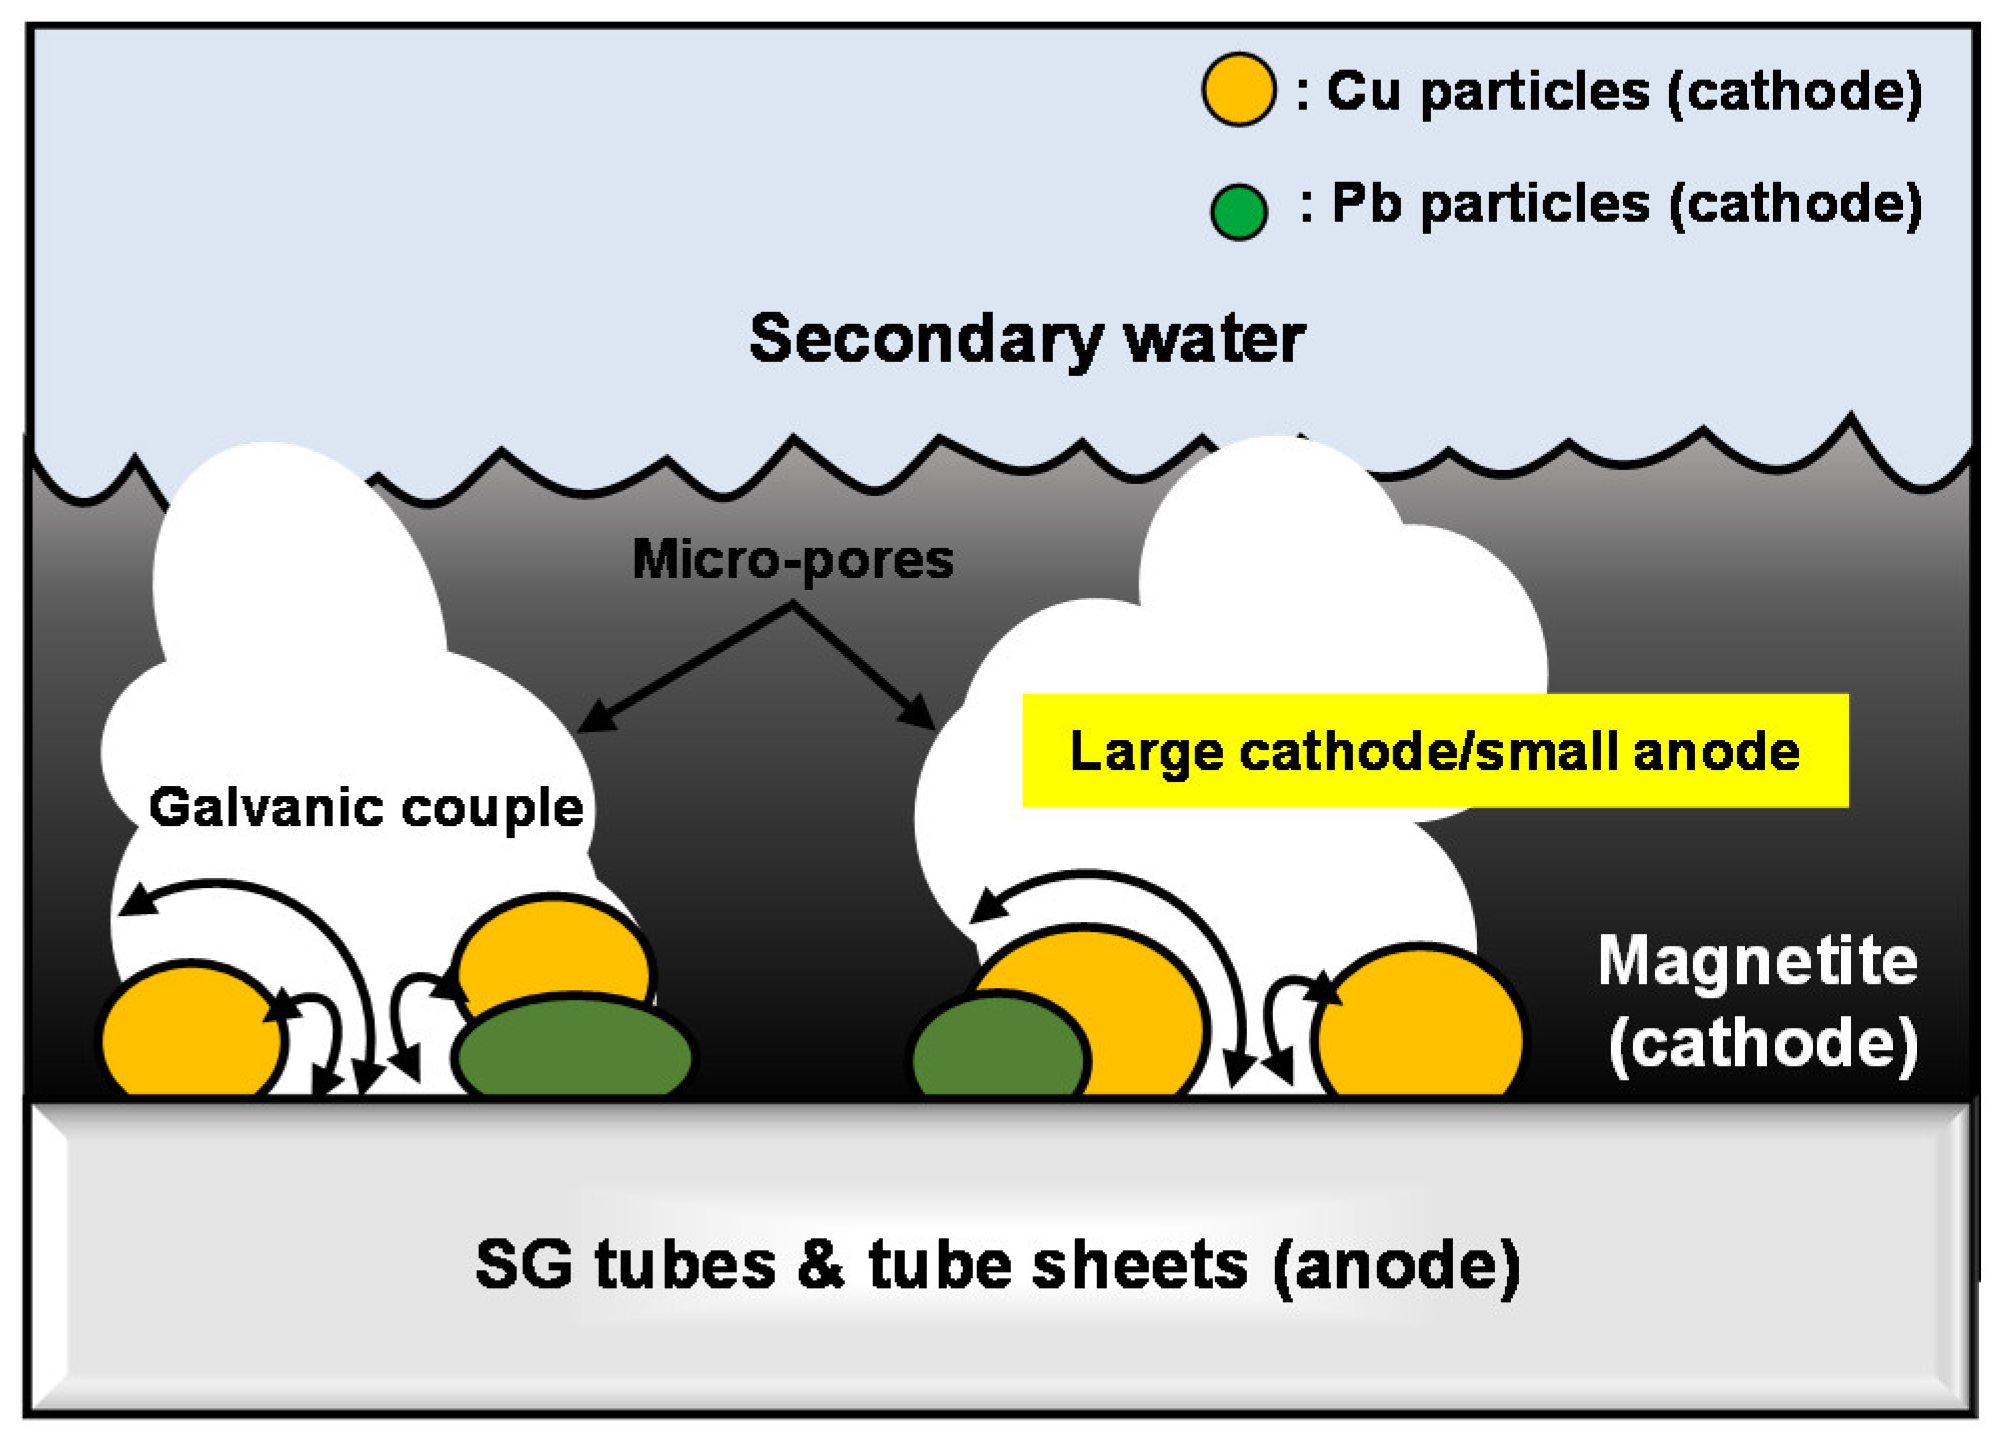
In general, the surface of SG tube is typically covered with the magnetite layer under the alkalized reducing conditions of PWRs. This magnetite layer contains many micro-pores. As shown in
Figure 10, the small surface area of SG tube is exposed to the reducing secondary water due to the micro-pores at the oxide/steel interface. In this case, the exposed surface of SG tube is galvanically coupled to a relatively large area of magnetite, metallic Cu and Pb particles. Consequently, the corrosion is accelerated from the small surface area of SG tube owing to the galvanic coupling with magnetite, Cu and Pb particles. Hence, the AR effect on the corrosion acceleration of SG materials should be elucidated.
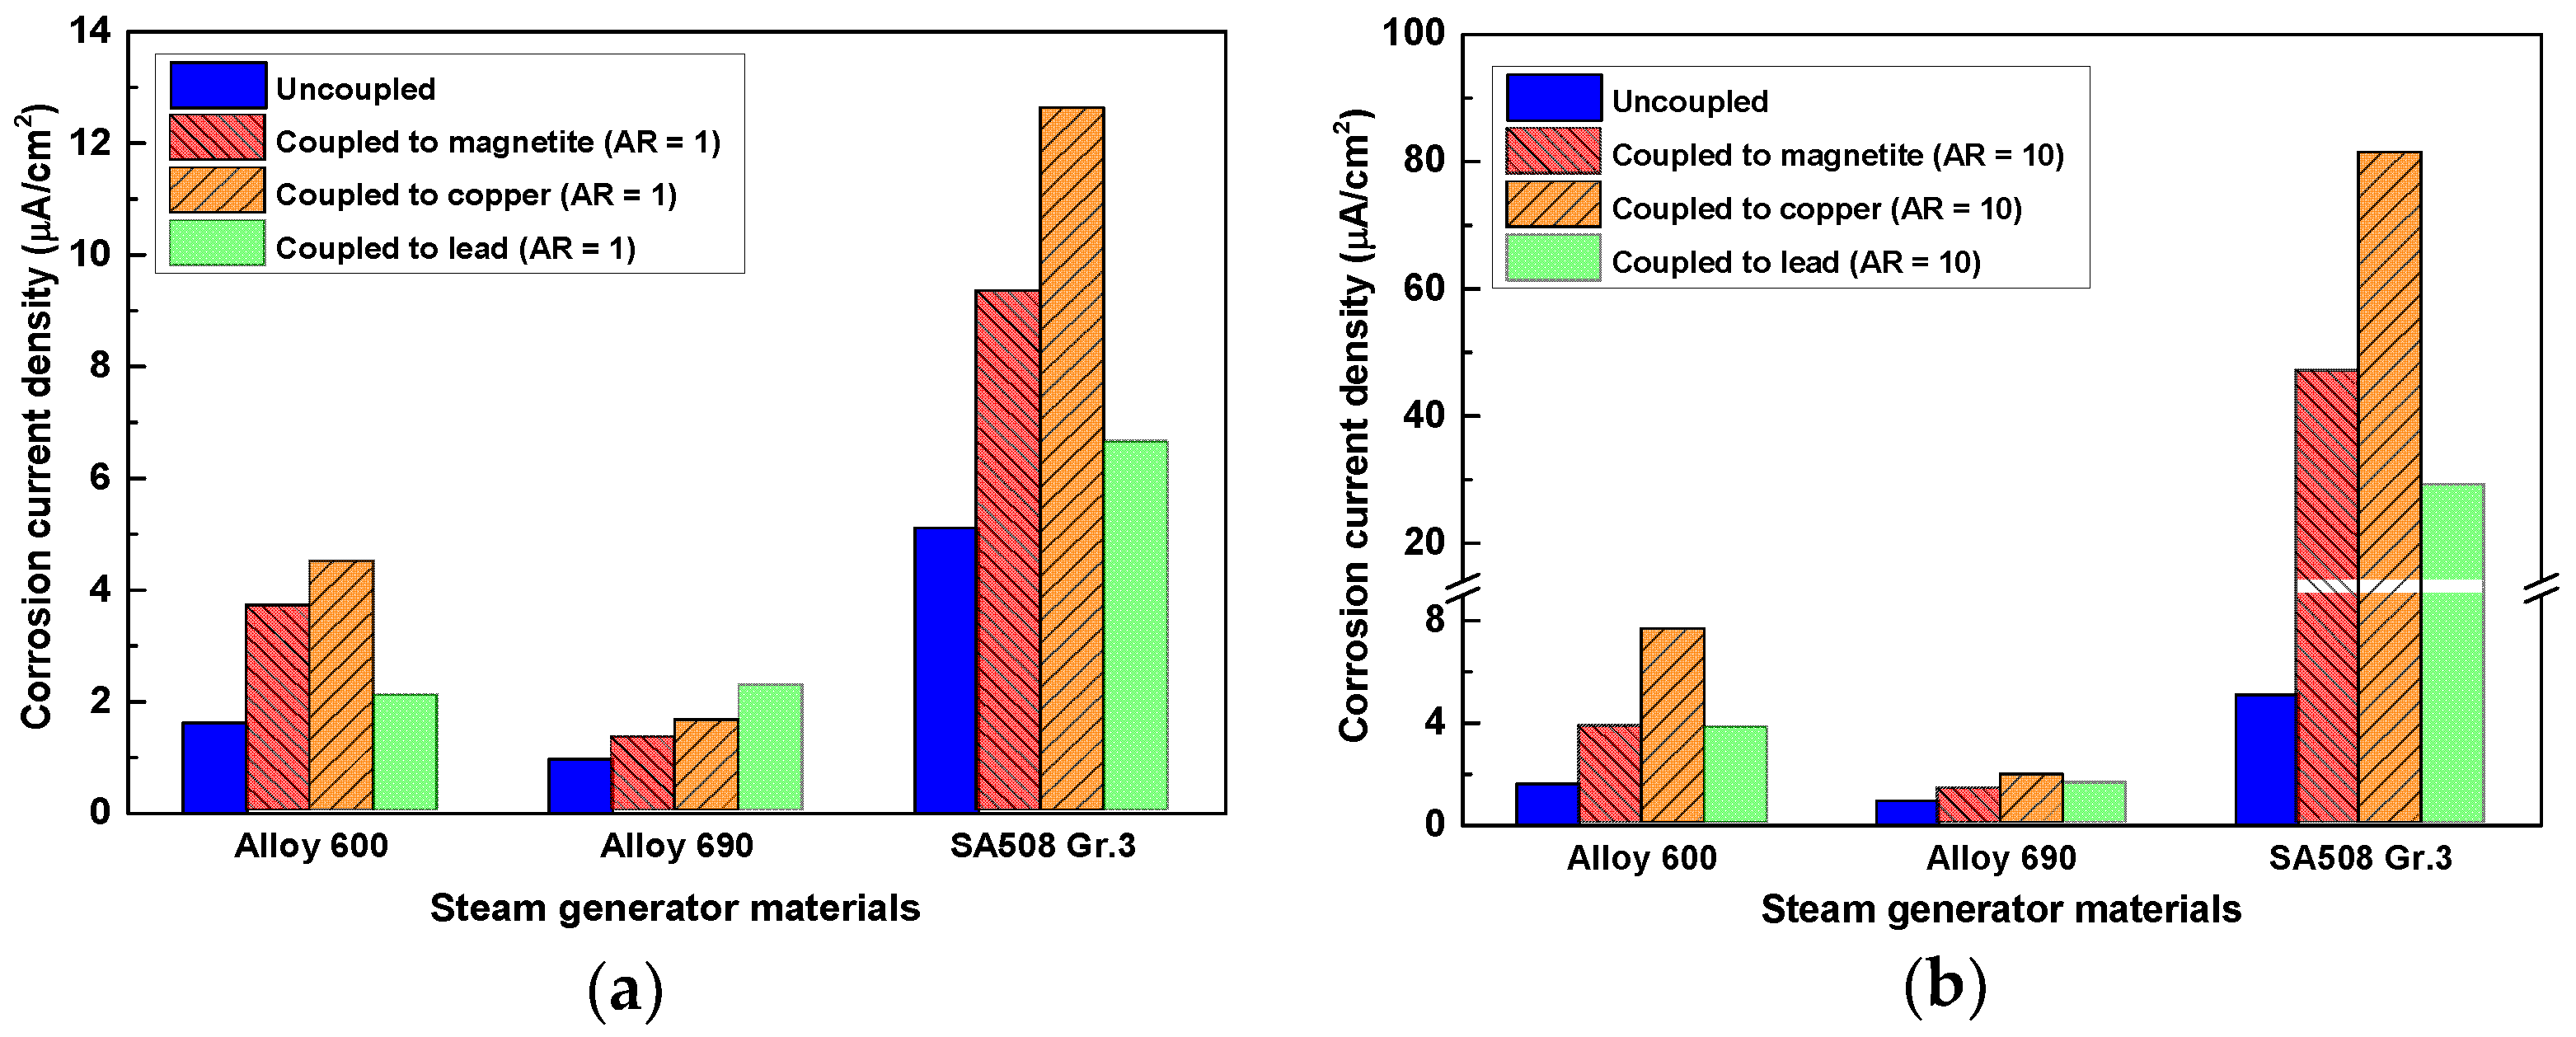
To evaluate the AR effect on the galvanic corrosion, polarization curves of corrosion products with an area of 12 cm
2 (AR = 10) were rearranged and calculated by the polarization curves of those with an area of 1.2 cm
2 (AR = 1). The changes in the corrosion current density of SG materials caused by the galvanic coupling and AR (1 → 10) were summarized in
Figure 11. In the case of AR = 1, the degree of galvanic effect of Alloy 600 and SA 508 Gr.3 is ranked in the following order: Cu > magnetite > Pb. In addition, that of Alloy 690 is in the following order: Pb > Cu > magnetite. The accelerated corrosion of SG materials becomes more severe due to the increased AR from 1 to 10. In the case of AR = 10, The degree of galvanic effect of Alloy 600 and SA 508 Gr.3 is ranked in the following order: Cu > magnetite > Pb. In addition, that of Alloy 690 is in the following order: Cu > Pb > magnetite. In the case of AR = 10, Cu has the largest galvanic effect on all SG materials.
As reported in many previous studies [
4,
5,
6,
7,
8,
9], this work again confirmed that magnetite accelerates the corrosion rate of SG materials by galvanic coupling. In addition, the results in this work had shown that metallic Cu and Pb as well as magnetite increased the corrosion rate of SG materials. Furthermore, when the AR was increased, Cu has the largest galvanic corrosion effect. Based on these results, the galvanic effect of corrosion products on the SG material should take into account not only the magnetite but also the metal form of Cu and Pb. Therefore, even if trace amount of Cu particles are present in the SG tube deposits, the Cu removal process should be included in the chemical cleaning process.


