Article

Anisotropy of the Microstructure and Tensile Properties in Ti-5Al-5Mo-5V-1Cr-1Fe near β Titanium Alloy during Hot Rolling and Heat Treatment

State Key Laboratory of Powder Metallurgy, Central South University, Changsha 410083, China
*
Author to whom correspondence should be addressed.
Metals 2018, 8(11), 904; https://doi.org/10.3390/met8110904
Submission received: 15 October 2018 / Revised: 29 October 2018 / Accepted: 31 October 2018 / Published: 5 November 2018

Abstract

:
Ti-55511 billet with the acicular α initial microstructure was hot rolled (HR sample) and then heat treated (HR+HT sample) at 750 °C. The effects of HR and HT on the anisotropy of microstructure, texture, and tensile properties were investigated. The tensile results show that there are obvious anisotropic tensile properties between RD and TD. The anisotropic elongation of HR sample is related to the morphology of α phase. After HR, the acicular α is parallel to RD. As for RD specimen, the transgranular propagation of microcrack passing through the acicular α phase leads to the ductile fracture, thus showing the higher ductility than TD specimen. While the intergranular propagation of microcrack passing by the equiaxed α phase in TD specimen causes the brittle fracture. The anisotropic strength of HR sample depends on the relationship among texture type of α phase, slip system, and loading direction. The maximum texture intensity at TD leads to the easy activation of basal slip system in RD and that of prismatic slip system in TD, and then causes the lower strength of RD specimen than TD specimen. After HT, the decreased anisotropy of elongation and strength can be attributed to the increased α size and the decreased texture intensity of α phase. These results demonstrate that anisotropic tensile properties mainly depend on the morphology and texture of α phase.

1. Introduction

Titanium and titanium alloys with super specific strength, good resistance to corrosion, and high biocompatibility have attracted much attention and are widely used in industrial areas such as aerospace, vessel and biomedicine [1,2]. Near β titanium alloys such as Ti-5Al-5Mo-5V-1Cr-1Fe (Ti-55511) [3], Ti-5Al-5Mo-5V-3Cr-1Zr (Ti-55531) [4], Ti-7Mo-3Nb-3Cr-3Al (Ti-7333) [5] are suitably used to manufacture large structural components in the aerospace field.
Rolling is an important deformation method to manufacture the sheets and plates of titanium alloys [6,7]. Rolling can cause a specific plastic flow and result in the change of grain morphology [8,9,10]. For instance, α grains in two-phase titanium alloy can be elongated along rolling direction [11]. Some researchers investigated the effect of α grain orientation on the anisotropic ductility in near-α and α+β titanium alloys. Ye et al. [12] discussed the influence of grain orientation on the elongation to fracture in cold-rolled Ti-6Al-4V alloy, and found that the ductility of transverse direction (TD) specimen is higher than that of rolling direction (RD) specimen. Because of the relatively low amount and dispersed distribution of α phase in β matrix [13,14], the microstructure evolution of near-β titanium alloy should be much different from that of most-investigated Ti-6Al-4V. So it’s essential to study the influence of the special morphology of α phase on the anisotropic ductility in near-β titanium alloys.
Meanwhile, rolling easily causes the intense crystallographic texture in α and β phase and further results in the obvious anisotropic mechanical properties in titanium alloys [15,16]. It is worth noting that the different c/a ratio of hexagonal close-packed (HCP) crystal structure can lead to the different type of texture [17,18]. For example, Won et al [19] proposed that the high-purity α-Ti rolled plate has a TD split basal texture, and found that it can lead to the anisotropic slip behaviors, and further result in the anisotropic mechanical properties. Li et al. [20] studied the near-α titanium alloy Ti60 plate with the remarkable T-type texture, and found that the T-type texture causes the different activation of prismatic <a> slips in TD and RD specimen, and shows the higher strength in TD specimen. Due to the high contents of β stabilizer and special c/a ratio in HCP crystal structure [21], the texture and activation of slip systems in near β Ti-55511 alloy may be different from other titanium alloys. Therefore, it’s necessary to study the effect of special texture on the anisotropic mechanical property of Ti-55511 rolled plate. Besides, the effect of the subsequent heat treatment after rolling on the anisotropy of mechanical property also needs to be further investigated.
Therefore, the current work focuses on illustrating the effects of hot rolling and heat treatment on the anisotropy of microstructure and tensile properties of Ti-55511. Firstly, the room temperature engineering stress-strain curves of Ti-55511 samples were obtained by tensile test. Then, the intensity and components of texture were analyzed by the pole figure and ODF plots, and the fracture surface and crack observation were utilized to explain the mechanism of anisotropic elongation. Finally, the effect of heat treatment on the decreased anisotropy was explained. Our work enriches researches about anisotropic tensile properties of titanium alloys and can offer a helpful guidance for industrial production.

2. Experimental Details

The raw material was Φ 200 mm Ti-55511 forged bar provided by Hunan Goldsky Titanium (Industry Technology Co. Ltd., Changde, China). The chemical compositions (wt %) were Al-5.20, Mo-4.92, V-4.96, Cr-2.99, Zr-1.08, Fe-0.40 and balance Ti. The β transus temperature was measured to be 875 ± 5 °C by a metallographic method. The 110 mm × 45 mm × 12 mm billets were line cut from the forged bar. To obtain the acicular α microstructure, the billets were solution heated at 920 °C for 15 min, water quenched to room temperature, and then aged at 750 °C for 30 min, followed by a final water quenching to room temperature. The as-resulted microstructure shows the homogeneous and triangular distribution of acicular α in β matrix (Figure 1). The heat-treated billets were subjected to the unidirectional hot rolling up to 56% reduction at 750 °C. During rolling, the samples were reduced by 8% in each pass, and after each pass, the billets were put back into the furnace for 15 min in order to re-attain the rolling temperature. After final pass, the deformed samples were water quenched (HR sample), followed by heat treatment at 750 °C for 120 min and then water quenching (HR+ HT sample). The HR and HR+HT samples were line cut along the transverse direction (TD) and rolling direction (RD). The microstructure was observed by the Helios NanoLab G3 UC scanning electron microscopy (SEM) (FEI Electron Optics B.V., Brno, Czech Republic) equipped with Electron Back Scattered Diffraction (EBSD) detector. The samples for SEM were prepared through mechanical grinding and polishing, and then etching with the Kroll’s reagent of 1.5 mL HF + 3 mL HNO3 + 100 mL H2O. The samples for EBSD were prepared through mechanical grinding and polishing, and then electrolytically polishing with 95% ethanoic acid + 5% perchloric acid. And the EBSD data were analyzed by TSL-OIM software (7.3, EDAX, Mahwah, NJ, USA). The texture of samples was measured by the Bruker D8 Discover XRD detector (Bruker, Karlsruhe, Germany) at 30 kV with CuKα radiation. The flat dog-bone-shaped tensile samples (Figure 1) were line cut along TD and RD and then mechanically polished. The tensile tests were conducted by Instron Testing Machine (Instron, High Wycombe, UK) at room temperature with the cross-head speed of 1 mm/min. For the statistical purpose, three tensile samples for each condition were performed. The fracture morphology of tensile samples was observed by NOVATM Nano SEM 230 scanning electron microscope (FEI Electron Optics B.V., Brno, Czech Republic).

3. Results

3.1. Anisotropy of Tensile Properties

Figure 2 shows the engineering stress-strain curves of different samples at room temperature. And the ultimate tensile strength (UTS) and elongation are summarized in Table 1. With the increasing of strain, the engineering stress in four curves increase rapidly to reach the peak value, followed by a slowly decreasing up to be fractured. In both HR and HR+HT samples, the UTS along RD are higher than that along TD, while the elongation along RD are lower than that along TD. So the hot rolling results in the obvious anisotropy of tensile properties. After heat treatment, the UTS along RD and TD both decrease: the UTS along RD decreases from 1056 MPa to 1017 MPa, and the that along TD decreases from 1102 MPa to 1042 MPa. The elongations along RD and TD both increase: the elongation along RD increases from 11.8% to 13.1%, and the elongation along TD increases from 6.7% to 10.3%. Furthermore, the heat treatment decreases the anisotropy of tensile properties: the differences between RD and TD values of UTS/elongation decrease from 46 MPa/5.1% before HT to 25 MPa/2.8% after HT. The changed anisotropy of tensile properties can be related to the evolution of texture and microstructure after HR and HT.

3.2. Anisotropy of Microstructure

Figure 3 shows the microstructure in the ND-RD and ND-TD planes of HR and HR+HT samples. In the ND-RD plane (Figure 3a), the majority of acicular α have been elongated and rearranged along the rolling direction after hot rolling, and some acicular α shows the localized necking up to be fragmented into equiaxed morphology, which is caused by the dynamic recrystallization, while the equiaxed morphology (namely the cross section of acicular α) is displayed in the ND-TD plane (Figure 3c). After further heating at 750 °C for 120 min, α content has no obvious change, but the coarsening of acicular α is obvious: the diameter of cross section increases from about 0.3 μm (Figure 3b, before HT) to 0.7 μm (Figure 3d). The anisotropy of morphology distribution after HR and the coarsening of acicular α after HR+HT should lead to the discrepancy of tensile properties, crack evolution, and fracture along RD and TD.

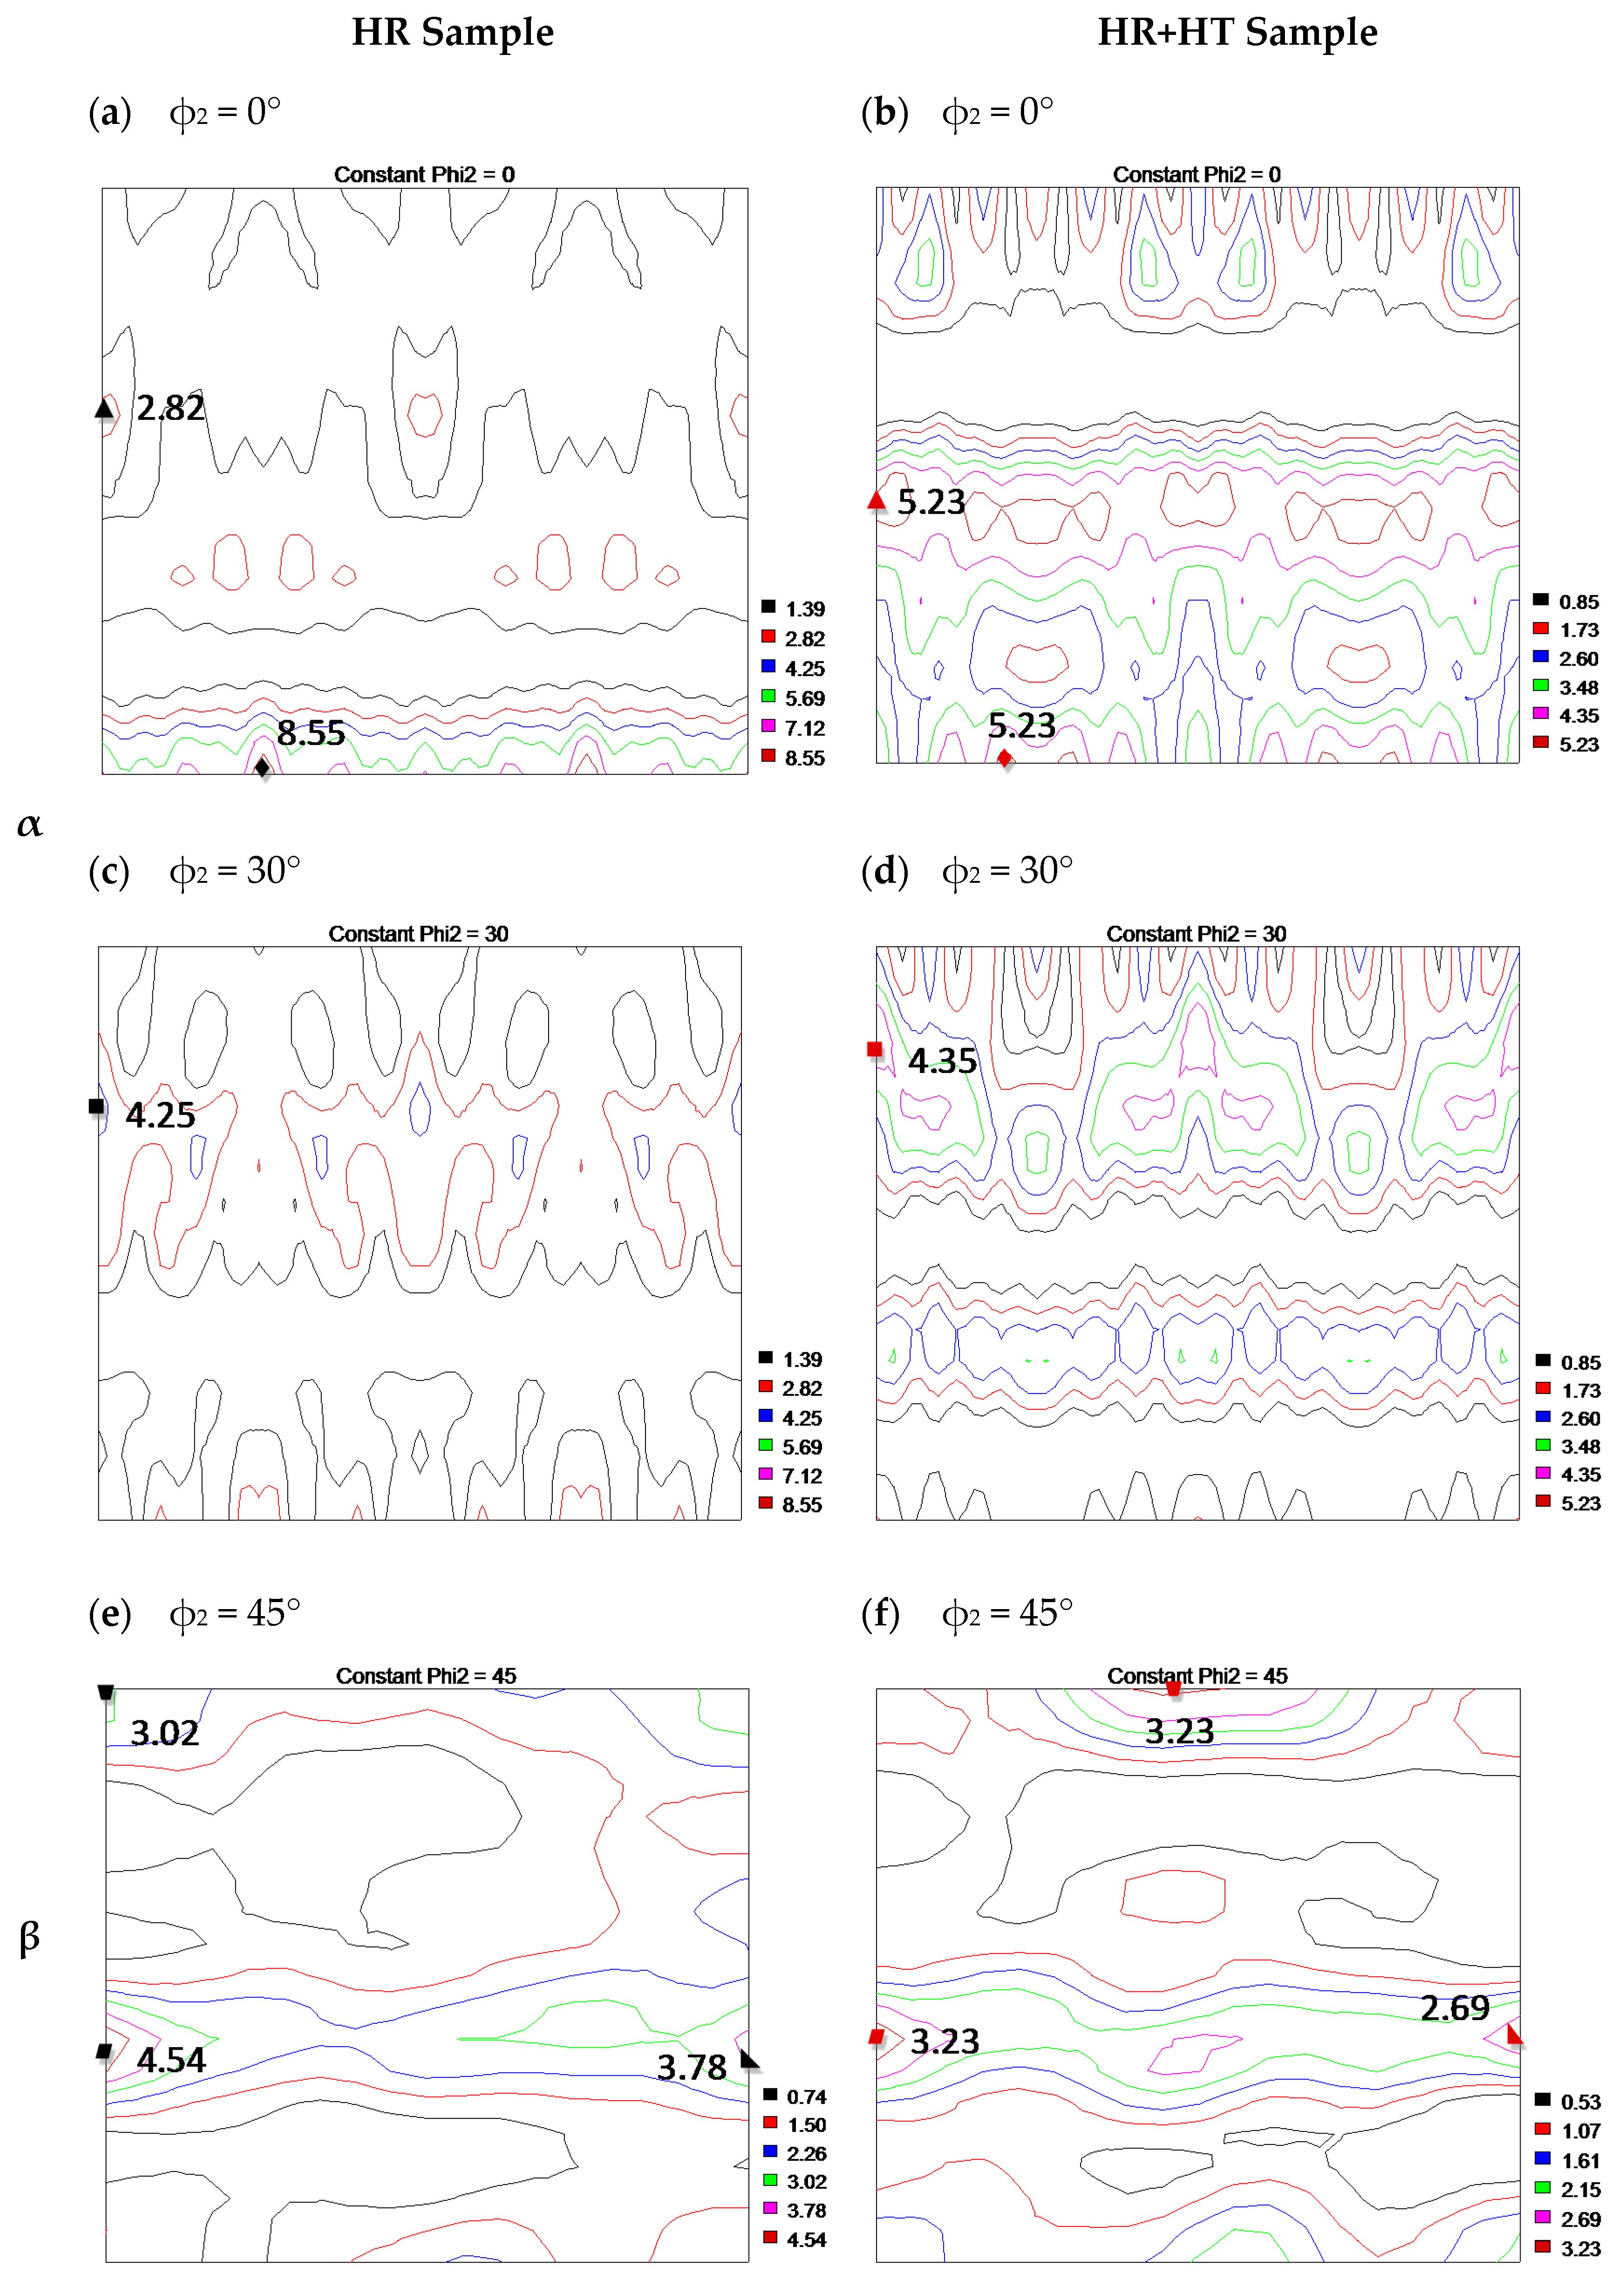
3.3. Texture Characterization

Figure 4 shows the (0002)α and (110)β pole figures of HR and HR+HT samples. After HR, the maximum texture intensities of α and β phases are 5.95 and 5.75 times higher than that of random distribution (Figure 4a,d), respectively. As for α phase, the maximum values locate at TD (Figure 4a). This phenomenon suggests that <0001>α orientation (c axis) is rotated to be nearly parallel to ND-TD plane and perpendicular to RD during HR, in which the angle between TD and c axis is about 58°. The texture pattern of β matrix (Figure 4d) is similar to that of α phase. And the maximum texture intensity at TD also suggests that <110>β orientation is rotated to be parallel to ND-TD plane during HR. After HR+HT, the texture intensity of α and β phases decreases markedly: only 3.87 and 3.64 times higher than that of random distribution (Figure 4b,e). And the values of the maximum texture intensity of α and β phases are still both located at TD, but their positions shift toward the center of pole figures, which suggest the rotation of <0001>α and <110>β orientations in ND-TD plane as shown in Figure 4c,f.
To identify the main texture components of α and β phases, the orientation distribution function (ODF) plots in the RD-TD plane at φ2 = 0° and 30° the α phase and φ2 = 45° for β phase are displayed in Figure 5. It shows that the texture intensities of α and β phases both decreases after HR+HT. Based on the data in Figure 5, the main texture components of α and β phases in the HR and HR+HT samples are summarized in Table 2. Compared with no change about those of β phase, the main texture components of α phase have only small changes, in which the changes are presented in the last number of Miller-Bravais indices.

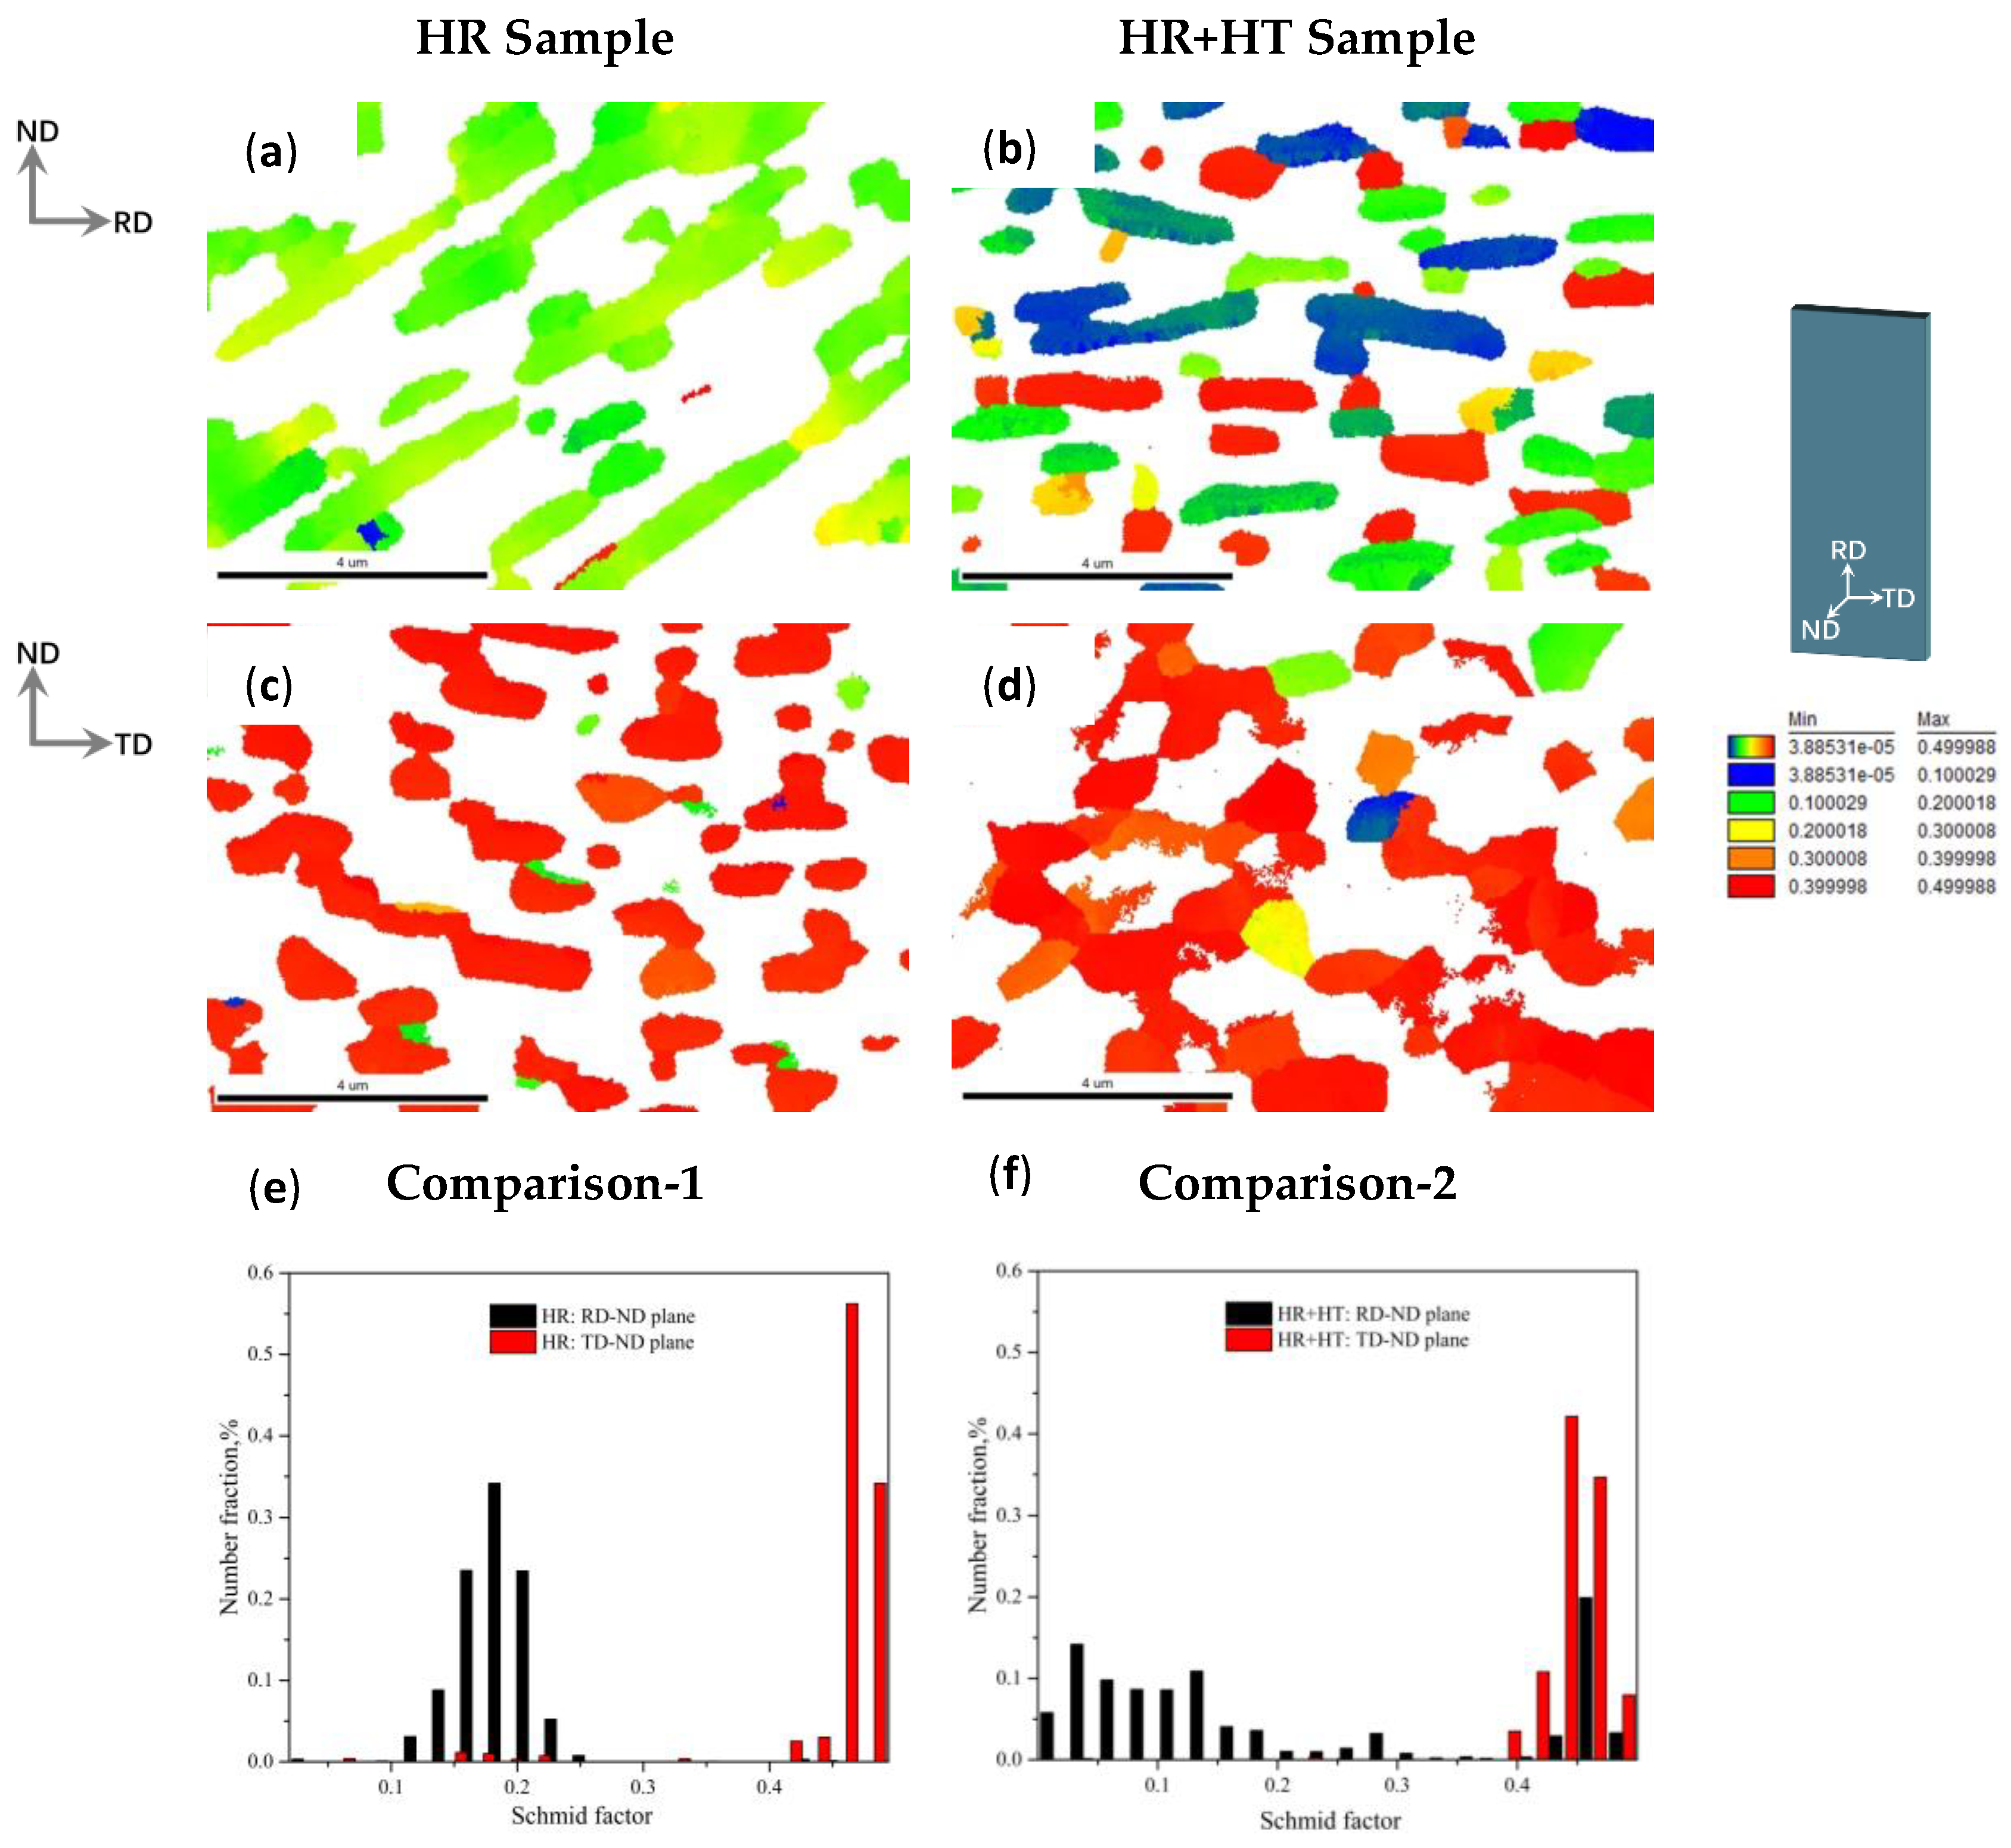
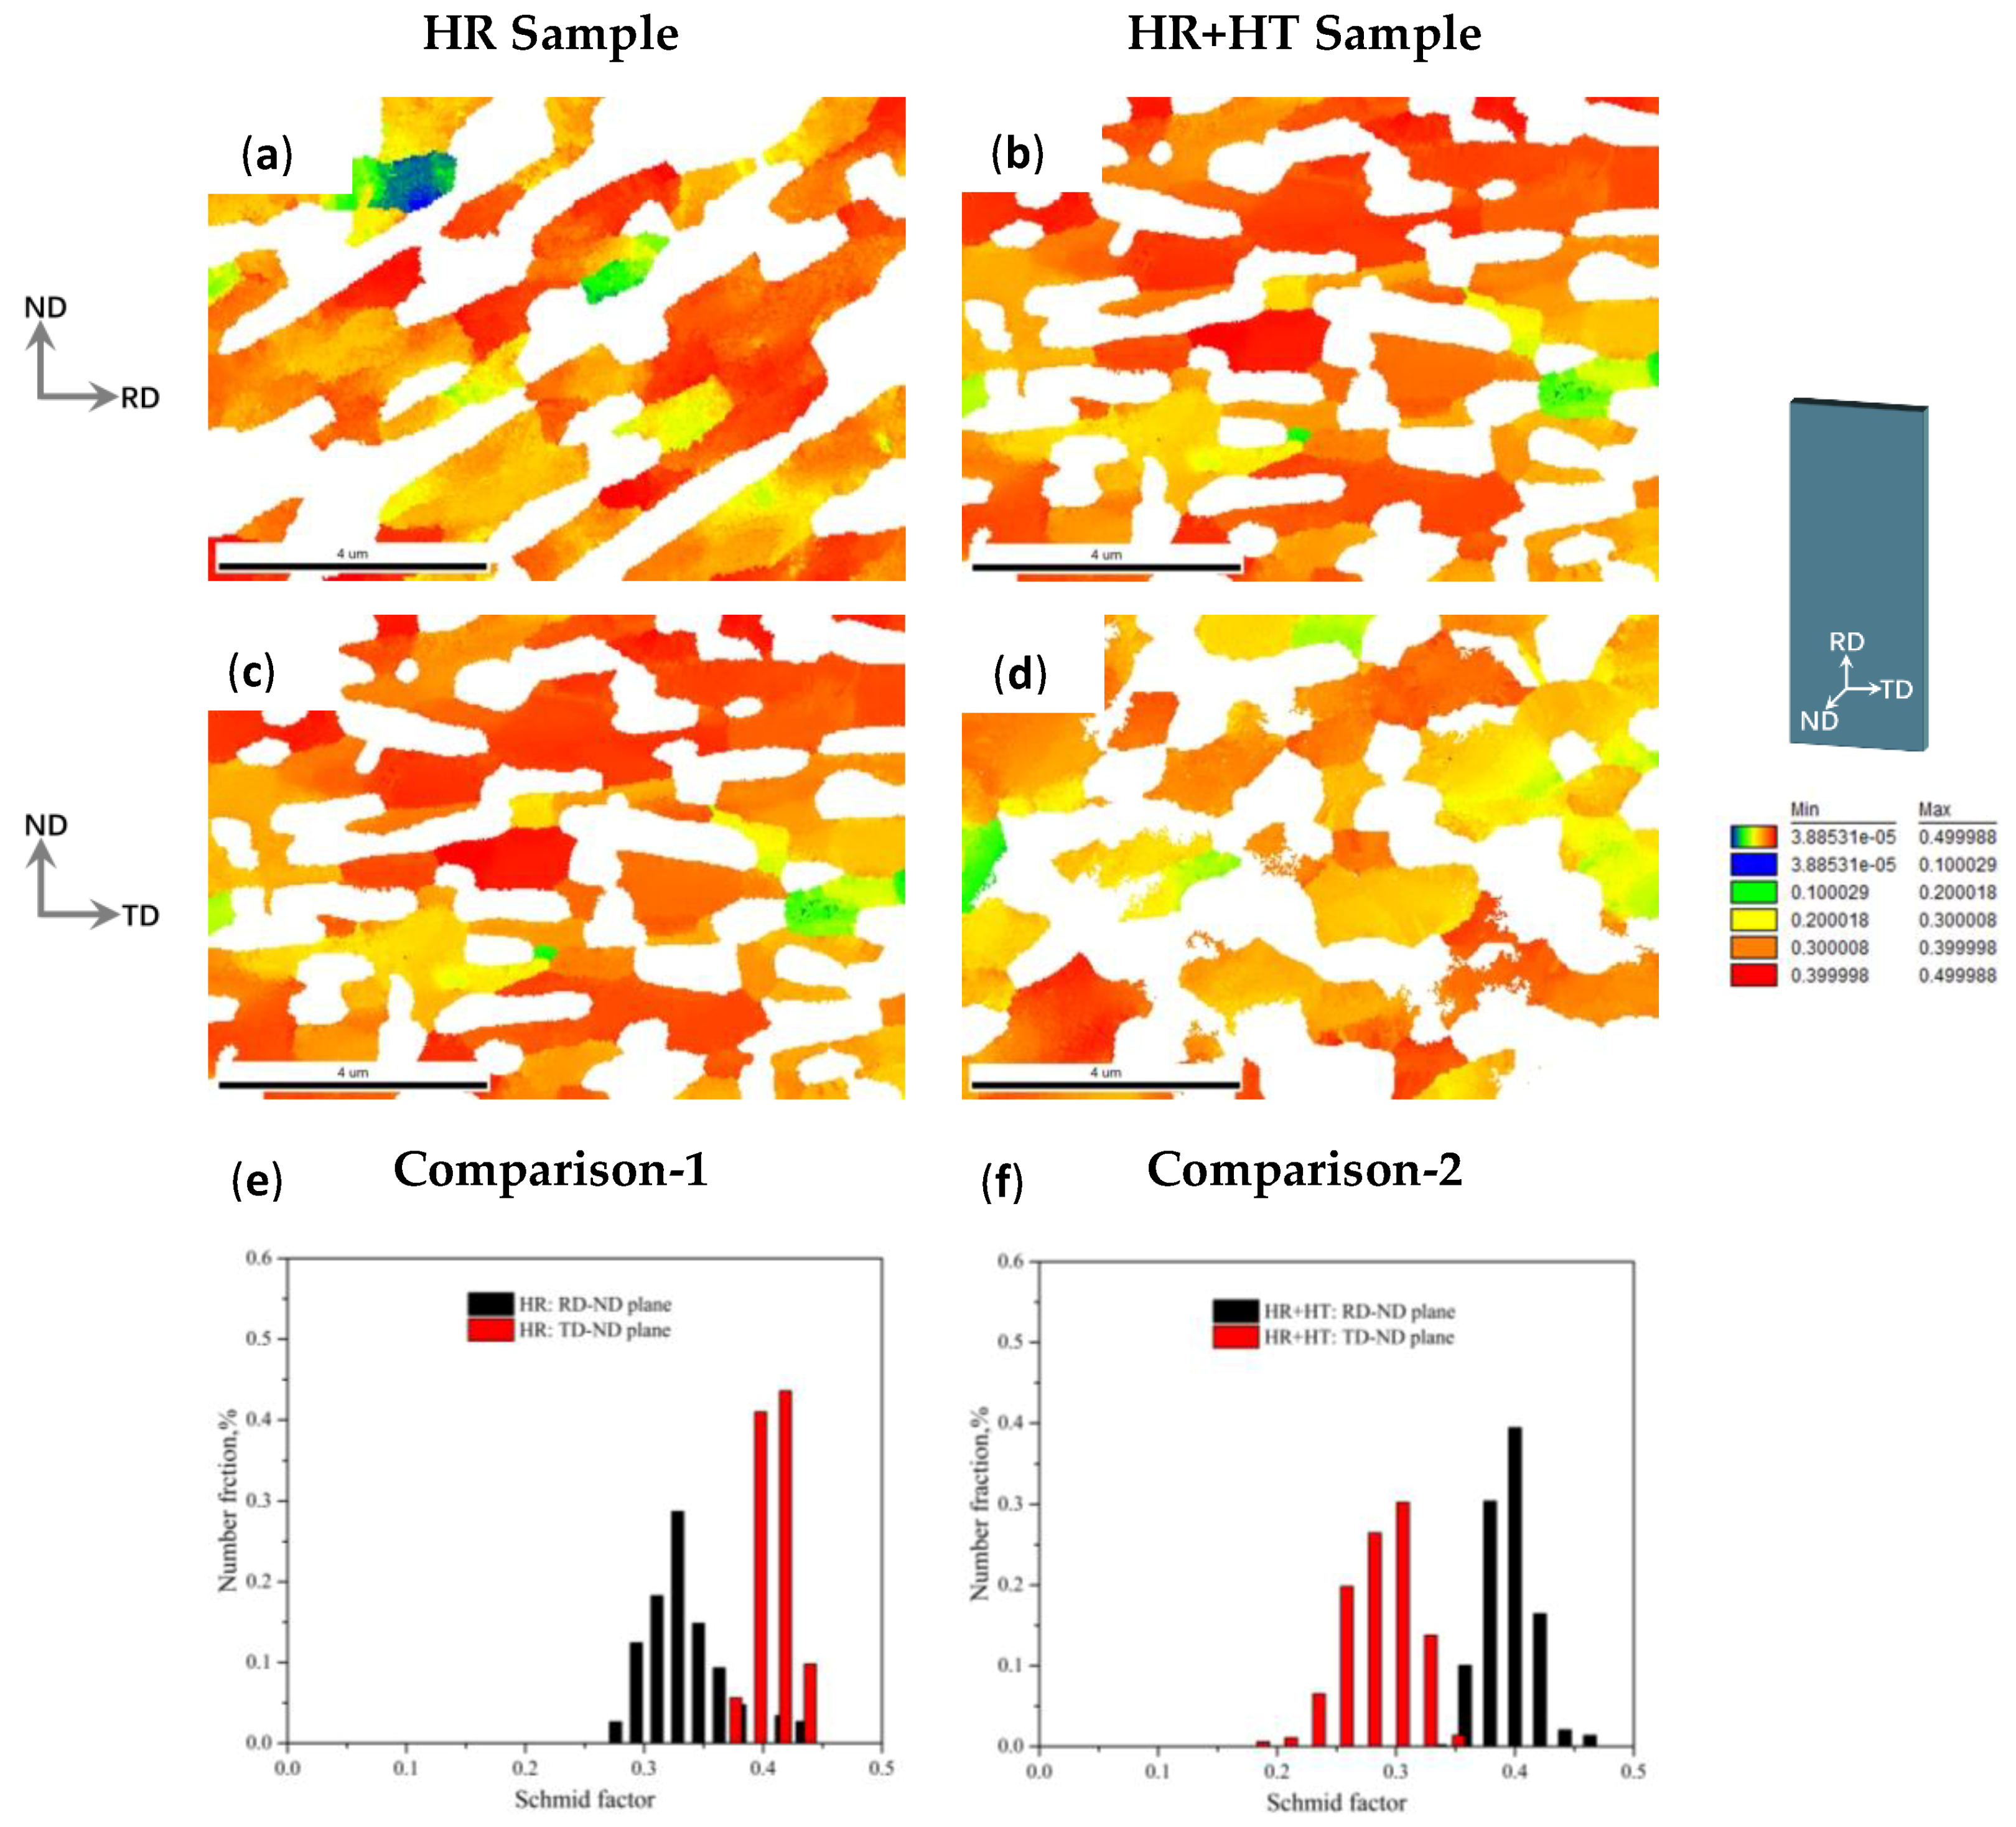
3.4. Schmid Factor Distributions

In order to further investigate the effect of texture on the activation of slip system, The Schmid factor (SF) distributions for the common slip systems of α and β phases have been obtained from the EBSD data, which are displayed in Figure 6, Figure 7 and Figure 8, respectively. The α phase shows the obviously different SF distributions of {0001}<11-20> and {10-10}<1-210> slip systems between ND-RD and ND-TD planes of HR and HR+HT samples. As for the {0001}<11-20> slip system ofα phase for HR sample, the SF values in ND-RD plane are all <0.3, while those in ND-TD plane are all >0.4 (seeing Comparison-1 in Figure 6). After HR+HT, the proportion of the SF values >0.4 in ND-RD plane increases, and those in the ND-TD plane are still all higher than 0.4 (seeing Comparison-2 in Figure 6). As for the {10-10}<1-210> slip system of α phase for HR sample, the SF values in ND-RD plane relatively uniformly arrange from 0.1 to 0.5, and the most of SF values in ND-TD plane are located at <0.3. After HR+HT, the SF in the ND-RD and ND-TD planes both shift toward the higher value, in which the proportion of SF values >0.3 increases obviously.
Compared with those of α phase, the SF distributions of {110}<1-11> slip system in the β phase of HR and HR+HT samples are both relatively centralized. As for the HR sample, the SF values in ND-RD plane are slightly lower than those in the ND-TD plane. After HR+HT, the increased SF values in ND-RD plane and decreased SF values in ND-TD plane are observed, which result in the inverse phenomenon to that in the HR sample. But the SF values are still relatively high.

3.5. Fracture Behavior

Figure 9 shows the fracture morphology of HR and HR+HT samples in ND-TD plane (Figure 9a,b, fracturing along RD) and the ND-RD plane (Figure 9c,d, fracturing along TD), respectively. As for the HR sample, the dense and homogeneous dimples with the size of about 10 μm and the small tearing ridges are observed after fracturing along RD (Figure 9a), in which the fracture mode can be considered as a ductile fracture. The fracture of HR sample along TD presents the crack and distinct facet (Figure 9c), which is thought to be an apparent brittle fracture. After HR+HT, the large and deep dimples with tearing ridge can be clearly seen after fracturing along RD (Figure 9b), while the numerous shallow dimples are observed at TD (Figure 9d). Therefore, the fracture along RD and TD both show the ductile feature after HT. And the decreased discrepancy of fracture modes between RD and TD after HT suggests the decreased anisotropy.
Figure 10 shows the microcracks of HR and HR+HT samples in the ND-RD plane (Figure 10a,b, fracturing along RD) and ND-TD plane (Figure 10c,d, fracturing along TD), respectively. In the ND-RD plane of HR sample (Figure 10a), the microcracks straightly cross the acicular α phase, indicating the transgranular mode. However, in the ND-RD plane of HR sample (Figure 10c), the microcrack propagates along the equiaxed morphology of α phase, implying the intergranular mode. After HR+HT, in the ND-RD plane, the transgranular propagation of microcrack passing through the thicker acicular α shows the zigzag track (Figure 10b), while the ND-TD plane of HR+HT sample presents the transgranular propagation of microcracks (Figure 10d).

4. Discussion

4.1. Effect of α Morphology on the Anisotropy of Ductility

After hot rolling at 750 °C (HR sample), the α morphology of HR sample along RD and TD is lamellar (Figure 3a, showing ND-RD plane) and equiaxed (Figure 3c, showing ND-TD plane), respectively. And the fracture along RD and TD is ductile mode (Figure 9a) and brittle mode (Figure 9c), respectively. Based on the further microcrack observation, the crack propagation during fracture is transgranular mode (Figure 10a) and intergranular mode (Figure 10c), respectively. The tensile ductility is related to the resistance to microcrack nucleation and propagation [22,23]. Due to the same microdefect state for the same HR billet, the microcrack nucleation resistance in RD and TD specimen can be deemed as same, so the effect of the α morphology discrepancy on the microcrack propagation along RD and TD should be considered. As for the tensile test along RD (RD specimen), the acicular α is parallel to the tensile direction. Also, because the microcrack propagation is usually perpendicular to the tensile direction, the microcrack is inevitable to pass through the relatively harder acicular α (Figure 10a), thus suggesting the higher resistance to the microcrack propagation and then leading to the better ductility of RD specimen (11.8% elongation). In the case of the tensile test along TD (TD specimen), α phase shows the equiaxed morphology (cross section of acicular α). In this situation, the microcrack in TD specimen tends to pass by the equiaxed morphology and propagates in the relatively softer β matrix (Figure 10c), so the less resistance to the microcrack propagation results in the lower ductility (6.7% elongation). The effect of the different morphology of α phase along RD and TD on the microcrack propagation causes the anisotropic ductility.
After the subsequent HT at 750 °C (HR+HT sample), the fracture along RD (Figure 9b) and TD (Figure 9d) is both ductile mode. The microcrack propagation mode during fracturing along RD is transgranular mode (Figure 10b), but that along TD shifts from intergranular mode before HT (Figure 10c) into transgranular mode (Figure 10d). And Table 1 shows the more increasing of ductility along TD (increasing 3.6%) than RD (increasing 1.3%) after HT, thus causing the decreased anisotropy of ductility between RD and TD: the discrepancy of elongation between RD and TD decrease from 5.1% before HT to 2.8% after HT. In case of tensile test along the TD, the increased ductility after HT is resulted from: (1) the decreased dislocation density (i.e., the more difficult microcrack nucleation), and (2) the coarsen of equiaxed α morphology (Figure 3d, i.e., shifting into transgranular propagation mode in Figure 10d), thus displaying the ductile fracture (Figure 9d). Although the decreased dislocation density and the longer zigzag propagation track (Figure 10b) in the thicker acicular α (Figure 3b) also increase the ductility along RD (showing the larger and deeper dimples in Figure 9b), the more increased ductility along TD results in the decreased anisotropy of ductility, which is determined by the morphology evolution of acicular α along RD and TD after HT and the microcrack nucleation/propagation.

4.2. Effect of α Texture on the Anisotropy of Strength

After hot rolling at 750 °C, RD shows the lower UTS (1056 MPa) than TD (1102 MPa), which can be explained by the relationship among texture type, slip system, and loading direction. (0002)α pole figure (Figure 4a) suggests that c axis of α phase is nearly parallel to the ND-TD plane and perpendicular to RD (Figure 4c). Therefore, in case of RD specimen, the loading direction is parallel to the basal plane, thus suggesting the difficult activation of basal slip system (showing the low average SF value of 0.20 in Figure 6); while 6 prismatic planes and their angles to the loading direction suggests the relatively easy activation of prismatic slip system (showing the high average SF value of 0.40 in Figure 6). In case of TD specimen, (0002)α pole figure (Figure 4a) suggests the angle of about 58° between basal plane and loading direction, so the activation of basal slip system is relatively easy (showing the high average SF value of 0.45 in Figure 7), while that of prismatic slip system is relatively difficult (showing the low average SF value of 0.20 in Figure 7). The activation of slip systems depends on the activation stress CRSS/SF [24]. It has been reported that the ratio of critical resolved shear stress (CRSS) of basal slip and prismatic slip in α phase is 1:0.7 [25]. And since the average SF values of the prismatic slip system in RD specimen and basal slip system in TD specimen are nearly same, the activation stress of basal slip system in TD specimen is higher than that of prismatic slip system in RD specimen, which leads to the higher strength in TD specimen. Therefore, the anisotropic strength is caused by the texture type of α phase induced by HR.
After subsequent HT at 750 °C, the average α size (Figure 3b,d) increases distinctly. According to the Hall-Petch formula [26], the smaller grain size leads to the higher strength. So, the increased average α size after HT leads to the decreased UTS. Additionally, as mentioned above, since the anisotropic strength is resulted from the texture of α phase, the decreased texture intensity ofα phase (Figure 4) leads to the decreased anisotropy of strength between RD and TD.

5. Conclusions

(1)
The hot-rolled Ti-55511 shows the obvious anisotropic tensile properties: average UTS/elongation of 1056 MPa/11.8% for RD specimens and 1076 MPa/6.7% for TD specimens. After subsequent HT, the discrepancy of tensile properties between RD and TD decreases.
(2)
The anisotropic elongation of HR sample is related to the α morphology. After HR, acicular α grains are parallel to RD. RD specimens show the transgranular propagation of microcracks passing through acicular morphology of α phase, while TD specimens show the intergranular propagation of microcrack passing by equiaxed morphology of α phase, which further leads to the ductile fracture and the higher elongation of RD specimens.
(3)
The anisotropic strength of HR sample depends on the relationship among texture type of α phase, slip system, and loading direction. The special texture of α phase with maximum intensity located in TD leads to the easy activation of basal slip system in RD and that of prismatic slip system in TD, and then causes the lower strength of RD specimens than TD specimens.
(4)
After HT, the increased α size results in the transgranular propagation of microcrack in both RD and TD specimens, thus decreasing the anisotropy of elongation between RD and TD. And the decreased anisotropy of strength can be explained by the decreased texture intensity of α phase.

Author Contributions

C.C. and K.Z. conceived and designed the experiments. Y.M. and Y.L. performed the experiments. X.Z. and Y.M. analyzed the data. X.Z. and Y.M. wrote the paper.

Funding

This research received no external funding.

Acknowledgments

The authors would like to acknowledge financial supports from the National Key R&D Program of China (2018YFB0704100), National Natural Science Foundation of China (No. 51871242), and the Key R&D Program of Hunan Province, China (No. 2016JC2003).

Conflicts of Interest

The authors declare no conflict of interest.

References

  1. Attar, H.; Haghighi, S.E.; Kent, D.; Dargusch, M.S. Recent developments and opportunities in additive manufacturing of titanium-based matrix composites: A review. Int. J. Mach. Tool Manufact. 2018, 133, 85–102. [Google Scholar] [CrossRef]
  2. Attar, H.; Calin, M.; Zhang, L.C.; Zhang, L.C.; Scudino, S.; Eckert, J. Manufacture by selective laser melting and mechanical behavior of commercially pure titanium. Mater. Sci. Eng. A 2014, 593, 170–177. [Google Scholar] [CrossRef]
  3. Li, C.; Zhang, X.Y.; Zhou, K.C.; Peng, C.Q. Relationship between lamellar α evolution and flow behavior during isothermal deformation of Ti–5Al–5Mo–5V–1Cr–1Fe near β titanium alloy. Mater. Sci. Eng. A 2012, 558, 668–674. [Google Scholar] [CrossRef]
  4. Lv, Y.P.; Li, S.J.; Zhang, X.Y.; Li, Z.Y.; Zhou, K.C. Modeling and Finite Element Analysis for the Dynamic Recrystallization Behavior of Ti-5Al-5Mo-5V-3Cr-1Zr Near β Titanium Alloy During Hot Deformation. High Temp. Mater. Process. 2018, 37, 445–454. [Google Scholar] [CrossRef]
  5. Fan, J.K.; Li, J.S.; Kou, H.C.; Hua, K.; Tang, B. The interrelationship of fracture toughness and microstructure in a new β titanium alloy Ti-7Mo-3Nb-3Cr-3Al. Mater. Charact. 2014, 96, 93–99. [Google Scholar] [CrossRef]
  6. Dong, R.F.; Li, J.S.; Zhou, H.C.; Tang, B.; Hua, K.; Liu, S.B. Characteristics of a hot-rolled near β titanium alloy Ti-7333. Mater. Charact. 2017, 129, 135–142. [Google Scholar] [CrossRef]
  7. Sun, J.F.; Zhang, Z.W.; Zhang, M.L.; Jiang, F.C.; Ding, M.H. Microstructure evolution and their effects on the mechanical properties of TB8 titanium alloy. J. Alloy. Compd. 2016, 663, 769–774. [Google Scholar] [CrossRef]
  8. Murty, S.V.S.N.; Nayan, N.; Kumar, P.; Narayanan, P.R.; Sharma, S.C.; George, K.M. Microstructure–texture–mechanical properties relationship in multi-pass warm rolled Ti–6Al–4V Alloy. Mater. Sci. Eng. A 2014, 589, 174–181. [Google Scholar] [CrossRef]
  9. Chen, Y.; Li, J.S.; Tang, B.; Kou, H.C.; Xue, X.Y.; Cui, Y.W. Texture evolution and dynamic recrystallization in a beta titanium alloy during hot-rolling process. J. Alloy. Compd. 2015, 618, 146–152. [Google Scholar] [CrossRef]
  10. Du, Z.X.; Xiao, S.L.; Shen, Y.P.; Liu, J.S.; Liu, J.; Xu, L.J.; Kong, F.T.; Chen, Y.Y. Effect of hot rolling and heat treatment on microstructure and tensile properties of high strength beta titanium alloy sheets. Mater. Sci. Eng. A 2015, 631, 67–74. [Google Scholar] [CrossRef]
  11. Ari-Gur, P.; Semiatin, S.L. Evolution of microstructure, macrotexture and microtexture during hot rolling of Ti-6Al-4V. Mater. Sci. Eng. A 1998, 257, 118–127. [Google Scholar] [CrossRef]
  12. Ye, X.X.; Yang, Y.Y.; Song, G.L.; Tang, G.Y. Enhancement of ductility, weakening of anisotropy behavior and local recrystallization in cold-rolled Ti-6Al-4V alloy strips by high-density electropulsing treatment. Appl. Phys. A 2014, 117, 2251–2262. [Google Scholar] [CrossRef]
  13. Fan, X.G.; Zhang, Y.; Zheng, H.J.; Zhang, Z.Q.; Gao, P.F.; Zhan, M. Pre-processing related recrystallization behavior in β annealing of a near-β Ti-5Al-5Mo-5V-3Cr-1Zr titanium alloy. Mater. Charact. 2018, 137, 151–161. [Google Scholar] [CrossRef]
  14. Chen, F.W.; Xu, G.L.; Zhang, X.Y.; Zhou, K.C. Isothermal kinetics of β↔α transformation in Ti-55531 alloy influenced by phase composition and microstructure. Mater. Des. 2017, 130, 302–316. [Google Scholar] [CrossRef]
  15. Nakai, M.; Niinomi, M.; Hieda, J.; Cho, K.; Nagasawa, Y.; Konno, T.; Ito, Y.; Itsumi, Y.; Oyama, H. Reduction in anisotropy of mechanical properties of coilable (α+β)-type titanium alloy thin sheet through simple heat treatment for use in next-generation aircraft applications. Mater. Sci. Eng. A 2014, 594, 103–110. [Google Scholar] [CrossRef]
  16. Roth, A.; Lebyodkin, M.A.; Lebedkina, T.A.; Lecomte, J.S.; Richeton, T.; Amouzou, K.E.K. Mechanism of anisotropy of mechanical properties of α-titanium. Mater. Sci. Eng. A 2014, 596, 236–243. [Google Scholar] [CrossRef]
  17. Sahoo, S.K.; Sabat, R.K.; Panda, S.; Mishra, S.C.; Suwas, S. Texture and microstructure evolution of pure zinc during rolling at liquid nitrogen temperature and subsequent annealing. Mater. Charact. 2017, 123, 218–226. [Google Scholar] [CrossRef]
  18. Wagner, F.; Bozzolo, N.; Landuyt, O.V.; Grosdidier, T. Evolution of recrystallisation texture and microstructure in low alloyed titanium sheets. Acta Mater. 2002, 50, 1245–1259. [Google Scholar] [CrossRef]
  19. Won, J.W.; Park, C.H.; Hong, S.G.; Lee, C.S. Deformation anisotropy and associated mechanisms in rolling textured high purity titanium. J. Alloy. Compd. 2015, 651, 245–254. [Google Scholar] [CrossRef]
  20. Li, W.Y.; Chen, Z.Y.; Liu, J.R.; Wang, Q.J.; Sui, G.X. Effect of texture on anisotropy at 600 °C in a near-α titanium alloy Ti60 plate. Mater. Sci. Eng. A 2017, 688, 322–329. [Google Scholar] [CrossRef]
  21. Nyakana, S.L.; Fanning, J.C.; Boyer, R.R. Quick reference guide for β titanium alloys in the 00s. J. Mater. Eng. Perform. 2005, 14, 799–811. [Google Scholar] [CrossRef]
  22. Wang, T.; Guo, H.Z.; Wang, Y.W.; Peng, X.N.; Zhao, Y.; Yao, Z.K. The effect of microstructure on tensile properties, deformation mechanisms and fracture models of TG6 high temperature titanium alloy. Mater. Sci. Eng. A 2011, 528, 2370–2379. [Google Scholar] [CrossRef]
  23. Sauer, C.; Luetjering, G. Thermo-mechanical processing of high strength β-titanium alloys and effects on microstructure and properties. J. Mater. Proc. Technol. 2001, 117, 311–317. [Google Scholar] [CrossRef]
  24. Won, J.W.; Choi, S.W.; Yeom, J.T.; Hyun, Y.T.; Lee, C.S.; Park, S.H. Anisotropic twinning and slip behaviors and their relative activities in rolled alpha-phase titanium. Mater. Sci. Eng. A 2017, 698, 54–62. [Google Scholar] [CrossRef]
  25. Semiatin, S.L.; Bieler, T.R. Effect of texture and slip mode on the anisotropy of plastic flow and flow softening during hot working of Ti-6Al-4V. Metall. Mater. Trans. A 2001, 32, 1787–1799. [Google Scholar] [CrossRef]
  26. Chen, W.; Chen, C.; Zi, X.H.; Cheng, X.F.; Zhang, X.Y.; Lin, Y.C. Controlling the microstructure and mechanical properties of a metastable β titanium alloy by selective laser melting. Mater. Sci. Eng. A 2018, 726, 240–250. [Google Scholar] [CrossRef]
Figure 1. Line cutting and dimension of flat dog-bone-shaped tensile samples. RD = rolling direction; TD = transverse direction; ND = normal direction.
Metals 08 00904 g001
Figure 2. Room temperature engineering stress-strain curves of different samples.
Metals 08 00904 g002
Figure 3. Microstructures in the RD-ND and TD-ND planes of HR and HR+ HT samples. (a,b): ND-RD plane; (c,d): ND-TD plane.
Metals 08 00904 g003
Figure 4. (0002)α and (110)β pole figures of HR and HR+HT samples. (ac): (0002)α; (df): (110)β.
Metals 08 00904 g004
Figure 5. Orientation distribution function (ODF) plots of HR and HR+HT samples. (a,b): φ2 = 0°; (c,d): φ2 = 30°; (e,f): φ2 = 45°.
Metals 08 00904 g005
Figure 6. Schmid factor distributions of {0001}<11-20> slip system in α phase. (a,b): ND-RD plane; (c,d): ND-TD plane; (e): comparison of (a) and (c); (f): comparison of (b) and (d).
Metals 08 00904 g006
Figure 7. Schmid factor distributions of {10-10}<1-210> slip system in α phase. (a,b): ND-RD plane; (c,d): ND-TD plane; (e): comparison of (a) and (c); (f): comparison of (b) and (d).
Metals 08 00904 g007
Figure 8. Schmid factor distributions of {110}<1-11> slip system in β phase. (a,b): ND-RD plane; (c,d): ND-TD plane; (e): comparison of (a) and (c); (f): comparison of (b) and (d).
Metals 08 00904 g008
Figure 9. Fracture surfaces of HR and HR+HT samples after tensile tests. (a,b): ND-TD surface; (c,d): ND-RD surface.
Metals 08 00904 g009
Figure 10. Microcracks in the cross-section of HR and HR+HT sample. (a,b): RD-ND plane; (c,d): TD-ND plane.
Metals 08 00904 g010
Table 1. Tensile properties of different samples.
Processing ConditionDirectionAverage UTS (MPa)Average Elongation (%)
750 °C rollingRD105611.8
750 °C rollingTD11026.7
750 °C rolling + 750 °C agingRD101713.1
750 °C rolling + 750 °C agingTD104210.3
Table 2. Main texture components for the α and β phases of HR and HR+HT samples.
SamplePhaseMain Texture Component
HRα{-12-10}<10-11>[f(g) = 8.55], {-12-15}<10-10>[f(g) = 2.82], {01-14}<2-1-10>[f(g) = 4.25]
HRβ{111}<1-10>[f(g) = 4.54], {111}<11-2>[f(g) = 3.78], {001}<1-10>[f(g) = 3.02]
HR+HTα{-12-10}<10-11>[f(g) = 5.23], {-12-13}<10-10>[f(g) = 5.23], {01-16}<2-1-10>[f(g) = 4.35]
HR+HTβ{111}<1-10>[f(g) = 3.23], {111}<11-2>[f(g) = 2.69], {001}<0-10>[f(g) = 3.23]

