Article

Volatilization Behavior of β-Type Ti-Mo Alloy Manufactured by Electron Beam Melting

1
School of Materials Science and Engineering, Dalian University of Technology, Dalian 116024, China
2
Key Laboratory for Solar Energy Photovoltaic System of Liaoning Province, Dalian 116024, China
*
Author to whom correspondence should be addressed.
Metals 2018, 8(4), 206; https://doi.org/10.3390/met8040206
Submission received: 18 January 2018 / Revised: 14 March 2018 / Accepted: 19 March 2018 / Published: 23 March 2018

Abstract

:
The effects of electron beam melting parameters on the volatilization behavior of elements and the microstructures of ingots were investigated on a β-type Ti-Mo binary alloy. The microstructures of the ingots consisted of large and columnar grains at their bottom and top sections, respectively, and they were similar at different melting powers, from 10.5 kW to 15.0 kW, and the melting time ranging from 10 min to 40 min, without apparent metallurgical defects. Mass losses of ingots exhibited an increasing tendency, with increases of both melting power and melting time. Combined with a theoretical calculation and X-ray fluorescence results, Ti was identified as the main volatilization element due to its much higher vapor pressure than that of the Mo element. The considerable compensation method of the volatile Ti element was established in terms of theoretical and experimental results, which could provide a guidance for fabricating composition-controllable Ti-Mo binary alloys via electron beam melting technology.

Graphical Abstract

1. Introduction

Titanium and its alloys are widely used in the fields of the aerospace, bio-medical and chemical industries due to their high specific strength and excellent corrosion resistance [1,2]. They are commonly prepared by traditional vacuum self-consuming arc remelting (VAR), which is able to fabricate large ingots due to its high melting speed [3]. However, high or low density inclusions and composition segregation are proven to form via this melting method, especially in β-type titanium alloys, with abundant heavy elements, such as Mo, Nb, Ta and Zr. For example, these inclusions are easily broken due to their brittleness, which results in the formation of stress concentration in the form of sites of crack initiation [4,5]. Several fracture and failure accidents of titanium components have occurred due to the existence of metallurgical defects [6]. The fabrication of titanium alloys with a high metallurgical quality is one key of guaranteeing their safety during the service process.
To further enhance the metallurgical quality of titanium alloys, melting methods, such as electron beam melting (EBM) [7] and plasma melting [8], have been developed. Among them, the EBM method exhibits an extensive application prospect for reducing impurities and eliminating segregation due to the adoption of a high energy electron beam and high vacuum. Here, we note that the EBM method mentioned in this investigation involves a melting furnace that fabricates ingots by using an electron beam, which differs from the common adoption for additive manufacture technology [9,10,11]. During the melting process, an electron beam with a high energy density is used to bombard the surface of the material by adjusting the melting parameters. The kinetic energy amounts of electrons are transformed into thermal energy in order to melt the material. Due to a high vacuum, non-metallic inclusions, as well as volatile impurities, can be reduced effectively. Furthermore, the electron beam can be controlled accurately in order to acquire the ingots with an excellent surface quality and solidification structure [12,13]. Recently, this melting technology has been utilized to purify solar-grade silicon [14,15], as well as to refine refractory metals [16], superalloys [17,18], and titanium alloys [19,20].
Alloying elements with a high saturated vapor pressure are volatilize during the EBM process with the removal of impurities, which results in the deviation of the target composition [21]. Volatilization models in the Ti-6Al-4V alloy have been established in order to produce this alloy in large volume, with a homogeneous distribution of composition and microstructure [22,23,24]. However, little research has been conducted on the fabrication of β-type titanium alloys by EBM technology. In the case of β-type titanium alloys, the tendencies toward composition segregation and high density inclusions are aggravated, which results from the addition of the aforementioned β stabilizers that exhibit a high density and melting point [25]. For numerous β-type titanium alloys, metastable β-type Ti-Mo based alloys are widely used in the aerospace and bio-medical fields [26,27,28]. Excellent mechanical properties can be obtained from them, not only by controlling the diverse deformation modes, such as the deformation-induced ω-phase and α′′-martensitic transformation, {332}<113> and {112}<111> mechanical twinning, or the dislocation slip [29,30,31,32], but also via precipitation strengthening by the ω and α second phases. Simultaneously, multi-function properties, such as shape memory effect, super-elasticity, low elastic modulus, damping and biomedical compatibility, are found in these alloys [33,34]. The enhancement of the metallurgical quality for β-type Ti-Mo based alloys can further promote their application fields.
The purpose of this study is to fabricate ingots of the β-type Ti-Mo binary alloy via EBM technology, and to examine the effects of the melting power and melting time on the volatilization behavior of the element and the microstructures of the ingots. Based on mass loss, composition analysis, and theoretical calculation, a considerable compensation method for volatile elements is discussed.

2. Theoretical Analysis of Element Volatilization

As an important thermodynamic factor, the saturated vapor pressure (Po) of each component affects the volatilization behavior [35]:
lg P o = A 1 T 1 + A 2 lg T + A 3 T + A 4
where Po is the saturated vapor pressure, given in mmHg; T is the absolute temperature; and A1, A2, A3 and A4 are constants associated with the evaporate component, which can be referred to in handbook [35]. Figure 1 shows the saturated vapor pressures of common elements in titanium alloys as a function of the temperature. Pure Ti and Mo elements are represented by red and blue lines, respectively. However, the certain deviation between the ideal and actual alloy solutions should be considered, due to the interaction of the alloying elements. The actual vapor pressure of each element (Pi) in the alloy is modified with the activity, as illustrated in Equations (2) and (3):
P i = α i P i o
α i = γ i x i
where αi, γi and xi are the activity, activity coefficient, and mole fraction of the component i in the alloy, respectively. The activity coefficient of each component in the binary alloy can be calculated according to the Miedema model [35,36]:
ln γ i = α i j f i j { A / B + x j [ ( E D + F C ) B ] G A ] / B 2 }
where A, B, C, D, E, F, G, and fij are constants, which are only related to categories of component and their contents. αij is a variate, as the function of the temperature and melting points of the components i and j, as shown in Equation (5):
α i j = 1 0.1 T ( T m i + T m j T m i T m j )
As the activity coefficient of the component i is determined, the activity coefficient of the other component j in the binary alloy can also be calculated via the following equation:
ln γ j = 1 x j ( Δ H i j α i j x i ln γ i )
where ΔHij is the enthalpy change, which can be calculated via Equation (7) [37]:
Δ H i j = f i j x i [ 1 + μ i x j ( ϕ i ϕ j ) ] + x j [ 1 + μ j x i ( ϕ j ϕ i ) ] x i V i 2 / 3 [ 1 + μ i x j ( ϕ i ϕ j ) ] + x j V j 2 / 3 [ 1 + μ j x i ( ϕ j ϕ i ) ]
where φ is the electronegativity, V is the mole volume, x is the mole fraction, and μ is the constant.
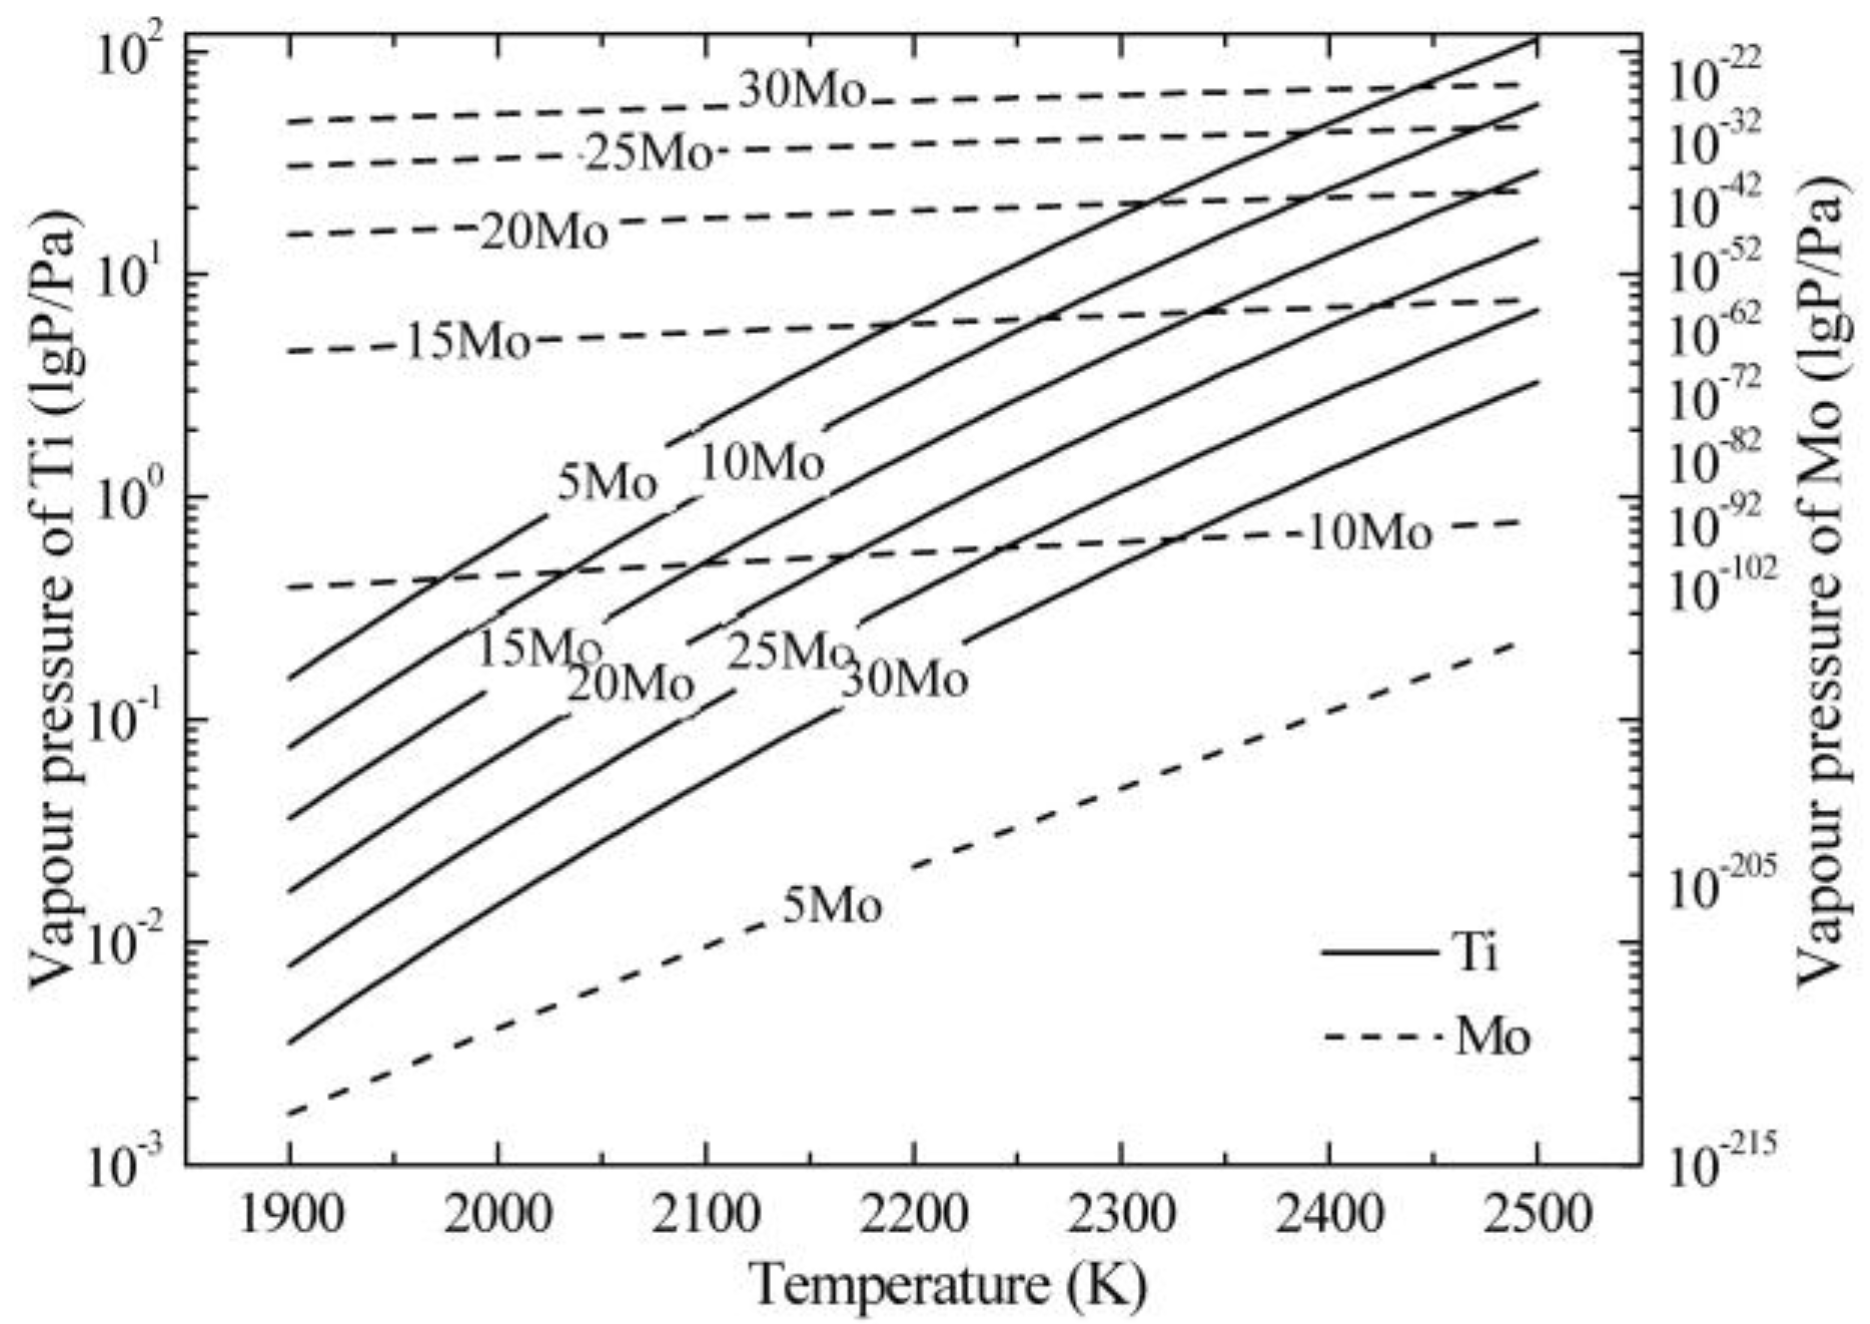
For example, the activities of Ti and Mo in the Ti-15Mo (mass%) alloy, as a function of the temperature, were calculated, and the results are presented in Figure 2. The activities of Ti and Mo increased with the temperature increase, while the activity of Ti was much higher than that of Mo in the Ti-15Mo alloy. According to Equations (2) and (3), the vapor pressures of Ti and Mo in the Ti-Mo binary alloys with a Mo content from 5% to 30%, as a function of the temperature, were obtained, as shown in Figure 3. They exhibited an increasing tendency with the temperature increase, which was similar to that of the pure element. Furthermore, the vapor pressure of Ti increased, while it decreased for Mo as the Mo content increased in these alloys. As the vapor pressure of Ti was much higher than that of Mo, it could be deduced that Ti was the main volatilization element in the Ti-Mo binary alloy during the EBM process.
N m , T ( T i ) = 4.37 × 10 4 M i / T x i γ i P i o
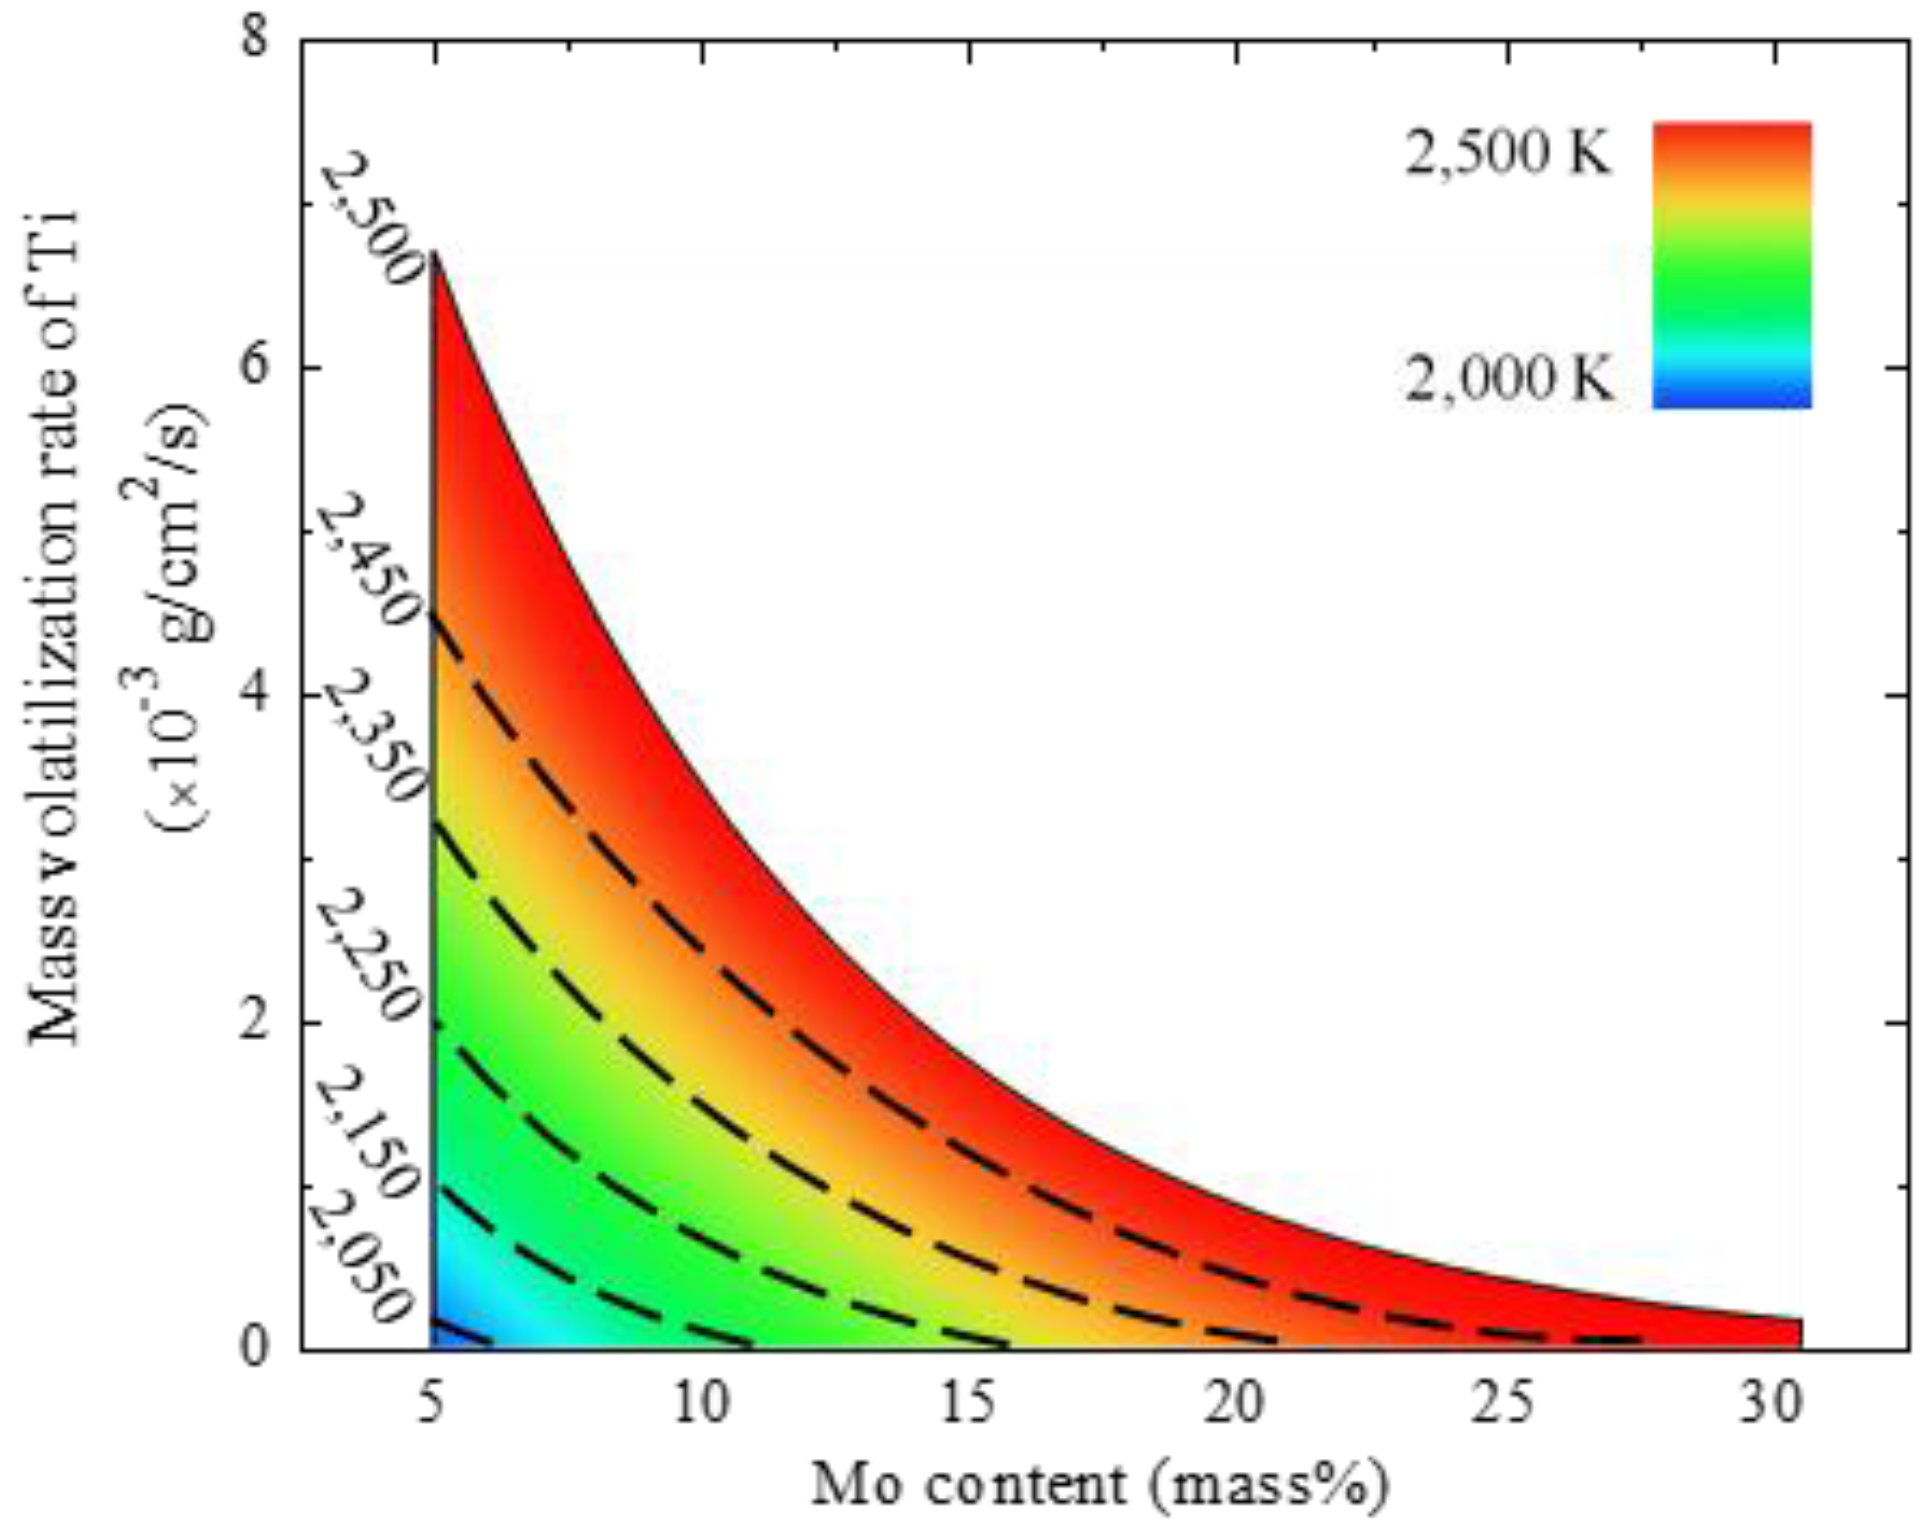
Based on the Hertz-Knudsen-Langmuir equation (Equation (8)), the mass volatilization rates of Ti (Nm,T(Ti)) in the Ti-Mo binary alloys, with different Mo contents from 5% to 30%, could be calculated in the range of 2000–2500 K, as shown in Figure 4. Mi in Equation (8) is the mole mass of component i in the alloy. The mass volatilization rate of Ti was the highest in the Ti-5Mo alloy, and it decreased with the increase of Mo content. For all of the alloys, the mass volatilization rate increased as the melting temperature increased.

3. Experimental Section

3.1. Electron Beam Melting Process

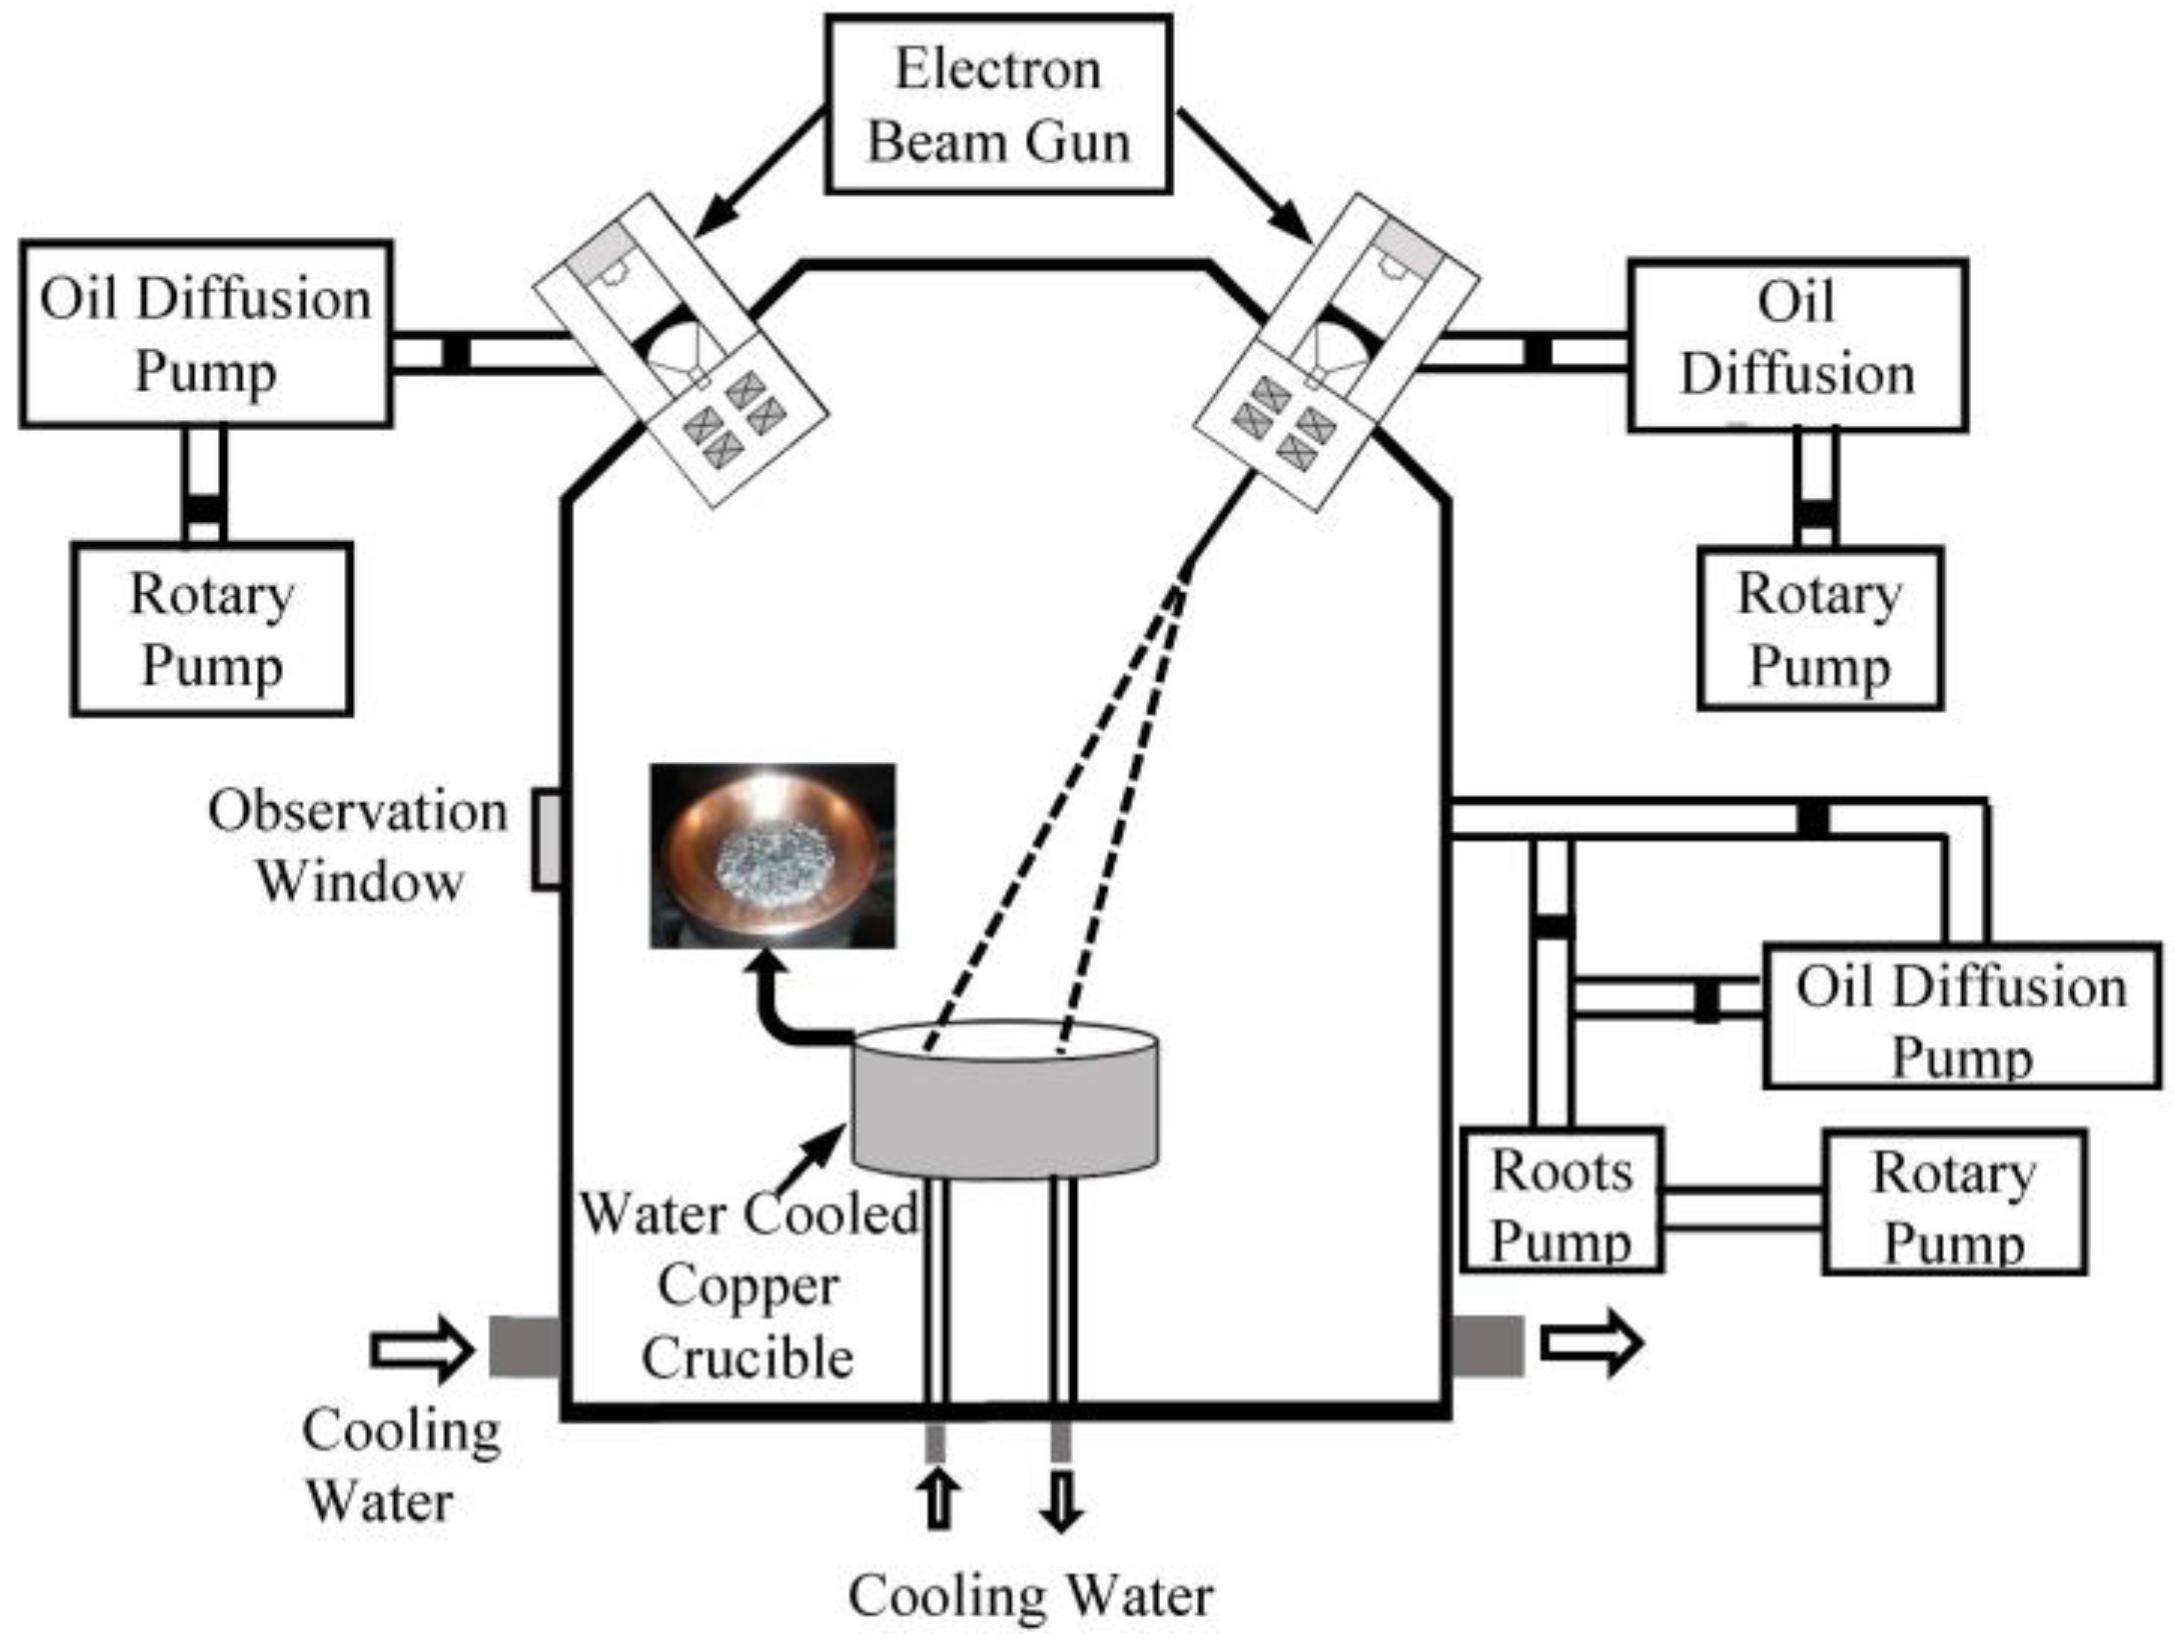
A SEBM-30 mA type electron beam melting furnace (Guilin Strong Numerical Control Vacuum Equipment Co., Ltd., Guilin, China) was used, and its schematic diagram is shown in Figure 5. The experimental apparatus consisted of a melting chamber, two electron beam guns with an accelerating voltage of 30 kV, a water-cooled copper crucible, a circulation water cooling system, and two independent vacuum systems. In order to decrease the melting point, an as-received Ti-32Mo intermediate alloy in the shape of flake was adopted in this investigation. Additional titanium was supplied by pure titanium partials with a purity of 99.7%. Given the crucible size (the diameter was 23 mm), 301.7 g of raw materials containing 168.4 g of pure titanium and 133.3 g of Ti-32Mo intermediate alloy (including the impurities contained in them) were adopted according to the composition of the Ti-15Mo alloy. The diameter of the original materials was calculated to be around 10.7 mm, which was regarded as the diameter of the molten pool during the melting process. A series of experiments were carried out with different melting powers and melting time. The ingots were melted at different melting powers (10.5 kW, 12.0 kW, 13.5 kW and 15.0 kW) for 20 min and at a melting power of 12.0 kW for different lengths of time (10 min, 20 min, 30 min and 40 min) to examine the effects of the melting parameters on the volatilization behavior of the element and microstructures of ingots.
Before the melting experiment, the raw materials were ultrasonically washed in alcohol. The pure titanium partials were placed at the bottom section of the water-cooled crucible, while the Ti-32Mo intermediate alloy was placed above them due to its higher melting point. Subsequently, the electron gun and melting chamber were evacuated to pressures under 5 × 10⁻³ Pa and 5 × 10⁻² Pa, respectively. The electron beam was irradiated on the surface of the raw materials with an area of around 89 cm2. The size of the beam spot was controlled via a scanning current. The smaller and bigger beam spots were used during the heating and melting processes, which corresponded to a scanning current of 5 × 5 mA and 10 × 10 mA, respectively. The melting time of zero was defined when the raw materials were completely melted [14,15]. The scanning pattern of the electron beam was circular, in order to ensure that the ingot was heated homogeneously and steadily. After the melting process, the electron beam was immediately turned off to acquire a very large cooling speed. Under each melting condition, the ingot was flipped and re-melted two times, in order to obtain a homogeneous composition distribution.

3.2. Microstructural Characterization

The mass of the raw materials and Ti-Mo ingots after the first and second melting was weighted by electronic balance (ACS-DII, Want Balance Instrument Co., Ltd., Changzhou, China) with a precision of 0.1 g. Based on the raw materials’ and ingots’ masses after the melting process, mass loss rates were calculated for the different melting parameters. Samples were cut from the ingots along a vertical section via wire electrical discharge machining. Their chemical compositions were analyzed via an X-ray fluorescence spectrum (XRF-1800, Shimadzu, Kyoto, Japan) with a diaphragm of 10 mm in diameter. The volatilization rates of Ti and Mo under different melting parameters were obtained based on their original and analyzed masses in the raw materials and ingots, respectively. The microstructures of the vertical section at the ingots’ center position, which were subjected to a mechanical–chemical polishing and etched via a solution of distilled water, nitric acid and hydrofluoric acid (100:3:2 in volume), were observed through an optical microscope (Leica MEF4, Leica Camera AG, Solms, Germany). The phase identification was conducted via X-ray diffraction (XRD, Panalytical B.V., Heracles Almelo, Holland) with an EMPYREN diffractometer, using Cu-Kα radiation, operated at 40 kV and 30 mA, with a step size of 0.02° and a scanning speed of 2°/min.

4. Results

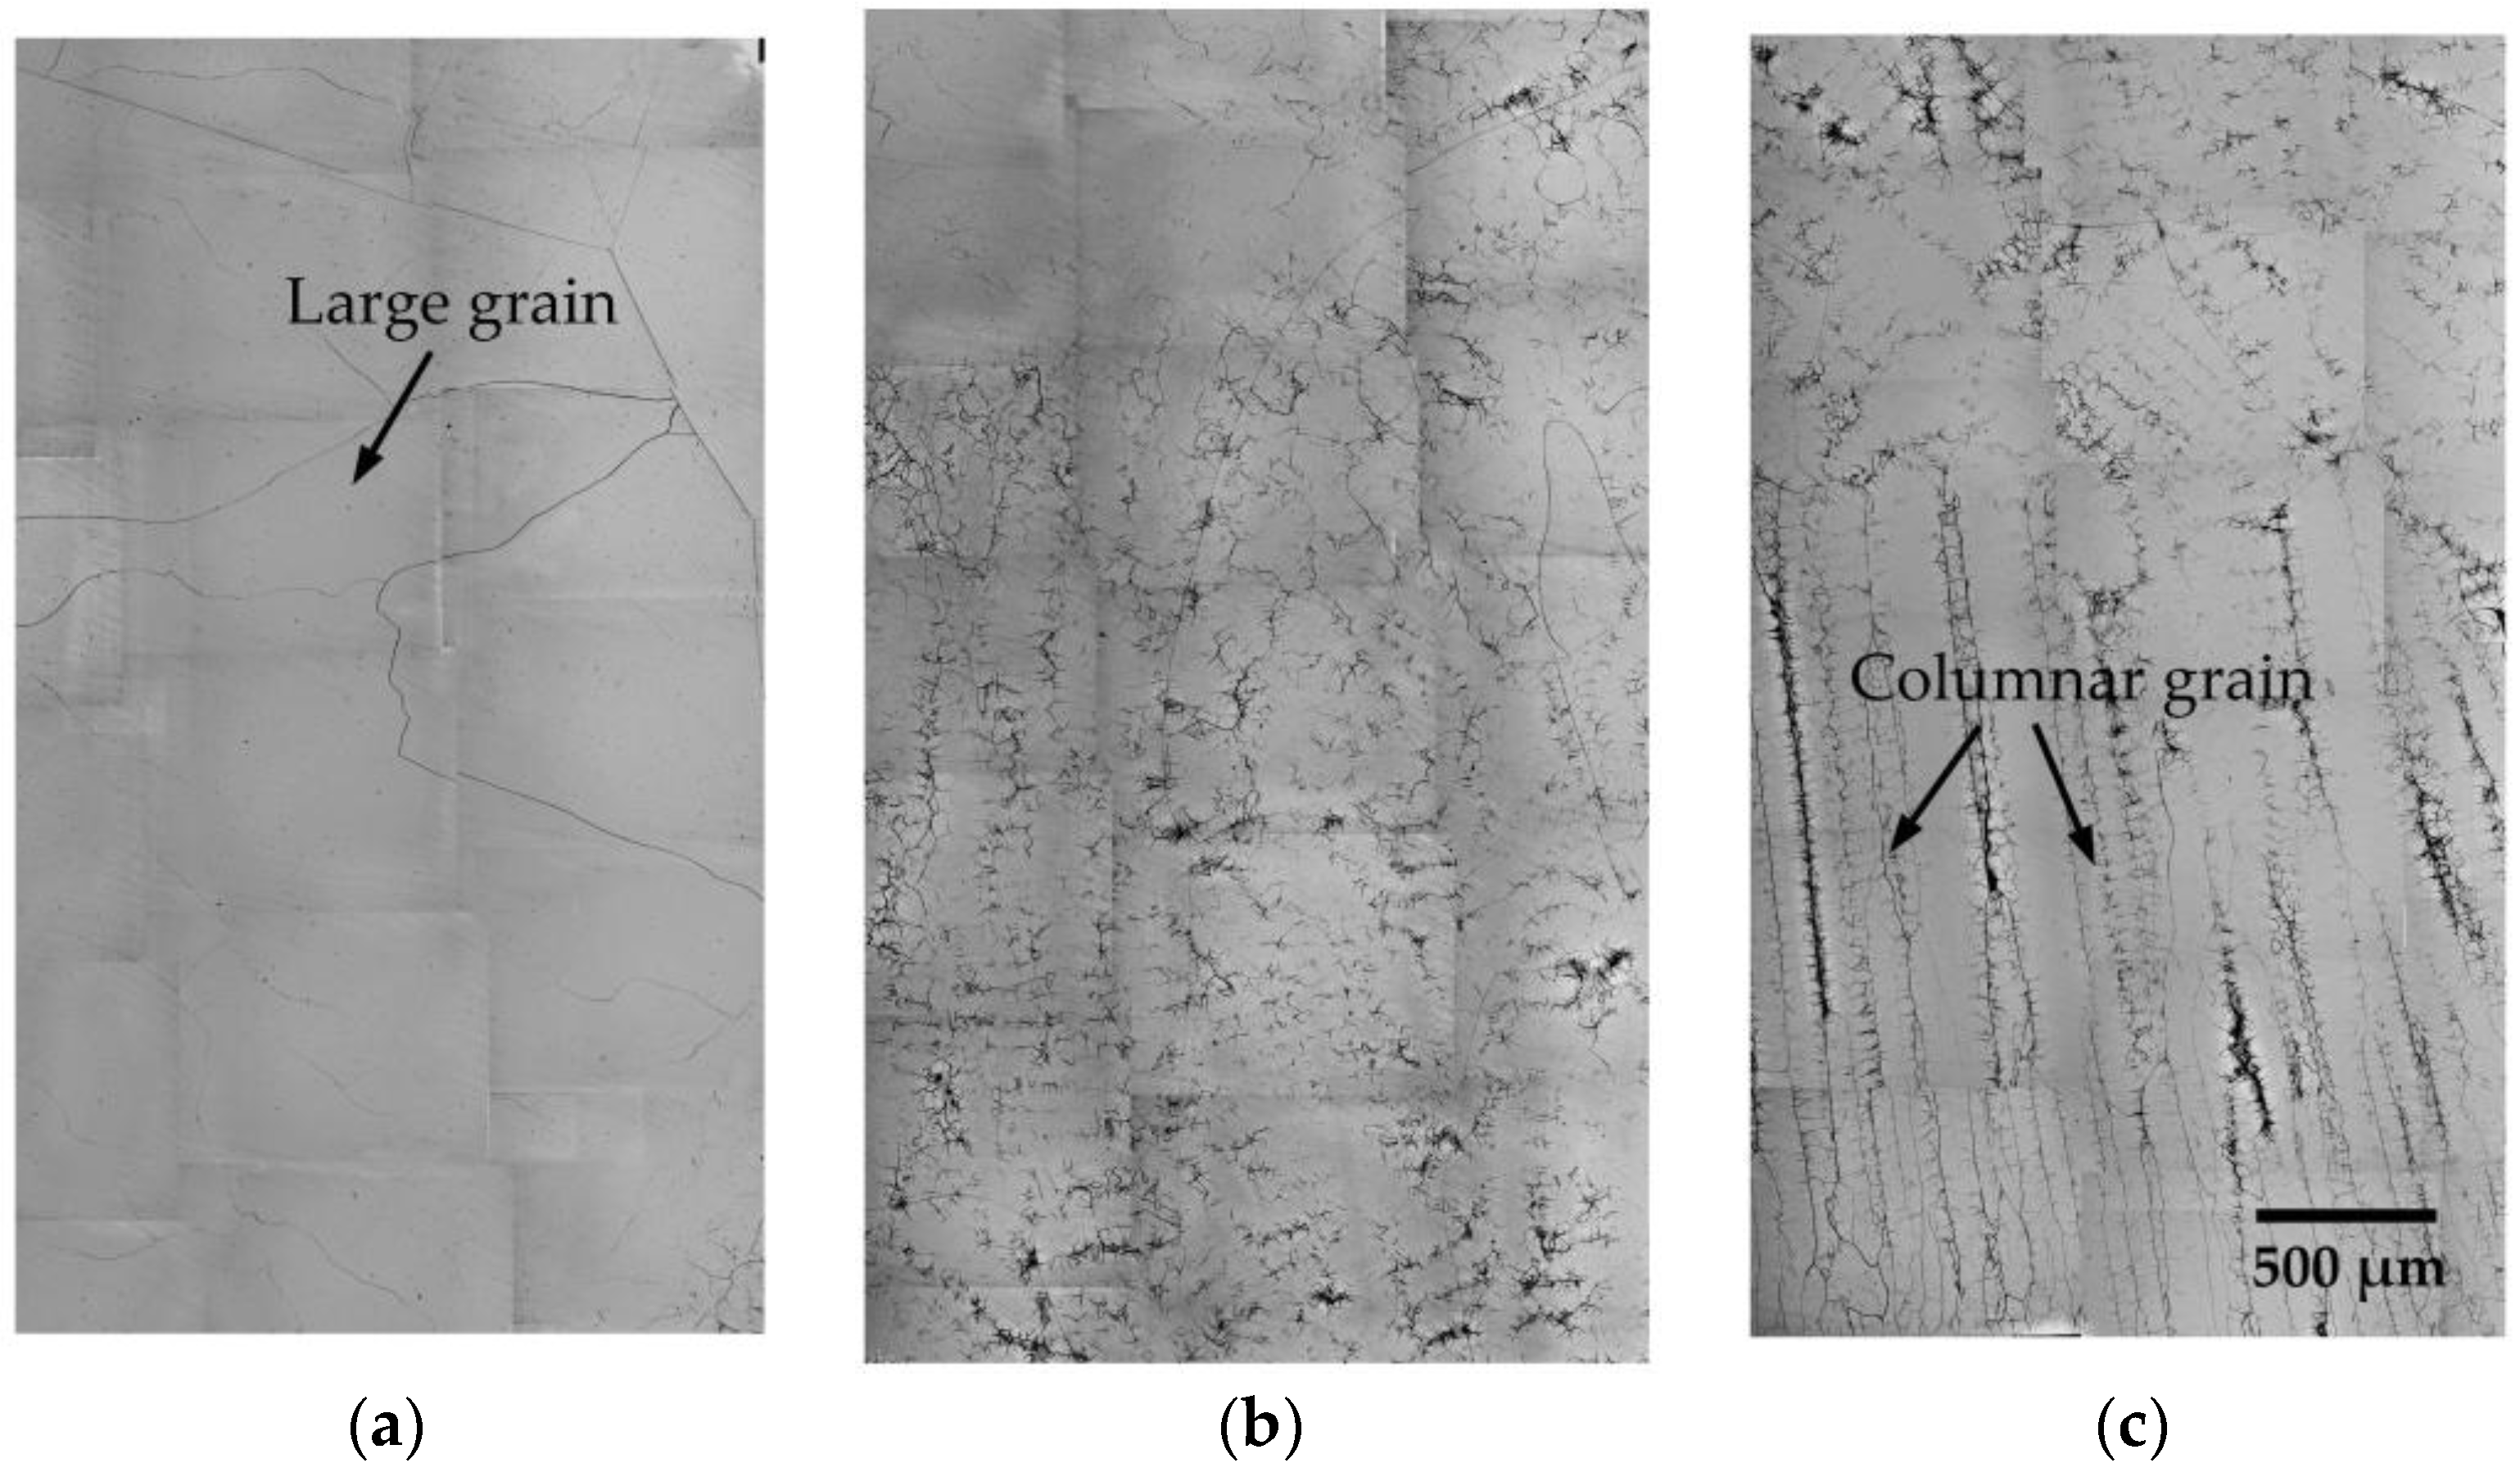
Figure 6 shows, from the bottom to top sections, the microstructures of the Ti-Mo ingot manufactured at a melting power of 10.5 kW for 20 min. The bottom section in contact with the crucible consisted, as shown in Figure 6a, of relatively large grains. With the increase of the ingot height, they gradually changed into columnar grains [38]. Furthermore, the interdendritic segregation was observed between the adjacent column grains, as shown in Figure 6c. The composition in the solid phase was not diffused homogeneously due to the high cooling speed during the solidification process [39]. In addition, some small pores, characterized by the black points, were observed in some grains (Figure 6a,b). The interdendritic segregation and small pores in the ingots affected their mechanical properties. They could be further reduced or eliminated by subsequent heat treatment and mechanical processing, such as forging and rolling.
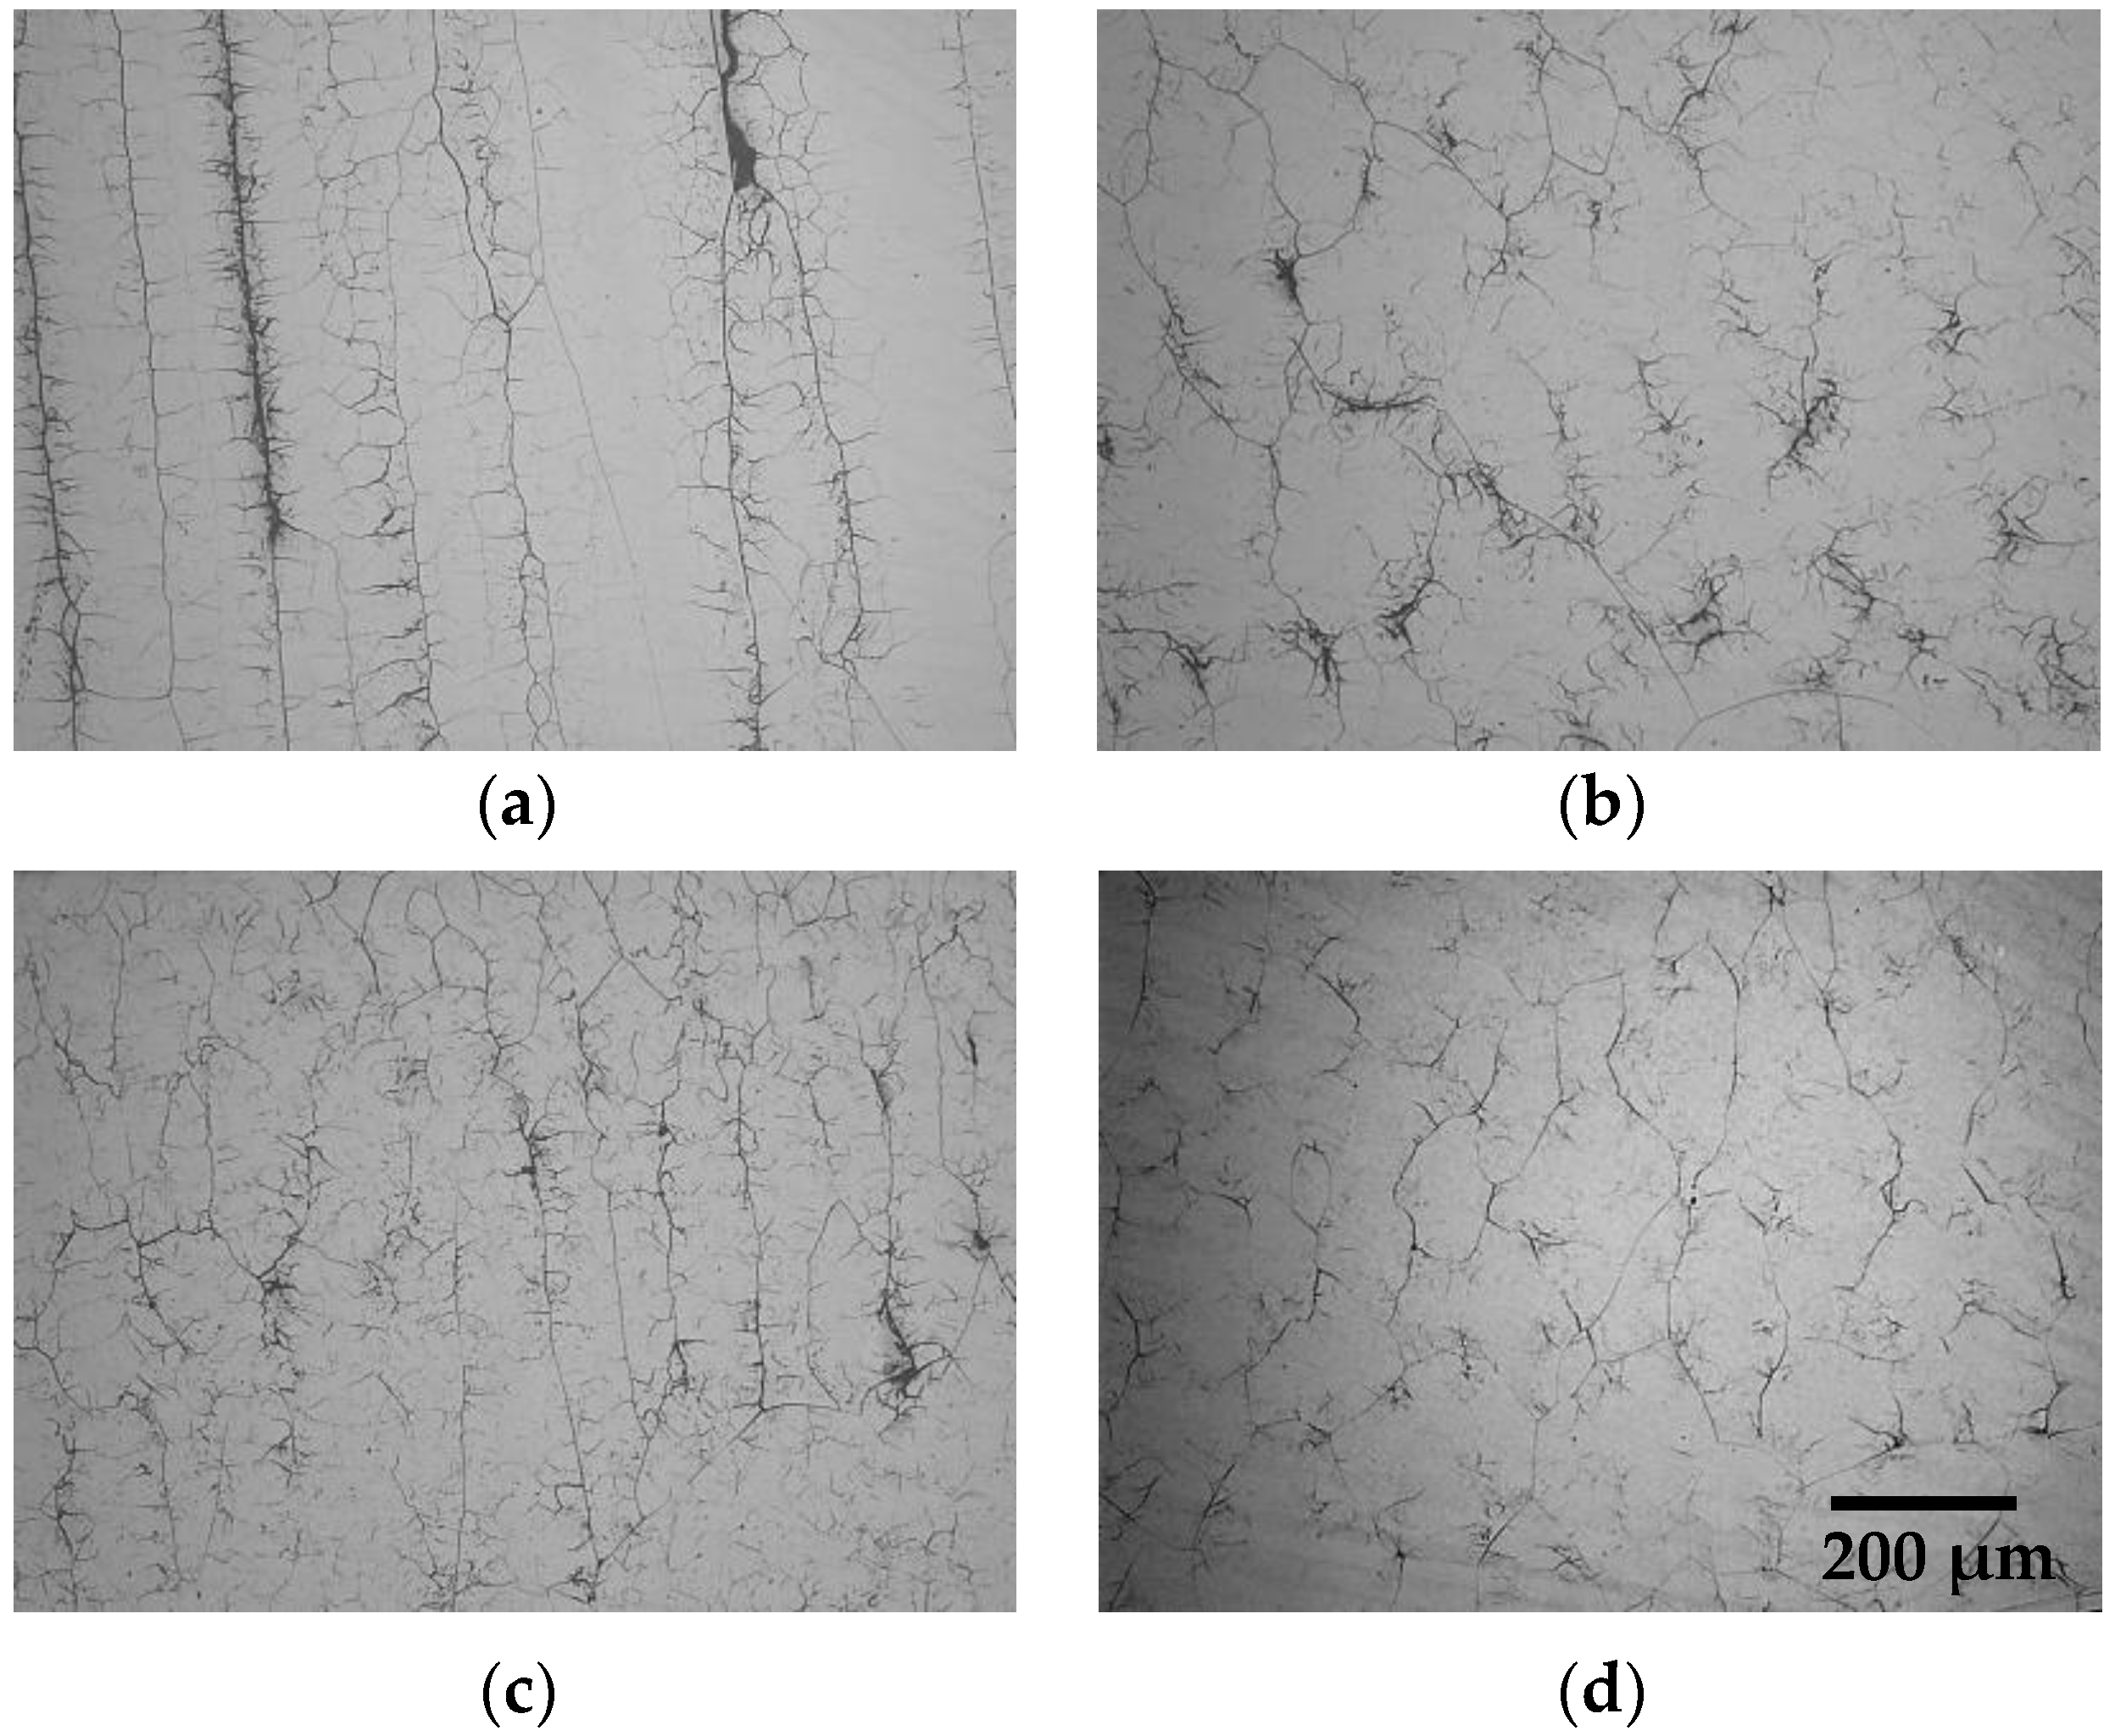
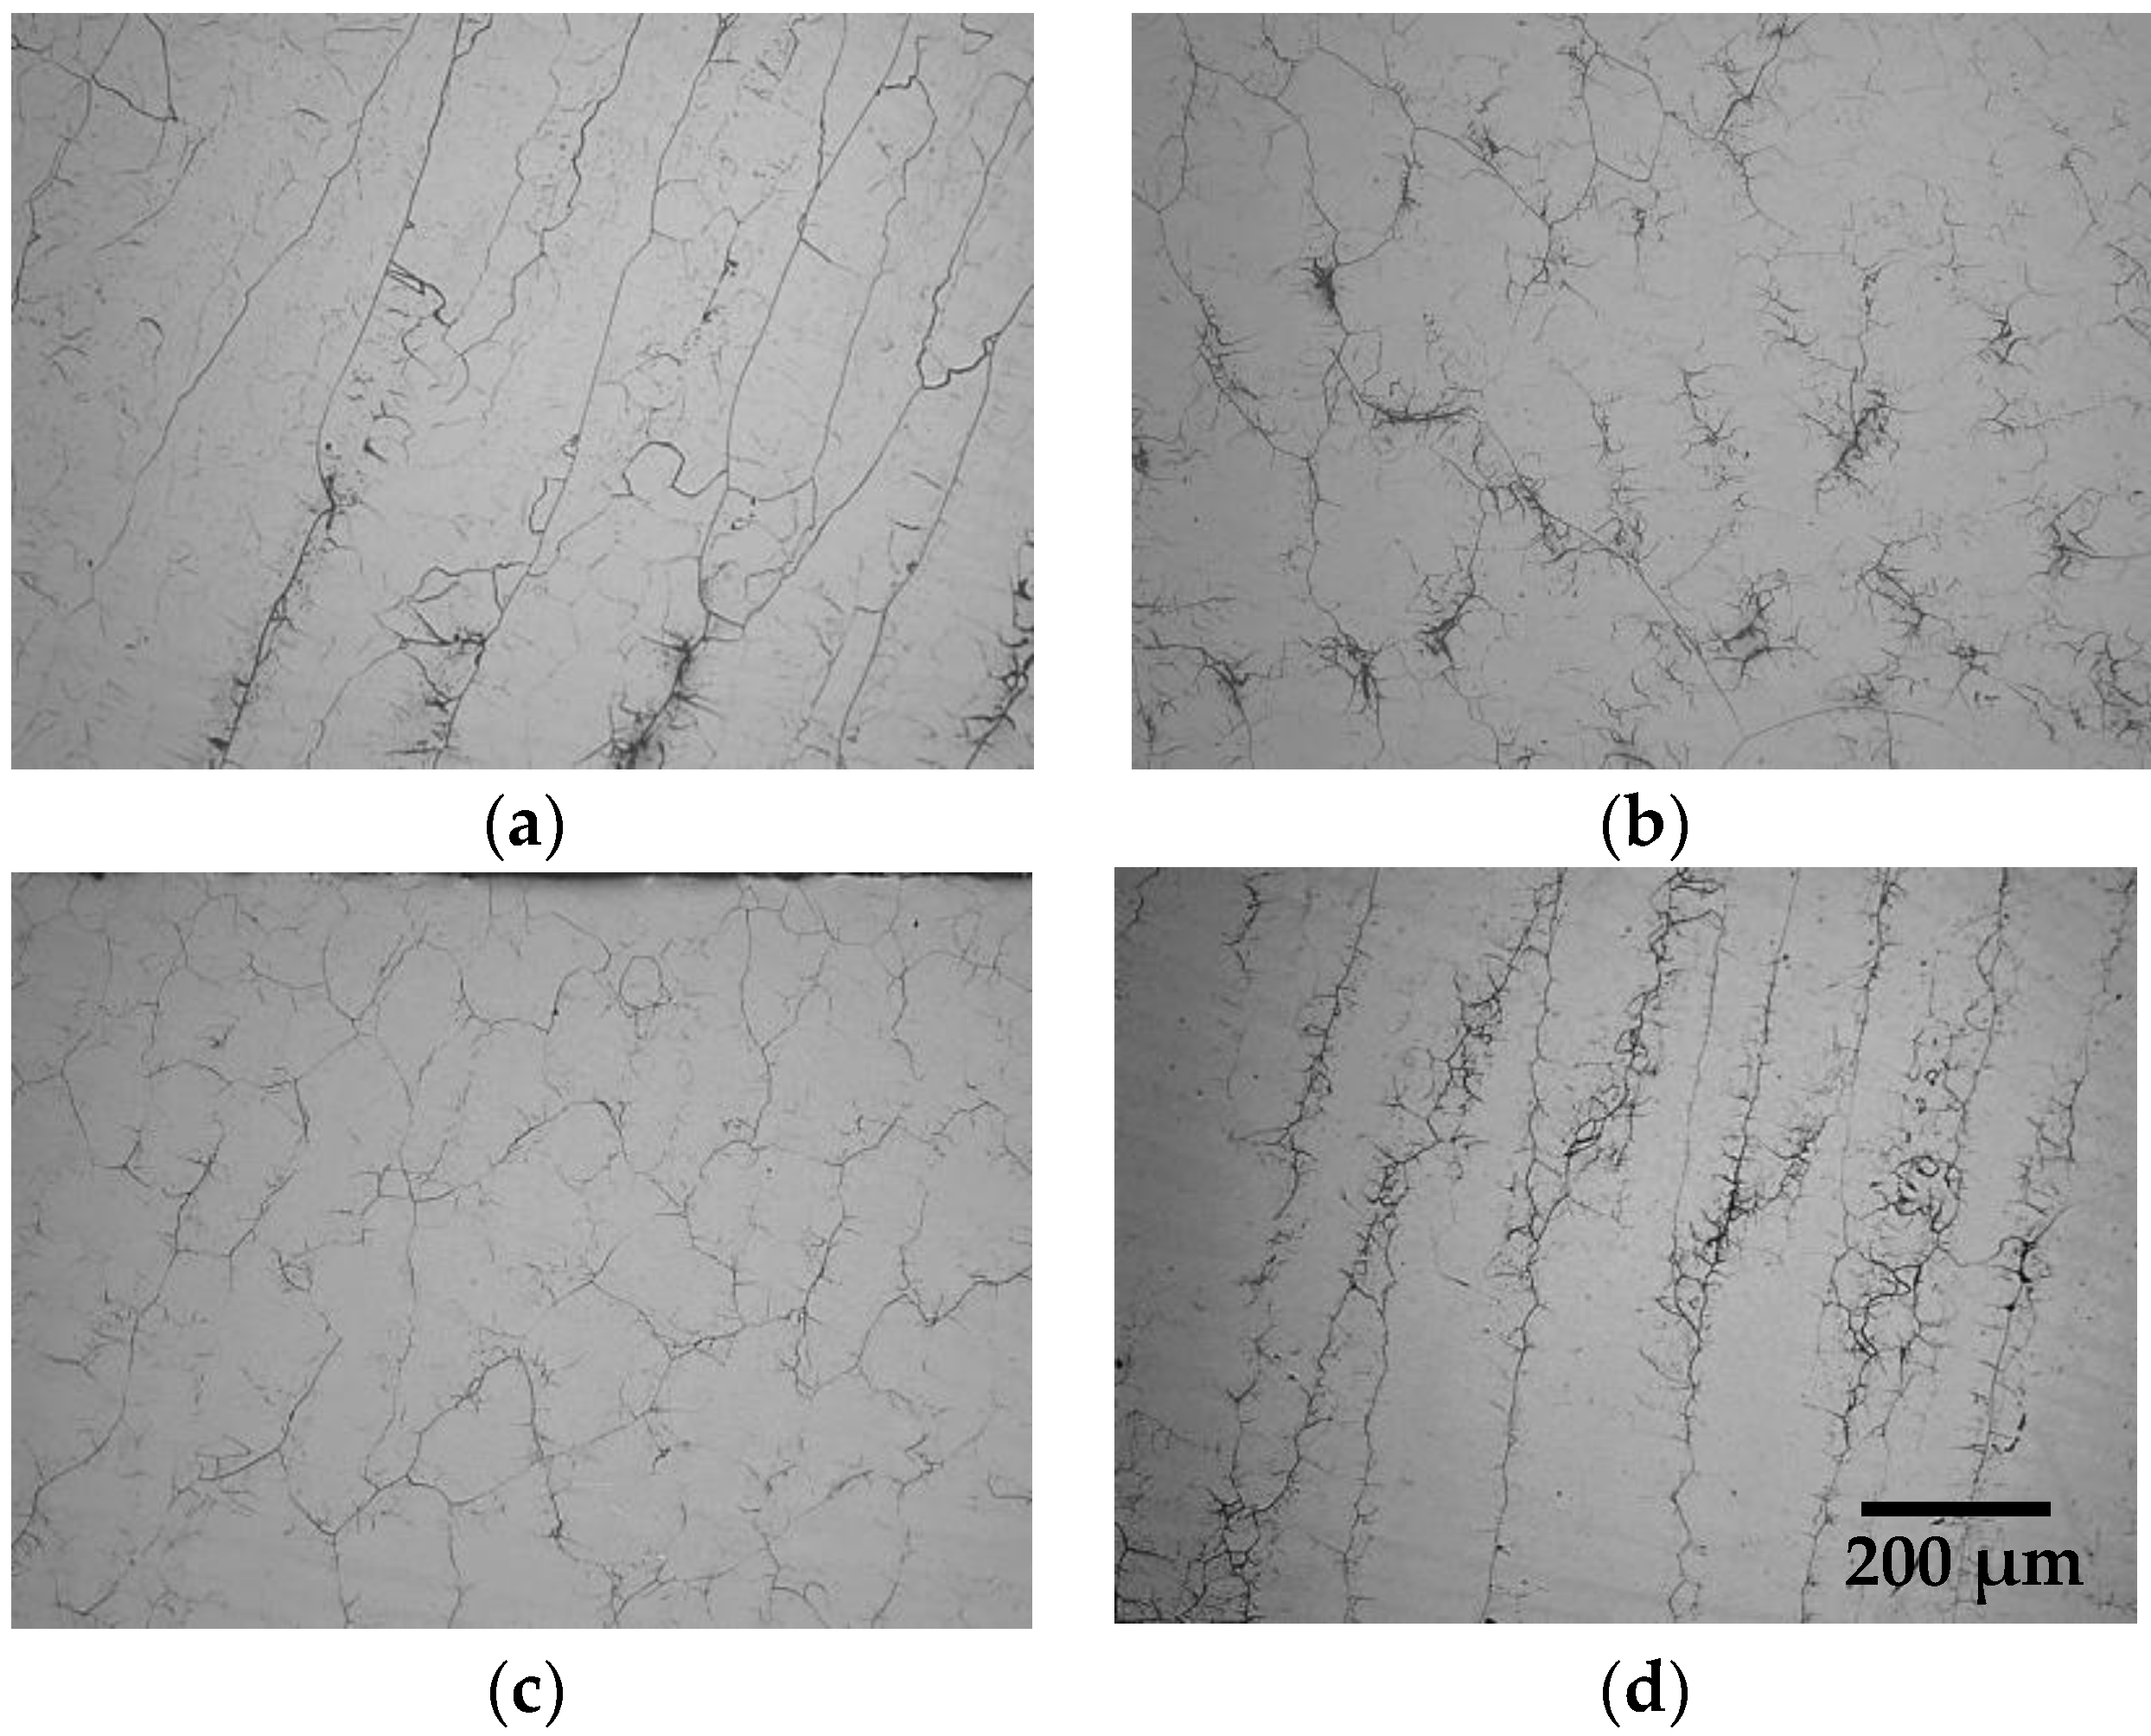
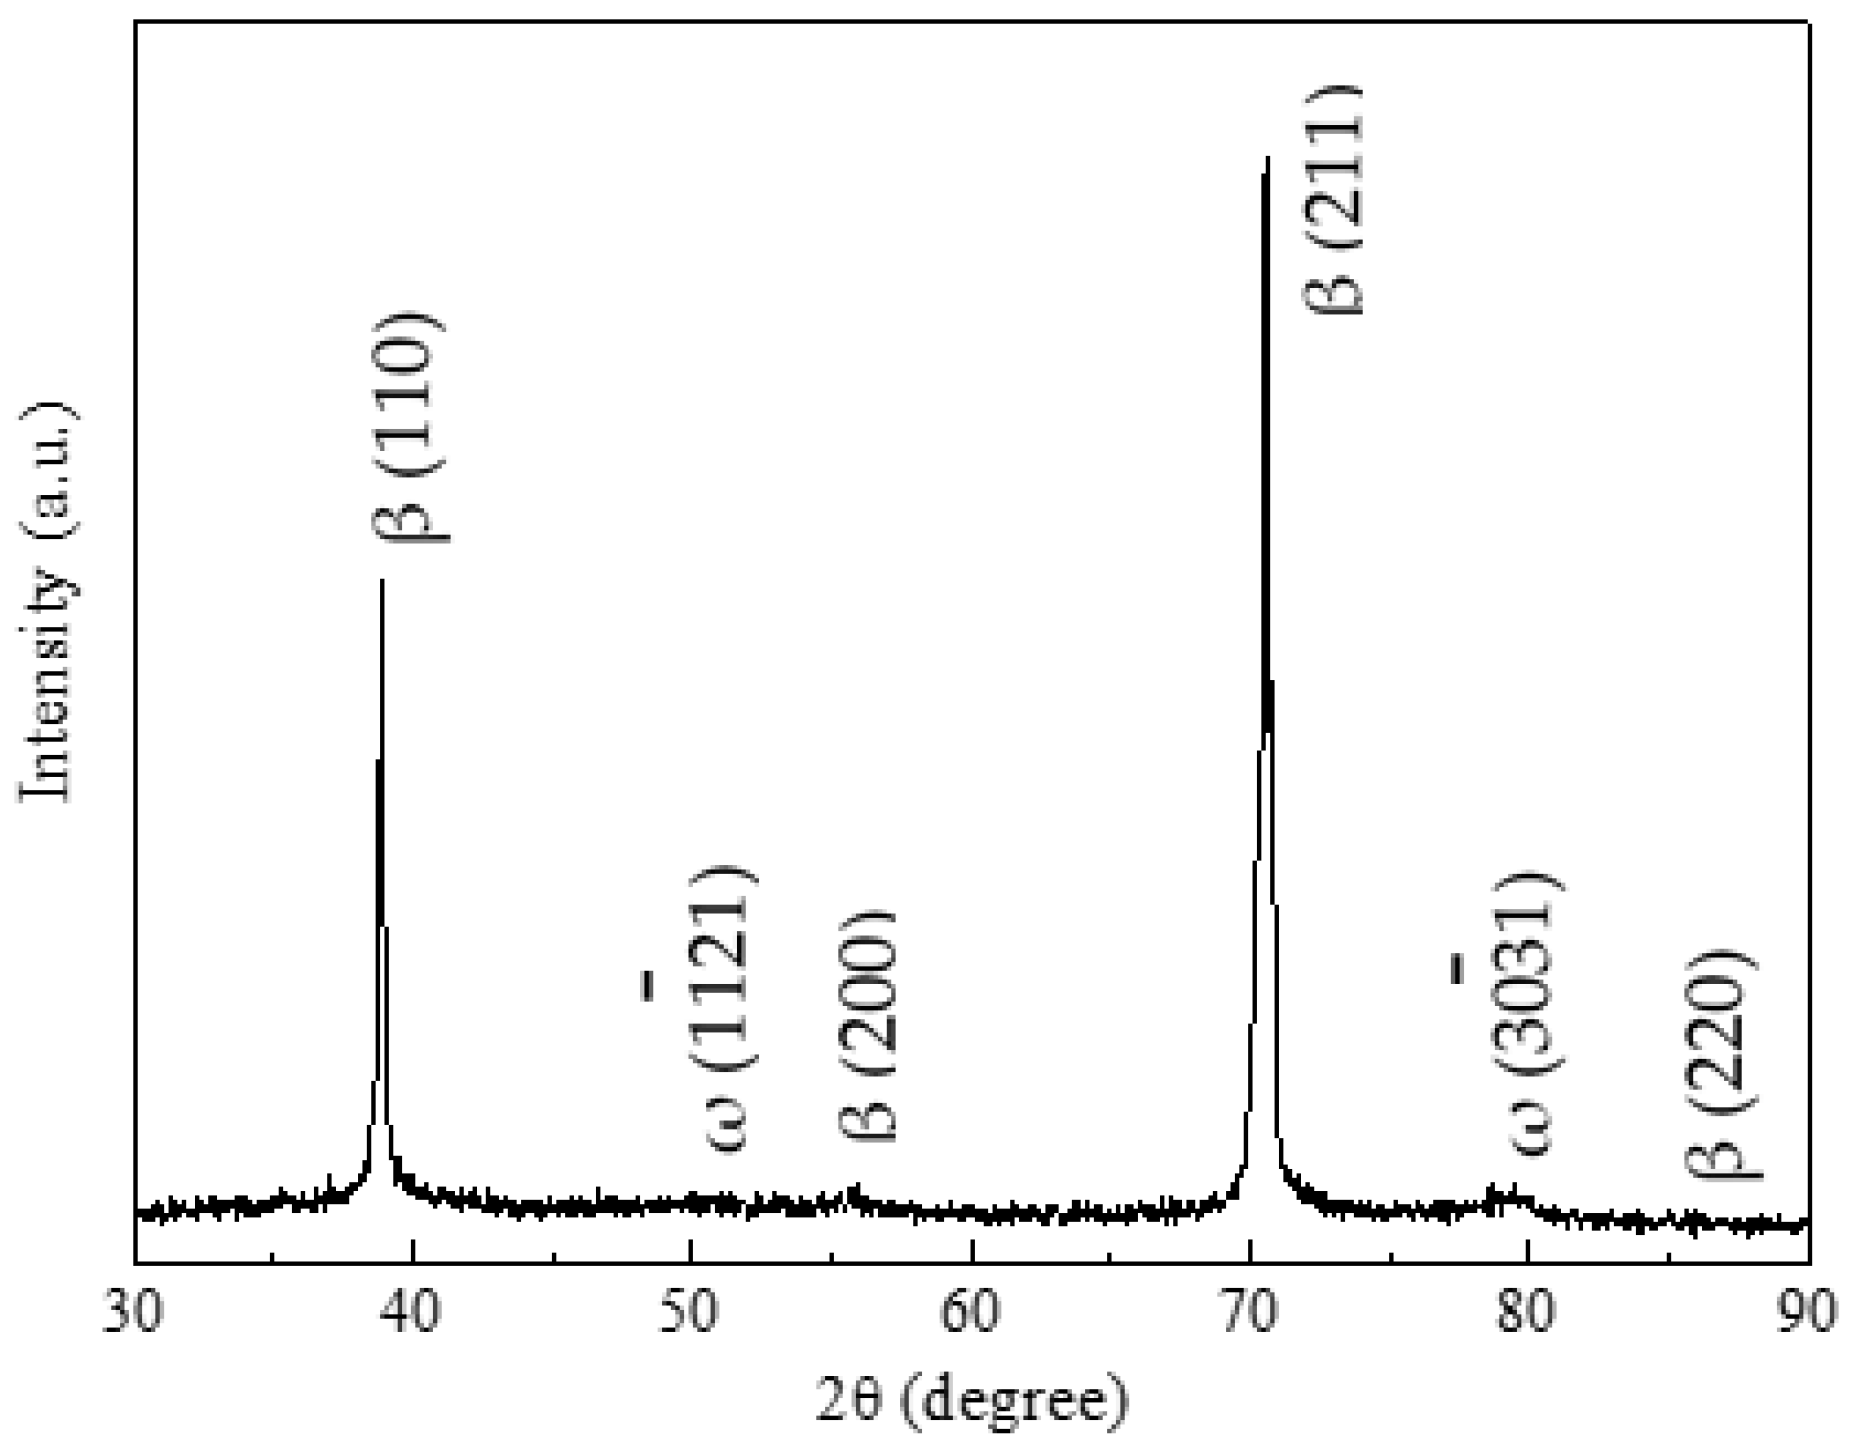
Figure 7 and Figure 8 show, respectively, the microstructures of the Ti-Mo ingots with different melting powers and melting time, located at the top sections. Similar microstructures were observed. Figure 9 shows the XRD profile of the ingot manufactured at a melting power of 12.0 kW for 20 min. The typical peaks of the β-phase were detected, in spite of some weak peaks for the ω-phase.
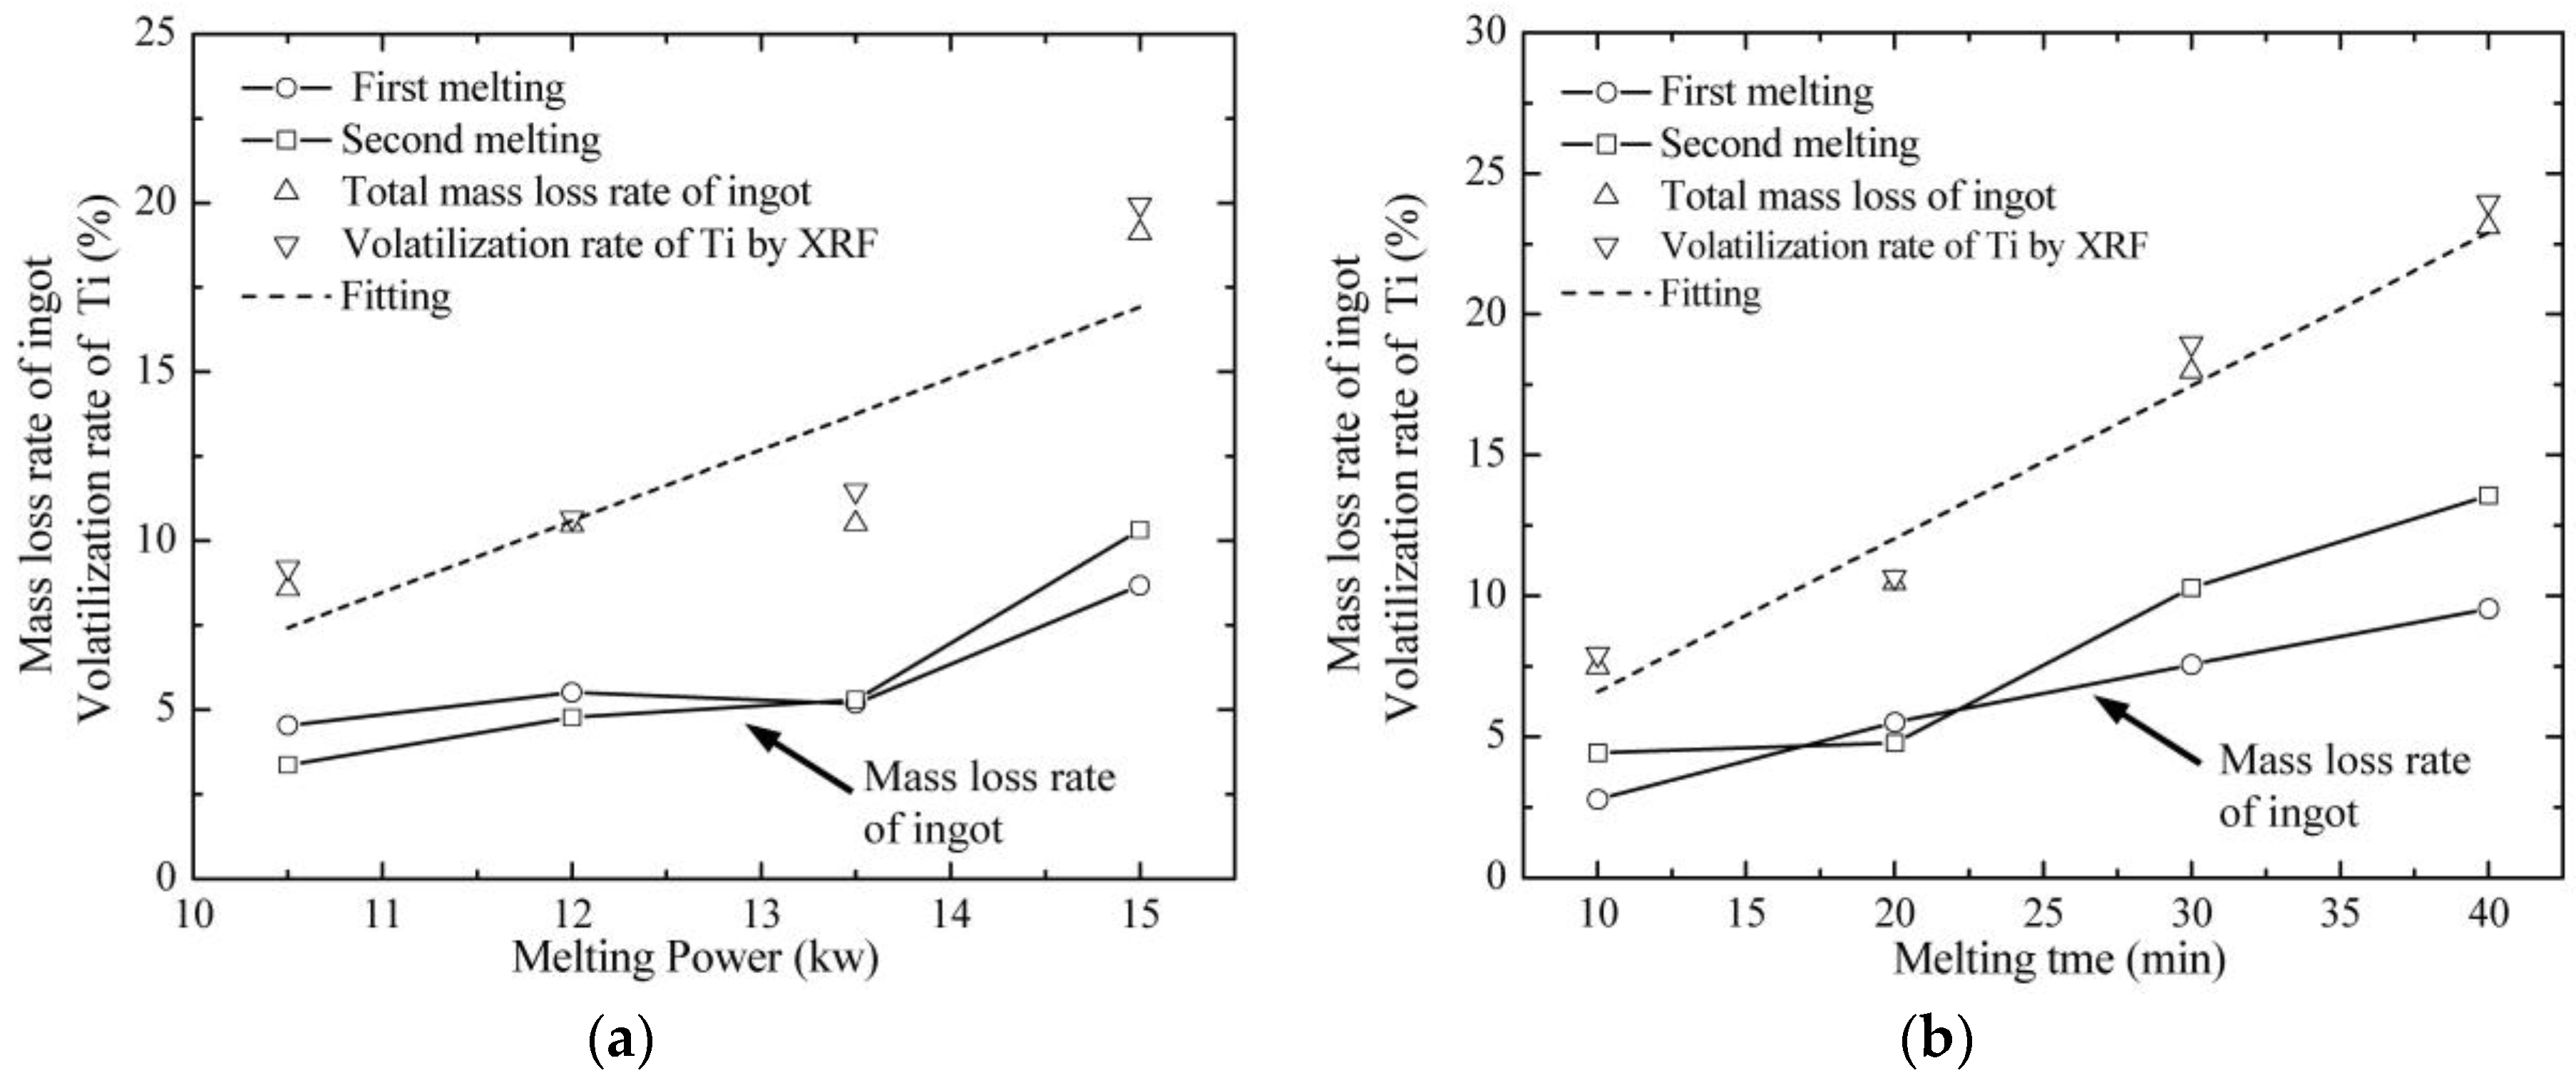
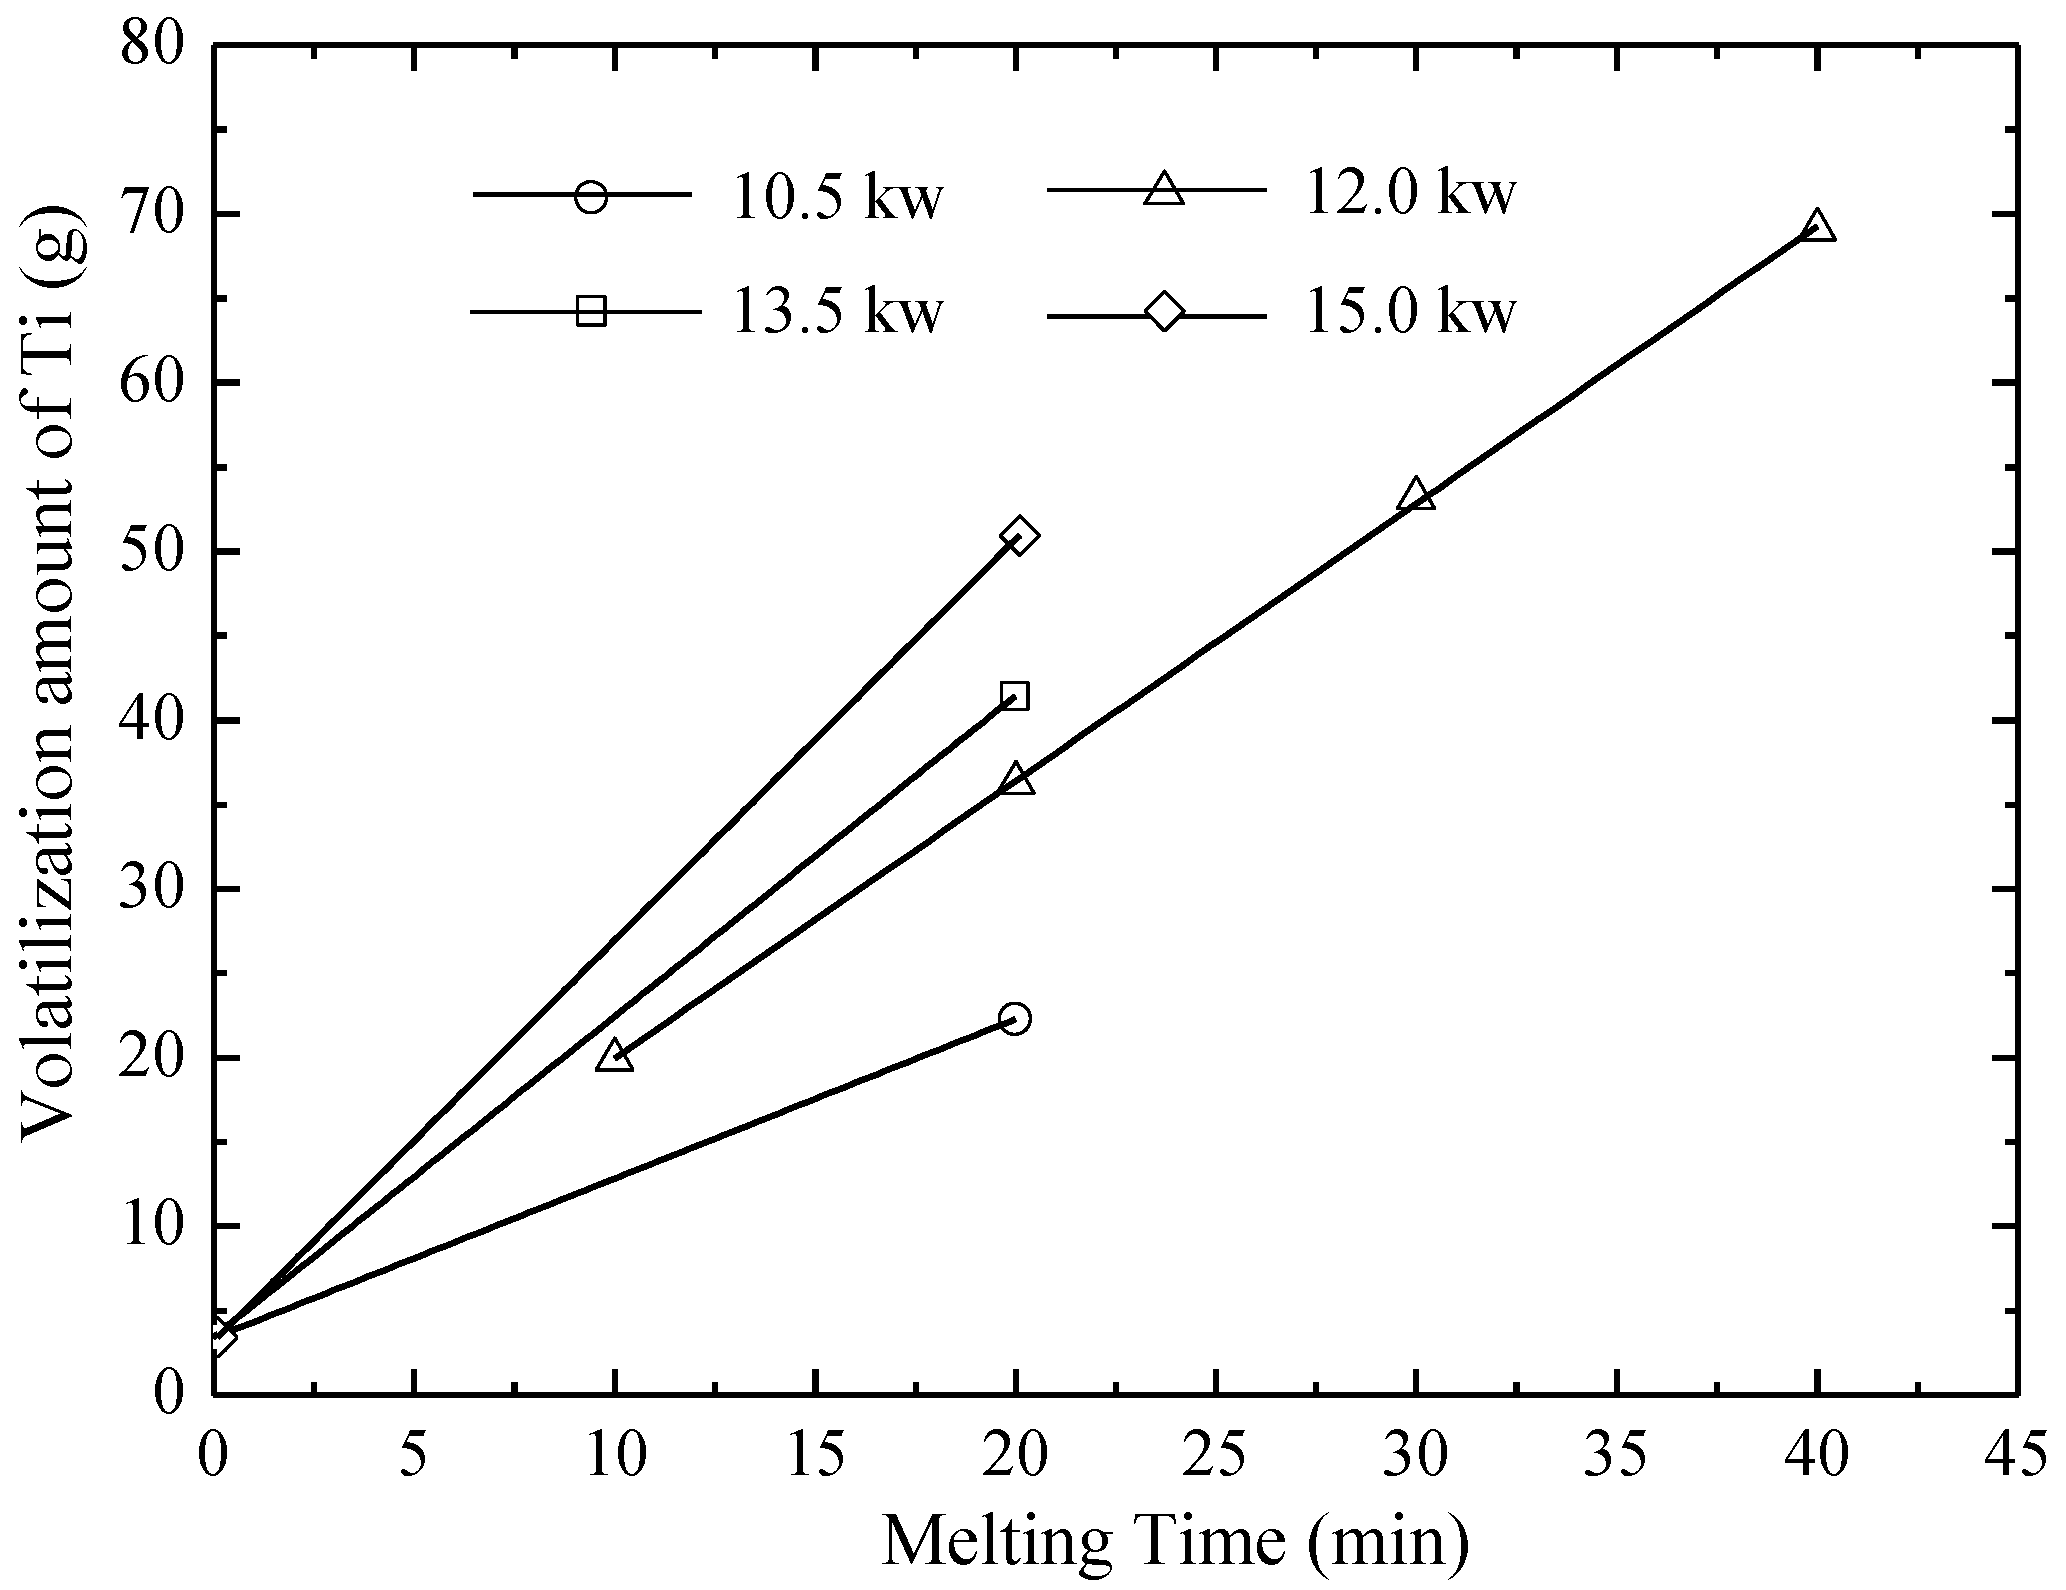
Figure 10a,b shows the volatilization rates of Ti based on the XRF results and measured mass loss rates of the ingots as functions of the melting power and melting time. Simultaneously, the corresponding values were summarized in Table 1 and Table 2. As shown in Table 1, at melting powers of 10.5 kW, 12.0 kW, 13.5 kW, and 15.0 kW, the mass loss rates of the ingots were, respectively, 4.5%, 5.5%, 5.2% and 8.7% for the first melting, and 3.5%, 4.8%, 5.3% and 10.3% for the second melting. The total mass loss rates of the ingots were 8.0%, 10.3%, 10.5%, and 19.0%, while the volatilization rates of Ti related to the raw materials were 9.2%, 10.7%, 11.5%, and 19.9% at melting powers of 10.5 kW, 12.0 kW, 13.5 kW, and 15.0 kW, respectively. The mass loss rates of the ingots at the melting power of 12.0 kW for different time were, respectively, 2.8%, 5.5%, 7.6% and 9.5% for the first melting and 4.4%, 4.8%, 10.3% and 13.5% for the second melting, as shown in Table 2. The total mass loss rates of the ingots were 7.2%, 10.3%, 17.9%, 23.0%, and the volatilization rates of Ti were 7.9%, 10.7%, 19.0%, 24.9% at the melting power of 12.0 kW, for different time. Based on these results, the volatilization rates of Ti as functions of the melting power and melting time were fitted along the dotted lines, as shown in Figure 10a,b, respectively. The following discussion and establishment of a compensation method were based on the fitted values.

5. Discussion

This study investigated the effects of the melting power and melting time on the volatilization behavior of element and microstructures of the Ti-Mo alloy via EBM technology. The microstructures of ingots under different melting parameters were similar without apparent metallurgical defects. The Ti element with a higher vapor pressure volatilized simultaneously, resulting in the composition deviation. The mechanical properties of the Ti-Mo alloys are intensively associated with the deformation mode, which is a function of the Mo equivalent [40]. Thus, it is essential to establish a compensation method of Ti for fabricating the composition-controllable Ti-Mo binary alloy.
We noted that the saturated vapor pressure of pure Ti was much higher than that of pure Mo in the whole temperature range, as shown in Figure 1. In different Ti-Mo binary alloys, Ti also possessed the higher vapor pressure in the range of 1900 K to 2500 K, as shown in Figure 3. Consequently, Ti was identified as theoretically being the main volatilization element during the EBM process. Furthermore, as shown in Figure 4, the mass volatilization rates of Ti presented an obvious distinction from different volatilization patterns. The largest mass volatilization rate of Ti was obtained when it volatilized in the pattern of the Ti-5Mo alloy, and it gradually decreased with an increase of the Mo content. In addition, the mass volatilization rate of Ti increased with the increase of the temperature. Thus, the determination of the volatilization patterns for Ti and the temperatures on the molten pool surface at different melting powers was necessary to obtain the actual amount of volatilization. However, the volatilization pattern of Ti during the EBM process remained unclear due to the complicated addition mode of the raw materials and subsequent alloying process.
As shown in Figure 10, the mass loss rates of the ingots from the measure values via electron balance were similar to the volatilization rates of Ti from the XRF results at different melting powers and melting time. Thus, the mass losses of ingots during the EBM process were only attributed to the loss of Ti, without considering the loss of Mo, which was consistent with the results from the theoretical calculations. Furthermore, each ingot was melted two times under the same melting parameters, and the mass loss rates of the ingots (volatilization rates of Ti) were approximately equivalent, as shown in Figure 10. Thus, volatilization of Ti was regarded with the same volatilization pattern of the Ti-15Mo alloy due to its rapid alloying during the EBM process [41]. Thus, the volatilization behavior of Ti was considered to be a continuous process regardless of the melting time.
The temperatures during the melting process at different melting powers were not measured directly via the EBM furnace, however, the theoretical volatilization amount of Ti was intensively related to the temperature of the molten pool surface, as shown in Figure 4. This investigation adopted an assumed value for the uniform temperature distribution due to the transient temperature variations by local heating of the electron beam. The volatilization amounts of Ti at different melting powers against the melting time were shown in Figure 11. This amount increased linearly with the increase of melting time at the melting power of 12.0 kW, and the relationship between them could be expressed as Equation (9):
Δ m = V m . E × t + Δ m o
where Δm is the total volatilization amount of Ti in the experiment, t is the melting time, Δmo is the volatilization amount of Ti during the heating process, and Vm,E is the volatilization rate expressed as Equation (10) [42]:
V m , E = N m , E ( T i ) × s
where Nm,E(Ti) is the mass volatilization rate of Ti in the experiment, and s is the surface area of the molten pool (89 cm2). The volatilization rate and volatilization amount of Ti during the heating process at the melting power of 12.0 kW were obtained, respectively, by calculating the fitted slope and by extrapolating to zero the moment of the melting process, as shown in Figure 11. We adopted the assumption that the volatilization amount was the same during the heating process at different melting powers. Based on the fitted volatilization amounts of Ti at different melting powers and their losses during the heating process, the volatilization rates of Ti in the experiment (Vm,E) at three other melting powers were also obtained. Simultaneously, the mass volatilization rates of Ti in the experiment (Nm,E(Ti)) were calculated via Equation (10). Based on the Hertz-Knudsen-Langmuir equation (Equation (8)), the average temperatures of the molten pool surface at different melting powers were calculated [43]. They were 2250 K, 2306 K, 2322 K and 2345 K at melting powers of 10.5 kW, 12.0 kW, 13.5 kW and 15.0 kW, respectively.
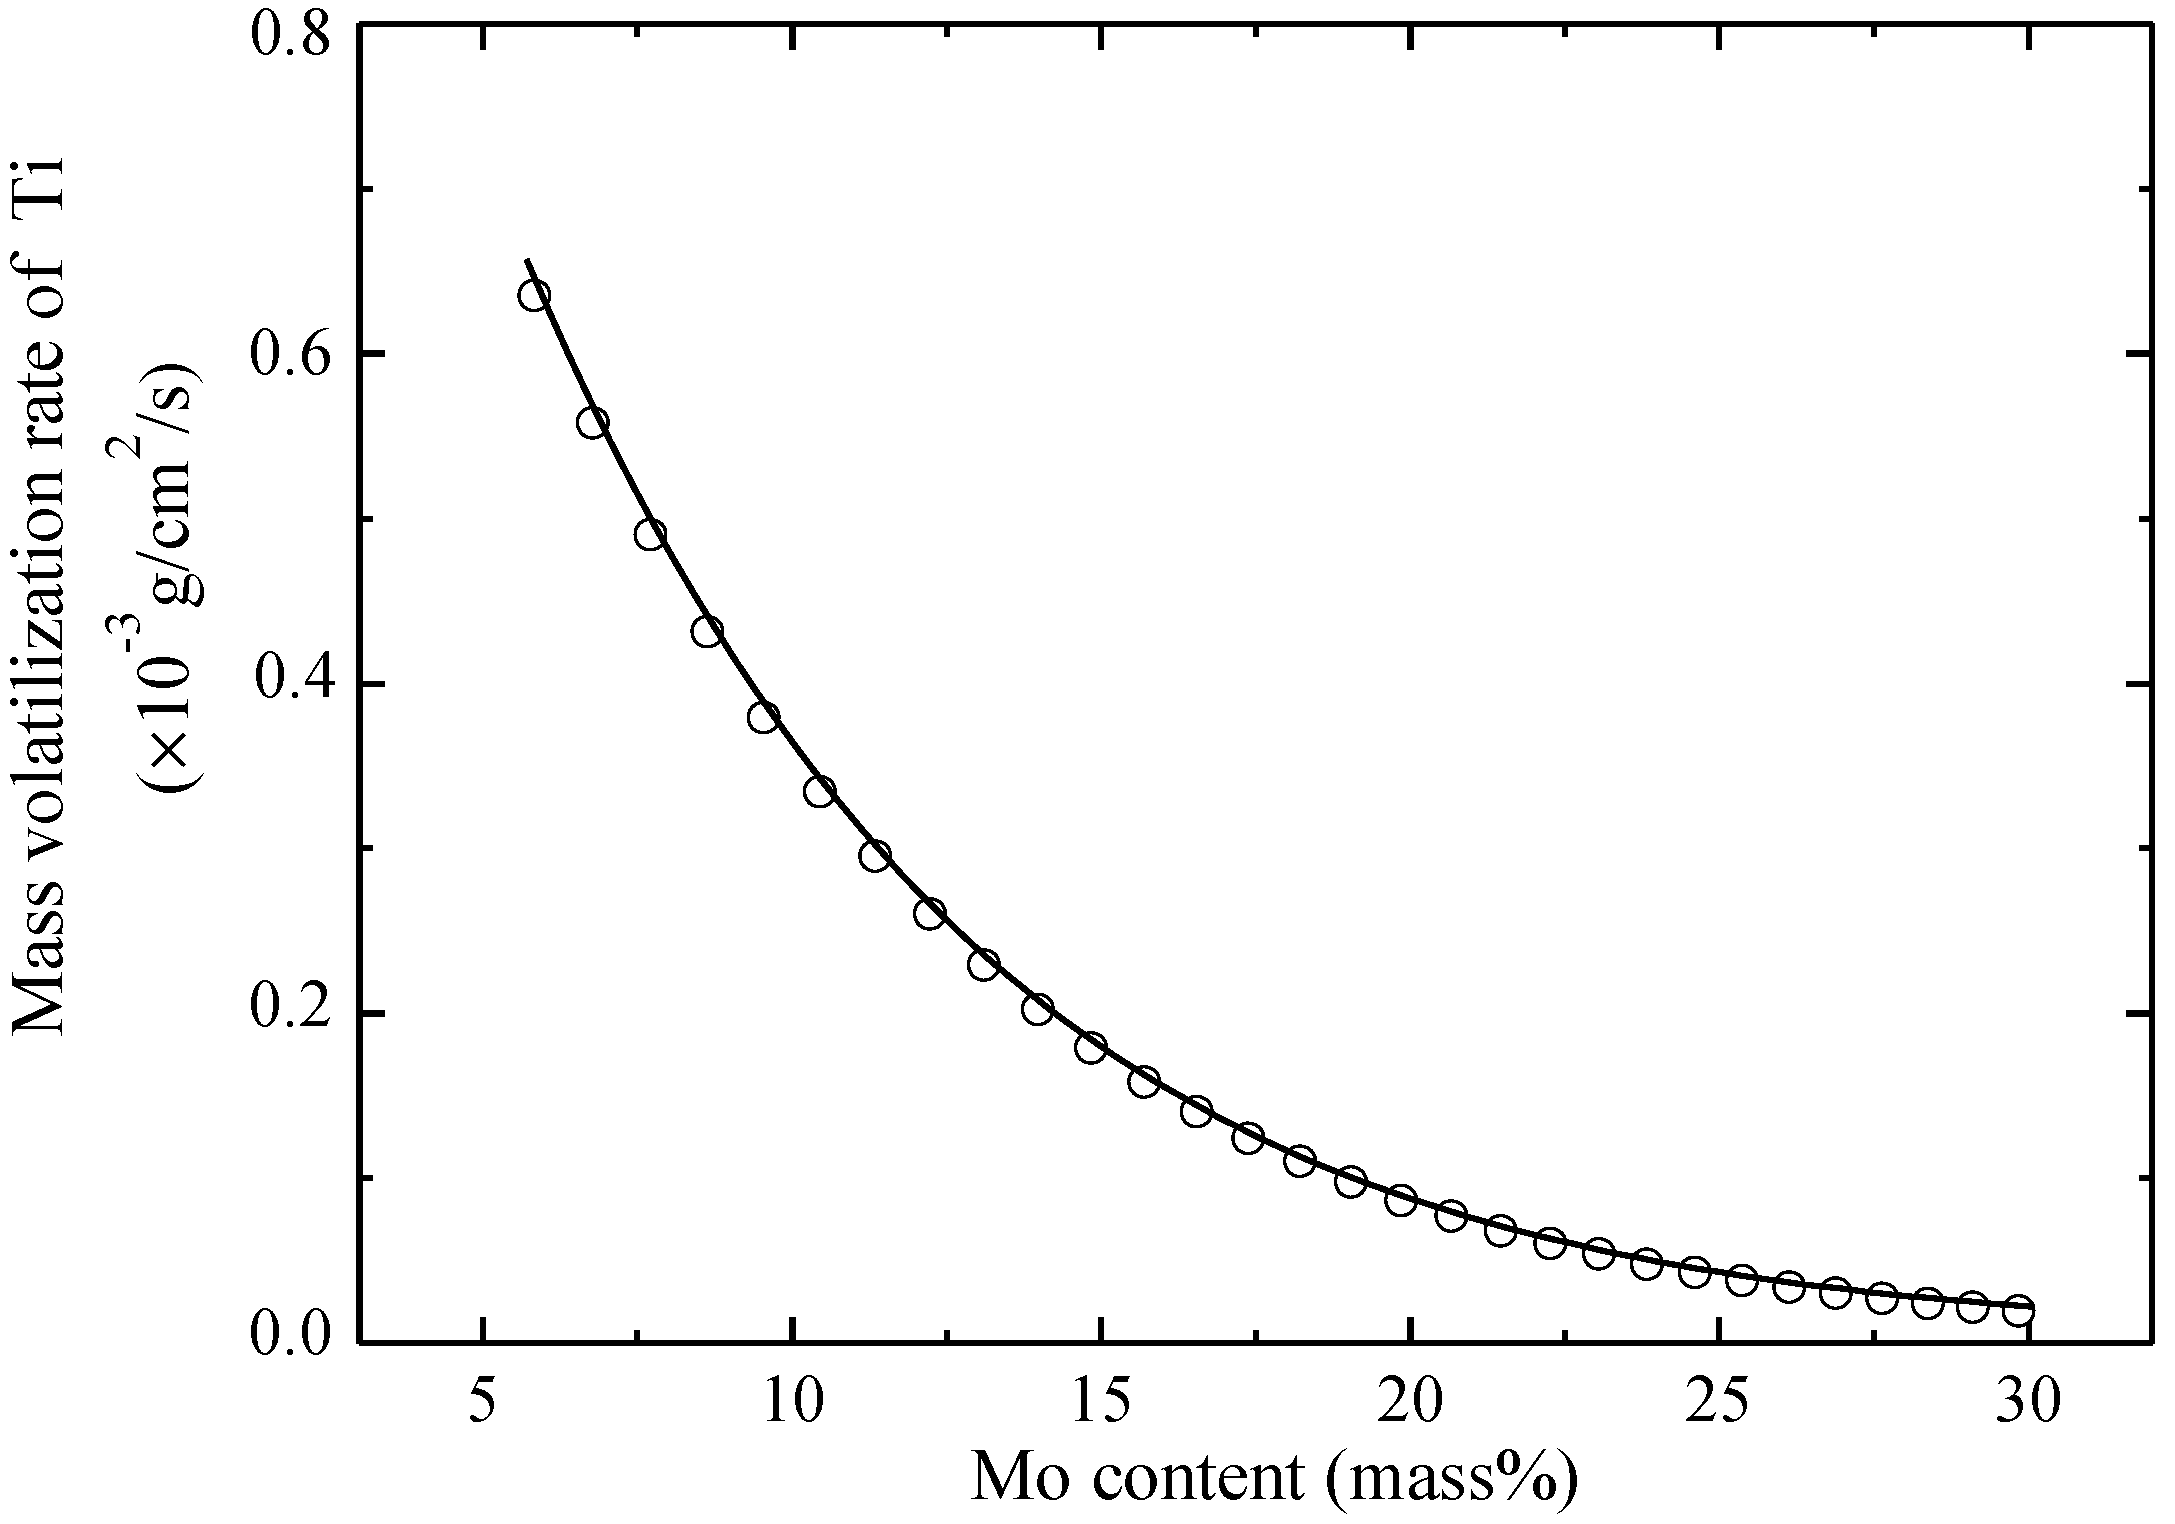
Due to the negligible effects of the melting power and melting time on the microstructures and composition segregation, a smaller melting power was an appropriate choice resulting from the lower volatilization rate. Thus, a compensation method of the volatile element (Ti) was discussed at the melting power of 10.5 kW for 20 min. Based on the Hertz-Knudsen-Langmuir equation (Equation (8)), the mass volatilization rates of Ti in the Ti-Mo binary alloys were deduced, as shown in Figure 12. Through polynomial fitting, the relationship between the mass volatilization rate of Ti and Mo content (x, in mass%) was expressed as the following equation:
N m ( T i ) = 2.64 × 10 4 + 1.13 × exp [ 2 × ( x + 103.86 56.69 ) ] 2
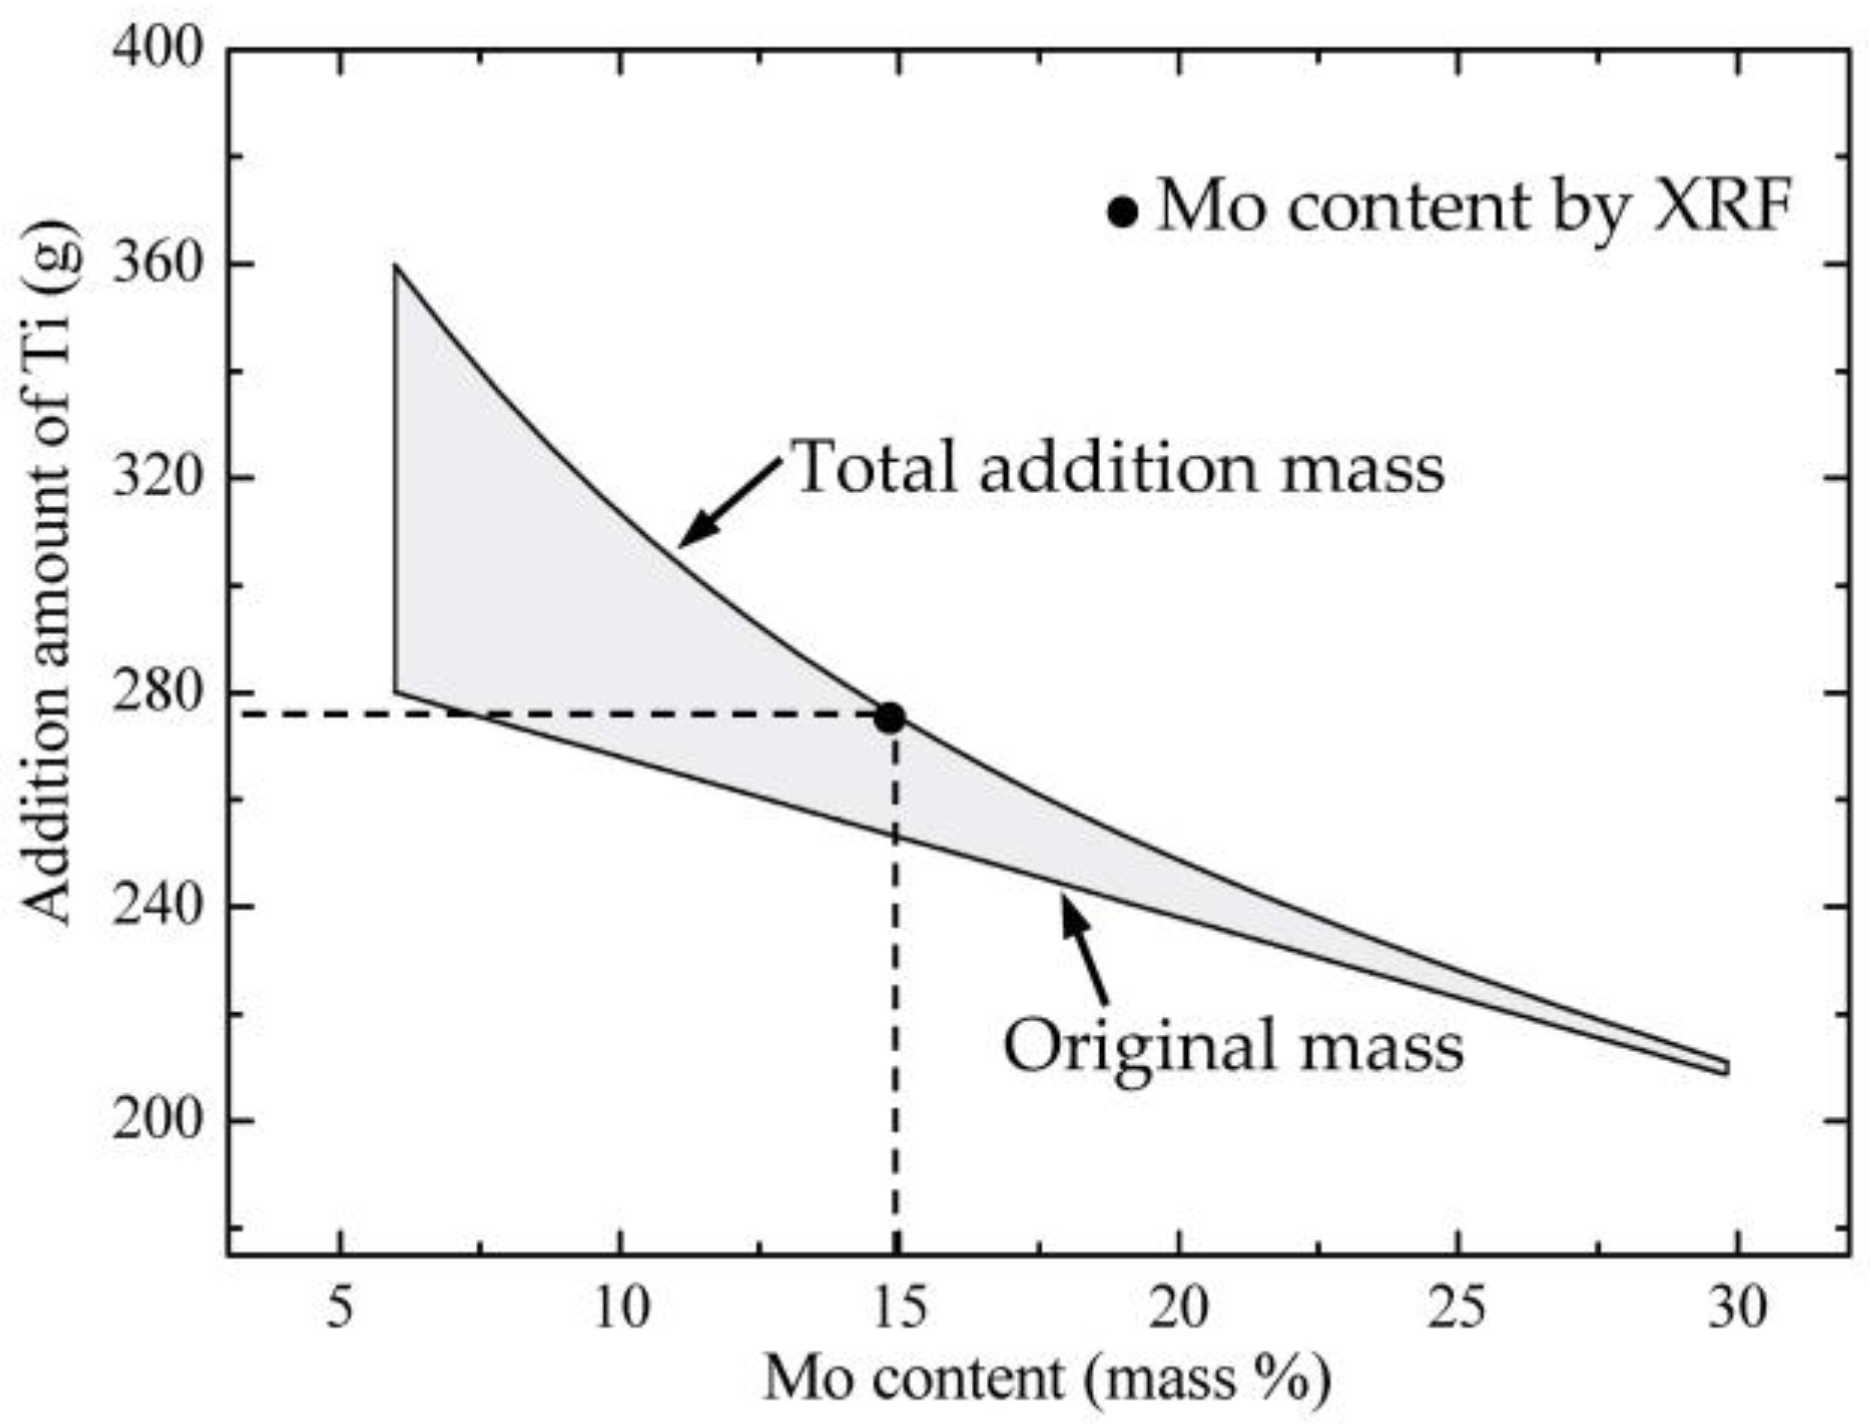
Consequently, addition amounts of Ti for fabricating the Ti-Mo binary alloys using EBM should take its evaporation into account. Its addition amount was related not only to the original mass ((1 − x) × malloy) but also to the surface area of the molten pool (s) and melting time (t) when the melting temperature was constant, as shown in Equation (12):
m T i = ( 1 x ) × m a l l o y + N m ( T i ) × s × t
where mTi is the total addition mass of Ti, x is the mass% of Mo and malloy is the nominal alloy mass. Figure 13 shows the schematic diagram for the addition amount of Ti for fabricating a 300 g Ti-Mo binary alloy using pure Ti and Ti-32Mo intermediate alloy as raw materials via EBM technology. The straight line represents the original mass which was depicted as ((1 − x) × malloy) in Equation (12). The area in gray shows the compensation amount resulting from the volatilization of Ti, which was represented as (Nm(Ti) × s × t) in Equation (12). Thus, the total addition amount of Ti is contained above two sections, represented by a curve line. Through the modification, 187.1 g of pure titanium and 133.3 g of Ti-32Mo intermediate alloy were melted at the melting power of 10.5 kW for 20 min for fabricating the Ti-15Mo alloy via EBM technology, as mentioned in Section 3.1. The composition of the ingot was identified as Ti-14.6Mo (mass%) via an XRF analysis, which was in accordance with the compensation method shown in Figure 13. The considerable compensation method of the Ti element was established in terms of the pure Ti and Ti-32Mo intermediate alloy as raw materials, while it should be modified with different raw materials.

6. Conclusions

The effects of electron beam melting parameters on the volatilization behavior of element and microstructures of ingots were investigated in a β-type Ti-Mo binary alloy. The considerable compensation method of the volatile element was discussed in terms of a theoretical calculation and experiment results. The main results were summarized as follows.
(1)
Ti was the main volatilization element during the EBM process based on the calculation of vapor pressure and on analyses for mass losses and the chemical compositions of the ingots. The mass volatilization rate of Ti exhibited an increasing tendency with the increase of both the melting power and melting time.
(2)
The ingots without apparent metallurgical defects were fabricated via EBM technology, and they consisted of large and columnar grains at the bottom and top sections, respectively. The effects of the melting power and melting time on the ingots’ microstructures were negligible.
(3)
Regardless of the melting time, Ti’s volatilization had the same pattern as that of the Ti-15Mo alloy. In terms of the pure Ti and Ti-32Mo intermediate alloys as raw materials, the considerable compensation method of the Ti element was established at the melting power of 10.5 kW for fabricating Ti-Mo binary alloys.

Acknowledgments

This work was financially supported by the Fundamental Research Funds for the Central University of China, China (Grant No. DUT16LAB12) and National Natural Science Foundation of China, China (Grant No. 51471040).

Author Contributions

Xiaohua Min and Yi Tan conceived and designed the experiments; Kai Yao performed the experiments, analyzed the data and wrote the paper; Shuang Shi contributed some analysis tools.

Conflicts of Interest

The authors declare no conflict of interest. The funding sponsors had no role in the design of the study; in the collection, analyses, or interpretation of data; in the writing of the manuscript, and in the decision to publish the results.

References

  1. Weissa, I.; Semiatinb, S.L. Thermomechanical processing of beta titanium alloys—An overview. Mater. Sci. Eng. A 1998, 243, 46–65. [Google Scholar] [CrossRef]
  2. Banerjee, D.; Williams, J.C. Perspectives on Titanium Science and Technology. Acta Mater. 2013, 61, 844–879. [Google Scholar] [CrossRef]
  3. An, H.; Liu, J.L.; Fan, L.Y. Quality control in smelting titanium ingots in vacuum arc-melting furnace. World Nonferrous Met. 2007, 8, 25–27. [Google Scholar]
  4. Henry, J.L.; Hill, S.D.; Schaller, J.L.; Campbell, T.T. Nitride inclusions in titanium ingots: A study of possible sources in the production of magnesium-reduced sponge. Mater. Trans. 1973, 4, 1859–1864. [Google Scholar] [CrossRef]
  5. Nakajima, T.; Morimoto, Y.; Takaki, S.; Abiko, K. Preparation of Ultra-Pure Ti-Al Alloys. Phys. Status Solidi 2015, 167, 411–418. [Google Scholar] [CrossRef]
  6. Board, C.A. Aircraft Accident Report; National Transportation Safety Board: Washington, DC, USA, 2004.
  7. Choudhury, A.; Hensberger, E. Electron beam melting and refining of metals and alloys. ISIJ Int. 1992, 32, 673–681. [Google Scholar] [CrossRef]
  8. Zhang, Y.M.; Zhou, L.; Sun, J.; Han, M.C.; Sun, Y.; Yang, J.C. The development of cold hearth melting technique. Titan. Ind. Prog. 2007, 24, 27–30. [Google Scholar]
  9. Schwab, H.; Prashanth, K.G.; Lober, L.; Kuhn, U.; Eckert, J. Selective laser melting of Ti-45Nb alloy. Metals 2015, 5, 686–694. [Google Scholar] [CrossRef]
  10. Smith, C.J.; Derguti, F.; Nava, E.H.; Thomas, M.; Williams, S.T.; Gulizia, S.; Fraser, D.; Todd, I. Dimensional accuracy of electron beam melting (EBM) additive manufacture with regard to weight optimized tress structures. J. Mater. Process. Technol. 2016, 229, 128–138. [Google Scholar] [CrossRef]
  11. Liu, Y.J.; Li, S.J.; Wang, H.L.; Hou, W.T.; Hao, Y.L.; Yang, R.; Sercombe, T.B.; Zhang, L.C. Microstructure, defects and mechanical behavior of beta-type titanium porous structures manufactured by electron beam melting and selective laser melting. Acta Mater. 2016, 113, 56–67. [Google Scholar] [CrossRef]
  12. Tan, Y.; You, X.G.; You, Q.F.; Li, J.Y.; Shi, S.; Li, P.T. Microstructure and deformation behavior of nickel based superalloy Inconel 740 prepared by electron beam smelting. Mater. Charact. 2016, 114, 267–276. [Google Scholar] [CrossRef]
  13. Tan, Y.; Shi, S.; Guo, X.L.; Jiang, D.C.; Dong, W.; Ren, S.Q. Effect of cooling rate on solidification of electron beam melted silicon ingots. Vacuum 2013, 89, 12–16. [Google Scholar] [CrossRef]
  14. Shi, S.; Dong, W.; Peng, X.; Jiang, D.C.; Tan, Y. Volatilization and removal mechanism of phosphorus from the surface of silicon melt during electron beam melting. Appl. Surf. Sci. 2013, 266, 344–349. [Google Scholar] [CrossRef]
  15. Jiang, D.C.; Tan, Y.; Shi, S.; Dong, W.; Gu, Z.; Zou, R.X. Removal of phosphorus in molten silicon by electron beam candle melting. Mater. Lett. 2012, 78, 4–7. [Google Scholar] [CrossRef]
  16. Choi, G.S.; Lim, J.W.; Munirathnam, N.R.; Kim, I.H.; Kim, J.S. Preparation of 5N grade tantalum by electron beam melting. J. Alloys Compd. 2009, 469, 298–303. [Google Scholar] [CrossRef]
  17. You, X.G.; Tan, Y.; You, Q.F.; Shi, S.; Li, J.Y.; Ye, F.; Wei, X. Preparation of Inconel 740 superalloy by electron beam smelting. J. Alloys Compd. 2016, 676, 202–208. [Google Scholar] [CrossRef]
  18. You, X.G.; Tan, Y.; Li, J.Y.; Li, P.T.; Dong, C.; Shi, S.; Liao, J.; Qin, S.Q. Effects of solution heat treatment on the microstructure and hardness of Inconel 740 superalloy prepared by electronbeam smelting. J. Alloys Compd. 2015, 638, 239–248. [Google Scholar] [CrossRef]
  19. Kanayama, H.; Kusamichi, T.; Muraoka, T.; Onouye, T.; Nishimura, T. Electron beam melting of sponge titanium. ISIJ Int. 1991, 31, 906–914. [Google Scholar] [CrossRef]
  20. Vutova, K.; Vassileva, V.; Koleva, E.; Georgieva, E.; Mladenov, G.; Mollov, D.; Kardjiev, M. Investigation of electron beam melting and refining of titanium and tantalum scrap. J. Mater. Process. Technol. 2010, 210, 1089–1094. [Google Scholar] [CrossRef]
  21. Zhang, Y.M.; Sun, J.; Han, M.C.; Zhou, L.; Yang, J.C. Electron beam cold hearth melting of TC4. Aerosp. Mater. Technol. 2007, 5, 50–52. [Google Scholar]
  22. Akhonin, S.V.; Trigub, N.P.; Zamkov, V.N.; Semiatin, S.L. Mathematical modeling of aluminum evaporation during electron-beam cold-hearth melting of Ti-6Al-4V ingots. Metall. Mater. Trans. B 2003, 34, 447–454. [Google Scholar] [CrossRef]
  23. Han, M.C.; Zhang, Y.M.; Zhou, Y.G.; Zhao, T.F.; Yang, J.C.; Li, J.; Zhou, L. Elimination of LDI and HDI in TC4 alloy during electron beam cold hearth melting. Rare Met. Mater. Eng. 2008, 4, 665–669. [Google Scholar]
  24. Zhang, Y.M.; Zhou, L.; Sun, J.; Han, M.C.; Georg, R.; Jochen, F.; Yang, J.C.; Zhao, Y.Q. An investigation on electron beam cold hearth melting of Ti64 Alloy. Rare Met. Mater. Eng. 2008, 37, 1973–1977. [Google Scholar] [CrossRef]
  25. Mitchell, A.; Kawakami, A.; Cockcroft, S.L. Beta fleck and segregation in titanium alloy ingots. High Temp. Mater. Process. 2006, 25, 337–349. [Google Scholar] [CrossRef]
  26. Xiang, L.; Min, X.H.; Mi, G.B. Application and research process of body-centered-cubic Ti-Mo base alloys. J. Mater. Eng. 2017, 45, 128–136. [Google Scholar]
  27. Cotton, J.D.; Briggs, R.D.; Boyer, R.R.; Tamirisakandala, S.; Russo, P.; Shchetnikov, N.; Fanning, J.C. State of the art in beta titanium alloys for airframe applications. JOM 2015, 67, 1281–1303. [Google Scholar] [CrossRef]
  28. Zhou, Y.L.; Luo, D.W. Microstructure and mechanical properties of Ti-Mo alloys cold-rolled and heat treatment. Mater. Charact. 2011, 62, 931–937. [Google Scholar] [CrossRef]
  29. Haghighi, S.E.; Cao, G.H.; Zhang, L.C. Nanoindentation study of mechanical properties of Ti based alloys with Fe and Ta additions. J. Alloys Compd. 2017, 692, 892–897. [Google Scholar] [CrossRef]
  30. Haghighi, S.E.; Liu, Y.J.; Cao, G.H.; Zhang, L.C. Influence of Nb on the β→α″ martensitic phase transformation and properties of the newly designed Ti-Fe-Nb alloys. Mater. Sci. Eng. C 2016, 60, 503–510. [Google Scholar] [CrossRef] [PubMed]
  31. Lai, M.J.; Tasan, C.C.; Raabe, D. On the mechanism of {332} twinning in metastable β titanium alloys. Acta Mater. 2016, 111, 173–186. [Google Scholar] [CrossRef]
  32. Castany, P.; Ramarolahy, A.; Prima, F.; Laheurte, P.; Curfs, C.; Gloriant, T. In situ synchrotron X-ray diffraction study of the martensite transforamtion in superelastic Ti-24Nb-0.5N and Ti-24Nb-0.5O alloys. Acta Mater. 2015, 88, 102–111. [Google Scholar] [CrossRef]
  33. Yin, F.; Iwasaki, S.; Ping, D.; Nagai, K. Snoek-type high damping alloys realized in β-Ti alloys with high oxygen solid solution. Adv. Mater. 2006, 18, 1541–1544. [Google Scholar] [CrossRef]
  34. Min, X.H.; Tsuzaki, K.; Emura, S.; Tsuchiya, K. Enhancement of uniform elongation in high strength Ti–Mo based alloys by combination of deformation modes. Mater. Sci. Eng. A 2011, 528, 4569–4578. [Google Scholar] [CrossRef]
  35. Kubaschewshi, O.; Evans, F.L.L.; Alock, C.B. Metallurgical Thermochemistry, 5th ed.; Pergamon Press: New York, NY, USA, 1979. [Google Scholar]
  36. You, Q.F.; Shi, S.; You, X.G.; Tan, T.; Wang, Y.N.; Li, J.Y. Evaporation behavior of Ni, Cr and Fe in Inconel 718 superalloy during electron beam melting. Vacuum 2017, 135, 135–141. [Google Scholar] [CrossRef]
  37. Su, Y.Q.; Guo, J.J.; Liu, G.Z. Quality Control of Molten Alloy in Vacuum Melting Process of Nonferrous Alloys; Harbin Institute of Technology Press: Harbin, China, 2005. [Google Scholar]
  38. You, Q.F.; Yuan, H.; You, X.G.; Li, J.Y.; Zhao, L.H.; Shi, S.; Tan, Y. Segregation behavior of nickel-based superalloy after electron beam smelting. Vacuum 2017, 145, 116–122. [Google Scholar] [CrossRef]
  39. Ramirez-Ledesma, A.L.; Lopez, H.F.; Juarez-Islas, J.A. Evaluation of chill cast Co-Cr Alloys for biomedical applications. Metals 2016, 6, 188. [Google Scholar] [CrossRef]
  40. Zhou, X.Y.; Min, X.H.; Emura, S.; Tsuchiya, K. Accommodative {332}<113> primary and secondary twinning in a slightly deformed β-type Ti-Mo alloy. Mater. Sci. Eng. A 2017, 684, 534–541. [Google Scholar] [CrossRef]
  41. Zhang, Z.H.; Su, Y.Q.; Chen, D.Z.; Guo, J.J.; Fu, H.Z. Dynamic model for evaporation loss calculation of alloying elements. Foundry 2009, 58, 373–375. [Google Scholar]
  42. Maeda, M.; Kiwake, T.; Shibuya, K.; Ikeda, T. Activity of aluminum in molten Ti-Al alloys. Mater. Sci. Eng. A 1997, 239–240, 276–280. [Google Scholar] [CrossRef]
  43. Yan, J.W.; Luo, L.; Peng, A.F.; Zhang, C.S.; Cao, Q.H. Behavior of element vaporization and composition control of Fe-Ga alloy during vacuum smelting. J. Iron Steel Res. Int. 2015, 22, 983–989. [Google Scholar] [CrossRef]
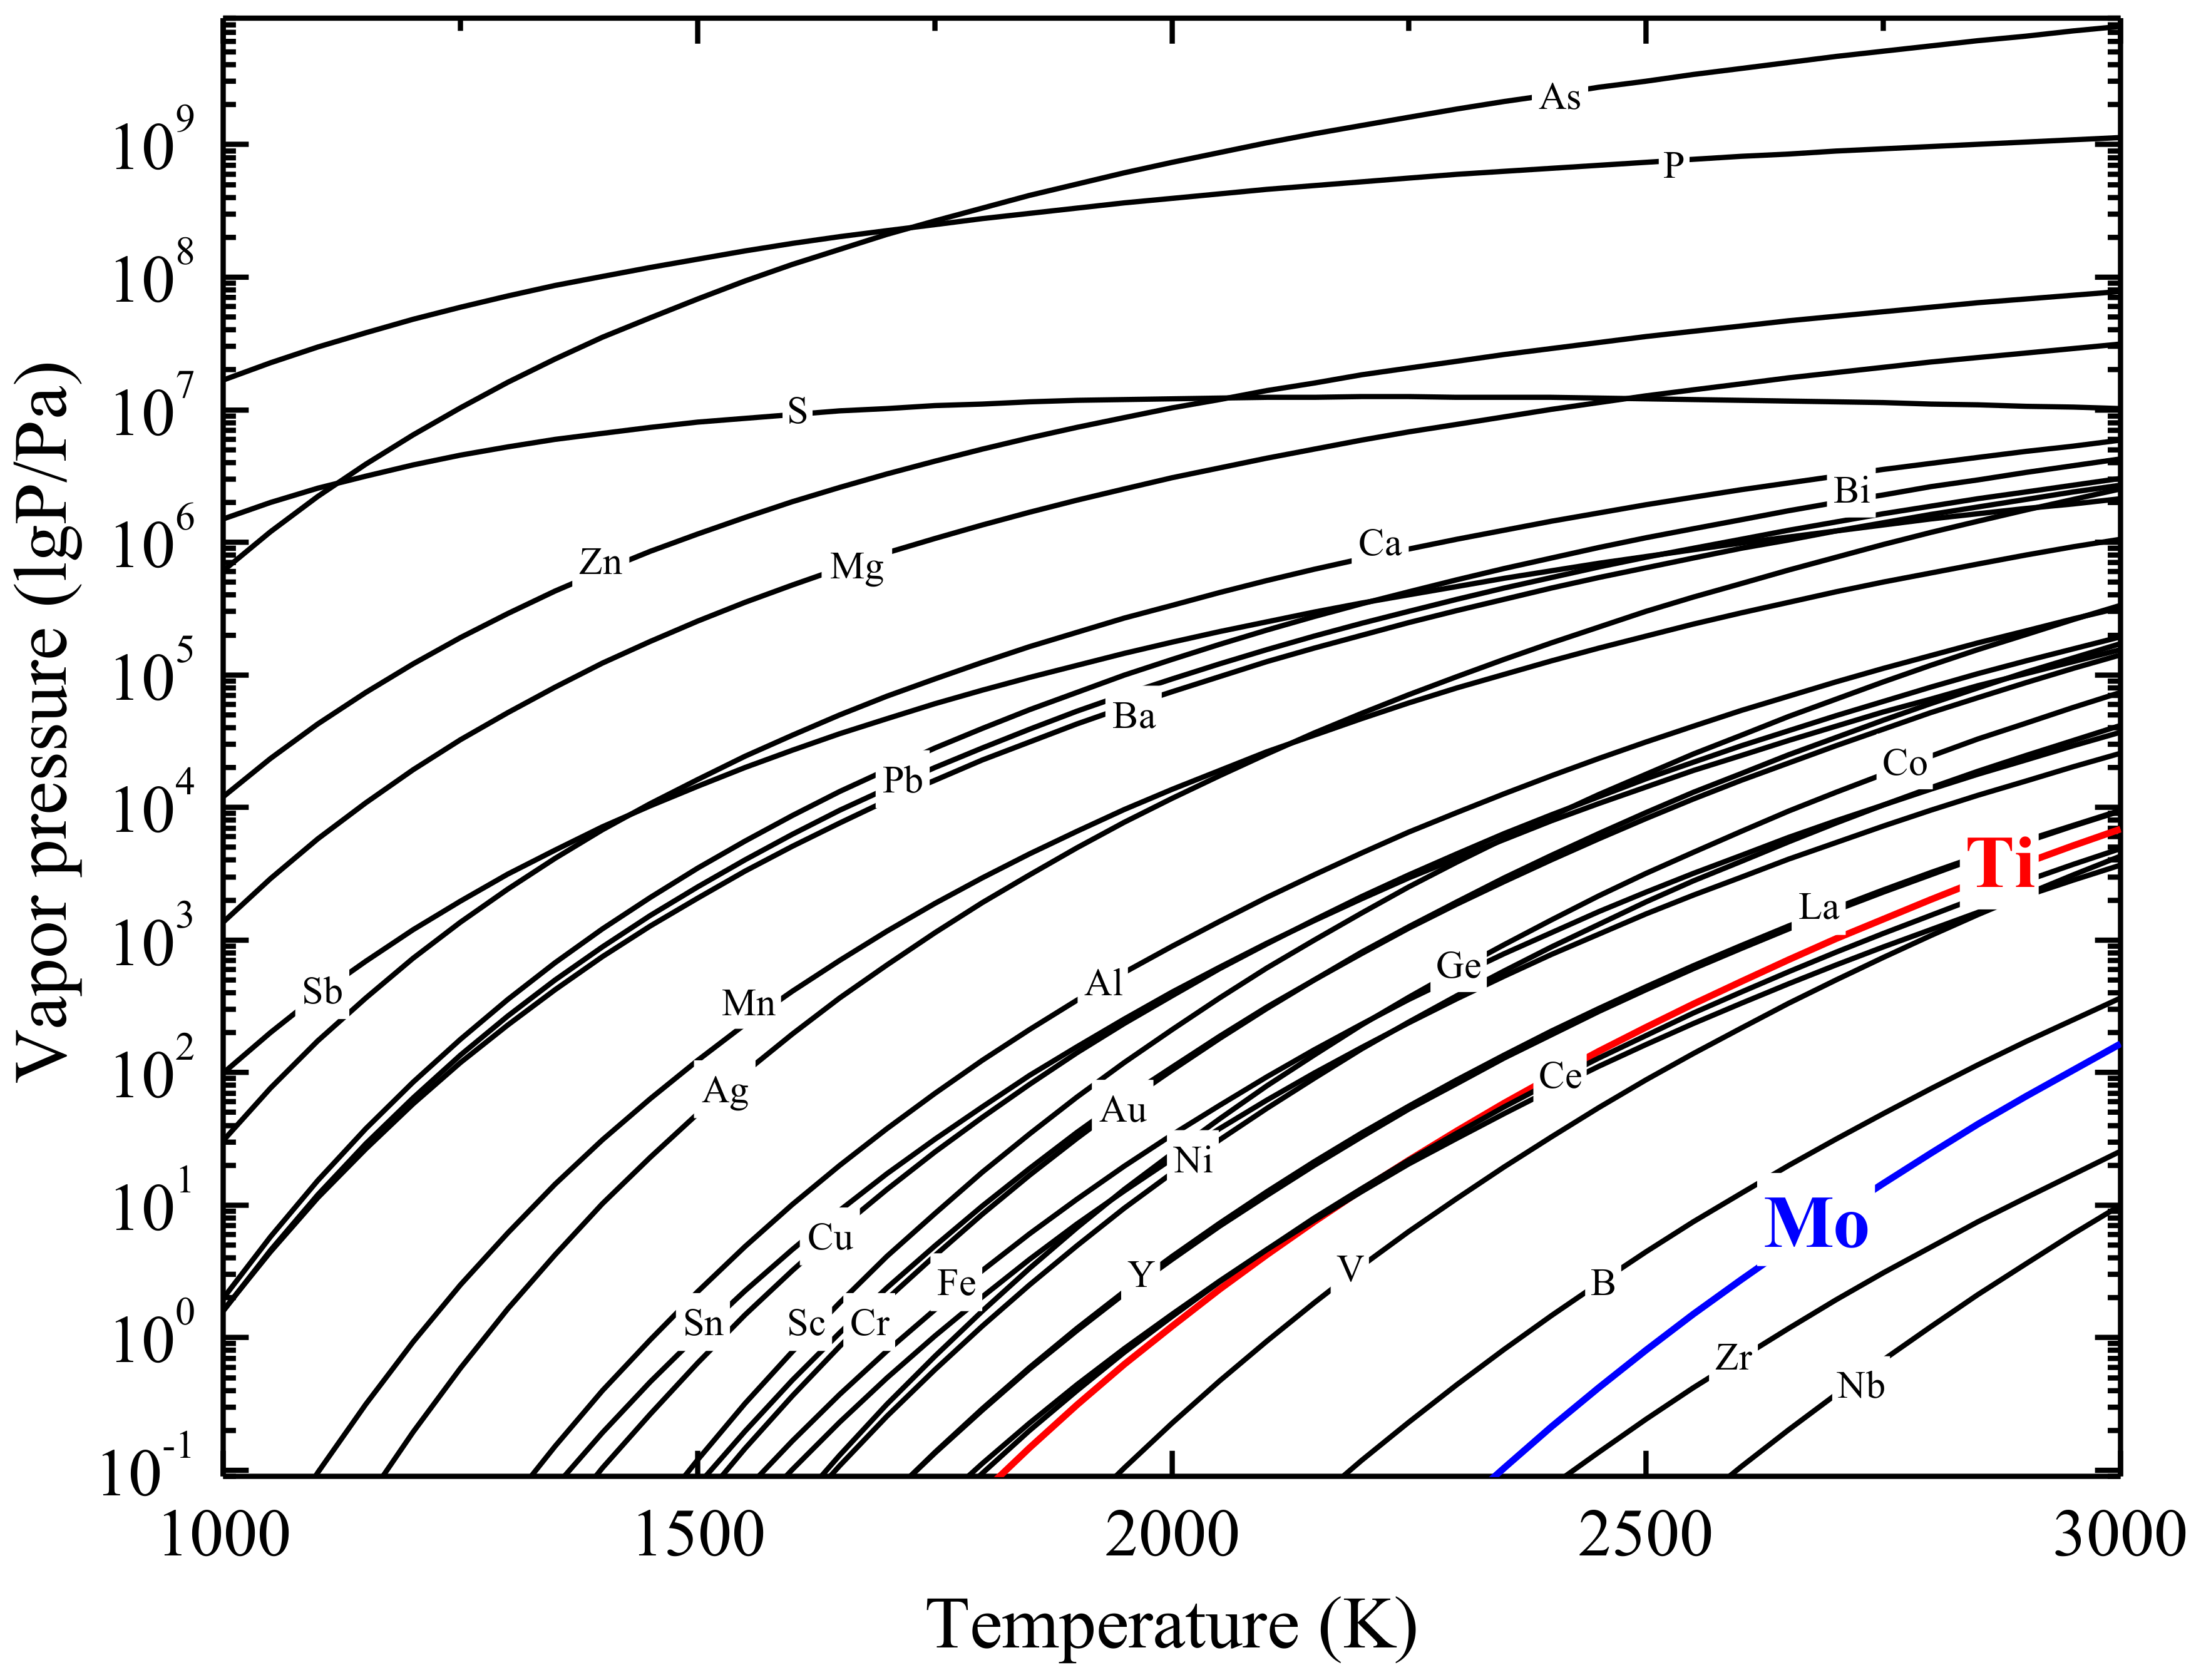
Figure 1. The saturated vapor pressures of the pure elements as a function of the temperature.
Metals 08 00206 g001
Figure 2. The activities of Ti and Mo in the Ti-15Mo alloy, as a function of the temperature.
Metals 08 00206 g002
Figure 3. The vapor pressures of Ti and Mo as a function of the temperature in the Ti-Mo alloys.
Metals 08 00206 g003
Figure 4. The mass volatilization rates of Ti as a function of the Mo content at different temperatures in the Ti-Mo alloys.
Metals 08 00206 g004
Figure 5. The schematic diagram of the electron beam melting apparatus.
Metals 08 00206 g005
Figure 6. The overall microstructures of the ingot manufactured at a melting power of 10.5 kW for 20 min: (a) bottom section; (b) middle section; and (c) top section.
Metals 08 00206 g006
Figure 7. The microstructures at the top sections of the Ti-Mo ingots manufactured at different melting powers for 20 min: (a) 10.5 kW; (b) 12.0 kW; (c) 13.5 kW; and (d) 15.0 kW.
Metals 08 00206 g007
Figure 8. The microstructures at the top sections of the Ti-Mo ingots manufactured at the melting power of 12.0 kW for different lengths of time: (a) 10 min; (b) 20 min; (c) 30 min; and (d) 40 min.
Metals 08 00206 g008
Figure 9. The X-ray diffraction profile of the ingot manufactured at the melting power of 12.0 kW for 20 min. The vertical section of the ingot was analyzed.
Metals 08 00206 g009
Figure 10. The volatilization rate of Ti as a function of (a) the melting power and (b) the melting time.
Metals 08 00206 g010
Figure 11. The volatilization amounts of Ti under different melting parameters for 300 g Ti-Mo ingots.
Metals 08 00206 g011
Figure 12. The mass volatilization rates of Ti in the Ti-Mo binary alloys at the melting power of 10.5 kW.
Metals 08 00206 g012
Figure 13. The compensation method of the volatile Ti element for electron beam melting 300 g Ti-Mo ingots with different Mo contents at a melting power of 10.5 kW: the straight line and curve line represent the original mass and total addition mass of Ti, respectively, and the difference between them represented by the gray area indicate the compensation value; the black point represents the Mo content of the ingot analyzed via X-ray fluorescence for the Ti-15Mo alloy.
Metals 08 00206 g013
Table 1. The mass loss rates of ingots and volatilization rates of Ti at the different powers for 20 min.
Melting Power (kW)Mass Loss Rate of First Time (%)Mass Loss Rate of Second Time (%)Total Mass Loss Rate of Ingot (%)Volatilization Rate of Ti (%)
10.54.53.58.09.2
12.05.5 4.810.310.7
13.55.25.310.511.5
15.08.710.319.019.9
Table 2. The mass loss rates of ingots and volatilization rates of Ti at the melting power of 12.0 kW for different lengths of time.
Melting Time (min)Mass Loss Rate of First Time (%)Mass Loss Rate of Second Time (%)Total Mass Loss Rate of Ingot (%)Volatilization Rate of Ti (%)
102.84.4 7.27.9
205.54.810.310.7
307.610.317.919.0
409.513.523.024.9