Article

Rotating Bending Fatigue Microscopic Fracture Characteristics and Life Prediction of 7075-T7351 Al Alloy

1
Department of Engineering Mechanics, School of Aerospace Engineering, Tsinghua University, Beijing 100084, China
2
Biomedical Flow Dynamics Laboratory, Creative Flow Research Division, Institute of Fluid Science, Tohoku University, Sendai 980-8577, Japan
3
Air China Cargo, Tianzhu airport industrial zone A, Beijing 101300, China
*
Author to whom correspondence should be addressed.
Metals 2018, 8(4), 210; https://doi.org/10.3390/met8040210
Submission received: 3 February 2018 / Revised: 16 March 2018 / Accepted: 18 March 2018 / Published: 25 March 2018

Abstract

:
Rotating bending fatigue tests were carried out by using the 7075-T7351 Al alloy with a microarc oxidation (MAO) coating (h = 10 μm) and with no coating. Tests were conducted in air and 5.0% NaCl aqueous solution conditions. The fatigue microscopic fracture behavior of the metals was investigated by using scanning electron microscope and three-dimensional digital microscope technologies. The empirical formulas between the stress intensity factor ΔK and the fatigue life Nf in the different conditions were obtained. In addition, the reason for data scattering in the fatigue lives of uncoated 7075-T7351 samples under the same stress amplitude in air was analyzed. Furthermore, the fatigue characteristic life of 7075-T7351 alloy was predicted by the three-parameter Weibull distribution model.

1. Introduction

Al alloys have received much attention in the past several decades because of their excellent properties, such as high strength-to-weight ratio and recyclability [1,2,3,4,5,6,7,8,9,10,11,12]. Therefore, they were widely applied to Aeronautics and Astronautics, as well as other lightweight fields [2,3,4,5,6,7,8,9,10,11,12,13,14,15]. However, inferior wear resistance, corrosion resistance, and fatigue resistance—including mechanical fatigue resistance (in air) and corrosion fatigue resistance (in corrosive media)—have limited their extensive application [2,3,4,5,6,7,8,9,10,11,12,13,14,15]. For the inferior properties of Al alloys (especially high-strength Al alloys), improvement methods based on various surface treatment technologies (including protective coatings) have also been given attention in the past several decades [1,2,3,4,5,6,7]. For example, Yerokhin et al. [1] summarized roundly that the AC-pulse microarc oxidation (MAO) treatment of Al alloys in a suitable passivating electrolyte allows the formation of relatively thick (thickness h = 500 μm) and hard (23 GPa) surface coating layers with an excellent adhesion capability to the substrate, so that excellent corrosion resistance properties can be obtained. Lonyuk et al. [2] reached the conclusion that good wear resistance for the light metals is achieved by using ceramic coating technologies, but the coated samples have a very low fatigue strength due to the brittleness and the defects features (such as the thermal crack and shrinkage cavity) in the ceramic coating layers. Recently, Wang et al. [3,4,5] reported that MAO coating through retreatment of a pore-sealing by epoxy resin can improve not only the mechanical fatigue strength, but also the corrosion fatigue strength of Al alloys within the limits of 105–108 cycles. In addition, the (corrosion) fatigue behavior and damage mechanisms of Al alloys on the basis of fatigue life prediction models have also been studied extensively to avoid accidents caused by a sudden fatigue failure of materials or components [8,9,10,11,12,13,14,15]. For example, Ishihara et al. [8] investigated the fatigue crack initiation and propagation behavior of 2024-T3 Al alloy in detail, and predicted the corrosion fatigue life based on the pit growth law. Li et al. [9] studied the effect of the prior corrosion state on the fatigue micro-crack initiation and propagation behavior of 6151-T6 Al alloy based on scanning electron microscopy (SEM) in situ observation technology, and obtained the fatigue micro-crack growth rates in different equivalent corrosion conditions. Wang [10] derived a new expression for the corrosion fatigue crack propagation (CFCP) rate according to the principle of fracture mechanics, which reflected the important correlation among the CFCP rate, corrosion damage, and mechanical parameters of metals.
However, the coupled mechanisms of fatigue fracture in macro and micro scales for some high-strength Al alloys are not completely clear, and it is difficult to evaluate the scattering of fatigue data, in part due to a lack of data. This paper proposed a new estimated approach for scattering fatigue data. In the past, the two-parameter (2-P) Weibull distribution model was preferred for reliability analysis, but it lacks sufficient precision [16]. In this paper, the fatigue microscopic fracture behavior of 7075-T7351 Al alloy, uncoated and MAO coated (h = 10 μm), in air and in 5.0% NaCl aqueous solution conditions, were investigated, and the empirical formulas between the stress intensity factor ΔK and the fatigue life Nf in different conditions were summarized. In addition, the reason for data scattering in fatigue lives of uncoated 7075-T7351 samples under the same stress amplitude in air was studied. Furthermore, the fatigue characteristic life can be predicted by the three-parameter (3-P) Weibull distribution model, which has higher precision than the 2-P Weibull distribution model.

2. Materials and Methods

2.1. Material

Uncoated 7075-T7351 Al alloy with a nominal chemical composition (wt %) of 5.89 Zn, 2.48 Mg, 1.59 Cu, 0.22 Cr, 0.06 Fe, 0.02 Ti, and a balance of Al; and 7075-T7351 Al alloy with an MAO coating (h = 10 μm) were used. For the details of MAO coating production, refer to previous works [1,5,17,18]. The main mechanical properties of two kinds of samples at room temperature are listed in Table 1. The hardness of two kinds of samples was measured by Brinell Rockwell and Vickers Optical Hardness Tester (HBRVU-187.5, Shanghai Material Testing Machine Factory, Shanghai, China) with a testing load of 980 N and a load holding time of 5 ± 2 s. The hardness of the coated (h = 10 μm) sample was slightly less than that of the uncoated sample, as shown in Table 1. This is because there was a soft epoxy resin layer (Phoenix WSR6101, Nantong Xingchen Synthetic Material Co. Ltd., Jiangsu, China) on the free surface of coated sample [5]. In addition, the residual stresses in the coating for two kinds of samples were measured by an X-ray diffractomer (X-350 A, Handan Este Stress Technology Co. Ltd., Hebei, China), using sin 2 ψ (X-ray) diffraction approach for the diffracted plane (311) at 2θ = 134.00°. The measurements were carried out at four different ψ angles (0.00°, 24.20°, 35.30°, and 45.0°) with a scan step of 0.10° and an exposure time of 0.50 s. The compressed residual stress was observed in the coated (h = 10 μm) sample, as shown in Table 1, which is strongly dependent on the MAO processing parameters and post-processing methods [1,17,18].
The samples used in the rotating bending fatigue tests (as shown in Figure 1) were designed with a circular center notch (radius 7 mm) to generate a stress concentration (stress concentration factor is 1.08), so that the crack initiated at the notch position [3,4,5,11,12,19]. All uncoated samples were carefully machined by turning and grinding to the required dimensions and then abraded using abrasive paper (2000 grit) to achieve a surface roughness of approximately Ra = 0.6 to 0.8 μm prior to the rotating bending fatigue tests. Fatigue fracture surfaces were observed by SEM (Quanta FEG 450 SEM, FEI Company, Hillsboro, OR, USA) and a three-dimensional digital microscope (RH-2000, Hirox Co. Ltd., Tokyo, Japan).

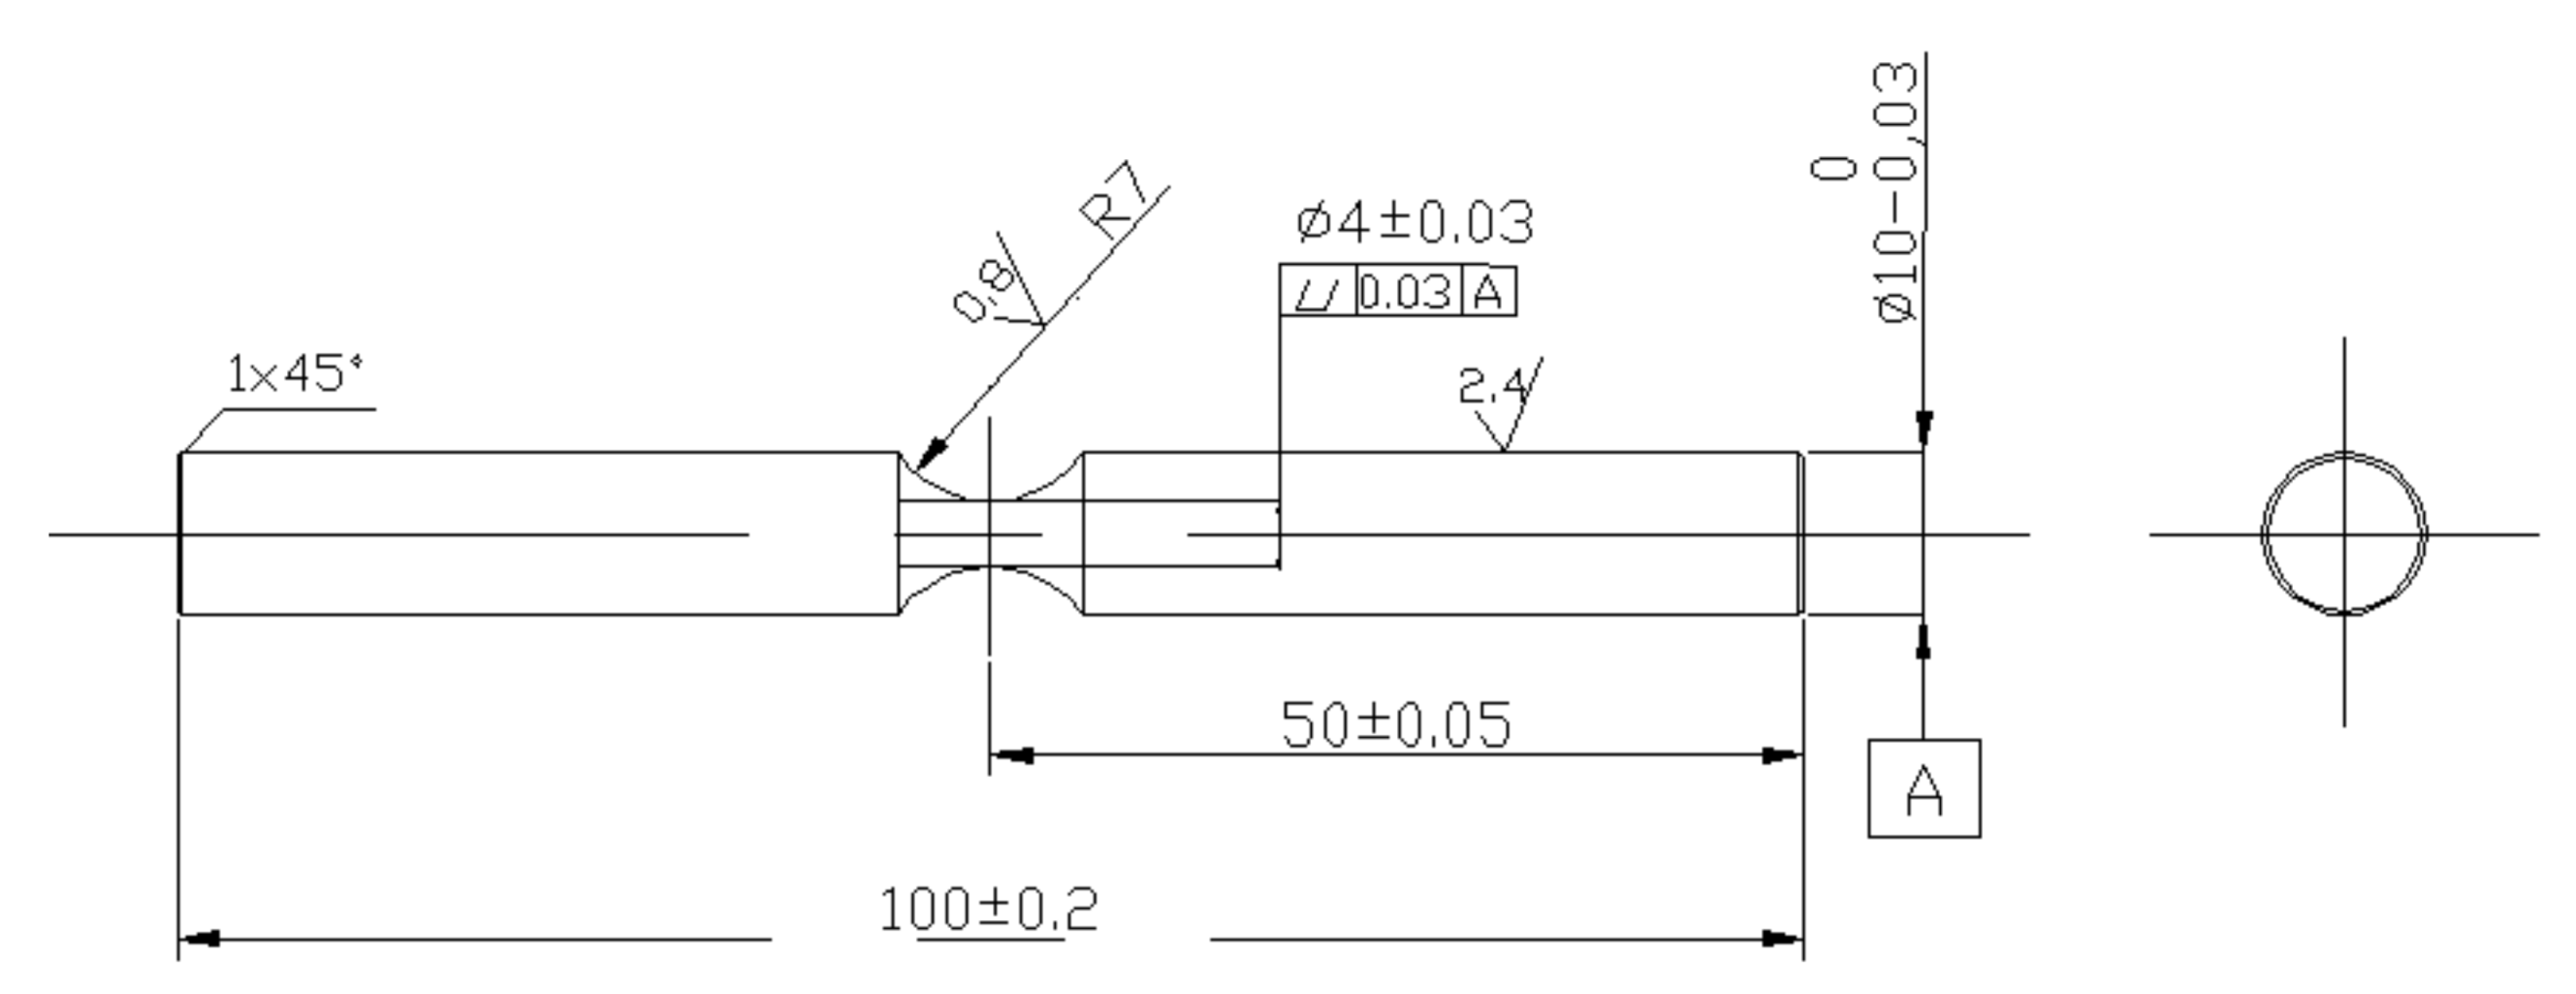
2.2. Mechanical Testing

The rotating bending fatigue test was used to investigate the fatigue behavior of samples. The applied stress amplitude is estimated as follows:
σ a = 32 g α L W π d 3   ( MPa ) ,
where d is the diameter of the gauge section (i.e., 4 mm), g is the acceleration of gravity (9.8 m/s2), α is the stress concentration factor (1.08) in the notch position, L is the distance from the cross-section to the site where the load is applied (40.5 mm), and W is the applied weight (kgf). All rotating bending fatigue tests were conducted at a stress ratio of R = −1 and a rotating rate of about 3300 r/min (55 Hz) according to ASTM E468-90 [20]. Air and 5.0% NaCl aqueous solution (pH = 7.24 at room temperature) were used as testing media.

2.3. Three-Parameter Weibull Distribution Function

Weibull distribution is an important statistical method for fatigue reliability analysis [20,21]. To quantitatively confirm the reliability of the scattering fatigue data, a probabilistic analysis method was proposed based on the 3-P Weibull distribution model, which has relatively higher precision and better integrality than the 2-P Weibull distribution model. The failure probability function of 3-P Weibull distribution is expressed as follows:
F ( x ) = { 1 e ( x c b ) m   x c , 0   x < c
where F(x) is the failure probability, and m, b, and c are the shape, scale, and location parameters, respectively. The shape parameter m mainly reflects the type of failure mechanism and the scattering degree of fatigue data. The scale parameter b is used to estimate the quality of materials or components, because the sum of the scale parameter and the location parameter c is equal to the fatigue life when F(x) is 63.2%. The location parameter c means that the failure probability is 0 when х is less than c.
When the number of testing samples n is less than 20 (n = 8 in this paper), F(x) can be estimated as follows:
F ( x i ) = i 0.3 n + 0.4 .
Therefore, the values of m, b, and c in Equation (2) can be estimated by using Equation (3) [22].
The fatigue data under the different stress amplitudes are listed in Table 2, in which the number of samples is n = 8 for each stress amplitude, and all of the estimated statistical parameters are also listed in Table 3.

3. Discussion

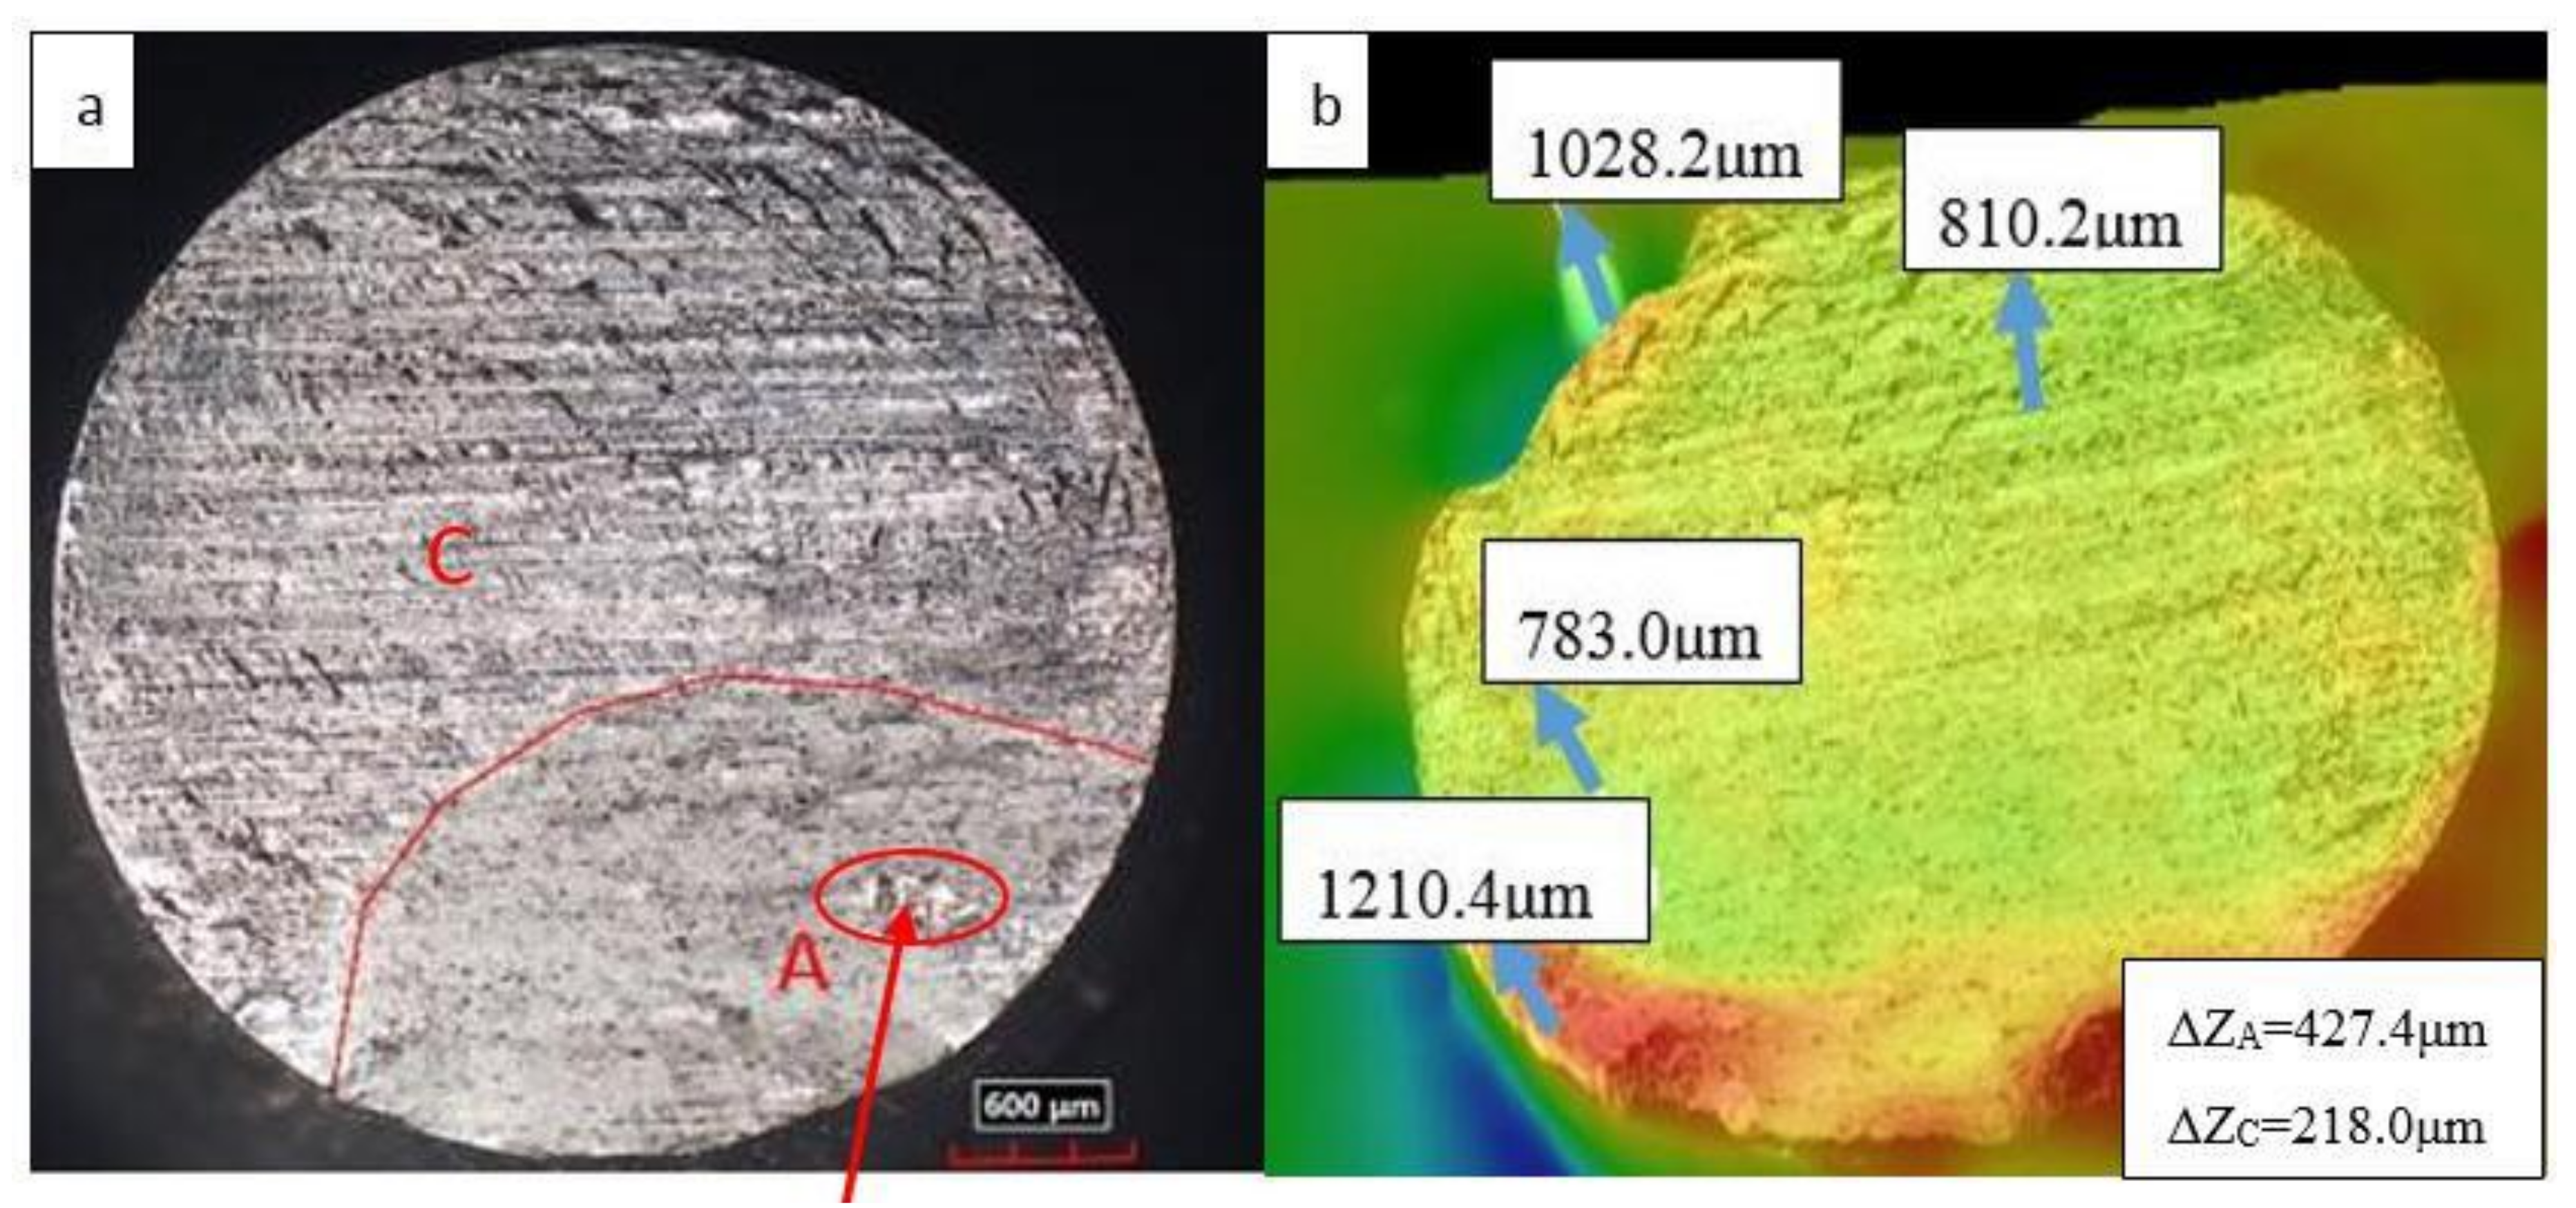
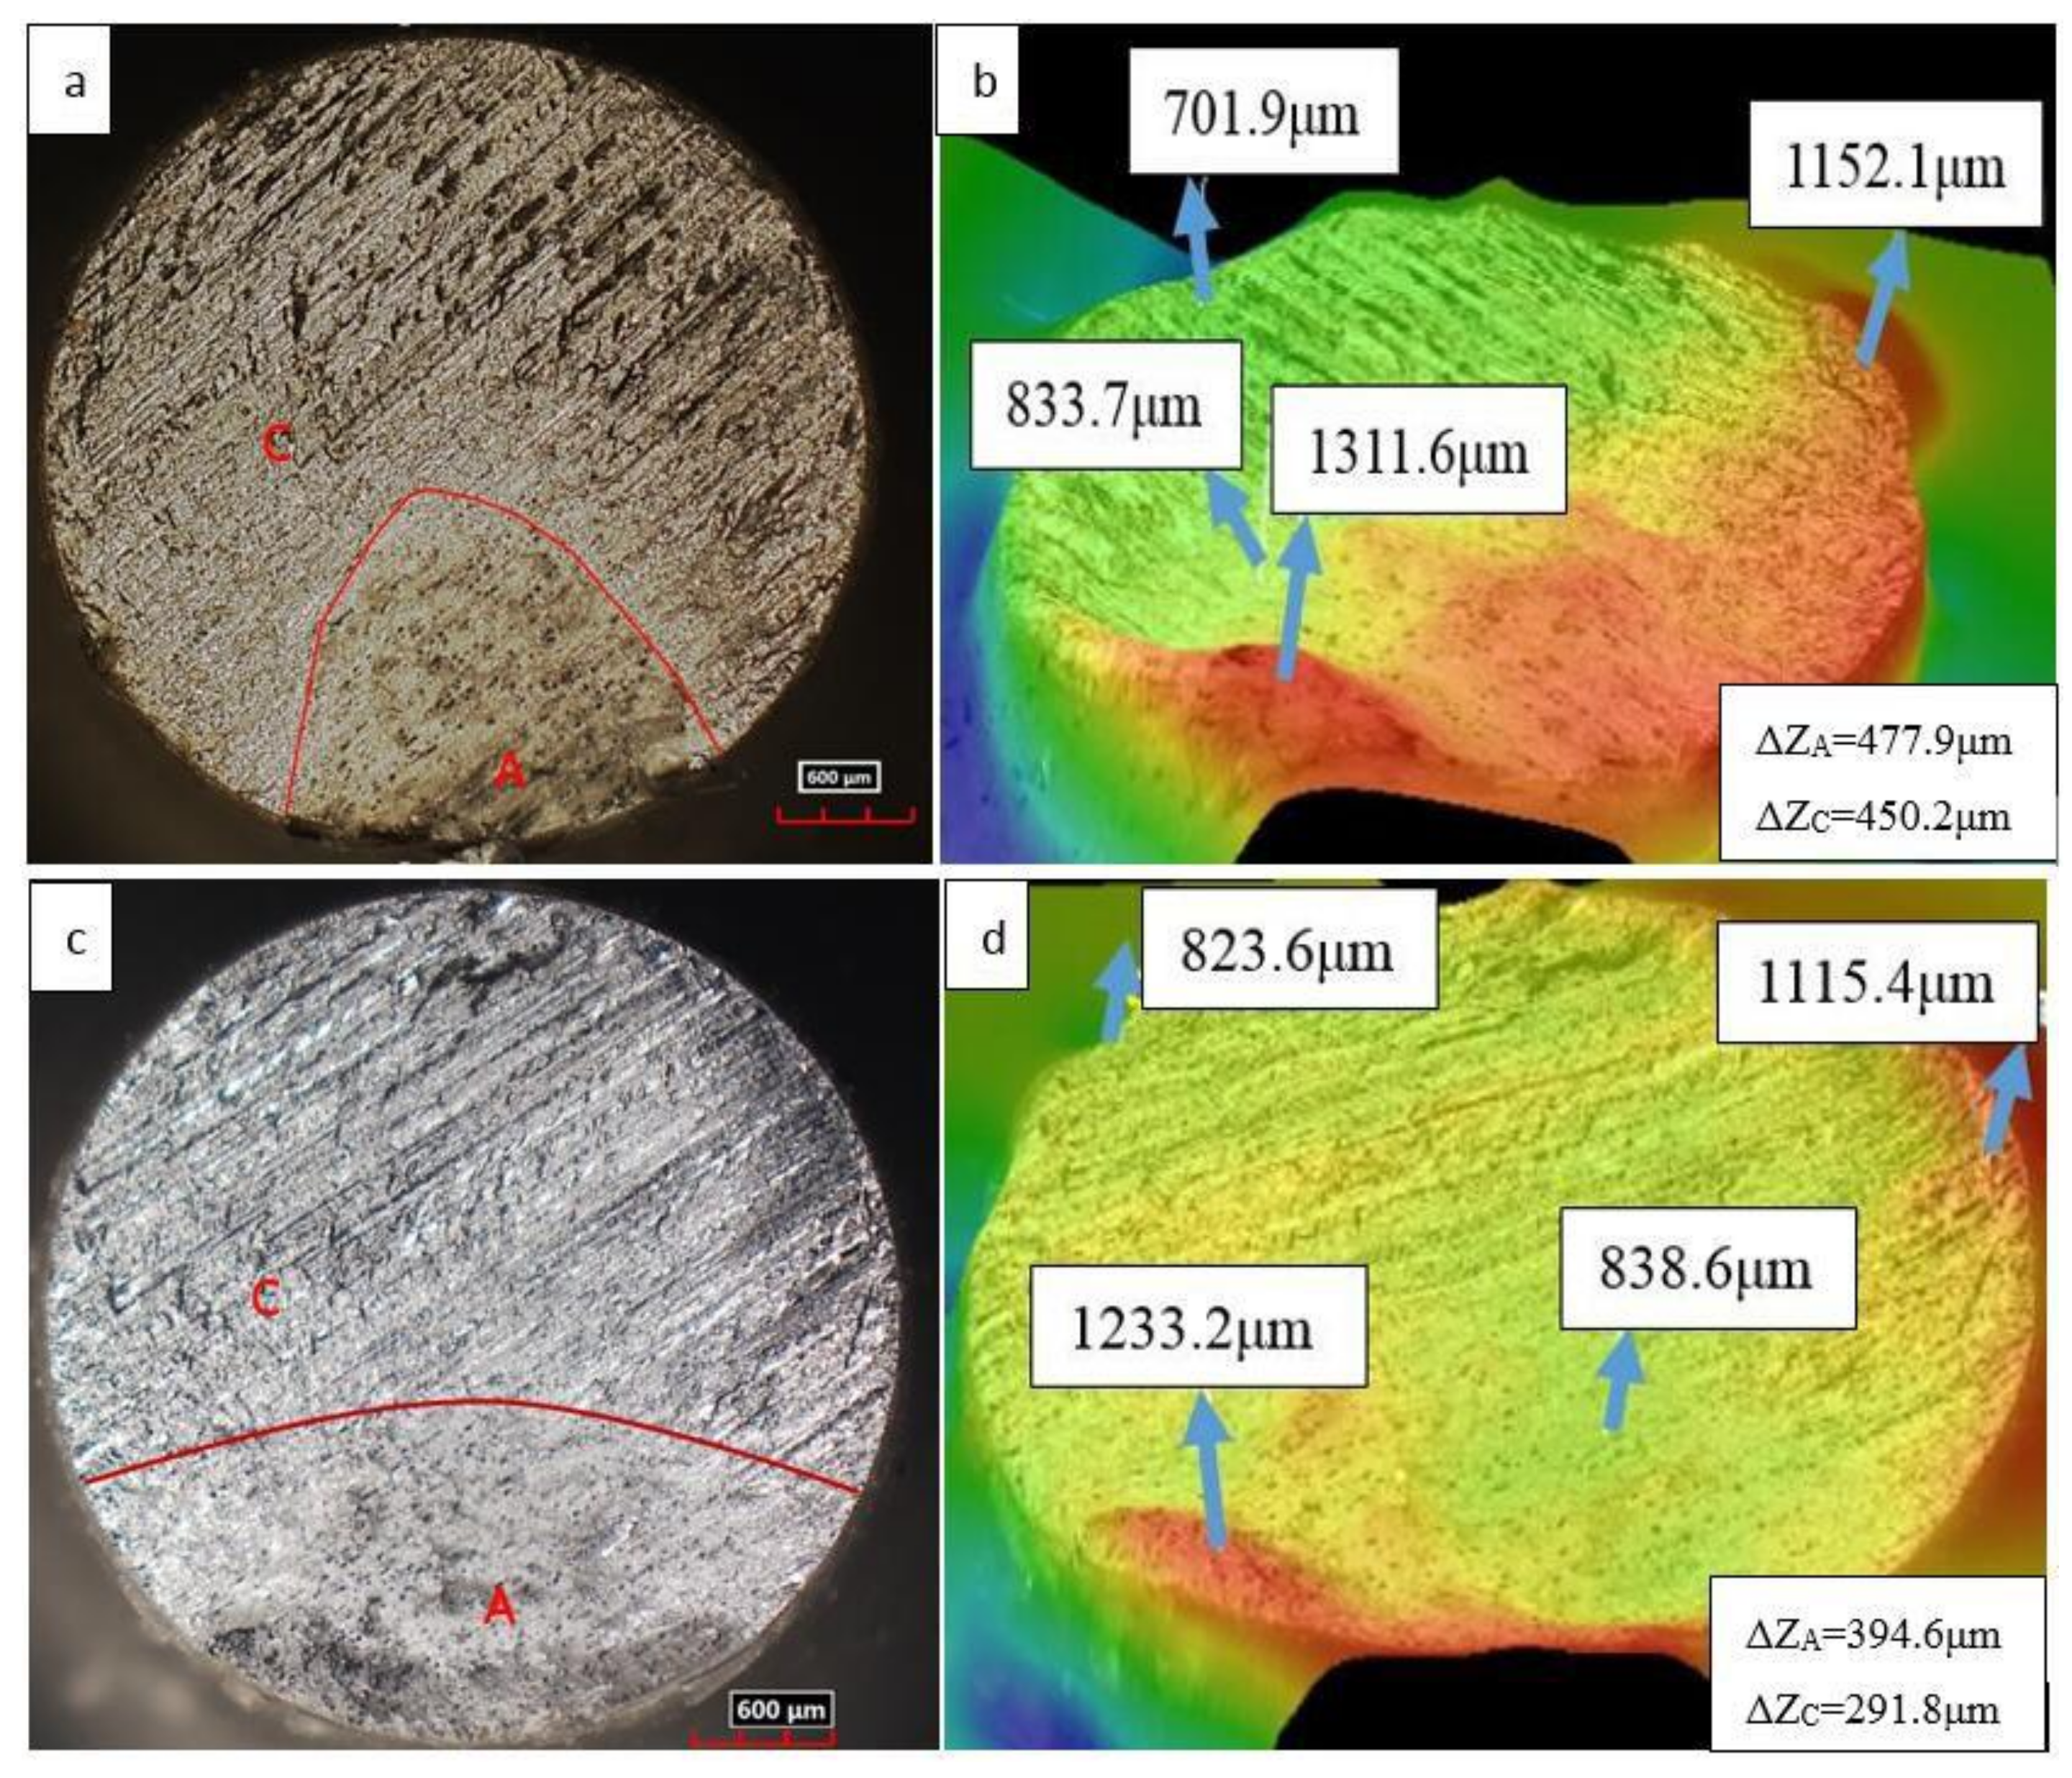
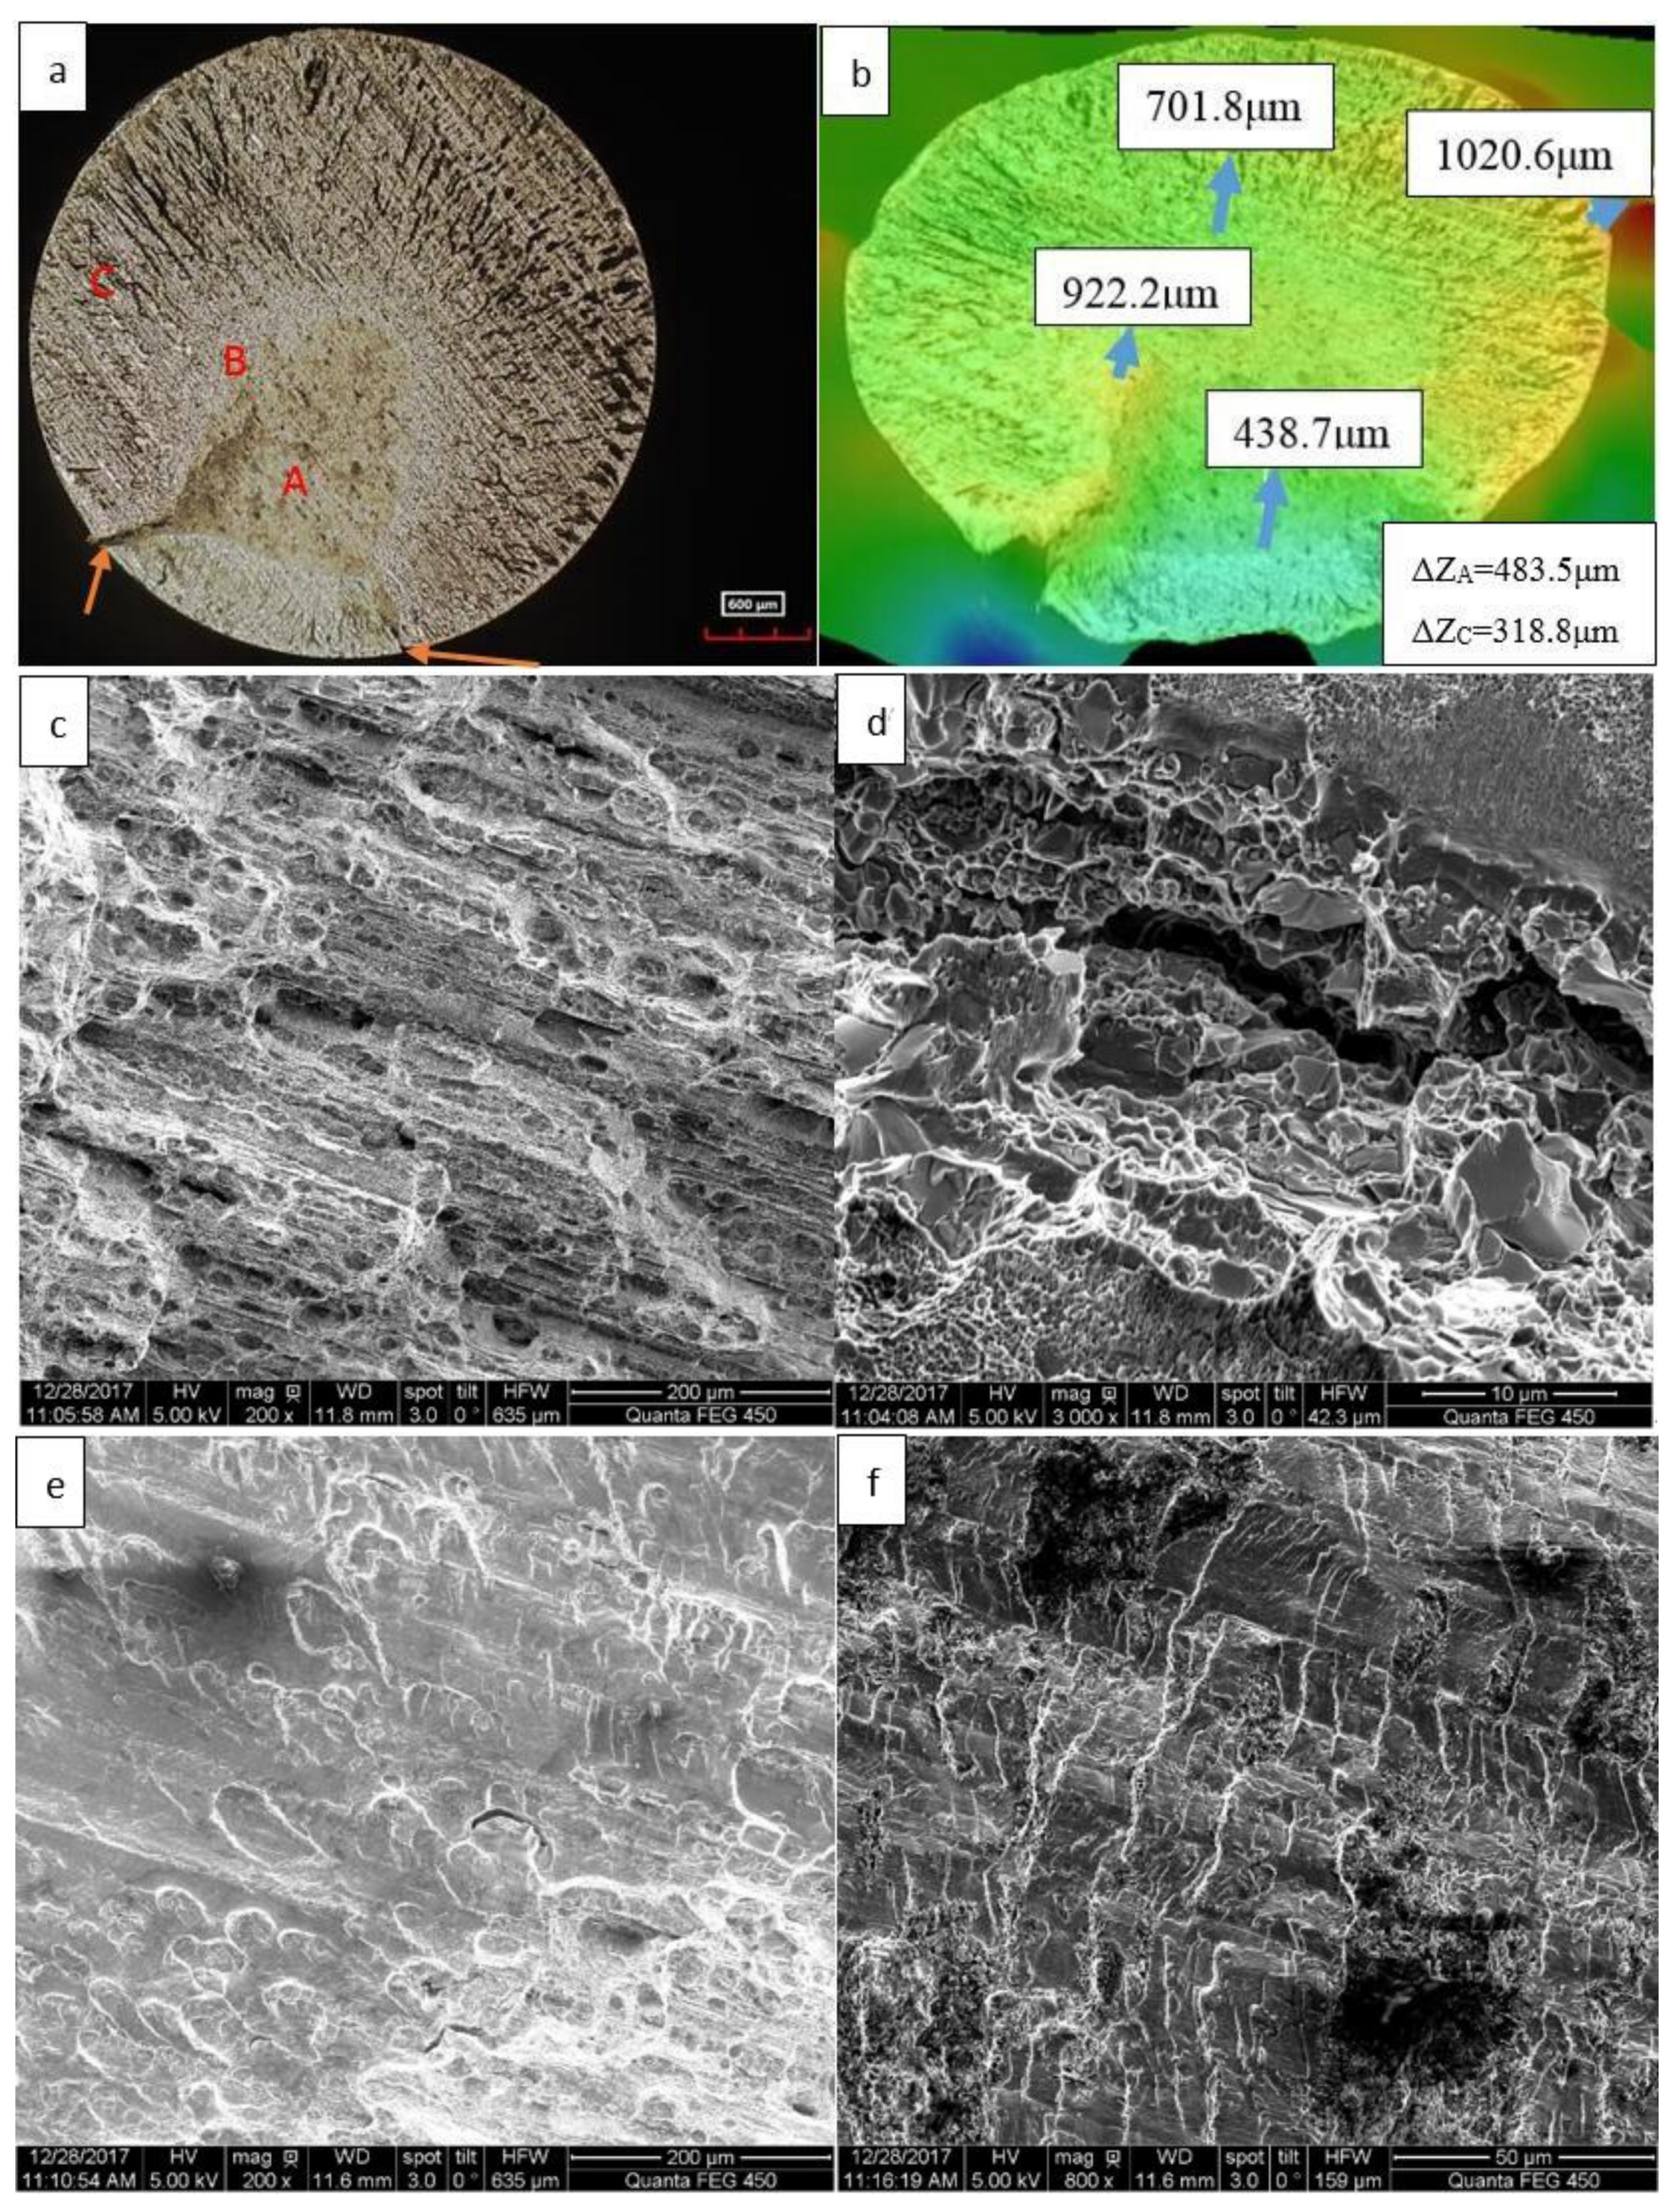
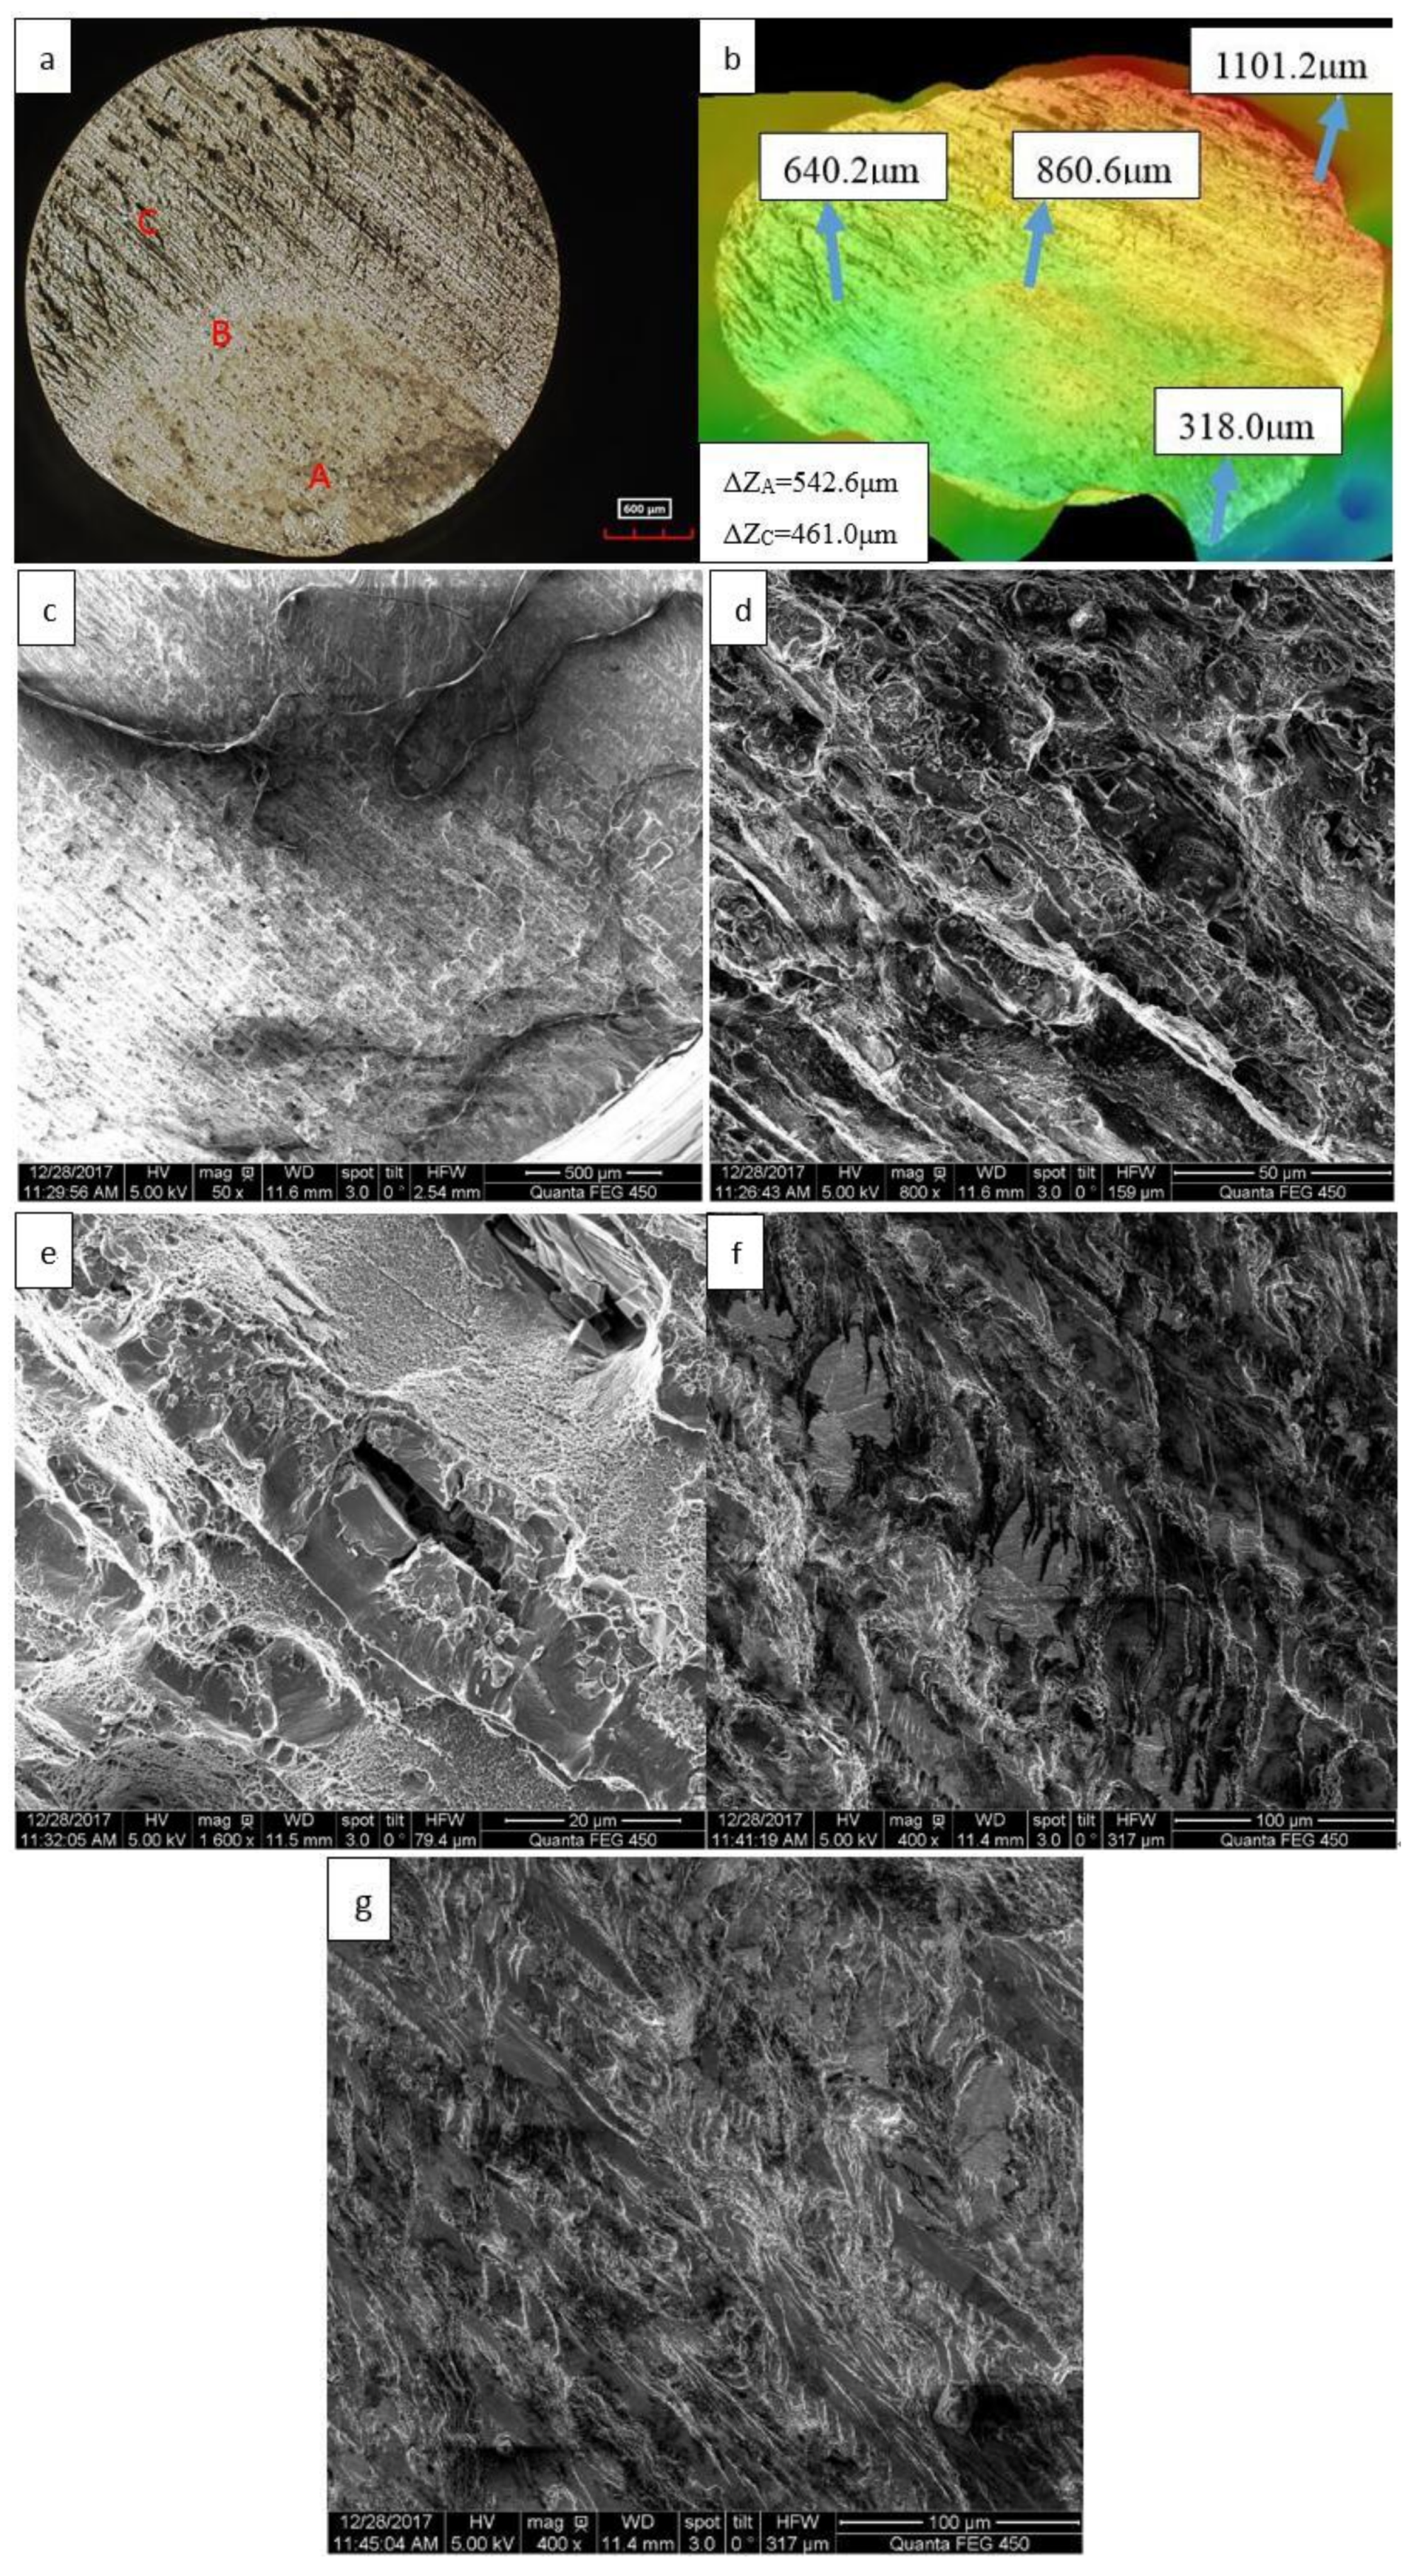
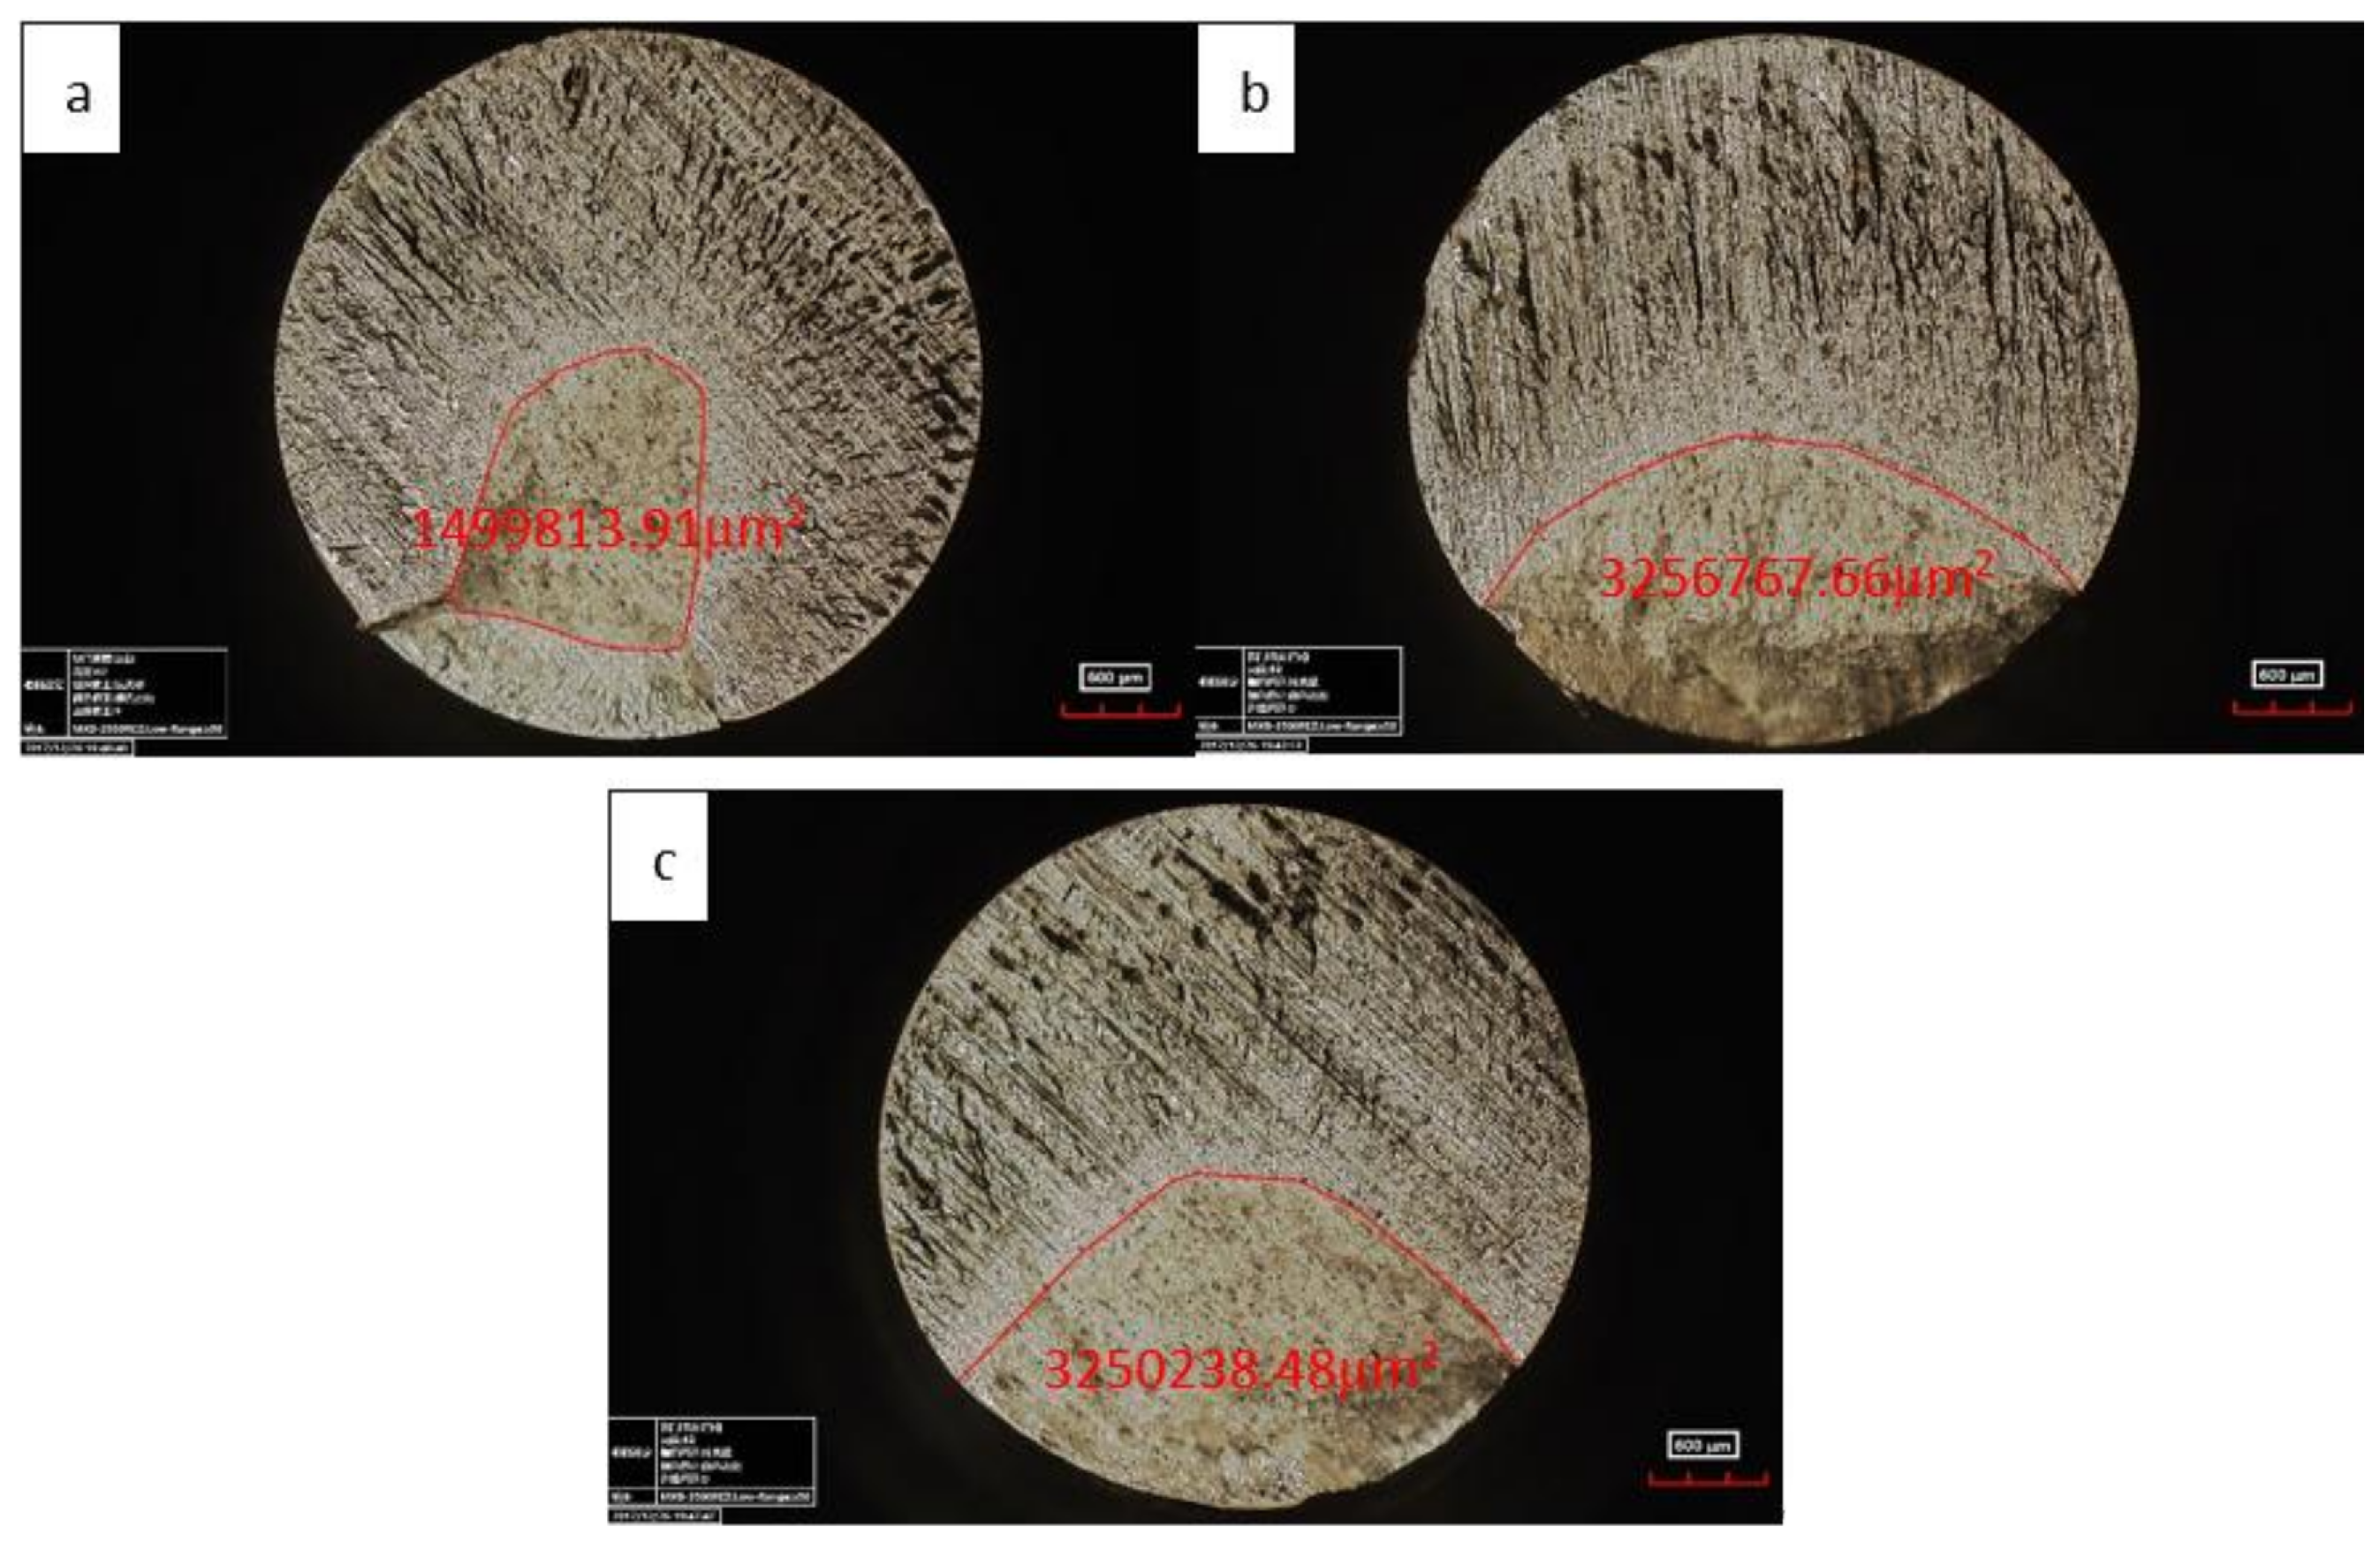
3.1. Fractography Analysis

Figure 2 shows the fatigue fracture characteristics of the uncoated sample (for the typical case: under 113.3 MPa, in air, Nf = 7.552 × 10⁵). Figure 2a shows the fatigue crack initiation and propagation region (A) and the instantaneous fracture region (C). These regions and micro damage characteristics were analyzed quantitatively by using a three-dimensional digital microscope. For example, the area of region A was obtained to be about 2,945,584.62 μm2. Therefore, the stress intensity factor ΔK—a key parameter describing fatigue fracture—can be estimated quantitatively by using Formula (4) [23]:
Δ K   =   0.65 σ 0 π a r e a   ( MPam · m 1 / 2 ) ,
where σ0 (MPa) is the stress amplitude at R = −1, and area represents the area of region A.
The three-dimension fractography and concave–convex characteristics of the fracture surface can also be obtained in Figure 2b, where the maximum height difference is 427.4 μm in region A and 218.0 μm in region C. It can be seen in Figure 2c that inclusions exist in region A, which have significant effects on the fatigue crack propagation area and pattern, and the formation of secondary cracks. The inclusion (the maximum geometry size is about 60 μm) exists in the fatigue fracture region but not in the instantaneous fracture region in most cases. Therefore, the inclusion can accelerate the fatigue damage of metals. As to the detailed effects of inclusions’ geometry and size on the fatigue crack initiation and propagation behavior, please refer to authors’ previous papers [24,25,26].
Figure 3 shows the fatigue fracture surface of coated (h = 10 μm) samples in air and 5.0% NaCl solution conditions, having the same tendency as Figure 2. According to the above estimated method of stress intensity factor, as shown in Equation (4), the stress intensity factors (ΔK) vary with the fatigue lives for uncoated samples in air (marked as I) and in 5.0% NaCl (marked as II), and coated (h = 10 µm) sample in air (marked as III) and in 5.0% NaCl (marked as IV) are shown in Figure 4 and Figure 5, respectively. Although there are some scatterings of data, they present a clear change trend that is a monotone decreasing rule, which is because the crack propagation rate is proportional to ΔK based on Paris formula [27]. Therefore, the greater ΔK is, the greater the crack propagation rate is, which achieves a shorter fatigue crack propagation life. Quantitative relations between ΔK and Nf in Figure 4 and Figure 5 are:
ΔKI = −1.94 × 10⁻⁵ NfI + 10.88,
ΔKII = −1.71 × 10⁻⁶ NfII + 5. 64,
ΔKIII = −5.28 × 10⁻⁵ NfIII + 16.99,
ΔKIV = −5.23 × 10⁻⁶ NfIV + 9.75.
To reduce the error, 3–5 samples were used for repeated tests under the same stress amplitude. These empirical formulas based on the experimental data contribute to understanding the fatigue damage rate under the different conditions, and they will play an important role in the safe use of the equipment and the prediction of the fatigue life.
The slopes of I, II, III, and IV are −1.94 × 10⁻⁵, −1.71 × 10⁻⁶, −5.28 × 10⁻⁵, and −5.23 × 10⁻⁶, respectively. The fatigue crack propagation rate decreases with increasing absolute value of slope, which achieves a longer fatigue crack propagation life. Because the slope (absolute value) of II is less than that of I, the fatigue crack propagation life of II is shorter than that of I. Therefore, the results indicate that corrosive media accelerate the fatigue crack propagation of uncoated 7075-T7351 Al alloy, which is consistent with previous work [5]. Similarly, because the slope (absolute value) of IV is less than that of III, the fatigue crack propagation life of IV is shorter than that of III. As a result, corrosive media accelerate the fatigue crack propagation of coated (h = 10 µm) 7075-T7351 Al alloy. In addition, the slope (absolute value) of III is greater than that of I, and the slope (absolute value) of IV is greater than that of II, which indicates the fatigue crack propagation rate of III and IV is less than that of I and II, respectively, so the fatigue crack propagation life of III and IV is longer than that of I and II, respectively. Therefore, the coated (h = 10 μm) sample possesses better mechanical and corrosion fatigue behavior than uncoated sample (i.e., the MAO coating significantly improves the mechanical and corrosion fatigue behavior of 7075-T7351 Al alloy), which agrees with the work by Wang et al. [5]. One of the reasons why the MAO coating improves the fatigue behavior is that the compressive residual stresses in the coating—as shown in Table 1—can restrain the crack initiation and propagation in the coating. In addition, the size relationships of these fatigue crack propagation lives analyzed above are consistent with the size relationships of their total lives [5], so their total lives mainly depend on their fatigue crack propagation lives.

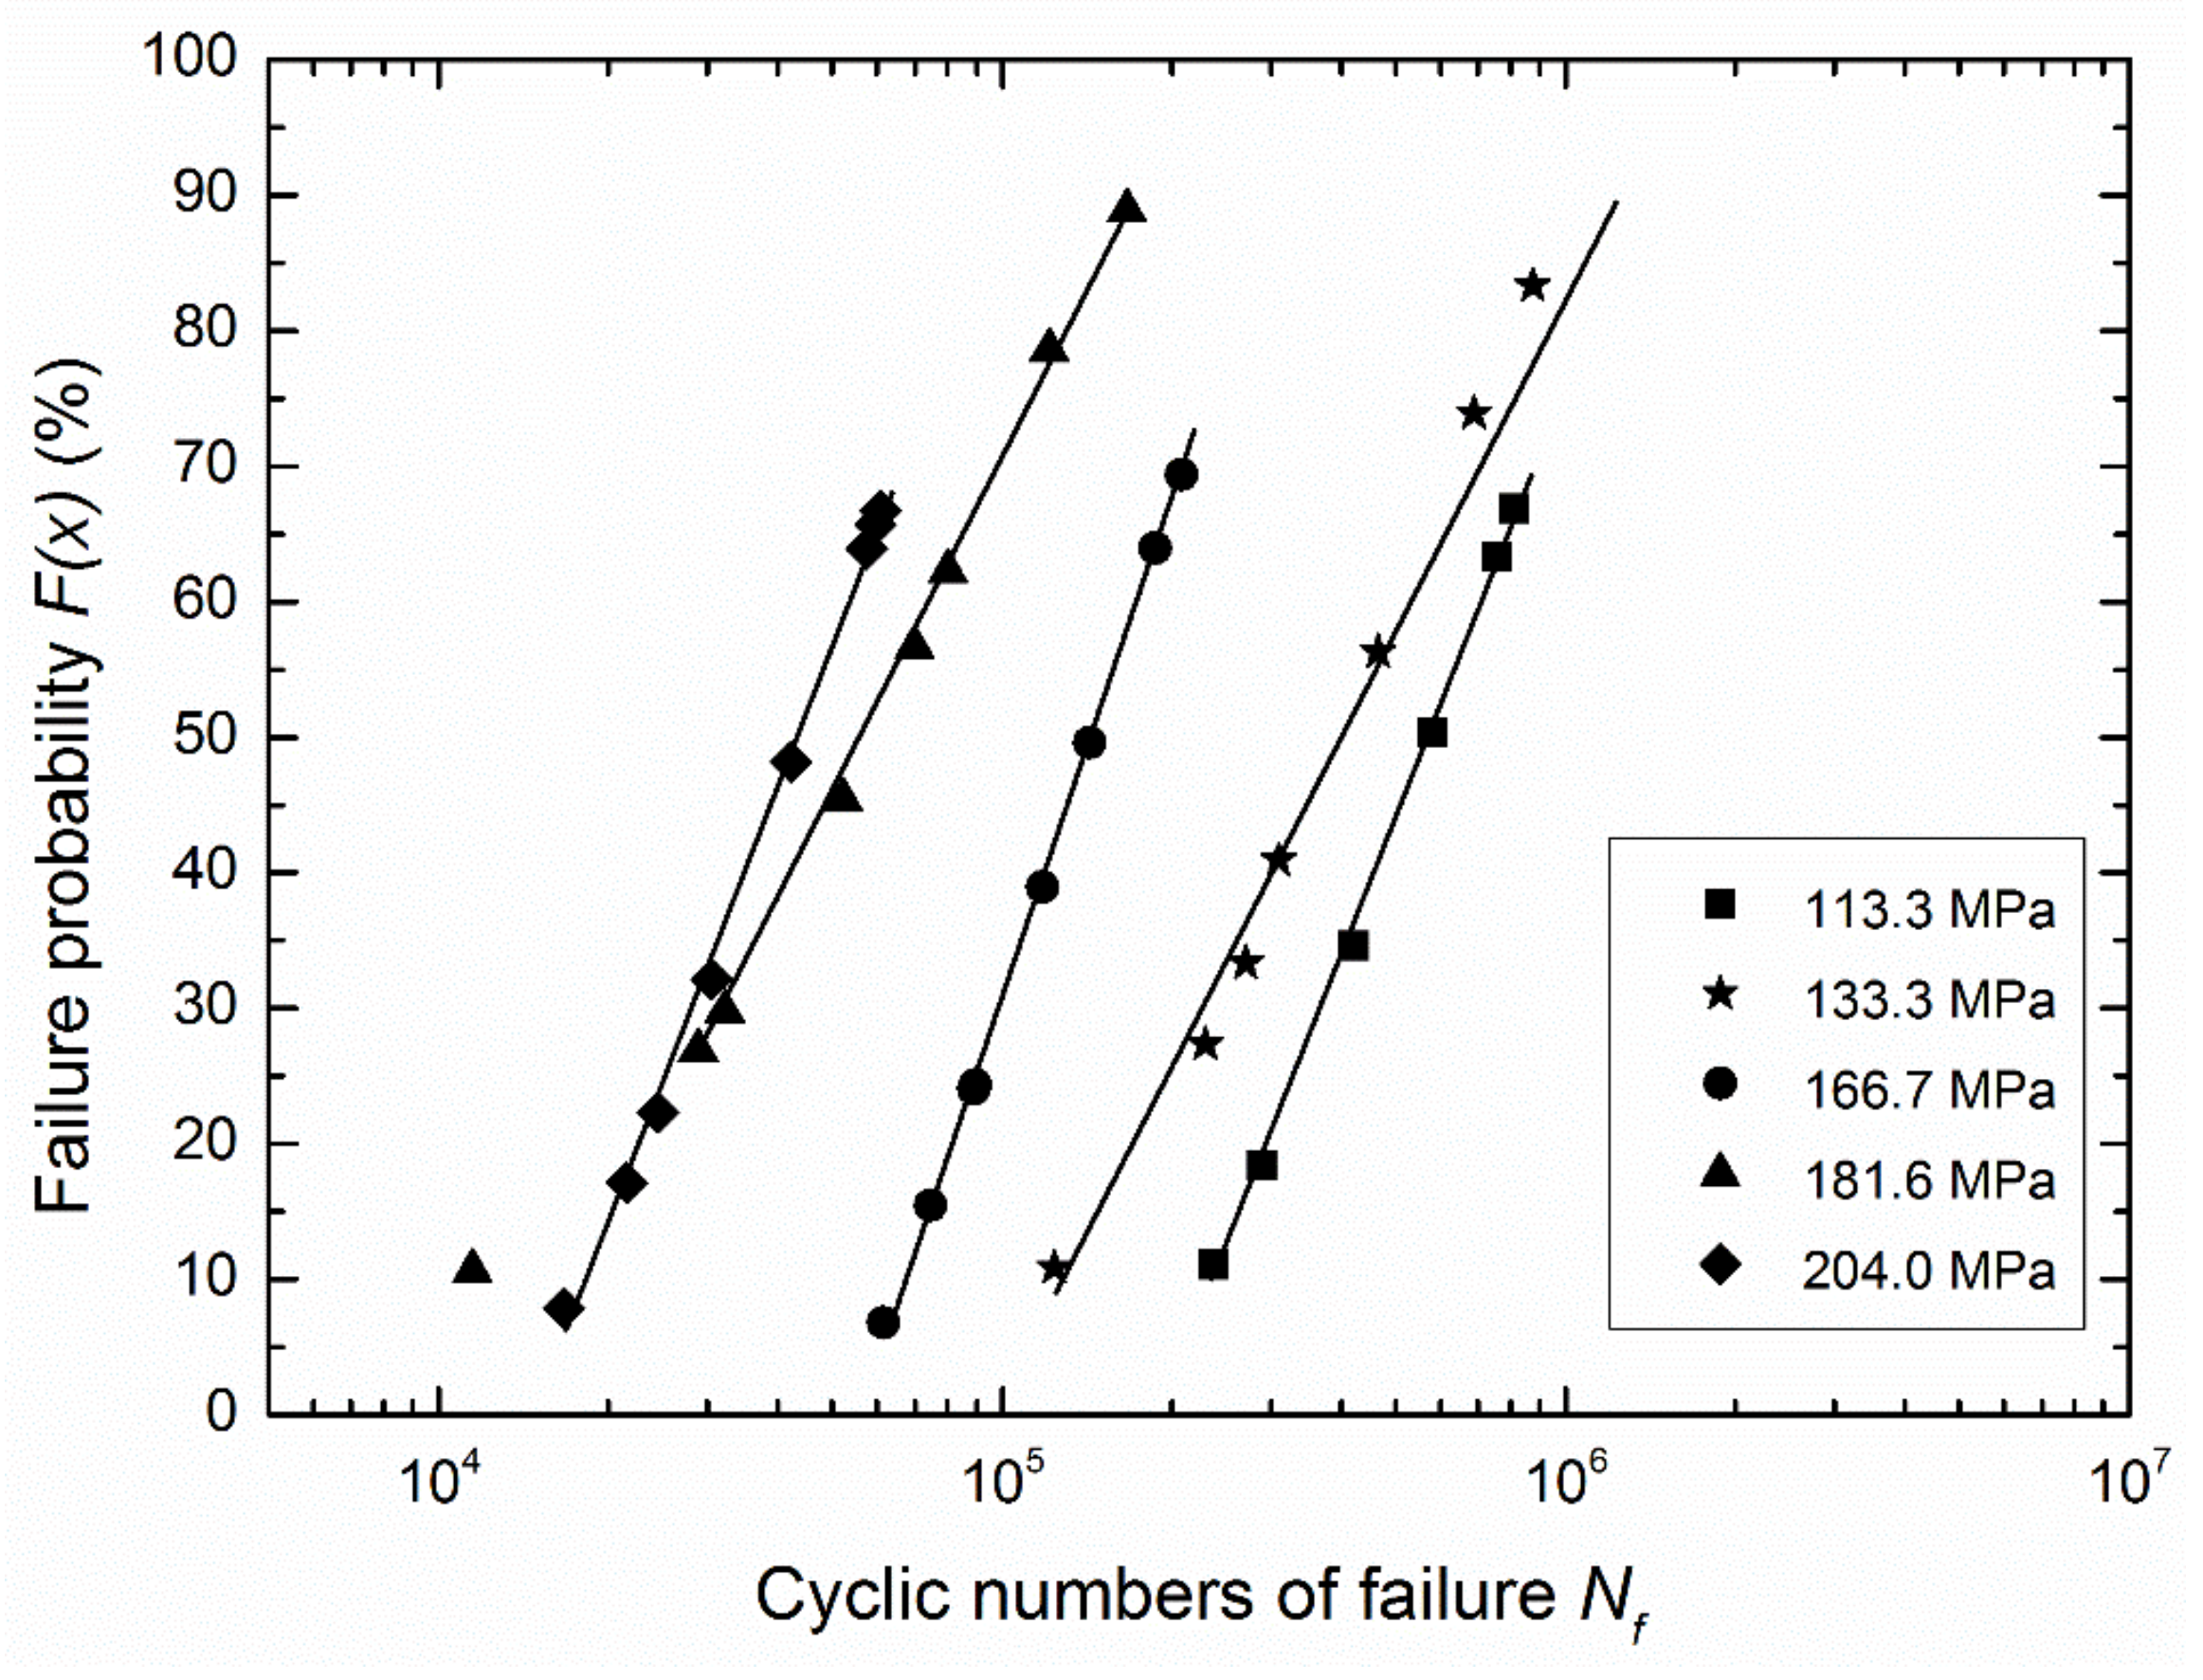
3.2. Scattering Analysis of Fatigue Data

The fatigue data under the same stress amplitude often have the scattering caused by the complex and uncertain factors, which can be analyzed by the observation of fatigue fracture surfaces. As an example, the differences of fatigue fracture surfaces having different fatigue lives at 113.3 MPa in air are shown in Figure 6, Figure 7 and Figure 8. In case of other stress amplitudes, the fatigue fracture characteristics are similar to those at 113.3 MPa.
Figure 6 shows the fatigue fracture characteristics of Nf = 3.52 × 10⁴, σ = 113.3 MPa in air for the uncoated sample. Similarly, the fracture surface can be divided into a fatigue crack initiation and propagation region (A) and a static fracture or instantaneous fracture region (C), as shown in Figure 6a. Region A is relatively rough and region C is relatively smooth, as shown in Figure 6b, which is different from the previous work [28] because the toughnesses of the materials used are different. Region B (shown in Figure 6a) is the closest interface region between region A and region C. The fatigue fracture morphology of region A presents many small and shallow dimples and ductile fracture characteristics, as shown in Figure 6c. These characteristics are mainly because of the high strength of 7075-T7351 (tensile strength σb = 528 MPa). In addition, there are two crack initiation sites (marked with arrows) in Figure 6a, which is different from samples in Figure 3. Due to the two crack initiation sites, the fatigue life is short (Nf = 3.52 × 10⁴). Figure 6d exhibits a fatigue propagation crack in region A. The open displacement of cracks is large, which indicates that the fracture toughness (KIC) is quite high, even though the fatigue strength of 7075-T7351 is low in air. As shown in Figure 6e, region B also presents some plastic dimples, which are shallower but larger than those at region A. At region C, however, the fracture characteristics change from dimples to vestiges with river pattern, as shown in Figure 6f.
Figure 7 and Figure 8 show the fracture characteristics of Nf = 4.210 × 10⁵ and Nf = 8.126 × 10⁵ under the same stress amplitude σ = 113.3 MPa in air, respectively. There are two different fatigue fracture characteristics: different numbers of fatigue crack initiation sites and different fatigue crack propagation directions or paths, which cause the differences in Nf with Figure 6. The different crack propagation directions from the surface to the inside cause slip sidesteps, as shown in Figure 7a and Figure 8a. Figure 7b and Figure 8b show the three-dimensional views and the maximum height differences of region A and region C. The maximum height difference of region A is greater than that of region C in the two fracture surfaces, which is the same with Figure 6b. However, the maximum height differences of region A and region C in the two fracture surfaces are both greater than those of Figure 6b, respectively. The fatigue multi-cracks and the plastic dimples are present in region A, as shown in Figure 7c and Figure 8c. In addition, vestiges with river pattern are also present in region C, as shown in Figure 7f and Figure 8g.
To further explore the reason for the differences in the fatigue lives under the same stress amplitude, the proportional relation between the fatigue crack propagation area and the static fracture area are illustrated in Figure 9. The crack propagation area fractions are 14.46% (Figure 9a), 30.10% (Figure 9b), and 31.20% (Figure 9c), respectively. Therefore, the fatigue life becomes longer with an increasing crack propagation area, which is consistent with previous work [28].

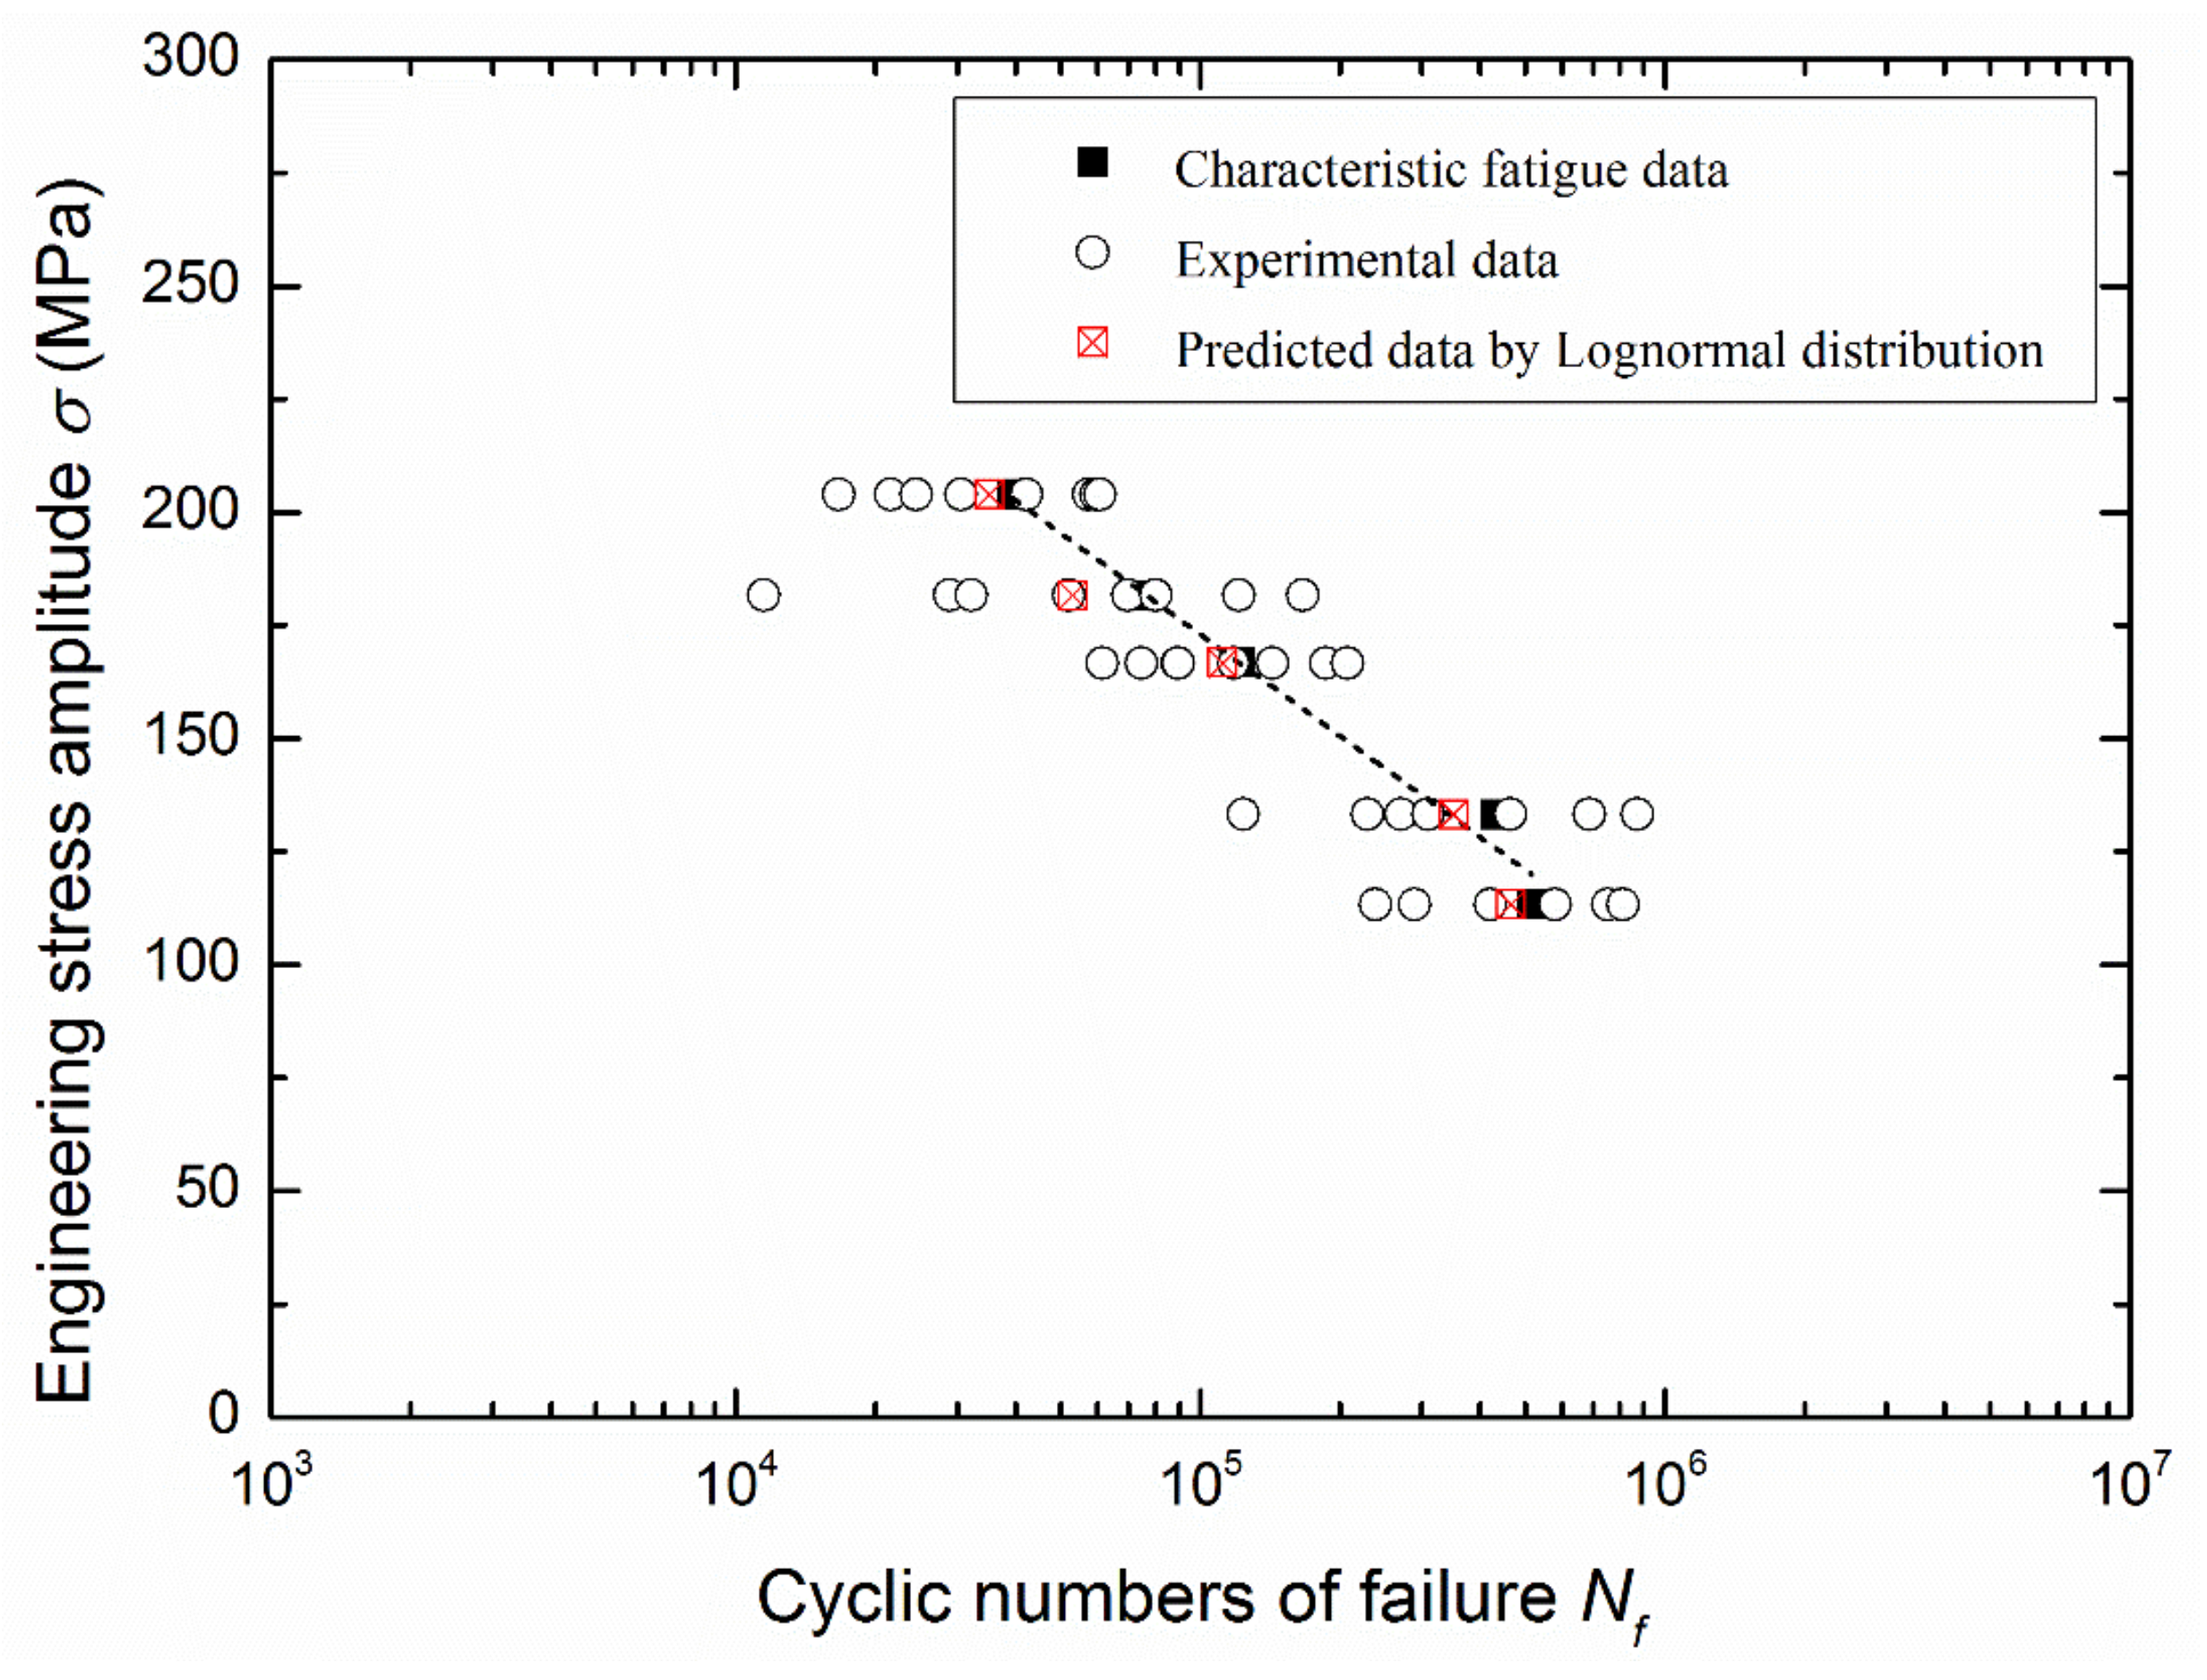
3.3. Fatigue Life Prediction and Reliability Analysis

At present, the Weibull distribution is the most effective statistical analysis tool to deal with the scattering fatigue data. Based on the statistical parameters in Table 3, can fatigue lives under other stress amplitudes be predicted? An important parameter in Table 3 is the shape parameter m, which reflects the type of failure mechanism and the scattering degree of fatigue data. As shown in Table 3, for different stress amplitudes in the same environment (air) (i.e., in the same S–N curve), there are approximately the same shape parameter (m). Therefore, characteristic lives ( b ^ ) under other stress amplitudes for a small sample (such as n = 3) can be estimated based on the parameter m which is calculated from a large sample (such as n = 8) under just 1–2 stress amplitudes, which can greatly decrease the number of test samples. The estimation method is as follows [28,29]:
b ^   =   ( 1 n i   =   1 n N f i m ) 1 / m ,
where n is the number of samples, Nfi is the cyclic numbers of failure in the ith fatigue test, and m is the shape parameter in the Weibull distribution function. Figure 10 shows the relationship between experimental data and characteristic lives under different stress amplitudes. According to Equation (6), the prediction of characteristic lives under different stress amplitudes is possible when the shape parameter m is known. In Figure 10, the characteristic fatigue data (labeled with ■) are well consistent with the experimental data (labeled with ○). Therefore, the estimation method of characteristic life is effective. Table 3 shows that the characteristic lives are slightly greater than the arithmetic mean lives. The smaller n is, the greater the difference between the characteristic life and the arithmetic mean life. Therefore, for a small sample, using the characteristic life of fatigue data is better than using the arithmetic mean life. In addition, the other prediction life based on Lognormal distribution is also shown in Table 3, when failure probability F(x) is 50% [30,31]. As shown in Figure 10, the prediction life by Lognormal distribution (labeled with ☒) is more conservative than the characteristic life and does not have good linear relation with the stress amplitude.
Figure 11 shows the relationship between the failure probability and the cyclic numbers under different stress amplitudes, which assists in the design of safe and reliable structures or materials. Additionally, the failure probability is proportional to cyclic numbers in the middle failure probability region (25% < F(x) < 70%). By the failure curves, the fatigue life of 7075-T7351 Al alloy can be precisely predicted with a reliability index for any stress amplitude. All slopes of lines in Figure 11 are very cliffy. This means that the fatigue life prediction of 7075-T7351 Al alloy by the 3-P Weibull distribution model is significant and effective.

4. Conclusions

By carrying out rotating bending fatigue tests, the fatigue fracture characteristics, reliability analysis, and characteristic life predictions for 7075-T7351 Al alloy were determined. The main conclusions are as follows:
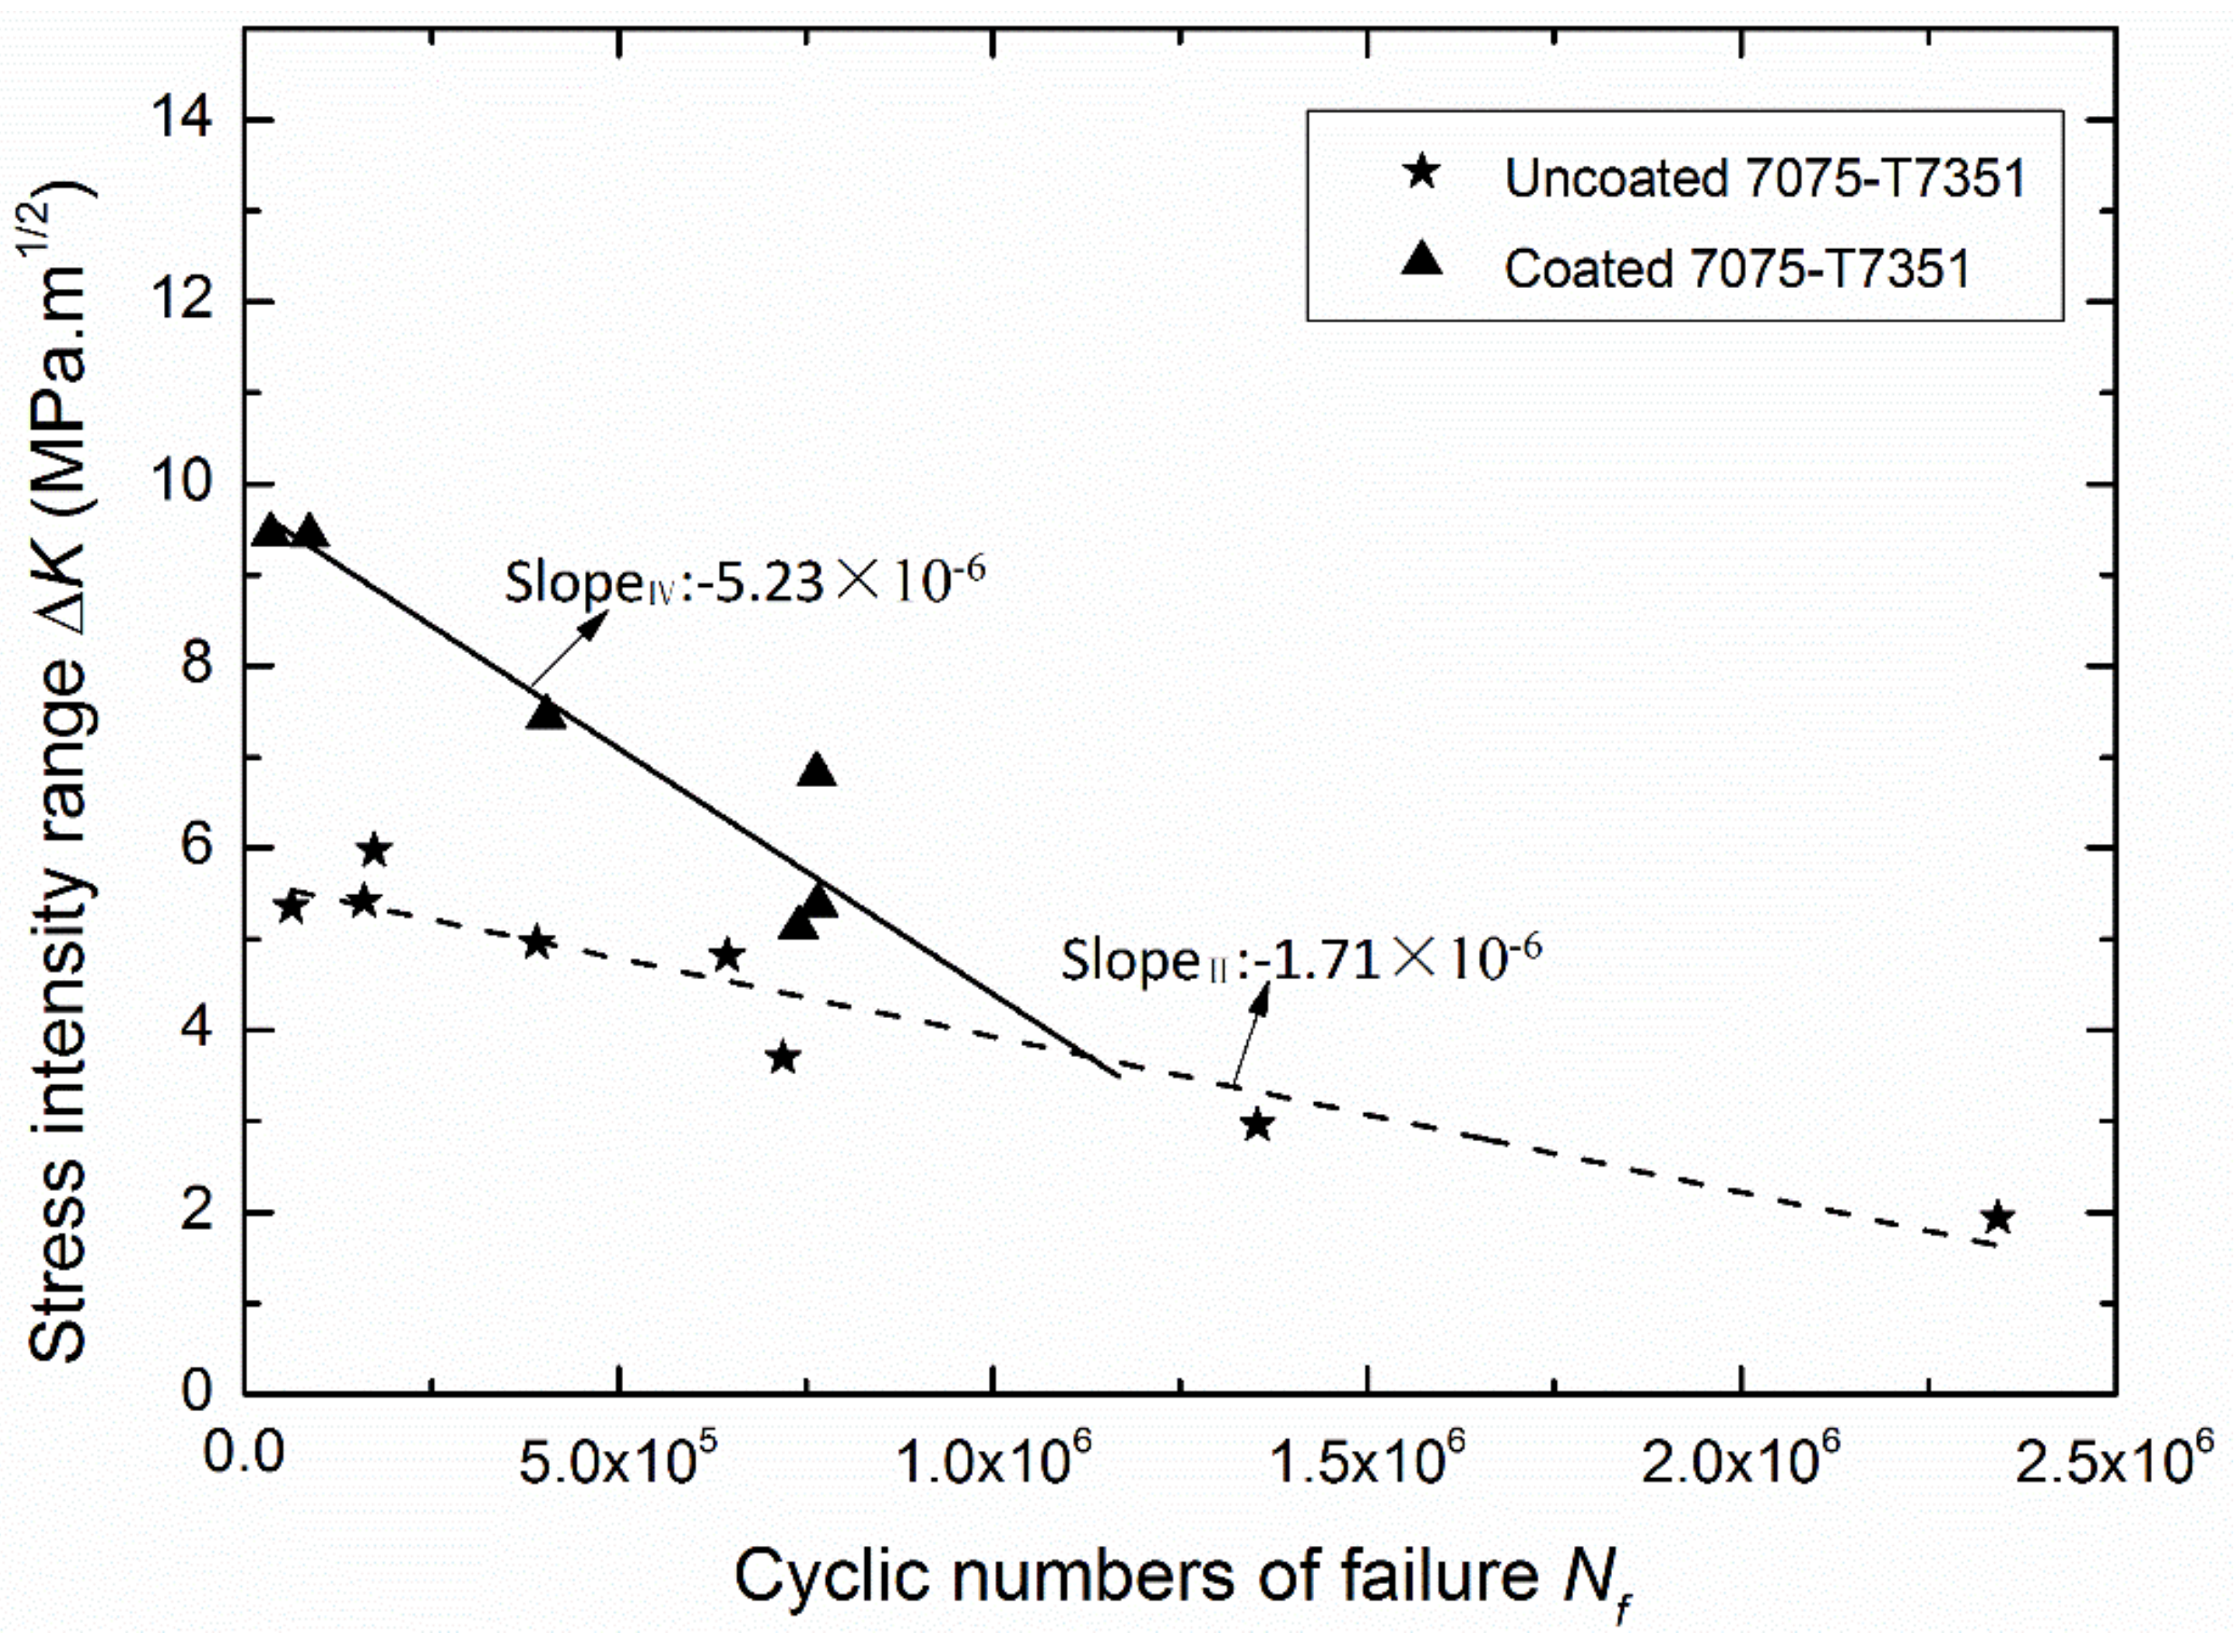
  • The relation between the stress intensity factor ΔK and the fatigue life Nf presents a monotone decreasing rule, and their empirical formula is obtained.
  • For the same stress amplitude, the scattering degree of the fatigue data is caused primarily by the number of fatigue crack initiation sites and the fatigue crack propagation area fraction.
  • The characteristic life under some stress amplitude for a small sample (such as n = 3) can be predicted effectively based on the parameter m calculated from the large sample (such as n = 8) under just 1–2 stress amplitudes, which can greatly decrease the number of test samples.

Acknowledgments

The present research is supported by the Natural Science Foundation of China (Nos. 11272173, 11572170).

Author Contributions

Huihui Yang finished the fatigue experiments and microstructure observation and wrote the paper. Xishu Wang conceived and revised the manuscript. Zhihao Zhang, Changhao Tan, Makoto Ito and Pan Pan checked the paper and participated in a part of experiments.

Conflicts of Interest

The authors declare no conflict of interest.

Abbreviation

bscale parameter in Weibull distribution function
b ^ predication value of characteristic life
clocation parameter in Weibull distribution function
d, Lthe geometry parameters of sample
F(x)Weibull distribution function
gthe acceleration of gravity (9.8 m/s2)
hcoating thickness
ΔKstress intensity factor (MPa·m1/2)
mshape parameter in Weibull distribution function
nexperimental number
Nfcyclic numbers of failure
αstress concentration factor (1.08)
σengineering stress amplitude (MPa)
Rstress ratio
Rasurface roughness

References

  1. Yerokhin, A.L.; Nie, X.; Leyland, A.; Matthews, A.; Dowey, S.J. Plasma electrolysis for surface engineering-Review. Surf. Coat. Technol. 1999, 122, 73–93. [Google Scholar] [CrossRef]
  2. Lonyuk, B.; Apachitei, I.; Duszcyk, J. The effect of oxide coatings on fatigue properties of 7475-T6 aluminium alloy. Surf. Coat. Technol. 2007, 201, 8688–8694. [Google Scholar] [CrossRef]
  3. Wang, X.S.; Guo, X.W.; Li, X.D.; Ge, D.Y. Improvement on the fatigue performance of 2024-T4 alloy by synergistic coating technology. Materials 2014, 7, 3533–3546. [Google Scholar] [CrossRef] [PubMed]
  4. Wang, X.S.; Li, X.D.; Yang, H.H.; Kawagoishi, N.; Pan, P. Environment-induced fatigue cracking behavior of aluminum alloys and modification methods. Corros. Rev. 2015, 33, 119–137. [Google Scholar] [CrossRef]
  5. Yang, H.H.; Wang, X.S.; Wang, Y.M.; Wang, Y.L.; Zhang, Z.H. Microarc oxidation coating combined with surface pore-sealing treatment enhances corrosion fatigue performance of 7075-t7351 al alloy in different media. Materials 2017, 10, 609. [Google Scholar] [CrossRef] [PubMed]
  6. Takahashi, H.; Kasahara, K.; Fujiwara, K.; Seo, M. The cathodic polarization of aluminum covered with anodic oxide-films in a neutral borate solution—I. The mechanism of rectification. Corros. Sci. 1994, 36, 677–688. [Google Scholar] [CrossRef]
  7. Wasekar, N.P.; Jyothirmayi, A.; Sundarajian, G. Influence of pre-corrosion on the high cycle fatigue behavior of microarc oxidation coated 6061-T6 aluminum alloy. Int. J. Fatigue 2011, 33, 1268–1276. [Google Scholar] [CrossRef]
  8. Ishihara, S.; Saka, S.; Nan, Z.Y.; Goshima, T.; Sunada, S. Prediction of corrosion fatigue lives of aluminum alloy on the basis of corrosion pit growth law. Fatigue Fract. Eng. Mater. Struct. 2006, 29, 472–480. [Google Scholar] [CrossRef]
  9. Li, X.D.; Wang, X.S.; Ren, H.H.; Chen, Y.L.; Mu, Z.T. Effect of prior corrosion state on the fatigue small cracking behavior of 6151-T6 aluminum alloy. Corros. Sci. 2012, 55, 26–33. [Google Scholar] [CrossRef]
  10. Wang, R. A fracture model of corrosion fatigue crack propagation of aluminum alloys based on the materials elements fracture ahead of a crack tip. Int. J. Fatigue 2008, 30, 1376–1386. [Google Scholar] [CrossRef]
  11. Yang, H.H.; Wang, Y.L.; Wang, X.S.; Pan, P.; Jia, D.W. Synergistic effect of environmental media and stress on the fatigue fracture behaviour of aluminium alloys. Fatigue Fract. Eng. Mater. Struct. 2016, 39, 1309–1316. [Google Scholar] [CrossRef]
  12. Yang, H.H.; Wang, Y.L.; Wang, X.S.; Pan, P.; Jia, D.W. The Effects of Corrosive Media on Fatigue Performance of Structural Aluminum Alloys. Metals 2016, 6, 160. [Google Scholar] [CrossRef]
  13. Na, K.H.; Pyun, S.I. Comparison of susceptibility to pitting corrosion of AA2024-T4, AA7075-T651 and AA7475-T761 aluminium alloys in neutral chloride solutions using electrochemical noise analysis. Corros. Sci. 2007, 50, 248–258. [Google Scholar] [CrossRef]
  14. Jones, K.; Hoeppner, D.W. Prior corrosion and fatigue of 2024-T3 aluminum alloy. Corros. Sci. 2006, 48, 3109–3122. [Google Scholar] [CrossRef]
  15. Wang, Q.Y.; Kawagoishi, N.; Chen, Q. Fatigue and fracture behaviour of structural Al alloys up to very long life regimes. Int. J. Fatigue 2006, 28, 1572–1576. [Google Scholar] [CrossRef]
  16. Weibull, W. A statistical distribution function of wide applicability. J. Appl. Mech. 1951, 18, 293–297. [Google Scholar]
  17. Wang, Y.M.; Lei, T.Q.; Jiang, B.L.; Guo, L.X. Growth, microstructure and mechanical properties of microarc oxidation coatings on titanium alloy in phosphate-containing solution. Appl. Surf. Sci. 2004, 233, 258–267. [Google Scholar] [CrossRef]
  18. Wang, Y.M.; Tian, H.; Shen, X.E.; Wen, L.; Ouyang, J.H.; Zhou, Y.; Jia, D.C.; Guo, L.X. An elevated temperature infrared emissivity ceramic coating formed on 2024 aluminium alloy by microarc oxidation. Ceram. Int. 2013, 39, 2869–2875. [Google Scholar] [CrossRef]
  19. Qian, G.A.; Zhou, C.F.; Hong, Y.S. A model to predict S-N curves for surface and subsurface crack initiation in different environmental media. Int. J. Fatigue 2015, 71, 35–44. [Google Scholar] [CrossRef]
  20. ASTM. Standard Practice for Presentation of Constant Amplitude Fatigue Test Results for Metallic Materials Annual Book of ASTM Standards USA; ASTM: West Conshohocken, PA, USA, 2004; ASTM E468-90. [Google Scholar]
  21. Mohammad, M.; Abdullah, S.; Jamaludin, N.; Innayatullah, O. Predicting the fatigue life of the SAE 1045 steel using an empirical Weibull-based model associated to acoustic emission parameters. Mater. Des. 2014, 54, 1039–1048. [Google Scholar] [CrossRef]
  22. Zheng, R.Y.; Yan, J.S. New estimation method of three-parameter Weibull distribution. J. Mech. Strength 2002, 24, 599–601. [Google Scholar]
  23. Murakami, Y.; Endo, M. Effects of defects, inclusions and inhomogeneities on fatigue strength. Int. J. Fatigue 1994, 16, 163–182. [Google Scholar] [CrossRef]
  24. Wang, X.S.; Li, Y.Q. Characterization of the fatigue surface microcrack growth in vicinal inclusion for powder metallurgy alloys. Acta Mech. Solida Sin. 2003, 16, 327–333. [Google Scholar]
  25. Wang, X.S.; Liang, F.; Zeng, Y.P.; Xie, X.S. SEM in-situ observations to investigate the effects of inclusions on the low cyclic fatigue crack initiation and propagation of super strength steel. Acta Metall. Sin. 2005, 41, 1272–1276. [Google Scholar]
  26. Wang, X.S.; Zhang, L.; Xie, X.S. An experimental investigation of the fatigue microcrack initiation and growth in surface inclusion for P/M Rene95 alloy. Int. J. Miner. Metall. Mater. 2006, 13, 244–249. [Google Scholar]
  27. Paris, P.C.; Erdogan, F. A critical analysis of crack propagation laws. J. Basic Microbiol. 1963, 85, 528–533. [Google Scholar] [CrossRef]
  28. Wang, Y.L.; Wang, X.S.; Wu, S.C.; Yang, H.H.; Zhang, Z.H. High-Cycle Microscopic Severe Corrosion Fatigue Behavior and Life Prediction of 25CrMo Steel Used in Railway Axles. Metals 2017, 7, 134. [Google Scholar] [CrossRef]
  29. Goranson, U.G. Elements of structural integrity assurance. Int. J. Fatigue 1994, 16, 43–65. [Google Scholar] [CrossRef]
  30. Tiryakioğlu, M. On the Relationship between Statistical Distributions of Defect Size and Fatigue Life in 7050-T7451 Thick Plate and A356-T6 Castings. Mater. Sci. Eng. A 2009, 520, 114–120. [Google Scholar] [CrossRef]
  31. Gao, Z.T. Statistics in Fatigue Application; National Defense Industry Press: Beijing, China, 1986; pp. 57–72. [Google Scholar]
Figure 1. Sketch of the samples indicating shape and size (unit: mm).
Metals 08 00210 g001
Figure 2. Fatigue fracture surface of Nf = 7.552 × 10⁵, σ = 113.3 MPa in air for the uncoated sample. (a) Macro-scale view of the fracture surface; (b) Three-dimensional view of the fracture surface; (c) Enlarged view of ellipse in (a).
Metals 08 00210 g002aMetals 08 00210 g002b
Figure 3. Fatigue fracture surface for the coated (h = 10 μm) sample. (a) Macro-scale view of Nf = 1.835 × 10⁵, σ = 147.0 MPa in air; (b) Three-dimensional view of Nf = 1.835 × 10⁵, σ = 147.0 MPa in air; (c) Macro-scale view of Nf = 7.661 × 10⁵, σ = 113.3 MPa in 5.0% NaCl; (d) Three-dimensional view of Nf = 7.661 × 10⁵, σ = 113.3 MPa in 5.0% NaCl.
Metals 08 00210 g003
Figure 4. Relationship between ΔK and cyclic numbers of failure in air for uncoated and coated 7075-T7351 Al alloy.
Metals 08 00210 g004
Figure 5. Relationship between ΔK and cyclic numbers of failure in 5.0% NaCl for uncoated and coated 7075-T7351 Al alloy.
Metals 08 00210 g005
Figure 6. Fatigue fracture surface of Nf = 3.52 × 10⁴, σ = 113.3 MPa in air for the uncoated sample. (a) Macro-scale view of the fracture surface; (b) Three-dimensional view of the fracture surface; (c,d) region labeled A; (e) region labeled B; (f) region labeled C.
Metals 08 00210 g006
Figure 7. Fatigue fracture surface of Nf = 4.210 × 10⁵, σ = 113.3 MPa in air for the uncoated sample. (a) Macro-scale view of the fracture surface; (b) Three-dimensional view of the fracture surface; (c,d) region labeled A; (e) region labeled B; (f) region labeled C.
Metals 08 00210 g007
Figure 8. Fatigue fracture surface of Nf = 8.126 × 10⁵, σ = 113.3 MPa in air for the uncoated sample. (a) Macro-scale view of the fracture surface; (b) Three-dimensional view of the fracture surface; (ce) region labeled A; (f) region labeled B; (g) region labeled C.
Metals 08 00210 g008
Figure 9. Fatigue fracture surfaces of 7075-T7351 Al alloy under the same stress amplitude 113.3 MPa. (a) Nf = 3.52 × 10⁴; (b) Nf = 4.210 × 10⁵; (c) Nf = 8.126 × 10⁵.
Metals 08 00210 g009
Figure 10. Experimental data and predicted data of fatigue lives for 7075-T7351 Al alloy under different stress amplitudes in air.
Metals 08 00210 g010
Figure 11. Failure probability varies with cyclic numbers of failure for 7075-T7351 Al alloy under different stress amplitudes in air.
Metals 08 00210 g011
Table 1. Mechanical properties of samples (E: Young′s modulus, HRB: Rockwell hardness)
MaterialE (GPa)µHRBResidual Stress (MPa)σ0.2 (MPa)σb (MPa)δ (%)
Uncoated 7075-T735170.50.3094.9046552814.6
Coated (h = 10 μm) 7075-T73512530.2488.7−198 (±11)
Table 2. Fatigue lives for 7075-T7351 Al alloy under different stress amplitudes in air.
Testing StressNo. 1No. 2No. 3No. 4No. 5No. 6No. 7No. 8
×105×105×105×105×105×105×105×105
113.3 MPa0.051 (deleted)2.3812.8974.2105.8087.5528.126189.429 (deleted)
133.3 MPa0.043 (deleted)1.2392.2942.7103.1004.6566.8858.749
166.7 MPa0.6160.7480.8910.8961.1801.4321.8692.081
181.6 MPa0.1150.2890.3220.5220.6990.8021.2121.667
204.0 MPa0.1670.2160.2450.3050.4220.5750.5960.609
Table 3. Statistical parameters of fatigue lives under different stress amplitudes in air.
Testing Stressmb (×105)Characteristic Life b ^ (×105)Arithmetic Mean Life (×105)Prediction Life by Lognormal Distribution (F(x) = 50%) (×105)
113.3 MPa1.035.8795.1775.1624.668
133.3 MPa1.124.8814.3194.2333.520
166.7 MPa1.021.3251.2161.2141.117
181.6 MPa1.110.8200.7220.7040.531
204.0 MPa1.050.4400.3940.3920.352

