Article

Influence of the Velocity and the Number of Polishing Passages on the Roughness of Electrolytic Plasma Polished Pipe Inner Surfaces

Fluid Technology and Microfluidics, University of Rostock, Justus-von-Liebig-Weg 6, 18059 Rostock, Germany
*
Author to whom correspondence should be addressed.
Metals 2018, 8(5), 330; https://doi.org/10.3390/met8050330
Submission received: 22 March 2018 / Revised: 3 May 2018 / Accepted: 4 May 2018 / Published: 8 May 2018

Abstract

:
Electrolytic plasma polishing (EPP) is an emerging technology for polishing, cleaning, deburring and smoothing of free-formed metal surfaces. The electrolytic plasma polishing of outer metal surfaces is state-of-the-art, whereas the polishing of pipe inner surfaces has only recently been reported by the authors. A prototype system and first experimental results were presented. It was found in the previous study that the average surface roughness Sa reaches a range from 0.065 µm to 0.090 µm. The current study systematically investigates the influence of the velocity v as well as the number n of polishing passages on the average surface roughness Sa . The polishing of the pipe inner surface and weld seam are considered separately. The results show that the average roughness Sa is mainly dependent on the effective polishing time t e p t of the polishing process. The average surface roughness Sa of the pipe inner surface can reach a range from 0.030 µm to 0.034 µm starting from an initial surface roughness S a 0 of 0.719 µm, whereas the average surface roughness Sa of the weld seam can reach a range from 0.088 µm to 0.096 µm starting from an initial surface roughness Sa 0 of 0.282 µm. These ranges are achieved after an effective polishing time of approximately 25 s for both the inner pipe surface and the weld seam.

1. Introduction

Surface cleaning, deburring, polishing and smoothing of different metallic parts are important steps in many manufacturing processes. Therefore, the need for techniques that improve the surface quality of metal workpieces is becoming increasingly important in many industrial and medical applications. Current polishing methods include computer-controlled mechanical polishing [1,2], optical polishing [3,4,5], ultrasonic polishing [6,7] and electro-chemical polishing [8,9]. Electrolytic plasma polishing is a relatively new process for polishing exterior metal free-form surfaces. Previous papers on plasma polishing deal with process development [10,11,12,13,14], polishing of various materials like copper, titanium alloys and different grades of stainless steel [15,16,17,18] as well as application studies [19,20,21]. The plasma polishing process was recently transferred to a medium-carrying pipe inner surface using a newly developed prototype system and first experimental results were previously presented by the authors [22]. When considering the plasma polishing of pipe inner surface, the following fundamental process parameters can be identified: the type and the properties of the electrolyte (electrical conductivity, pH value, temperature), the parameters of the technical setup (dimensions of the polishing head and the workpiece) and the operating parameters (applied voltage, current, velocity and number of polishing passages). It could be shown in the previous study that a stable process is accompanied by increasing the potential difference U and that the average surface roughness Sa can reach a range from 0.065 µm to 0.090 µm. Furthermore, initial results on the influence of the velocity v of the polishing passages on the average surface roughness Sa indicate that lower velocities lead to lower average roughnesses. The current study systematically investigates the influence of the velocity v and the number n of polishing passes on the average surface roughness Sa . The study is based on the hypothesis that, although both factors have influence on the average surface roughness, the crucial factor is the effective polishing time t e p t , which is calculated by the following equation:
t e p t = n · h g a p v ,
where v is the velocity, n the number of plasma polishing passages and h g a p the width of the polishing head gap that determines the actual polishing area inside the tube. Due to the fact that welded stainless steel pipes were investigated in the study, the pipe inner surface and weld seam were considered separately.

2. Materials and Methods

The following section describes the sample material and preparation, the parameters of the electrolytic plasma polishing process, the experimental procedure as well as the analytical method for determining the average surface roughness Sa of the pipe inner surface and the weld seam.

2.1. Sample Material and Preparation

For the experiments, 0.5 m long welded austenitic stainless steel pipes (1.4404, weldtron) with an outer diameter of 42.3 mm and a wall thickness of 2 mm from the company Dockweiler GmbH (Neustadt-Glewe, Germany) were used. The welded pipes were produced from a metal strip by tungsten inert gas (TIG) welding without filler material using argon shielding gas. The straight weld bead is removed by the manufacturer during a subsequent pilgering process. The resulting weld seam has a width of approximately 4 mm.

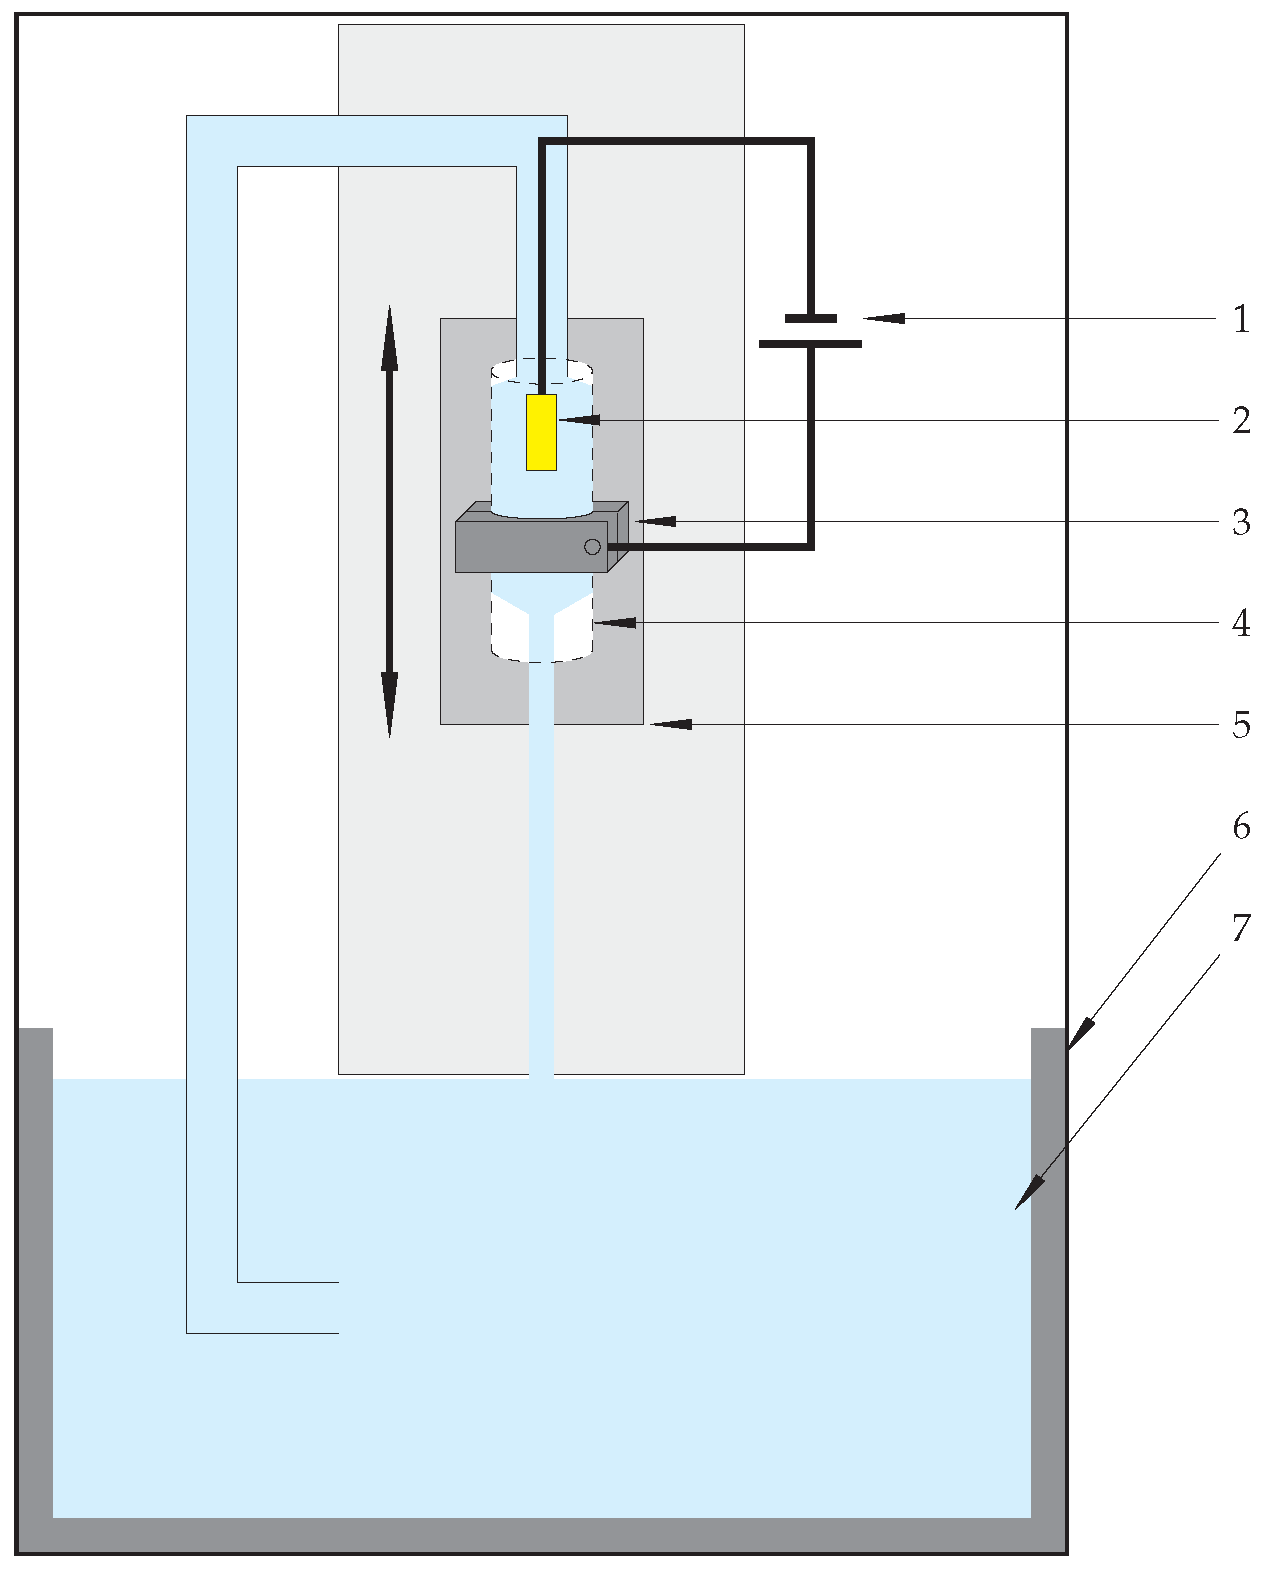
2.2. Parameters of Electrolytic Plasma Polishing/Experimental Procedure

The used plasma polishing system has already been described in detail [22] and the schematic design of the system can be seen in Figure 1.
Figure 2 depicts the schematic design of the used polishing head. When polishing a pipe inner surfaces, the cathodically polarized polishing head submerges the anodically polarized pipe inner surface through the adjustable polishing head gap with the electrolyte. A regulated direct current (DC) voltage is applied and the pipe is moved up and down by a spindle drive during the polishing process, in which the velocity and the number of polishing passages can be varied. The actual polishing area is determined by the width of the polishing head gap h g a p . The used polishing head has an outer diameter of 36 mm. This results in a gap width of 1.15 mm between the inner pipe surface and the polishing head.
The initial average roughnesses Sa 0 of the pipe inner surface and the seam were determined for each pipe. The pipes were subdivided into 10 polishing areas. Each polishing area had a height of 30 mm and 10 mm distance to the next one. The spindle drive, that moves the pipe up and down, accelerates and decelerates at both ends of the polish areas. Therefore, the acceleration ranges of 5 mm have been excluded from the measuring area at each end. Previous studies [22] have shown that the plasma polishing process is more stable at higher applied potential differences U. Therefore, the applied potential difference was set to 320 V. The width of the adjustable polishing head gap h g a p was set to 1 mm. This parameter specifies the actual polishing area and is consequently the basis for the calculation of the effective polishing time t e p t . Hence, all results regarding t e p t relate to a normed length of the polishing area of 1 mm. The flow rate of the electrolyte was adjusted to (5.0 ± 0.1) L min−1 and the temperature T of the electrolyte to (85.0 ± 3.0) °C, respectively. The electrical conductivity κ of ammonium sulfate electrolyte was (110.0 ± 10.0) mS cm−1 and the pH-value was around 3. The velocities of the polishing passages were chosen as follows: 0.3 mm s−1, 0.6 mm s−1, 1.2 mm s−1, 2.4 mm s−1, 4.8 mm s−1. In addition to the velocity v, the number of plasma polishing passages n (i.e., how many times the pipe is moved up or down) per measuring area was also varied to ensure a certain sequence of effective polishing times t e p t . For v = 0.3 mm s−1, n was selected as follows: 1, 2, 3, 4, 5, 6, 8, 10, 12, 14. For v = 0.6 mm s−1, n was chosen to be 2, 4, 6, 8, 12, 16, 20, 24, 28, accordingly. Hence, for v = 1.2 mm s−1, n was chosen to 4, 8, 12, 16, 20, 24, 32, 40, 48, 56, for v = 2.4 mm s−1, n was chosen to 8, 16, 24, 32, 40, 48, 64, 80, 96, 112 and finally for v = 4.8 mm s−1, n was chosen to 16, 32, 48, 64, 80, 96, 128, 160, 192, 224. All experiments were repeated at least twice. Six average surface roughnesses Sa v were randomly taken from measuring areas and fifteen from the unpolished area to determine the initial average surface roughness Sa 0 .

2.3. Measurement Methods to Characterize the Surface Roughness

The characterization of the polished metal surfaces is carried out with the aid of a confocal laser scanning microscope (CLSM) LEXT OLS 4000, Olympus (Tokyo, Japan). An objective with a magnification of 50 times was chosen for the measure leading to a scan area of 258 µm × 250 µm. The resulting images feature a resolution of 1024 by 1024 pixels. The polished tubes are cut in vertical strips with a cut-off machine. The essential parameter for all measures is the average surface roughness Sa . Since there is already an initial roughness of approximately 1 µm, the cut-off wavelength was set to 25 µm.

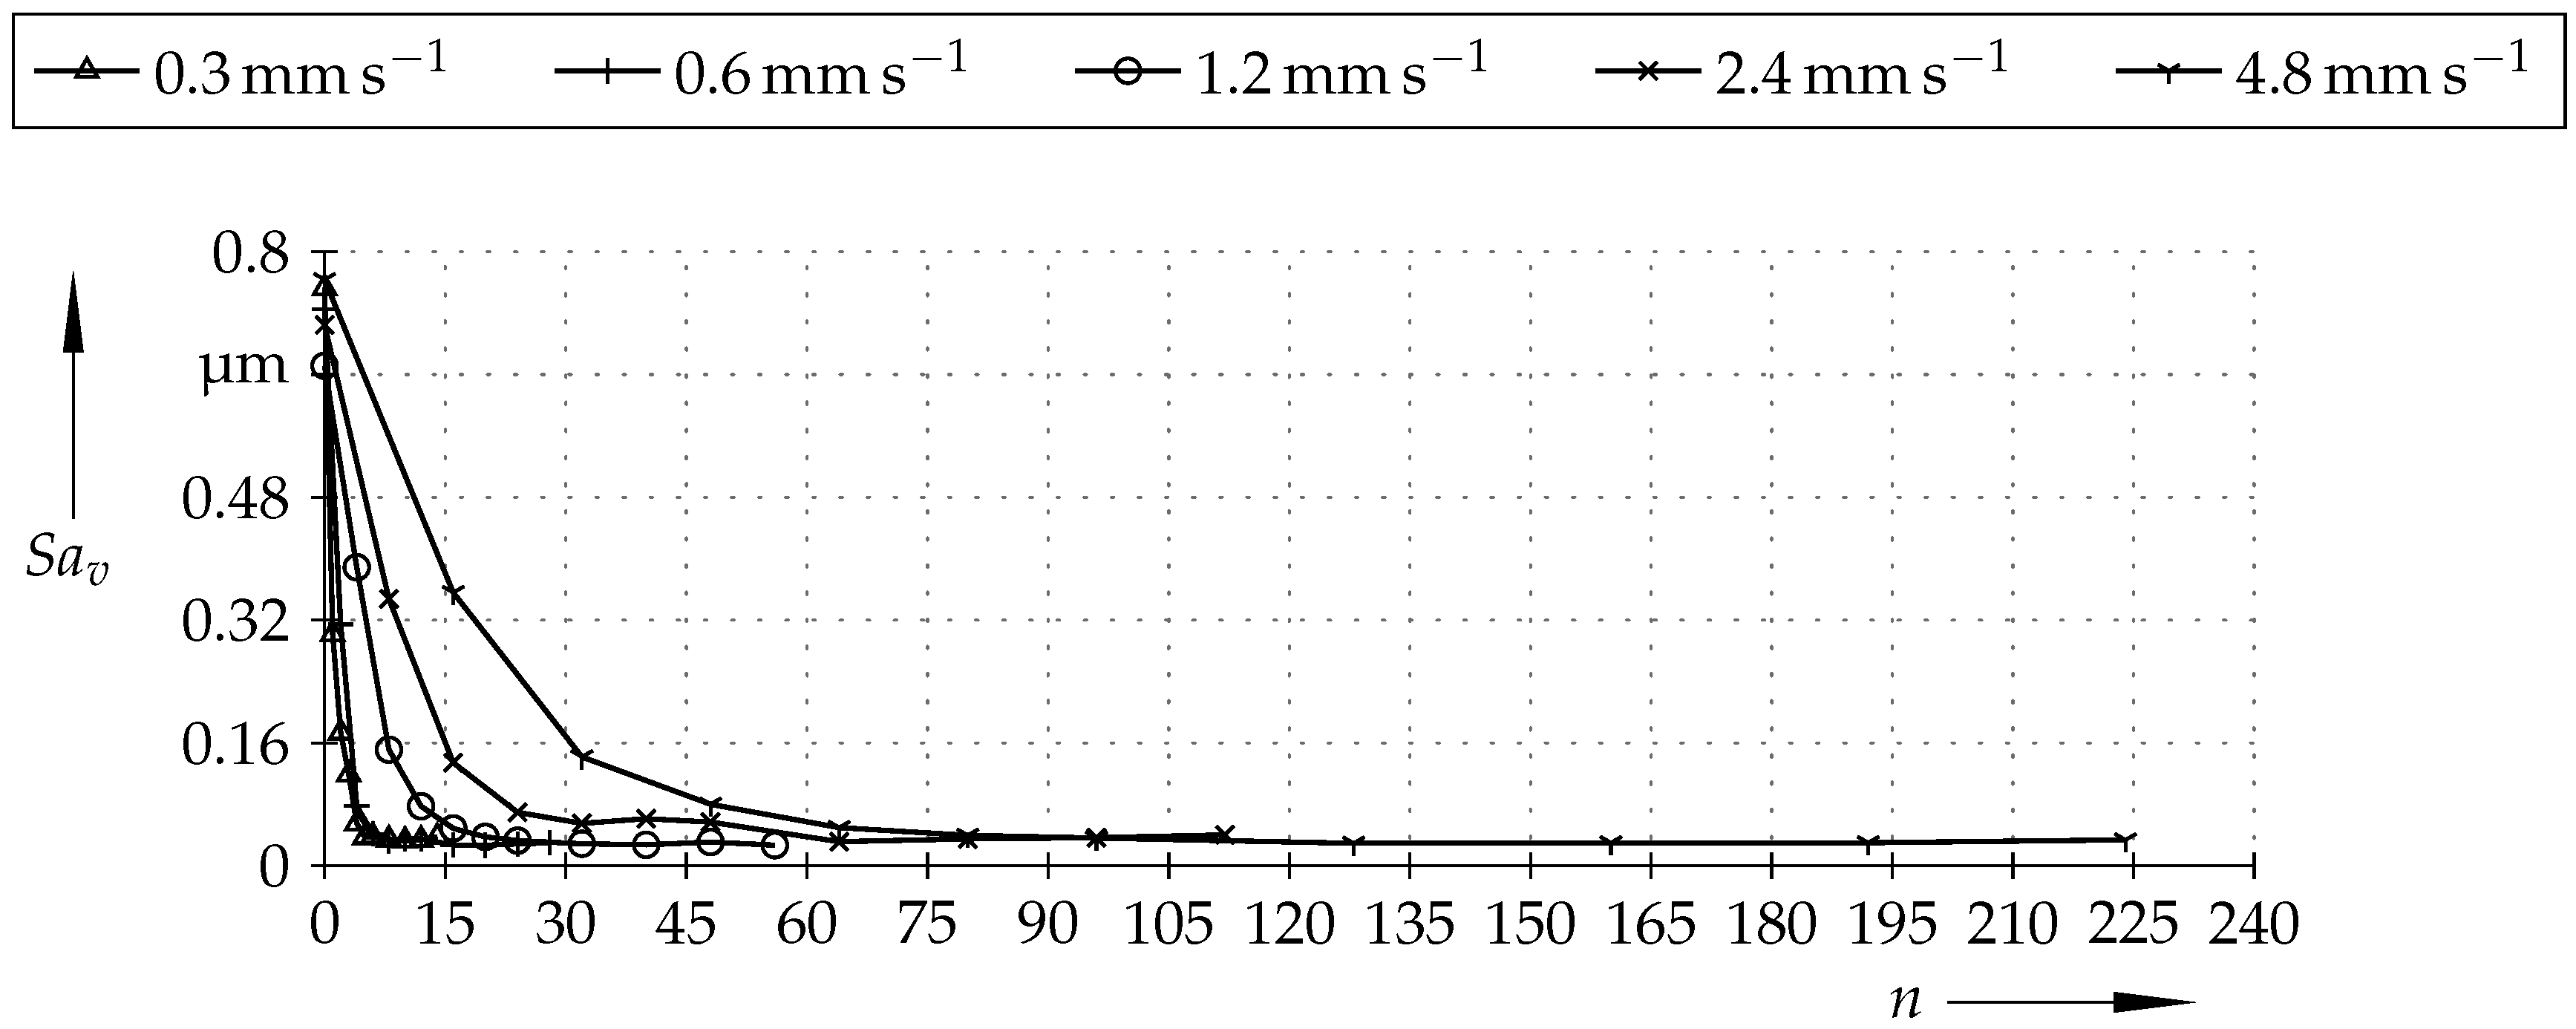
3. Results and Discussion

In the following section, the determined average surface roughness for the pipe inner surface and the weld seam are evaluated and discussed. First of all, the results for the pipe inner surface are considered. Table 1 shows the initial average surface roughness Sa 0 as well as the average surface roughnesses Sa v dependent on the selected velocity v and number n of plasma polishing passages listed in columns for the effective polishing times t e p t = 3.33 s, 6.67 s, 10.00 s, 13.33 s, 16.67 s, 20.00 s, 26.67 s, 33.33 s, 40.00 s, 46.67 s.
The results show that increasing numbers of plasma polishing passages n lead to lower average surface roughnesses Sa v at constant velocities. On the other hand, the results also confirm the findings of the previous study [22], that lower velocities v lead to lower average roughnesses Sa v at constant numbers of plasma polishing passages n.
Figure 3 depicts the average roughness Sa v depending on the number n of plasma polishing passages for the different velocities v and finally illustrates the derived basic relations. It can been learned from Table 1 and Figure 3 that the mean average surface roughnesses Sa v reach a range from 0.030 µm to 0.040 µm for the pipe inner surface after a certain number n of plasma polishing passages dependent on the chosen velocity v of the polishing passage. This means better polishing results can be achieved with optimized polishing parameters compared to the results found in the previous study [22]. It can also be recognized from Table 1 and Figure 3 that comparable average surface roughness Sa v can be achieved either at a high passage velocity combined with a high number of passages or a low passage velocity combined with a low number of passages. For example, at a velocity of 0.3 mm s−1 and n = 4 an average roughness of S a = 0.055 µm is achieved. For v = 4.8 mm s−1, an average surface roughness S a = 0.050 µm is reached after n = 64 passages. The effective polishing time of t e p t = 13.3 s is identical in both cases. The results indicate that the crucial factor for the average surface roughnesses Sa is the effective polishing time t e p t . In order to verify the hypothesis, the mean average surface roughness Sa e p t of the pipe inner surface has been plotted in a diagram against the effective polishing time t e p t (see Figure 4).
It can be recognized from Figure 4 that, starting from the initial average surface roughness Sa 0 of (0.719 ± 0.075) µm, the average surface roughness decreases with increasing effective polishing time until it reaches a range from 0.030 µm to 0.035 µm for the pipe inner surface after a effective polishing time t e p t of approximately 25 s. The exponential decrease is typical for plasma polishing processes because, at the beginning, material is removed from the peaks of the rough metal surface, which is measured as faster polishing progress. In contrast, when the sample surface becomes smoother, there are no peaks to be removed quickly and easily, so the measured polishing progress is slower [12,17,18,22].
Figure 5 show CLSM imagied of unpolished and plasma polished surfaces. The unpolished surface (Figure 5a, S a = 0.726 µm) exhibits irregularities and fractures. Already after an effective polishing time of 13.33 s, quite a smooth surface is achieved (Figure 5b, S a = 0.040 µm). A further improvement of the average surface roughness can be observed at higher effective polishing times.
In addition to the pipe inner surface, the corresponding average surface roughnesses Sa of the weld seam were also examined. Table 2 shows the initial average surface roughness Sa 0 as well as the average surface roughnesses Sa v dependent on the selected velocity v and number n of plasma polishing passages listed in columns for the effective polishing times t e p t = 3.33 s, 6.67 s, 10.00 s, 13.33 s, 16.67 s, 20.00 s, 26.67 s, 33.33 s, 40.00 s, 46.67 s.
The initial average roughness Sa 0 of the weld seam is (0.282 ± 0.039) µm. Hence, the average surfaces roughness is lower than of the pipe inner surface. Basically, the results confirm the findings derived from the measurements on the pipe inner surface. The dependency of the average surface roughnesses Sa v from the selected velocities v and number n of plasma polishing passages is confirmed once more. It can also be recognized that the average surface roughness is mainly determined by the effective polishing time t e p t . Figure 6 depicts the mean value Sa e p t of all average roughnesses Sa v at certain effective polishing times t e p t .
It can also be found that the average surface roughness reaches a range from 0.088 µm to 0.96 µm at the weld seam after a effective polishing time t e p t of approximately 25 s. While the final range of Sa e p t is reached at nearly the same time for both the pipe inner surface and the weld seam, the ranges themselves differ significantly. While the initial average roughness Sa 0 of the weld seam is lower than of the pipe inner surface, the final range of the average surface roughness Sa e p t of the weld seam is higher than of the pipe inner surface after plasma polishing. The results indicate that the final reachable roughness range is not only dependent on the material, the initial average roughness Sa 0 and the plasma polishing process itself, but also on material modifications caused e.g., by welding. In case of tungsten inert gas welding, the metal structure is modified by the thermal energy input, which typically causes a significant recrystallization in the fusion zone. Hence, the microstructure coarsens and the fusion zones exhibit dendritic structure [23,24], which leads to a more inhomogeneous polishing and, in turn, to worse polishing results.

4. Conclusions

In this study, the electrolytic plasma polishing of inner surfaces of welded austenitic stainless steel pipes was investigated. The influence of velocity v and the number n of polishing passages on the average surface roughness Sa was studied. The polishing of the pipe inner surface and weld seam were considered separately. The key findings of this study are:
(i)
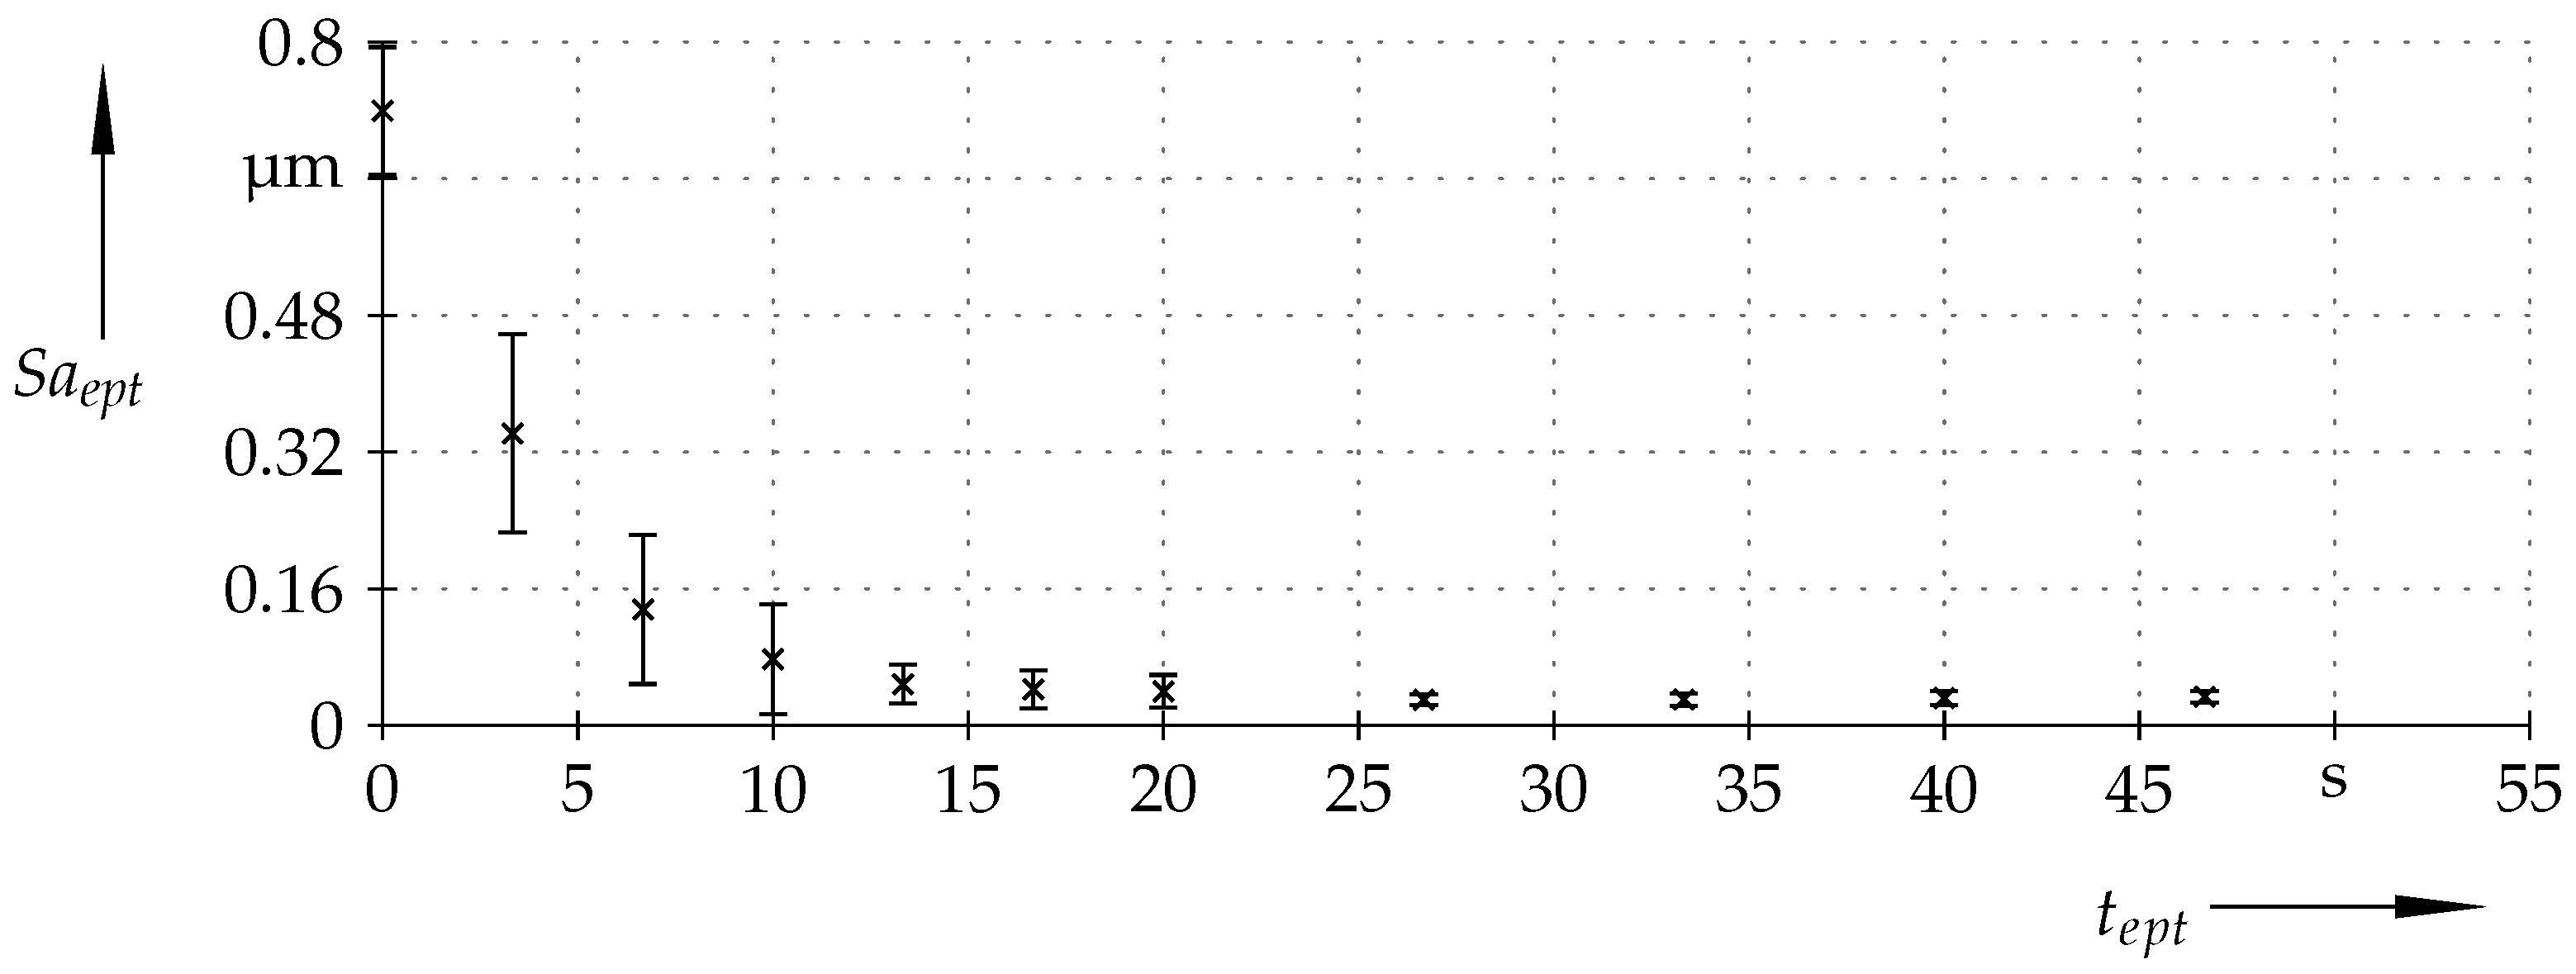
the crucial factor for the achievable average surface roughness Sa is the effective polishing time t e p t ;
(ii)
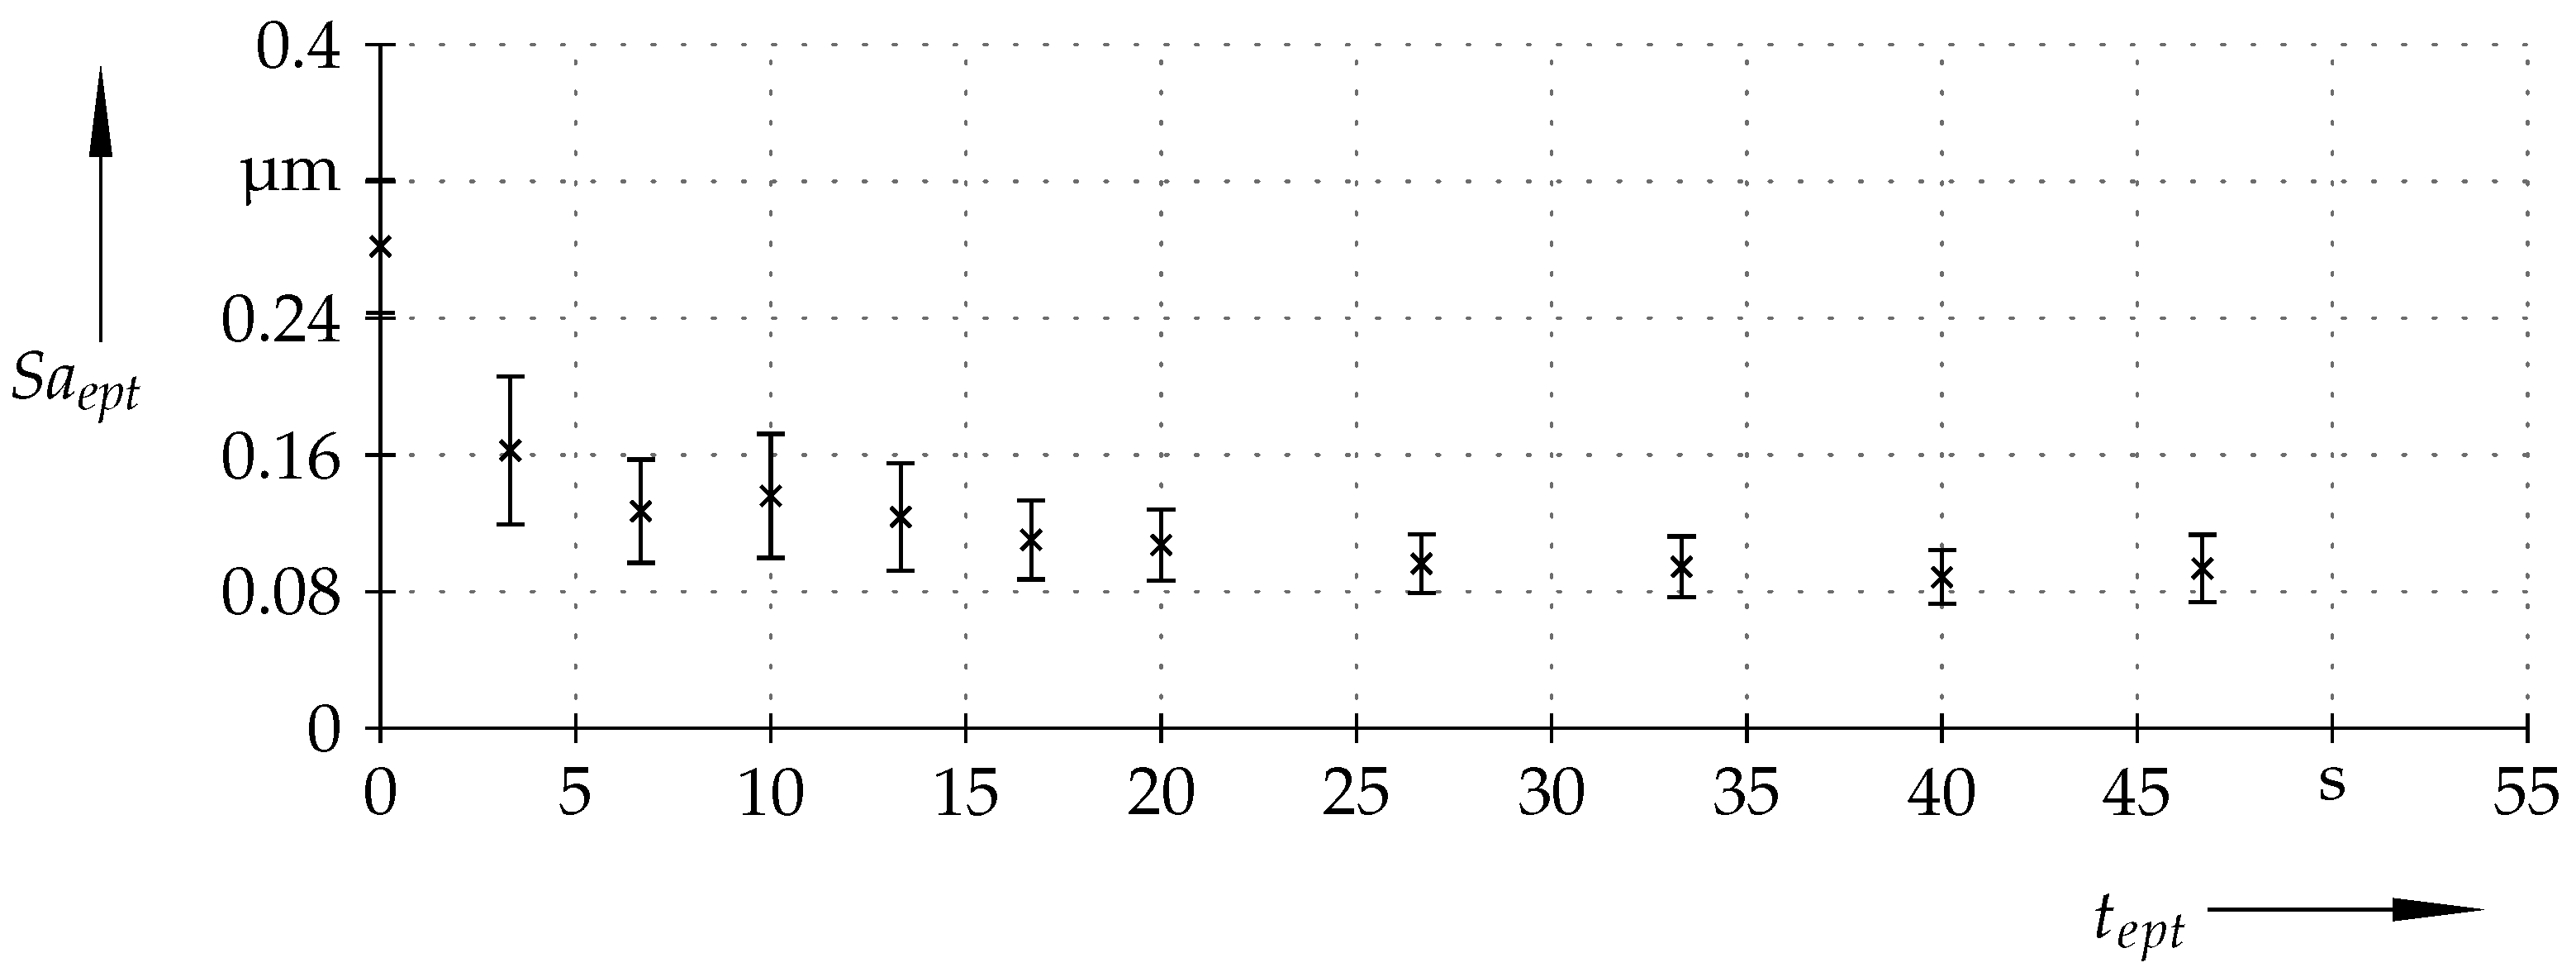
the minimal average surface roughness ranges are achieved after a effective polishing time of approximately 25 s for both the inner pipe surface and the weld seam;
(iii)
the average surface roughness S a of the pipe inner surface can reach a range from 0.030 µm to 0.034 µm starting from an initial surface roughness S a 0 of 0.719 µm;
(iv)
the average surface roughness S a of the weld seam can reach a range from 0.088 µm to 0.096 µm starting from an initial surface roughness S a 0 of 0.282 µm.
The findings regarding the crucial factor effective polishing time t e p t imply that a comparable average surface roughness Sa can be achieved for either a high passage velocity combined with a high number of passages or a low passage velocity combined with a low number of passages. It is therefore possible to choose between polishing the pipe once very slowly, or several times quickly. This study also demonstrated that better polishing results can now be achieved with these optimized polishing parameters compared to the results with preliminary parameters in a previous study [22]. The difference of the achievable surface roughnesses of the pipe inner surface and the weld seam can be explained by the significant recrystallization in the fusion zone structure of the weld seam that is caused by the thermal energy input during TIG welding.

Author Contributions

M.C. and C.D. conceived and designed the experiments and performed the experiments; M.C. and H.S. analysed the data and wrote the paper.

Acknowledgments

This project was funded by the Bundesministerium für Bildung und Forschung (FKZ: 03WKCC3F; Innovative Regional Growth Cores “Centifluidic Technologies” which is part of the initiative “Entrepreneurial Regions”—“The BMBF Innovation Initiative for the New German Länder”). We acknowledge financial support by Deutsche Forschungsgemeinschaft and Universität Rostock within the funding programme Open Access Publishing. Special thanks to Tobias Weise from Plasotec GmbH for support relating to the electrolytic plasma polishing process.

Conflicts of Interest

The authors declare no conflict of interest.

References

  1. Rodríguez, A.; López de Lacalle, L.N.; Fernández, A.; Braun, S. Elimination of surface spiral pattern on brake discs. J. Zhejiang Univ. Sci. A 2014, 15, 53–60. [Google Scholar] [CrossRef]
  2. Zhang, J.; Shi, Y.; Lin, X.; Li, Z. Parameter optimization of five-axis polishing using abrasive belt flap wheel for blisk blade. J. Mech. Sci. Technol. 2017, 31, 4805–4812. [Google Scholar] [CrossRef]
  3. Gora, W.; Tian, Y.; Cabo, A.; Ardron, M.; Maier, R.; Prangnell, P.; Weston, N.; Hand, D. Enhancing surface finish of additively manufactured titanium and cobalt chrome elements using laser based finishing. Phys. Procedia 2016, 83, 258–263. [Google Scholar] [CrossRef]
  4. Bordatchev, E.; Hafiz, A.; Tutunea-Fatan, O. Performance of laser polishing in finishing of metallic surfaces. Int. J. Adv. Manuf. Technol. 2014, 73, 35–52. [Google Scholar] [CrossRef]
  5. Ukar, E.; Lamikiz, A.; López de Lacalle, L.N.; del Pozo, D.; Arana, J.L. Laser polishing of tool steel with CO2 laser and high-power diode laser. Int. J. Mach. Tools Manuf. 2010, 50, 115–125. [Google Scholar] [CrossRef]
  6. Jones, A.R.; Hull, J.B. Ultrasonic flow polishing. Ultrasonics 1998, 36, 97–101. [Google Scholar] [CrossRef]
  7. Zhao, J.; Zhan, J.; Jin, R.; Tao, M. An oblique ultrasonic polishing method by robot for free-form surfaces. Int. J. Mach. Tools Manuf. 2000, 36, 795–808. [Google Scholar] [CrossRef]
  8. Landolt, D. Fundamental Aspects of Electropolishing. Electrochim. Acta 1987, 32, 1–11. [Google Scholar] [CrossRef]
  9. Mohan, S.; Kanagaraj, D.; Sindhuja, R.; Vijayalakshmi, S.; Renganathan, N.G. Electropolishing of Stainless Steel—A Review. Trans. IMF 2001, 79, 140–142. [Google Scholar] [CrossRef]
  10. Parfenov, E.; Yerokhin, A.; Nevyantseva, R.; Gorbatkov, M.; Liang, C.J.; Matthews, A. Towards smart electrolytic plasma technologies: An overview of methodological approaches to process modelling. Surf. Coat. Technol. 2015, 269, 2–22. [Google Scholar] [CrossRef]
  11. Duradji, V.; Kaputkin, D. Metal Surface Treatment in Electrolyte Plasma during Anodic Process. J. Electrochem. Soc. 2016, 163, E43–E48. [Google Scholar] [CrossRef]
  12. Wang, J.; Suo, L.; Guan, L.; Fu, Y. Optimization of Processing Parameters for Electrolysis and Plasma Polishing. Appl. Mech. Mater. 2012, 217–219, 1368–1371. [Google Scholar] [CrossRef]
  13. Vaňa, D.; Podhorský, S.; Suba, R.; Hurajt, M. The Change of Surface Properties on tested Smooth Stainless Steel Surfaces after Plasma Polishing. Int. J. Eng. Sci. Invent. 2013, 2, 2319–6734. [Google Scholar]
  14. Wang, J.; Suo, L.; Guan, L.; Fu, Y. Analytical Study on Mechanism of Electrolysis and Plasma Polishing. Adv. Mater. Res. 2012, 472–475, 350–353. [Google Scholar] [CrossRef]
  15. Böttger-Hiller, F.; Nestler, K.; Zeidler, H.; Glowa, G.; Lampke, T. Plasma electrolytic polishing of metalized carbon fibers. AIMS Mater. Sci. 2016, 3, 260–269. [Google Scholar] [CrossRef]
  16. Nestler, K.; Adamitzki, W.; Glowa, G.; Zeidler, H. Plasma Electrolytic Surface Treatment of Copper and Copper Alloys. Metall 2014, 68, 73–93. [Google Scholar]
  17. Vaňa, D.; Podhorský, S.; Hurajt, M.; Hanzen, V. Surface Properties of the Stainless Steel X10 CrNi 18/10 after Application of Plasma Polishing in Electrolyte. Int. J. Mod. Eng. Res. 2013, 3, 788–792. [Google Scholar]
  18. Zong, X.; Wang, J.; Wang, Y.; Liu, J. Influence of Electrolysis and Plasma Polishing on Surface Properties of SUS304 Stainless Steel. Adv. Mater. Res. 2014, 989–994, 308–311. [Google Scholar] [CrossRef]
  19. Zeidler, H.; Böttger-Hiller, F.; Edelmann, J.; Schubert, A. Surface finish machining of medical parts using Plasma electrolytic Polishing. Procedia CIRP 2016, 49, 83–87. [Google Scholar] [CrossRef]
  20. Yerokhin, A.; Nie, X.; Leyland, A.; Matthews, A.; Dowey, S. Plasma electrolysis for surface engineering. Surf. Coat. Technol. 1999, 122, 73–93. [Google Scholar] [CrossRef]
  21. Liang, J.; Wang, K.Y.; Guo, S.M.; Wahab, M.A. Influence of electrolytic plasma process on corrosion property of peened 304 austenitic stainless steel. Surf. Coat. Technol. 2011, 65, 510–513. [Google Scholar] [CrossRef]
  22. Cornelsen, M.; Deutsch, C.; Seitz, H. Electrolytic Plasma Polishing of Pipe Inner Surfaces. Metals 2018, 8, 12. [Google Scholar] [CrossRef]
  23. Ojo, O.A.; Richards, N.L.; Chaturvedi, M.C. Microstructural study of weld fusion zone of TIG welded IN 738LC nickel-based superalloy. Scr. Mater. 2004, 51, 683–688. [Google Scholar] [CrossRef]
  24. Zhu, Q.; Lei, Y.-C.; Chen, X.-Z.; Ren, W.-J.; Ju, X.; Ye, Y.-M. Microstructure and mechanical properties in TIG welding of CLAM steel. Fusion Eng. Des. 2011, 86, 407–411. [Google Scholar] [CrossRef]
Figure 1. Schematic design of a plasma polishing system for internal pipe surfaces [22]: (1) direct current (DC) power supply, (2) polishing head (cathode), (3) tube clamping, (4) tube (anode), (5) spindle drive with vertical axis, (6) basin, (7) electrolyte.
Metals 08 00330 g001
Figure 2. Schematic design of the polishing head: (a) electrolyte; (b) metal core (cathode, stainless steel); (c) insulator (polyether ether ketone (peek)); (d) adjustable polishing head gap and the active plasma (yellow); (e) gap between the inner pipe surface and the polishing head; (f) moveable pipe (anode, stainless steel).
Metals 08 00330 g002
Figure 3. Average surface roughnesses Sa v of the pipe inner surface over n for different velocities v. The initial average surface roughness Sa 0 is located at the position n = 0 .
Metals 08 00330 g003
Figure 4. Mean average surface roughness Sa e p t of the pipe inner surface dependent from t e p t . The initial average surface roughness Sa 0 is located at the position t e p t = 0 s.
Metals 08 00330 g004
Figure 5. CLSM images of unpolished and plasma polished surfaces (scan area: 258 µm × 250 µm): (a) unpolished surface ( S a = 0.726 µm); (b) plasma polished surface after t e p t = 13.33 s ( S a = 0.040 µm); (c) plasma polished surface after t e p t = 26.66 s ( S a = 0.024 µm); (d) plasma polished surface after t e p t = 40.00 s ( S a = 0.023 µm).
Metals 08 00330 g005
Figure 6. Mean average surface roughness Sa e p t of the weld seam dependent from t e p t . The initial average surface roughness Sa 0 is located at the position t e p t = 0 s.
Metals 08 00330 g006
Table 1. Average surface roughnesses Sa v of the pipe inner surface depending on the selected velocity v and number n of plasma polishing passages. The results are listed in columns for a sequence of effective polishing times t e p t . The initial average surface roughness Sa 0 is given in the last column. The last row presents the mean value Sa e p t of all above listed values Sa v for the particular effective polishing times t e p t .
v/(mm s−1)tept/s3.336.6710.0013.3316.6720.0026.6733.3340.0046.67 Sa 0
Sa 0.3 / µm0.3020.1740.1190.0550.0370.0380.0340.0320.0340.0380.753
0.3 σ 0.3 / µm0.1660.1470.1090.0270.0100.0100.0080.0070.0110.0070.035
n1234568101214
Sa 0.6 / µm0.3140.0780.0420.0320.0350.0350.0270.0270.0290.0300.725
0.6 σ 0.6 / µm0.1080.0210.0080.0040.0080.0070.0020.0010.0030.0020.045
n2468101216202428
Sa 1.2 / µm0.3890.1510.0780.0480.0380.0330.0290.0270.0310.0270.651
1.2 σ 1.2 / µm0.0180.0670.0600.0320.0160.0090.0040.0040.0050.0010.074
n481216202432404856
Sa 2.4 / µm0.3480.1340.0700.0550.0610.0570.0310.0350.0370.0400.705
2.4 σ 2.4 / µm0.1120.0440.0230.0180.0400.0350.0080.0110.0100.0060.076
n81624324048648096112
Sa 4.8 / µm0.3560.1420.0800.0500.0400.0360.0290.0300.0300.0340.764
4.8 σ 4.8 / µm0.1150.0780.0490.0140.0100.0100.0040.0050.0040.0040.076
n163248648096128160192224
Sa e p t / µm0.3420.1360.0780.0480.0420.0400.0300.0300.0320.0340.719
σ / µm0.1160.0870.0640.0230.0220.0190.0060.0070.0080.0070.075
Table 2. Average surface roughnesses Sa v of the weld seam depending on the selected velocity v and number n of plasma polishing passages. The results are listed in columns for a sequence of effective polishing times t e p t . The initial average surface roughness Sa 0 is given in the last column. The last row presents the mean value Sa e p t of all above listed values Sa v for the particular effective polishing times t e p t .
v/(mm s−1)tept/s3.336.6710.0013.3316.6720.0026.6733.3340.0046.67 Sa 0
Sa 0.3 / µm 0.200 0.143 0.146 0.115 0.119 0.124 0.103 0.102 0.092 0.099 0.290
0.3 σ 0.3 / µm 0.044 0.021 0.011 0.012 0.008 0.022 0.009 0.019 0.007 0.020 0.028
n1234568101214
Sa 0.6 / µm 0.189 0.151 0.172 0.169 0.115 0.107 0.120 0.113 0.104 0.119 0.288
0.6 σ 0.6 / µm 0.029 0.019 0.046 0.019 0.032 0.022 0.007 0.015 0.024 0.019 0.018
n2468101216202428
Sa 1.2 / µm 0.154 0.107 0.116 0.096 0.096 0.099 0.088 0.083 0.085 0.089 0.298
1.2 σ 1.2 / µm 0.032 0.013 0.023 0.010 0.014 0.012 0.006 0.005 0.010 0.006 0.030
n481216202432404856
Sa 2.4 / µm 0.147 0.130 0.139 0.137 0.122 0.118 0.101 0.101 0.090 0.097 0.274
2.4 σ 2.4 / µm 0.029 0.019 0.017 0.020 0.023 0.022 0.018 0.016 0.014 0.016 0.050
n81624324048648096112
Sa 4.8 / µm 0.144 0.118 0.122 0.115 0.104 0.095 0.080 0.082 0.077 0.074 0.265
4.8 σ 4.8 / µm 0.051 0.045 0.045 0.032 0.024 0.009 0.010 0.011 0.009 0.008 0.044
n163248648096128160192224
Sa e p t / µm 0.163 0.127 0.136 0.124 0.110 0.107 0.096 0.095 0.088 0.094 0.282
σ / µm 0.043 0.030 0.036 0.031 0.023 0.021 0.017 0.018 0.016 0.020 0.039

