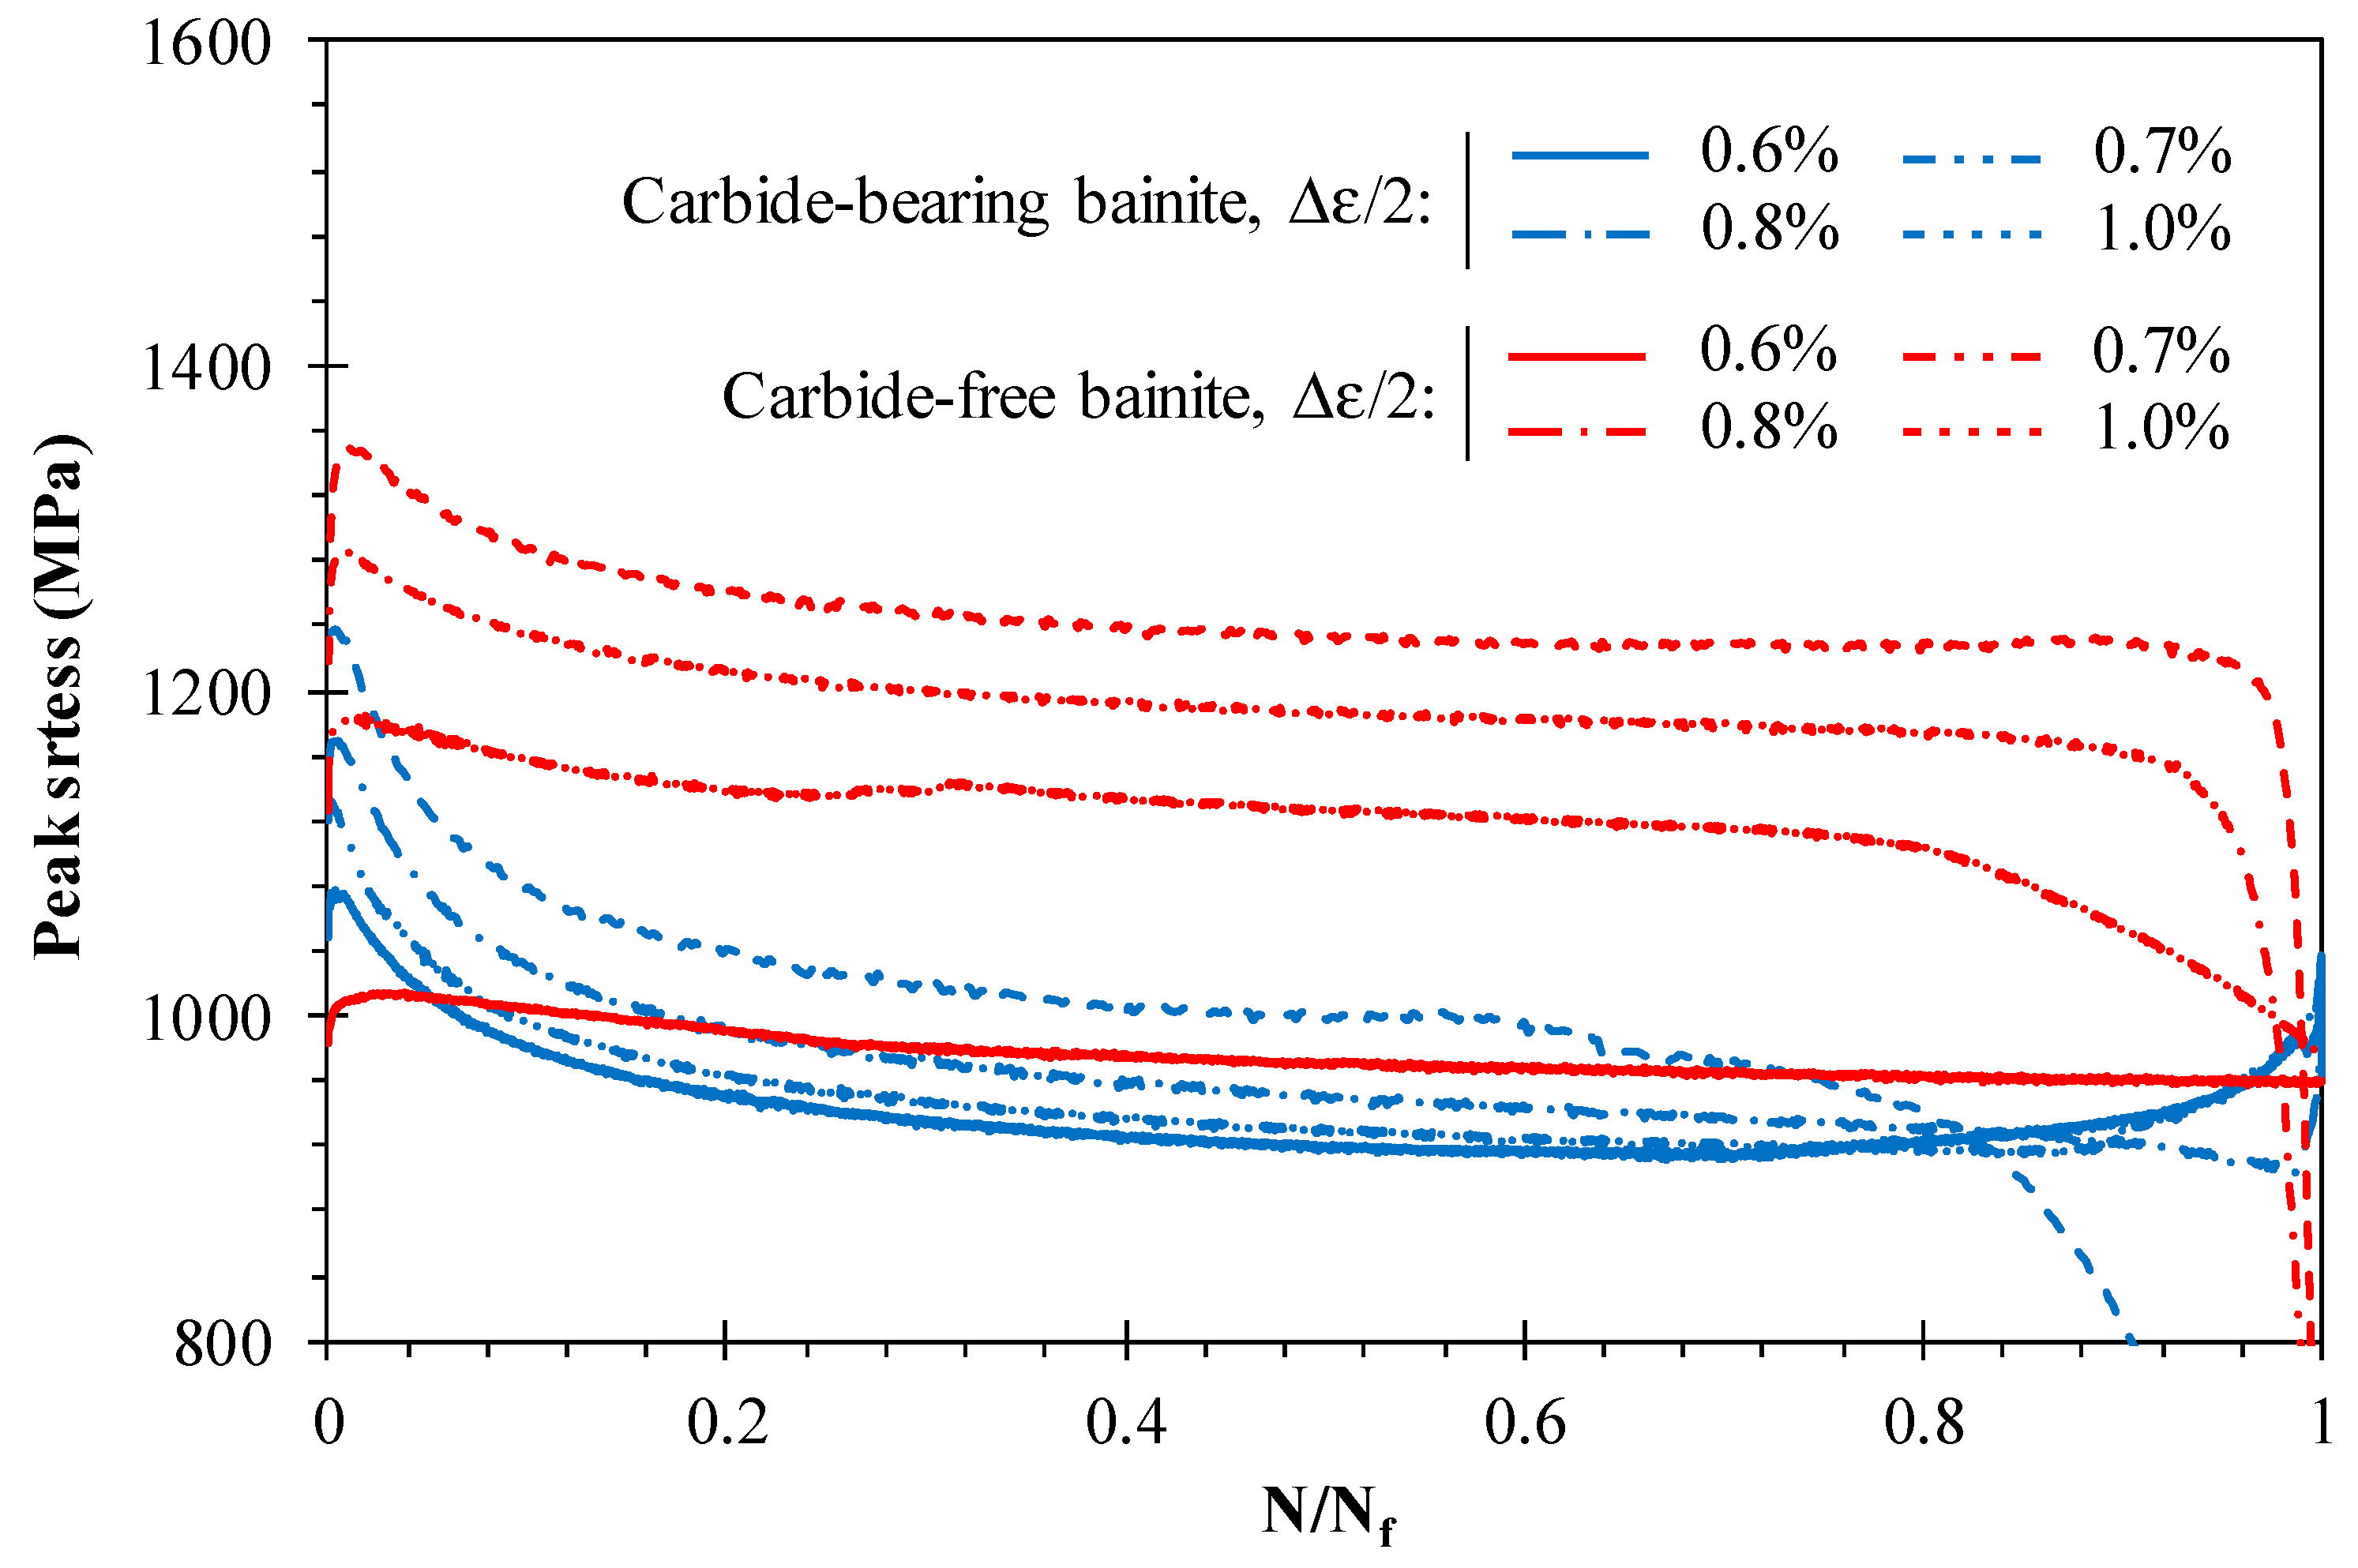
3.2. Cyclic Stress-Strain Deformation Behaviour
Figure 2 plots the peak stress against the normalised fatigue life (
N/
Nf) for the carbide-bearing and the carbide-free bainitic steels at different strain amplitudes, under fully-reversed strain-controlled conditions. Both steels, irrespective of the strain amplitude, undergo an initial cyclic hardening with growing intensity in the early cycles, followed by a progressive reduction of peak stress, which is more pronounced for the carbide-bearing bainite. In the second stage, peak stress variations tend to be tenuous, and the material response is close to a saturated state, particularly for the lower strain amplitudes. After this period, in the final stage, the peak stress drops more steeply, leading to total failure.
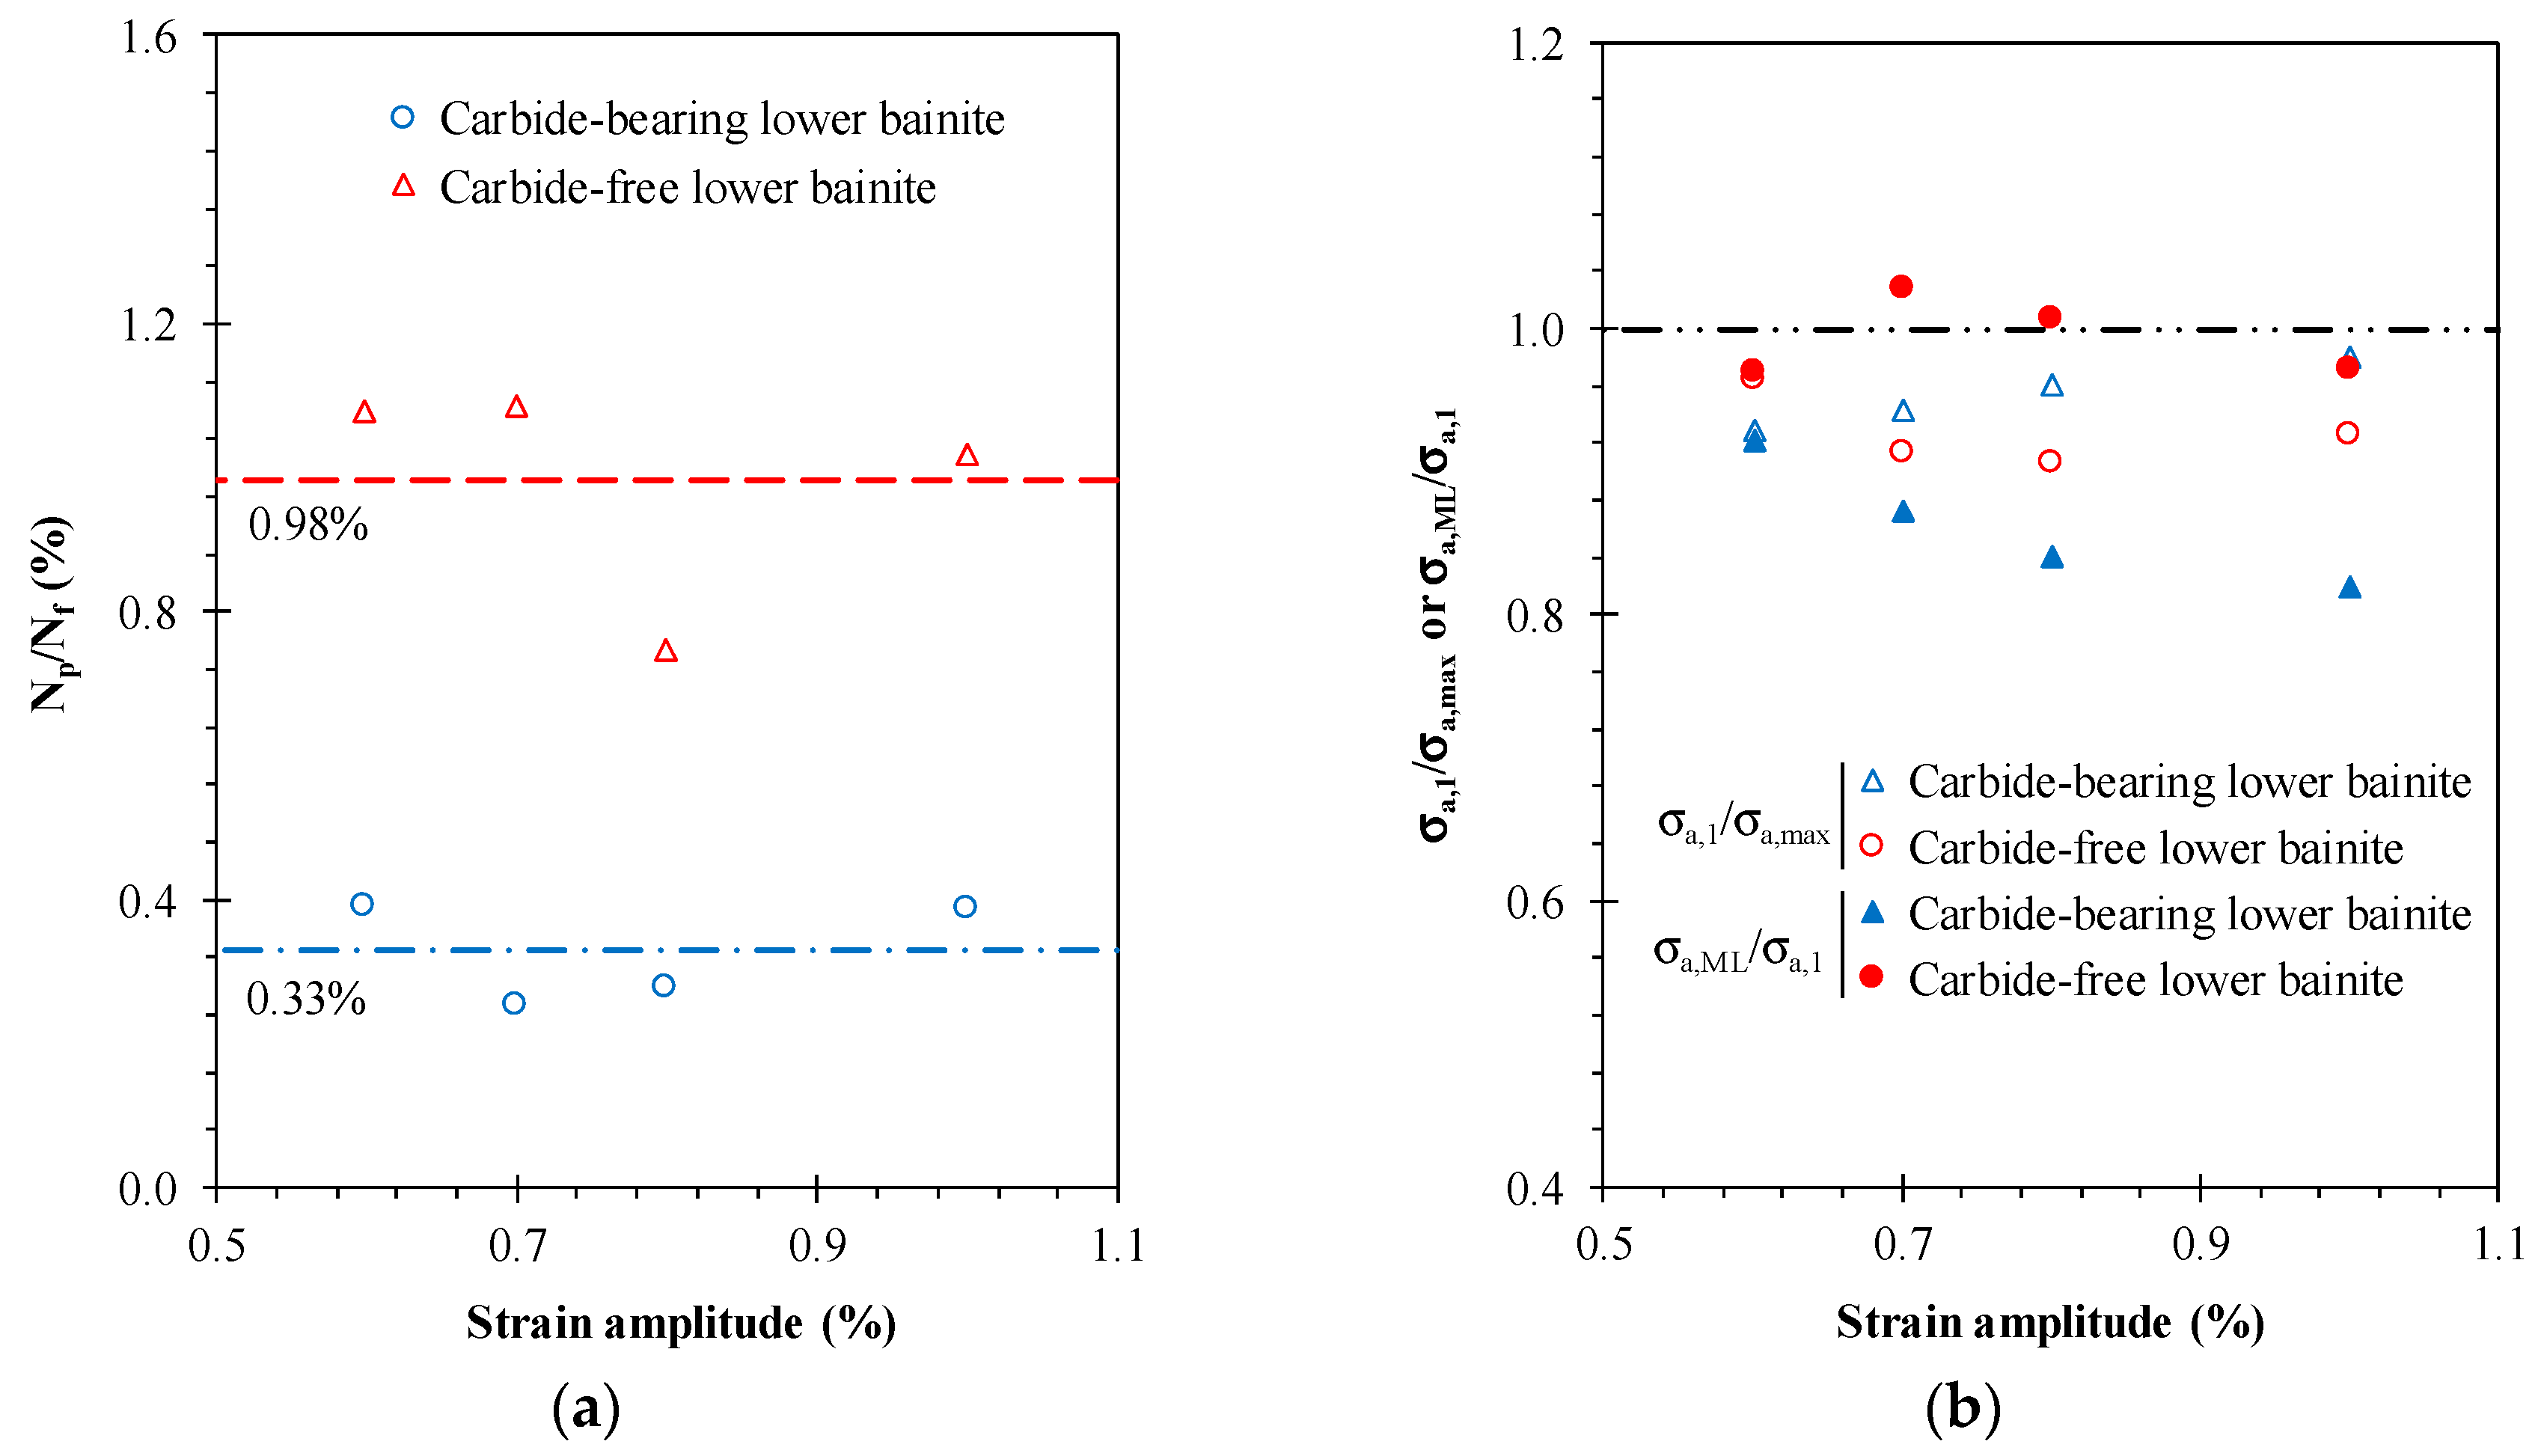
The maximum stress occurs in the early cycles of the tests. The life ratios of these values, designated here by
Np/
Nf, are represented in
Figure 3a for the tested steels. As can be seen in the figure, although some scatter is observed, there is a clear trend for each case. The maximum stress amplitudes are attained faster for the carbide-bearing lower bainite than for the carbide-free lower bainite, and the
Np/
Nf values are, on average, equal to 0.33% (see the dashed line) and 0.98% (see the dash-dotted line) of the life ratio, respectively.
Figure 3b shows, for various strain amplitude levels, the relation between the stress amplitude of the first cycle (σ
a,1) and the maximum stress amplitude (σ
a,max). Both steels have similar relations (σ
a,1/σ
a,max) slightly below the unity (i.e., 0.93 for the carbide-bearing lower bainite and 0.97 for the carbide-free lower bainite), which denotes cyclic hardening behaviour. As far as what can be inferred from the figure, the above-mentioned relations reach minimum values: (i) at the lowest strain amplitudes for the carbide-bearing lower bainite; and (ii) at intermediate strain amplitudes for the carbide-free lower bainite. With regard to the relations between the stress amplitude of the mid-life cycle (σ
a,ML) and the stress amplitude of the first cycle (σ
a,1), as displayed in
Figure 3b, both steels behave differently, i.e., the carbide-bearing bainitic steel exhibits a cyclic softening behaviour with σ
a,ML/σ
a,1 becoming increasingly lower as the strain amplitude increases, while the other shows a mixed cyclic hardening-softening response that is not particularly intense, with σ
a,ML/σ
a,1 values quite close to 1.
The study of the cyclic stress-strain response for both tested materials, was performed on the basis of the data being collected for the mid-life cycle [
15,
16,
17]. Total plastic and elastic strain amplitudes, stress amplitudes, and plastic strain energy densities of the selected hysteresis loops are listed in
Table 1.
Figure 4a plots the mid-life stress-strain circuits of the carbide-bearing and carbide-free bainitic steels in relative coordinates, with the lower tips tied together at different strain amplitudes. When first looking, it can be concluded that the upper branches are not perfectly coincident, and that we are therefore in the presence of non-Masing type materials. A more in-depth analysis for the carbide-bearing bainitic steel is provided in
Figure 4b, which compares perfect Masing-type circuits (dashed lines) with those that were obtained in the experiments (full lines) in relative coordinates, with the upper branches overlapped. Not surprisingly, it is possible to distinguish a reduction of the linear region where, the higher the strain amplitudes, the bigger the differences. The comparison of the mid-life circuits shows that the areas—or in other words, the plastic strain energy densities—are larger for the carbide-bearing lower bainite than for the carbide-free lower bainite (see
Table 1) at similar strain amplitude levels.
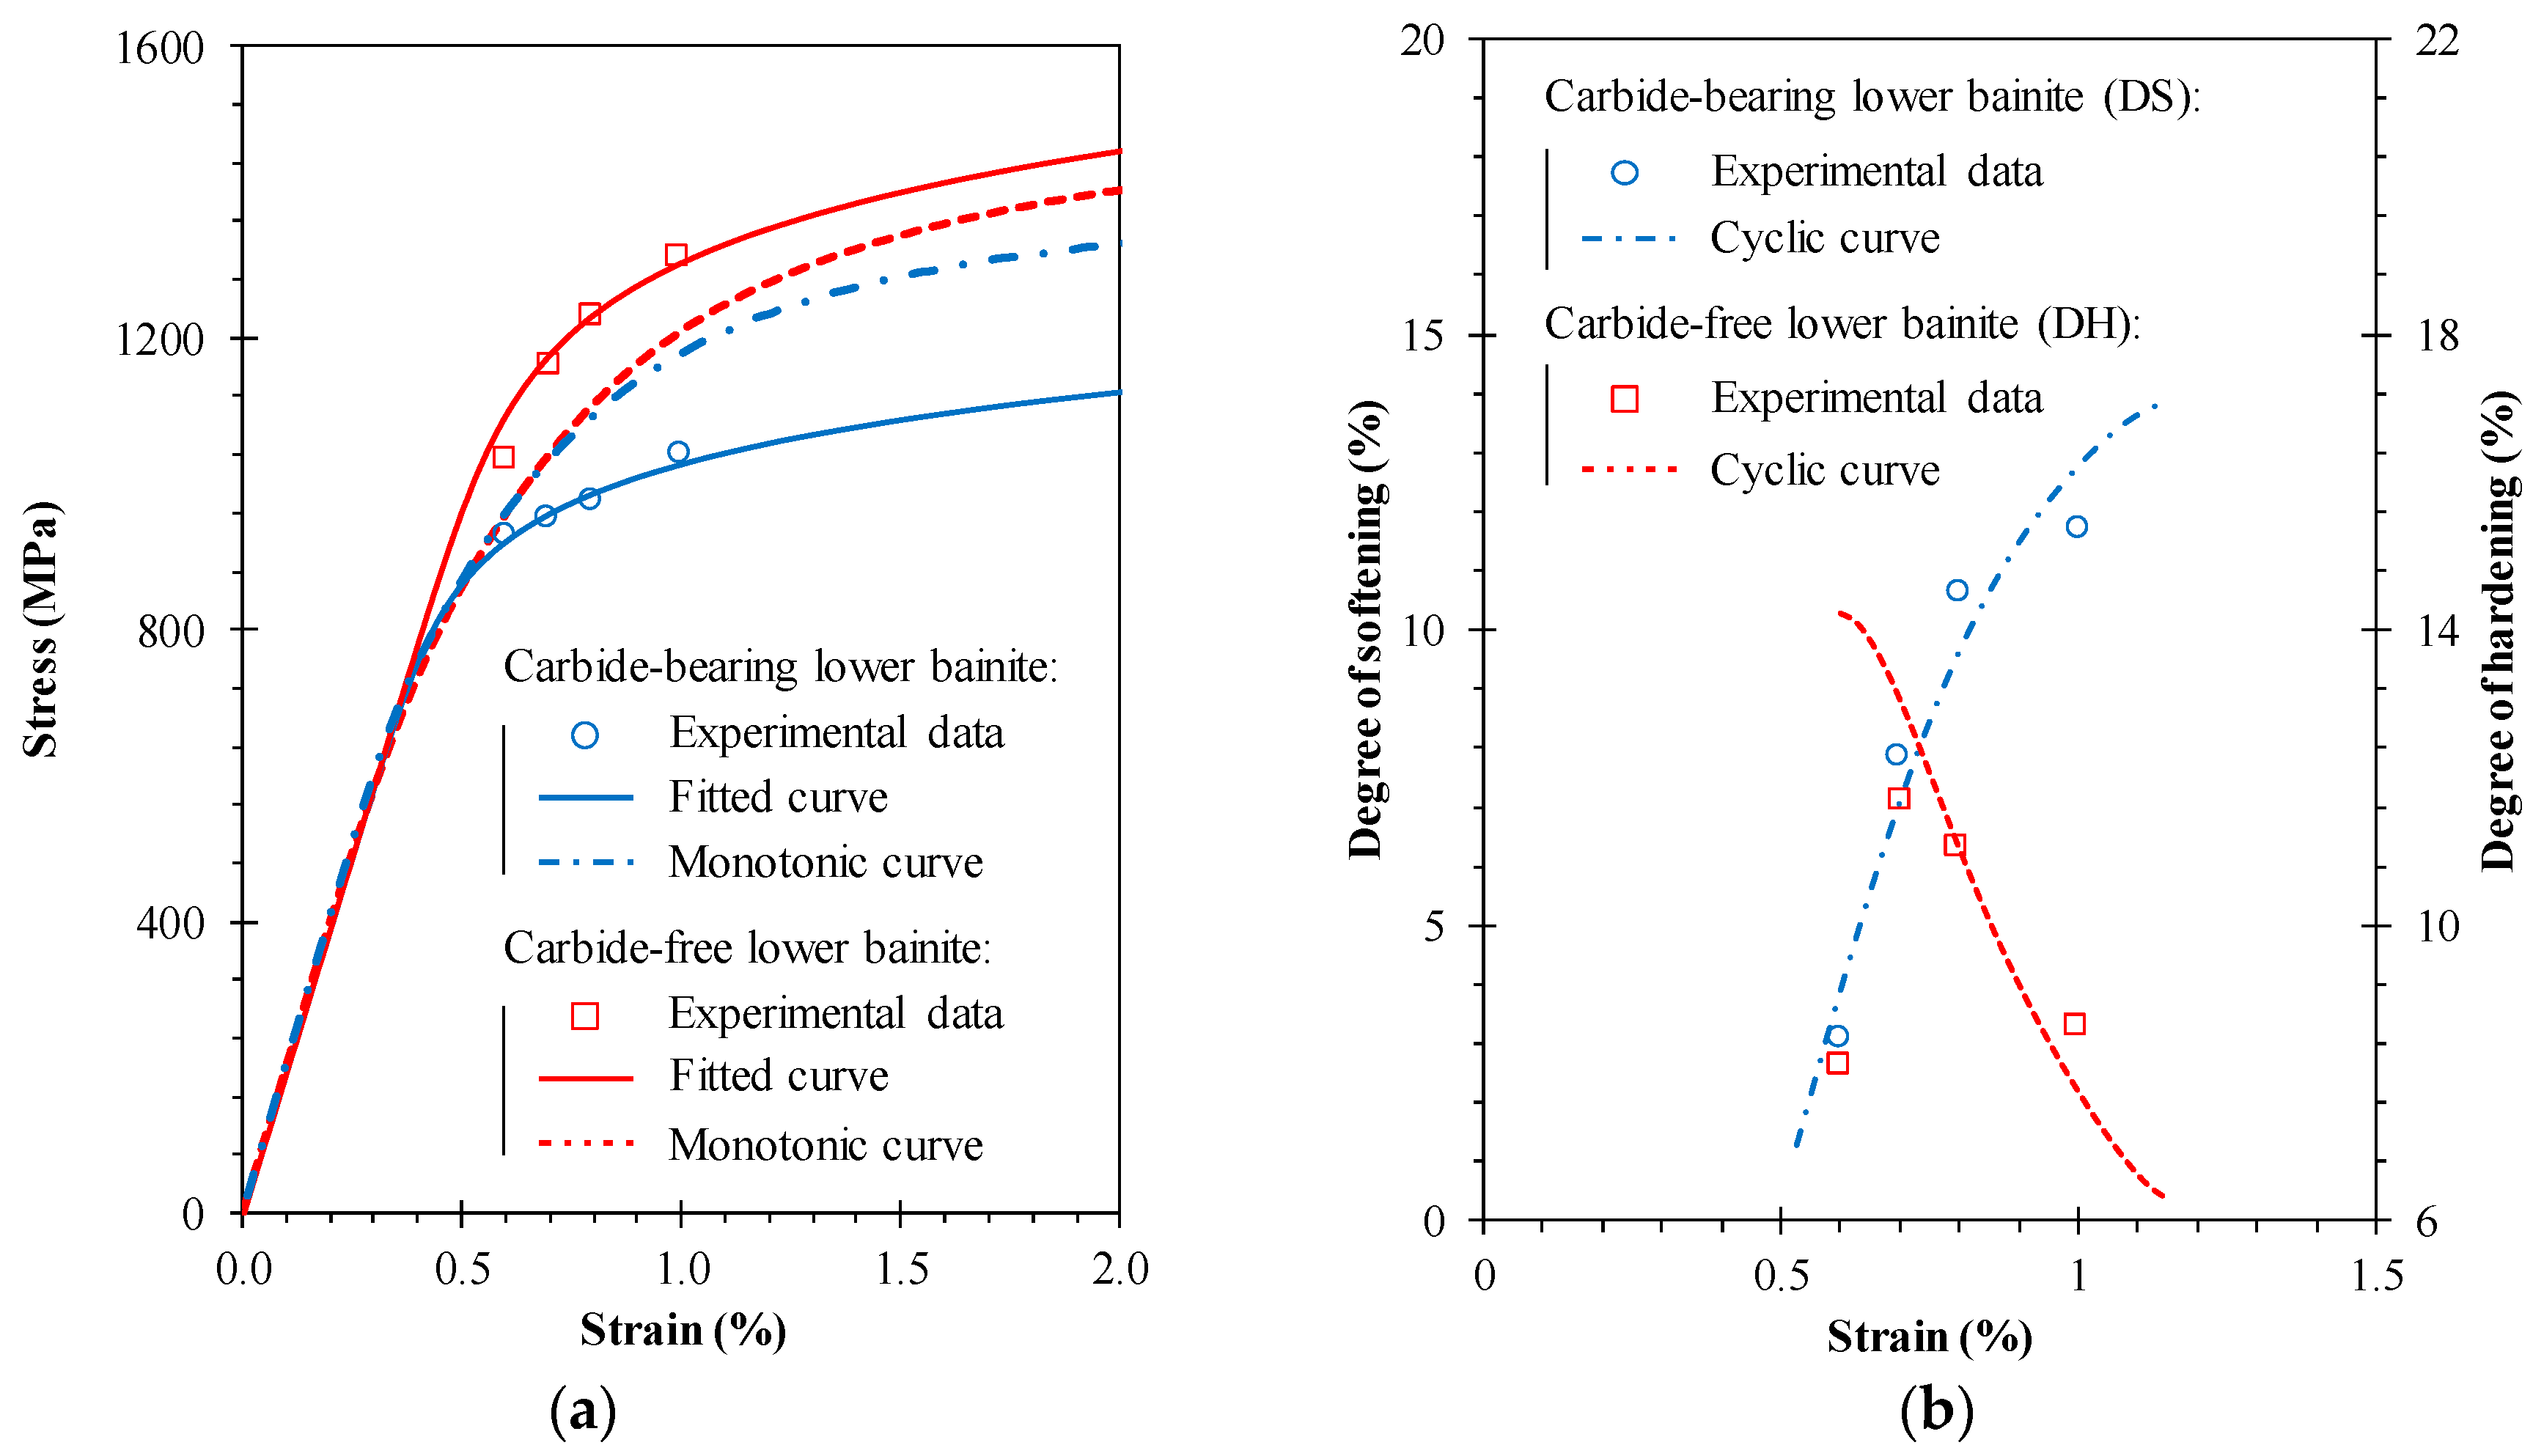
The cyclic stress-strain curves, obtained from the mid-life hysteresis circuits, can be seen in
Figure 5a. The constants
k’ and
n’ of Equation (1), which respectively represent the cyclic hardening coefficient and the cyclic hardening exponent, were determined using the least square method, and are listed in
Table 4. Monotonic stress-strain curves are also plotted for comparison purposes. Both steels behave differently. The carbide-free lower bainite exhibits a strain-hardening response in the entire range, as the experimental cyclic data are above the monotonic curve. On the contrary, the carbide-bearing lower bainite is characterized by a strain-softening behaviour. The degree of strain-hardening (DH) and the degree of strain-softening (DS) are presented in
Figure 5b. These variables were accounted for from two different approaches: the first was given by the difference between the stress amplitude of the first and the mid-life circuits (circles and rectangles); and the second was given by the difference between the cyclic and the monotonic curves (dashed lines). The insights drawn from the two approaches are similar: DS increases with the strain amplitude for the carbide-bearing lower bainite and DH decreases with the strain amplitude for the carbide-free lower bainite. Furthermore, the experimental results are close to those collected from the fitted cyclic curves.
Figure 6 displays the stress amplitude against the plastic strain amplitude for both of the bainitic steels. These two variables (see the dash-dotted lines) can be related by a power law.
Figure 6 also displays the relationship between the stress amplitude and the elastic strain amplitude, which is defined on the basis of the unloading moduli obtained in the experimental tests (see the dashed lines). Similarly, these two variables can also be related via a power law. The
k” and
n” constants were determined using the least square method and are summarised in
Table 4. The variations of the unloading moduli with the elastic strain amplitude (which are evident when compared with the solid lines—both overlapped—that were obtained from the values of the Young’s moduli, given in
Table 3) indicate a non-linear behavior, not only in the plastic regime but also in the elastic regime.
The stress-life relations, expressed in terms of the number of reversals to failure versus stress amplitude of the mid-life circuits, can be written in the following form:
where σ
f’ is the fatigue strength coefficient, and
b is the fatigue strength exponent. The constants, determined via the least square method, are reported in
Table 5. In both cases, but particularly for the carbide-bearing lower bainite, a significant correlation between the experiments and the proposed functions was obtained [
5]. As already noted by Long et al. [
5], the carbide-free bainite can deal with higher stress amplitudes for a similar number of cycles, particularly for lower fatigue lives. As the fatigue life increases, the differences tend to be attenuated.
The total strain amplitude, defined as the sum of the elastic and plastic parts, can be related to the fatigue life from the following equation:
where σ
f’ is the fatigue strength coefficient,
b is the fatigue strength exponent, ε
f’ is the fatigue ductility coefficient, and
c is the fatigue ductility exponent.
Figure 7 presents the strain-life relations of the carbide-bearing and the carbide-free steels that were obtained from the experiments. The constants, fitted using the least square method, are reported in
Table 5, where the experimental data that was collected in the tests were omitted for the sake of clarity. Overall, the fatigue resistance of the carbide-bearing lower bainite is smaller than that of the carbide-free lower bainite. As suggested by Long et al. [
5], fatigue durability is negatively affected by the stable carbides and thick bainite ferrite plates and, on the contrary, the existence of fine bainite ferrite plates and metastable retained austenite positively affects the fatigue performance. The difference between the two tested steels is the greatest for lower lives, and tends to disappear as the strain amplitude decreases. For lives greater than 10
4, the total strain versus life curves tend to be overlapped. Regarding the transition lives, represented by 2
NT in
Figure 7, the outcomes are also notoriously different: 2
NT of the carbide-bearing lower bainite is two times higher than that of the carbide-free lower bainite.
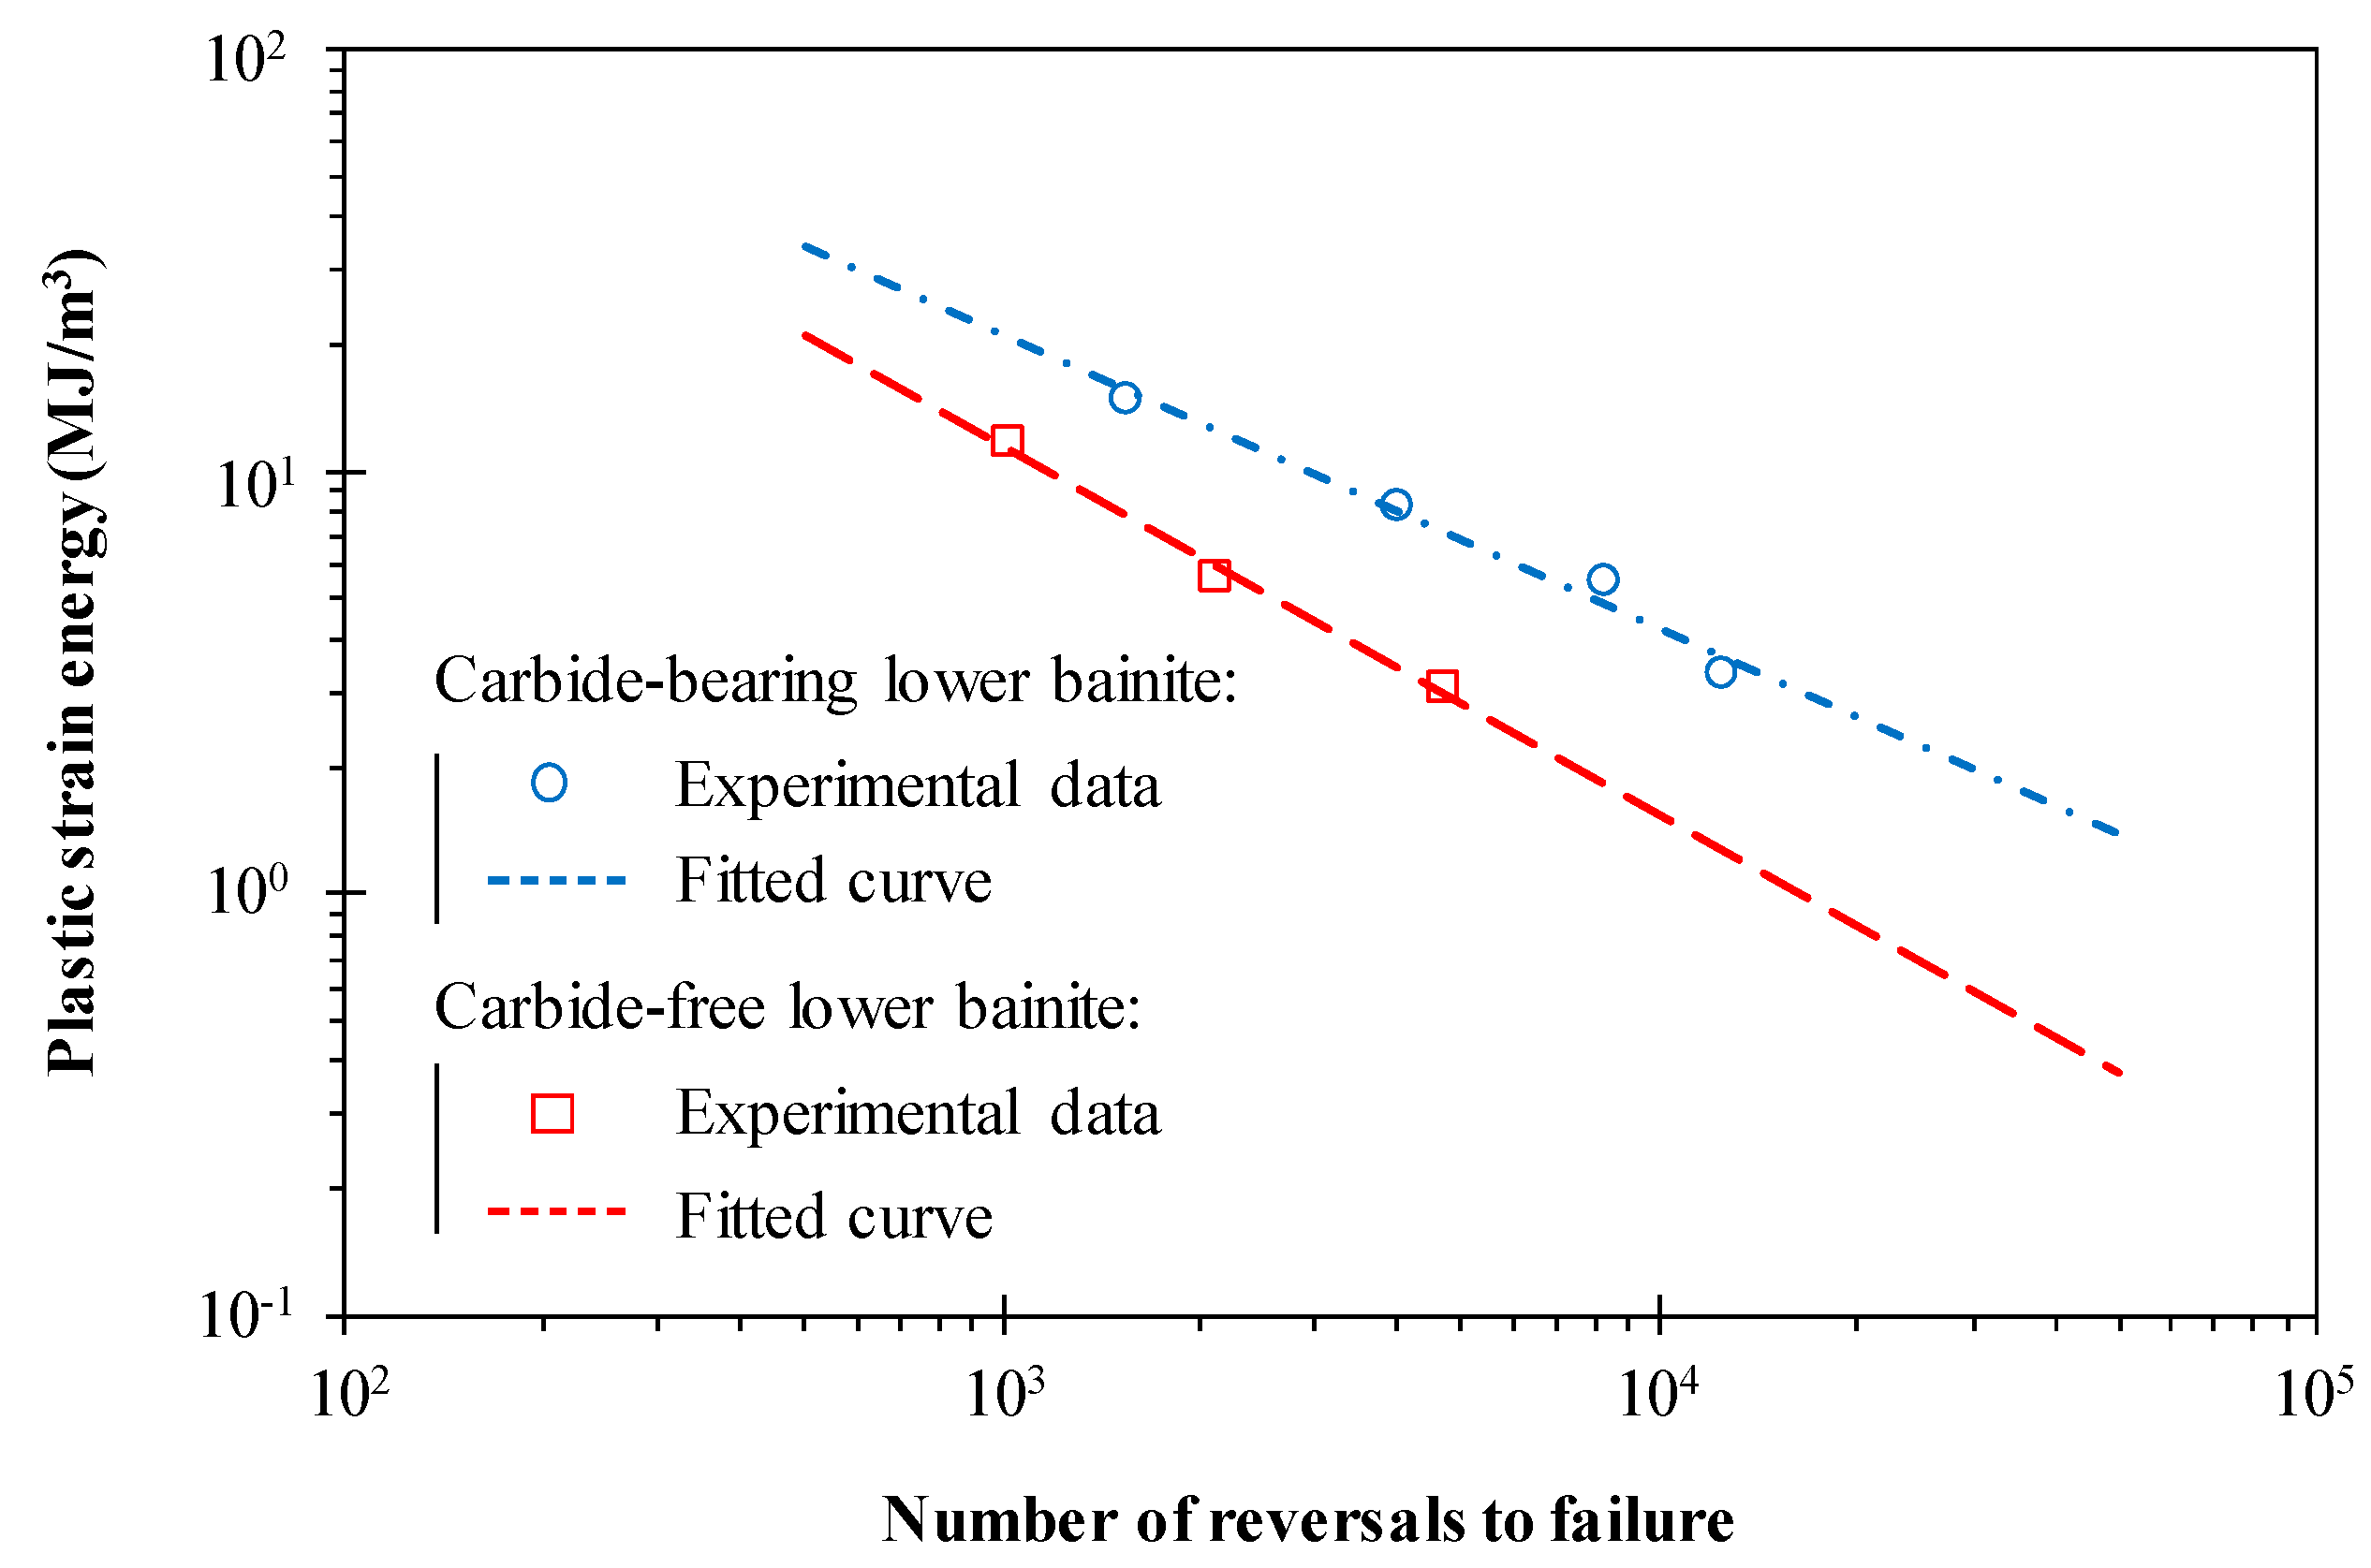
Figure 8 plots the plastic strain energy density that was evaluated from the mid-life hysteresis loops against the number of cycles to failure for the carbide-bearing and carbide-free bainitic steels. In a log-log scale, the relationship between these variables can be described by a straight line, i.e.,
where κ
p and α
p are two unknowns determined from the experimental data. The constants were calculated via the least square method and are summarised in
Table 6. Not surprisingly, there is a strong correlation between these two variables. This demonstrates the adequacy of such a variable to account for the fatigue damage based on the energy dissipated [
18,
19].
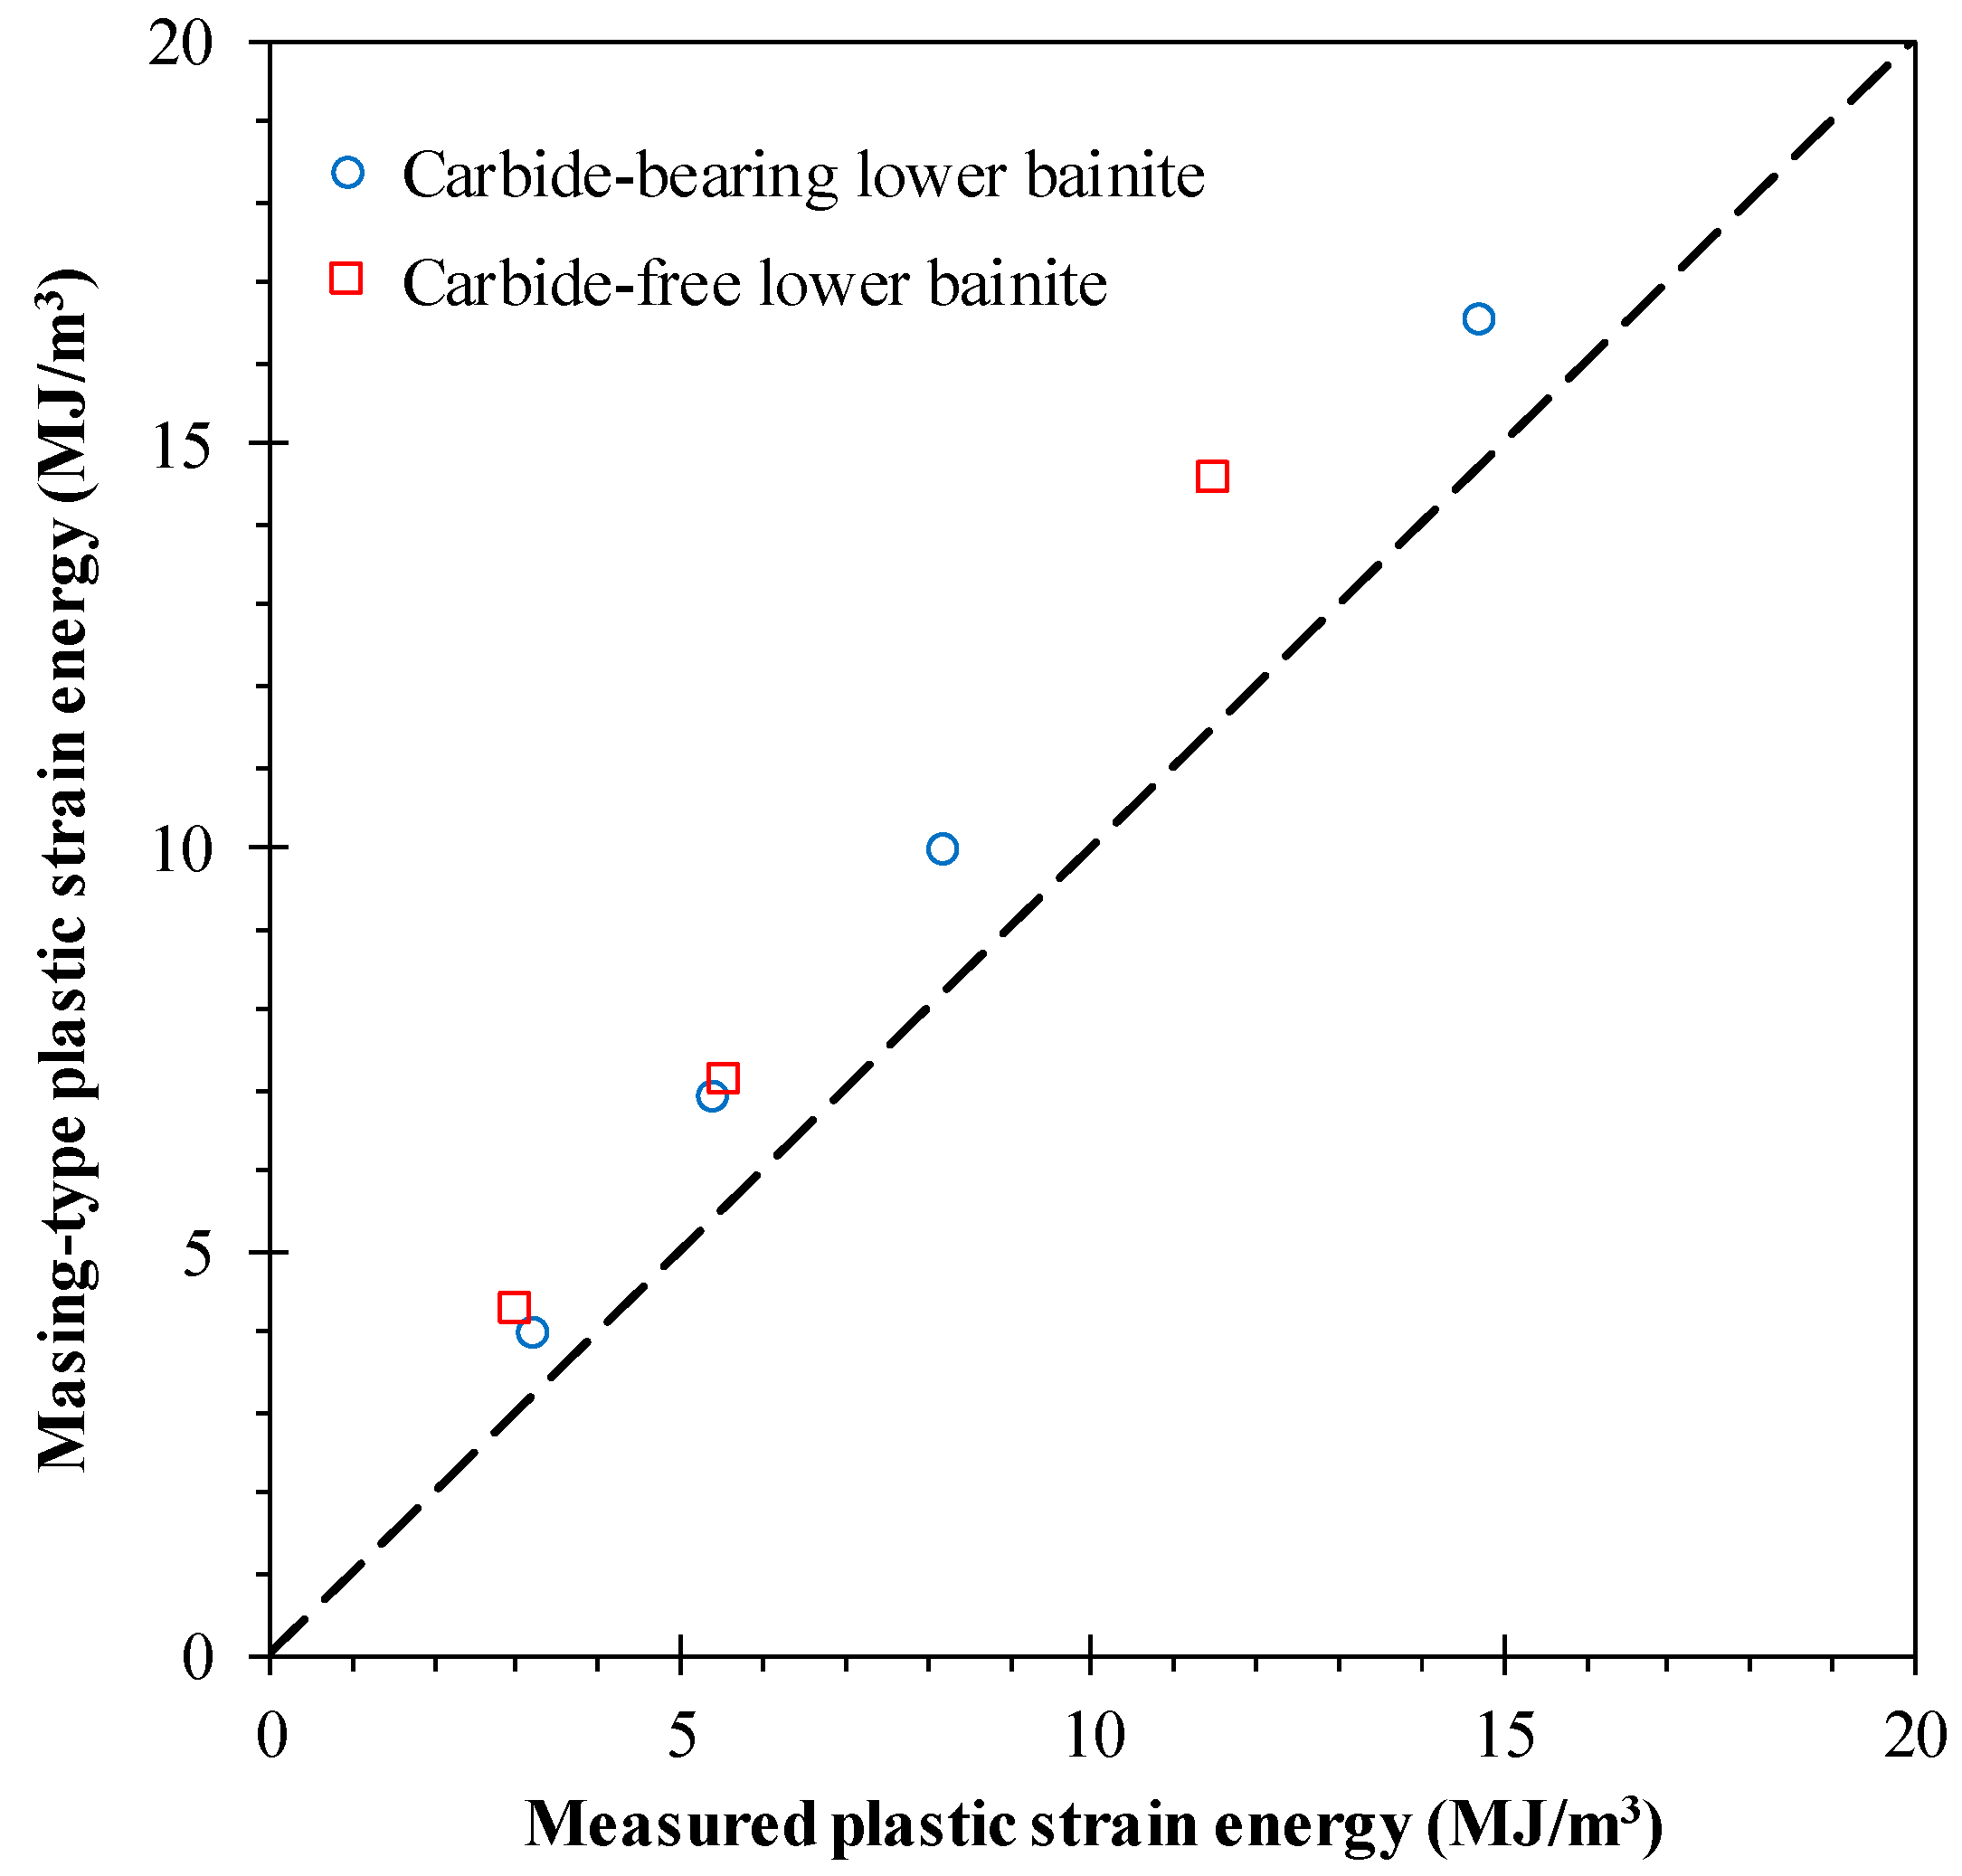
The plastic strain energies measured in the experiments are compared in
Figure 9 with those of Masing-type materials, defined as follows:
where Δε
p is the plastic strain range, Δσ is the stress range, and
n’ is the cyclic hardening exponent. The experimentally measured values (Δ
Wp) are relatively far from those of the Masing-type materials (Δ
WpM) for both the carbide-bearing and carbide-free bainitic steels, and the differences increase with the strain amplitude, irrespective of the tested steel. This outcome is in line with the conclusions drawn from
Figure 4.


