4.3.1. Turning Process
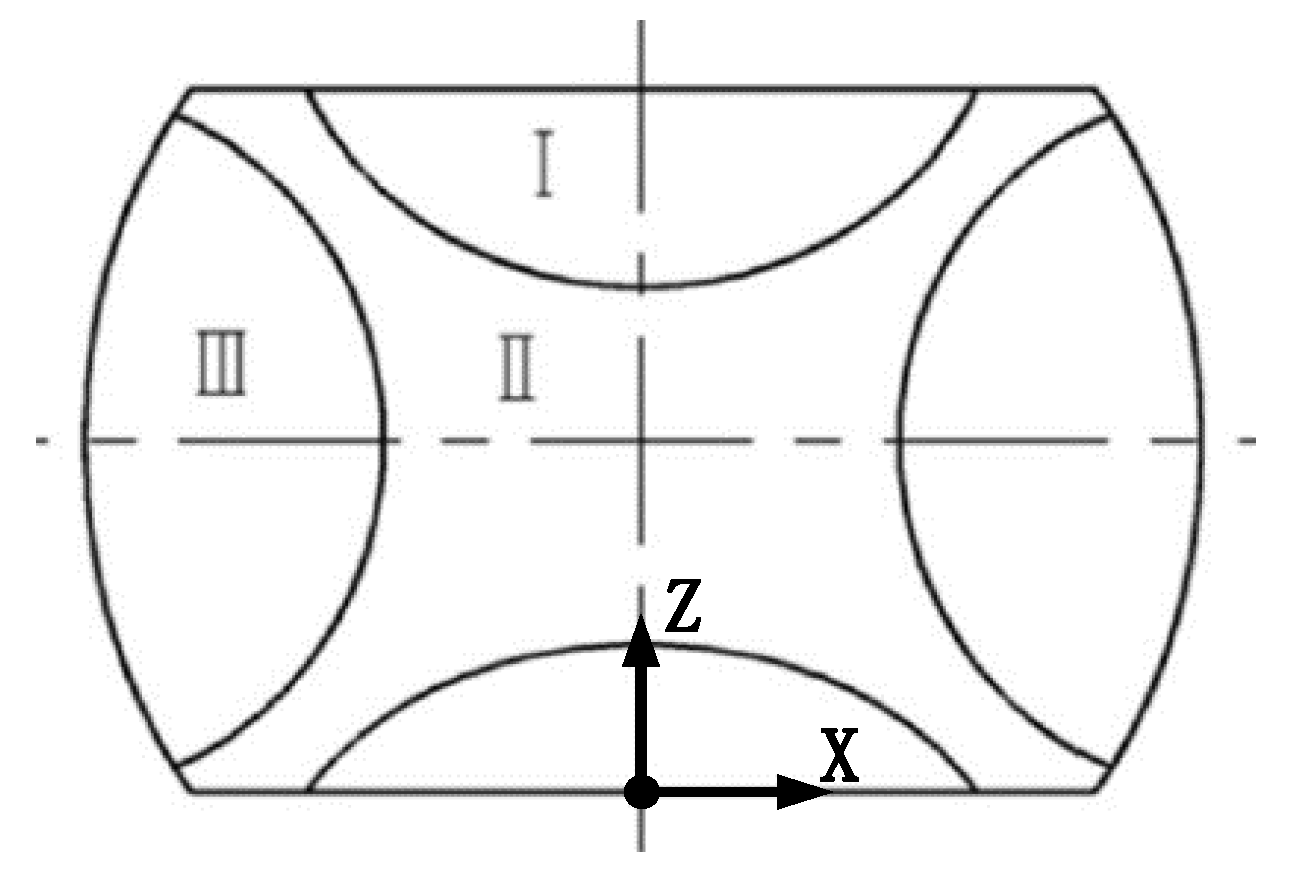
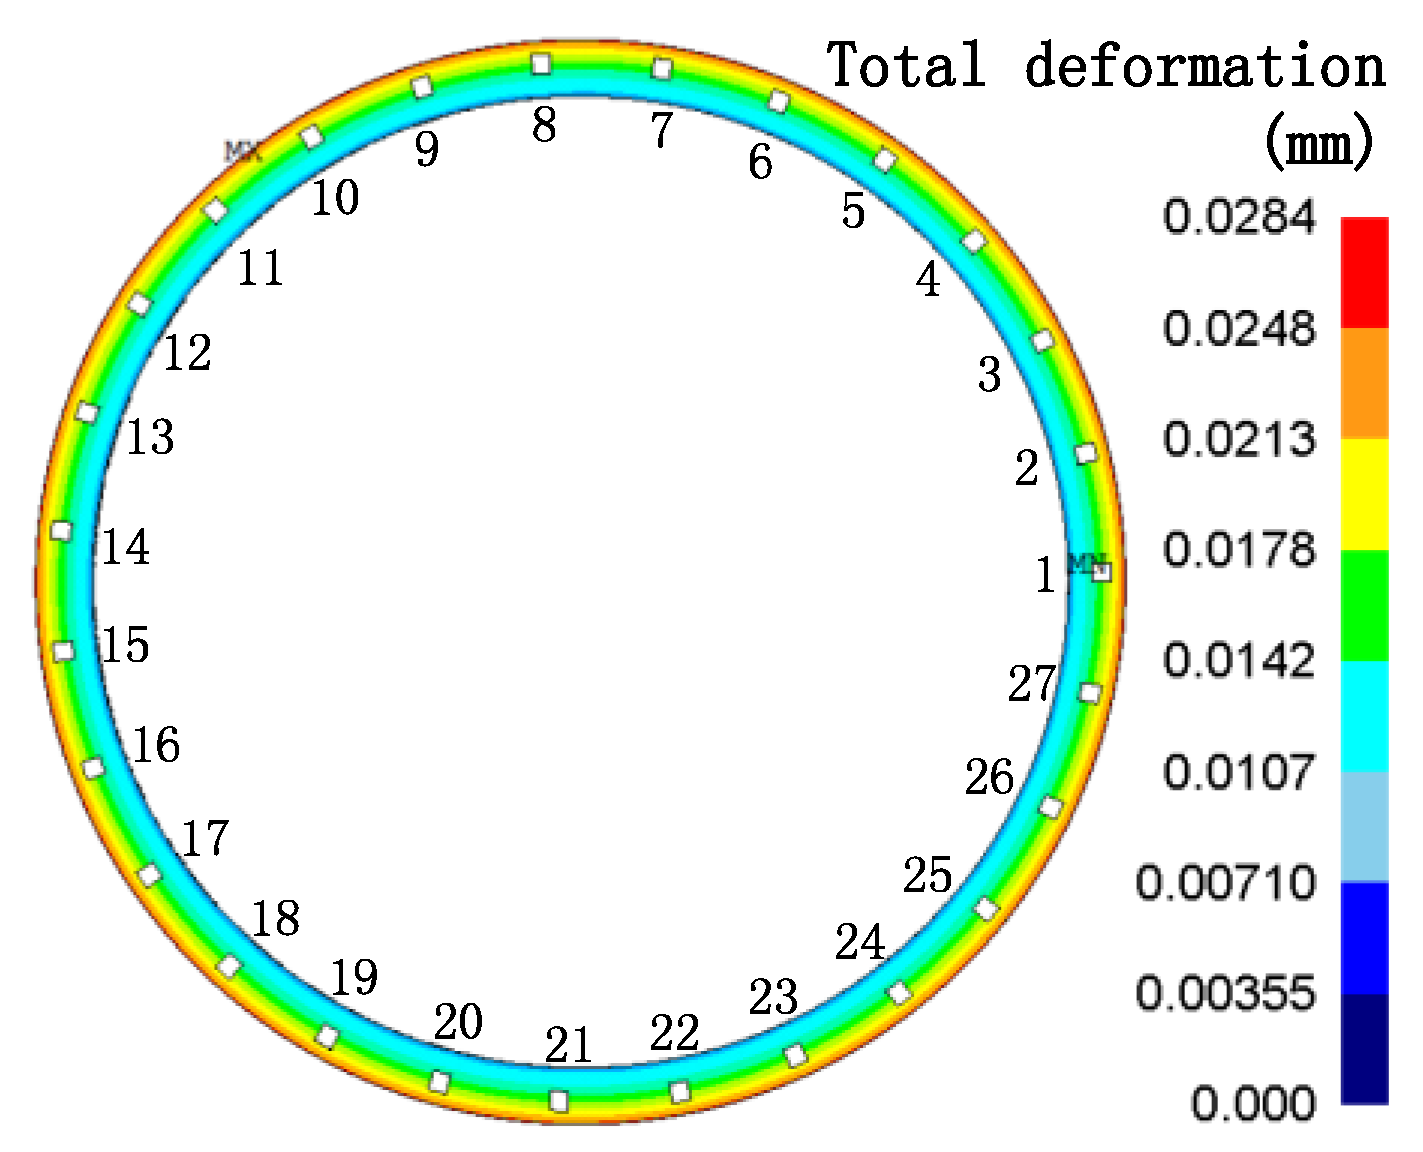
Further study was focused on the deformation and PE variation during turning. During the simulation of machining, the allowance to be removed was separated into ten zones at a radial section of the blank, as illustrated in
Figure 15. Nine zones were removed. The remainder of workpiece was the aero engine case.
In the machining process, the material removal resulted in the release of residual stress and strain. The different sequences of the material removal had different effects on deformation [
11]. Therefore, there could be an optimal process, in which the FIRS and strain energy show faster release during rough machining compared with other processes. In other words, when the material removal volume is equal in different process strategies, the optimal process will produce the largest reduction in strain energy.
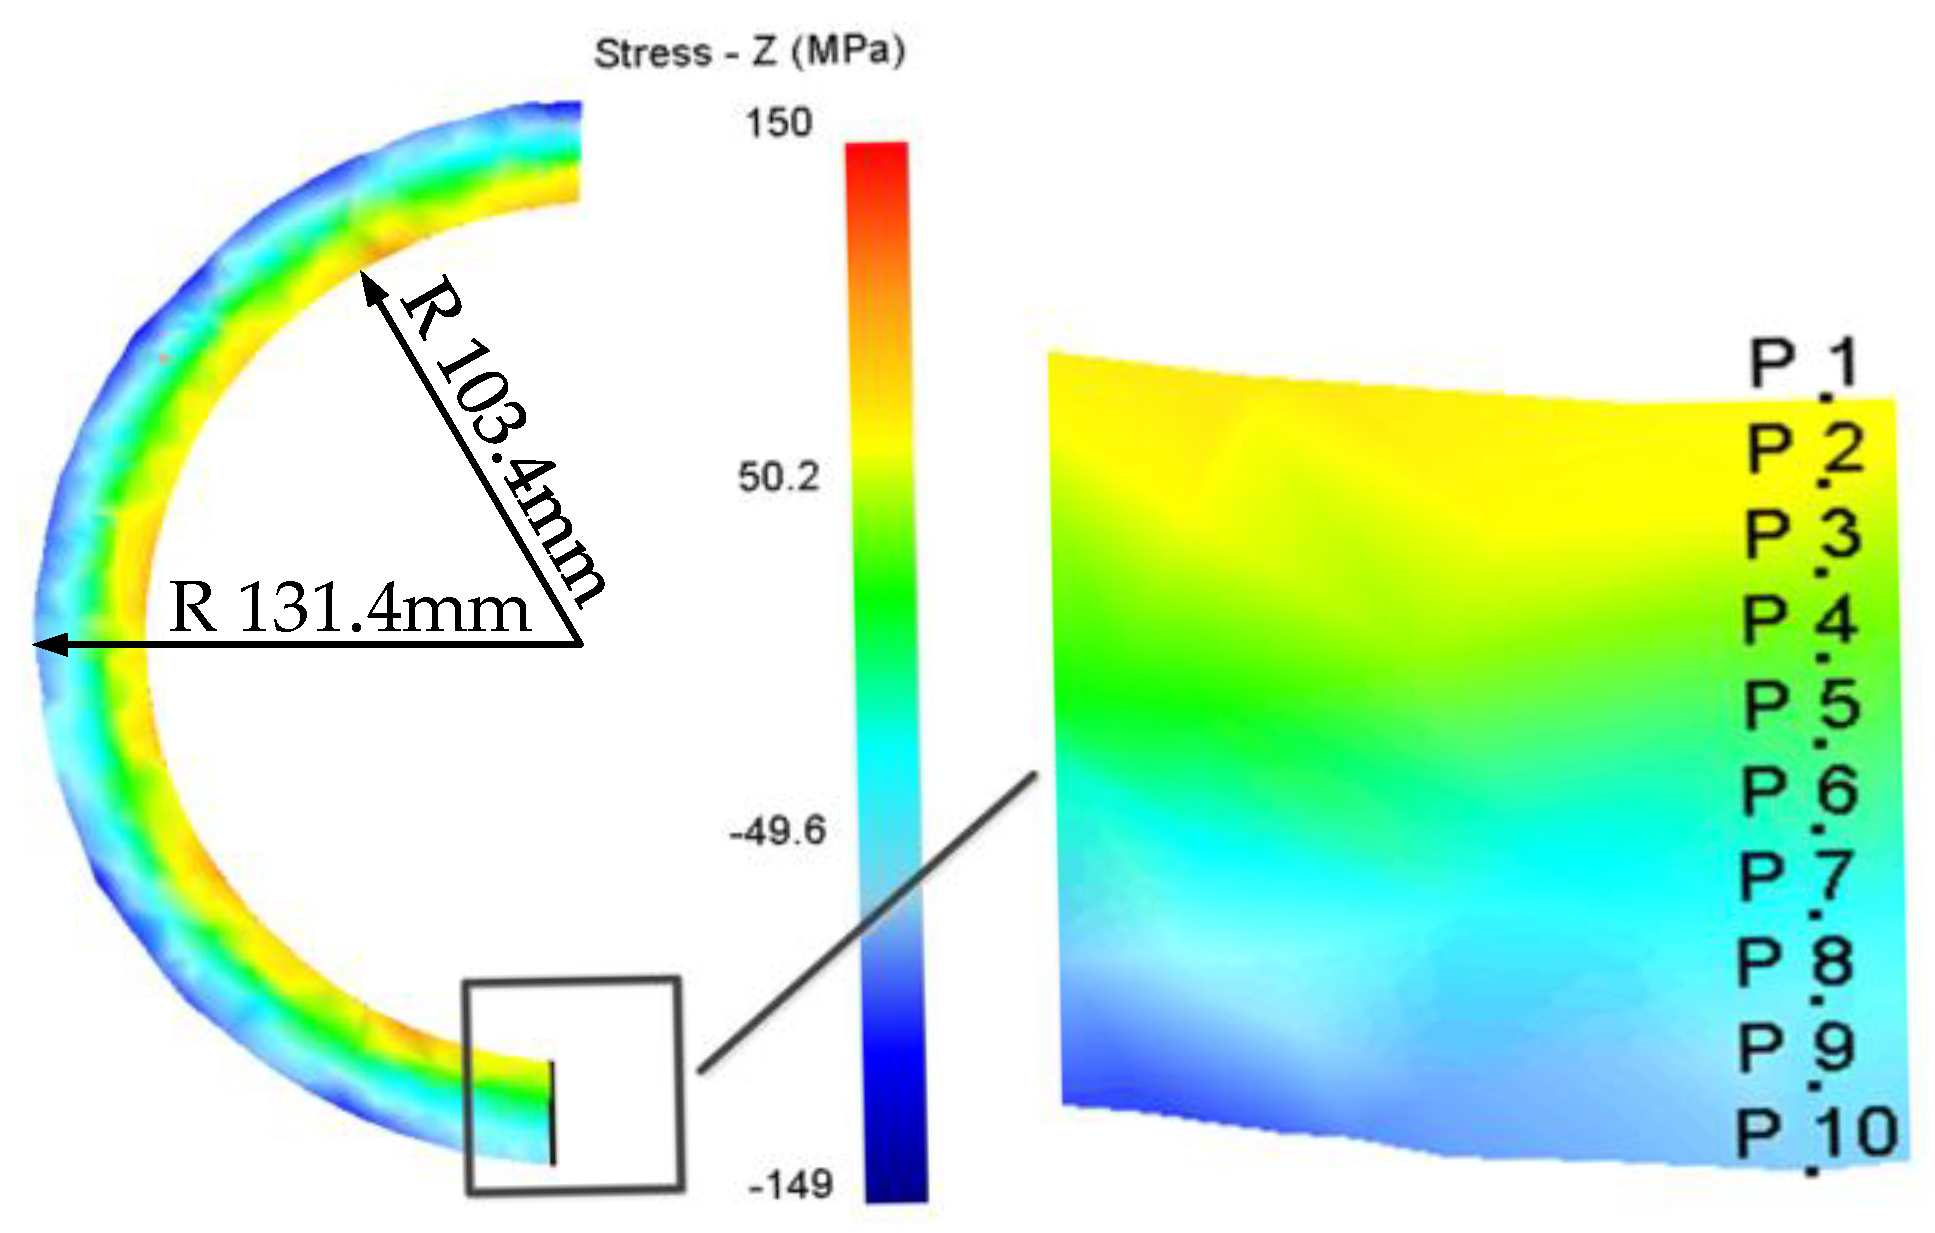
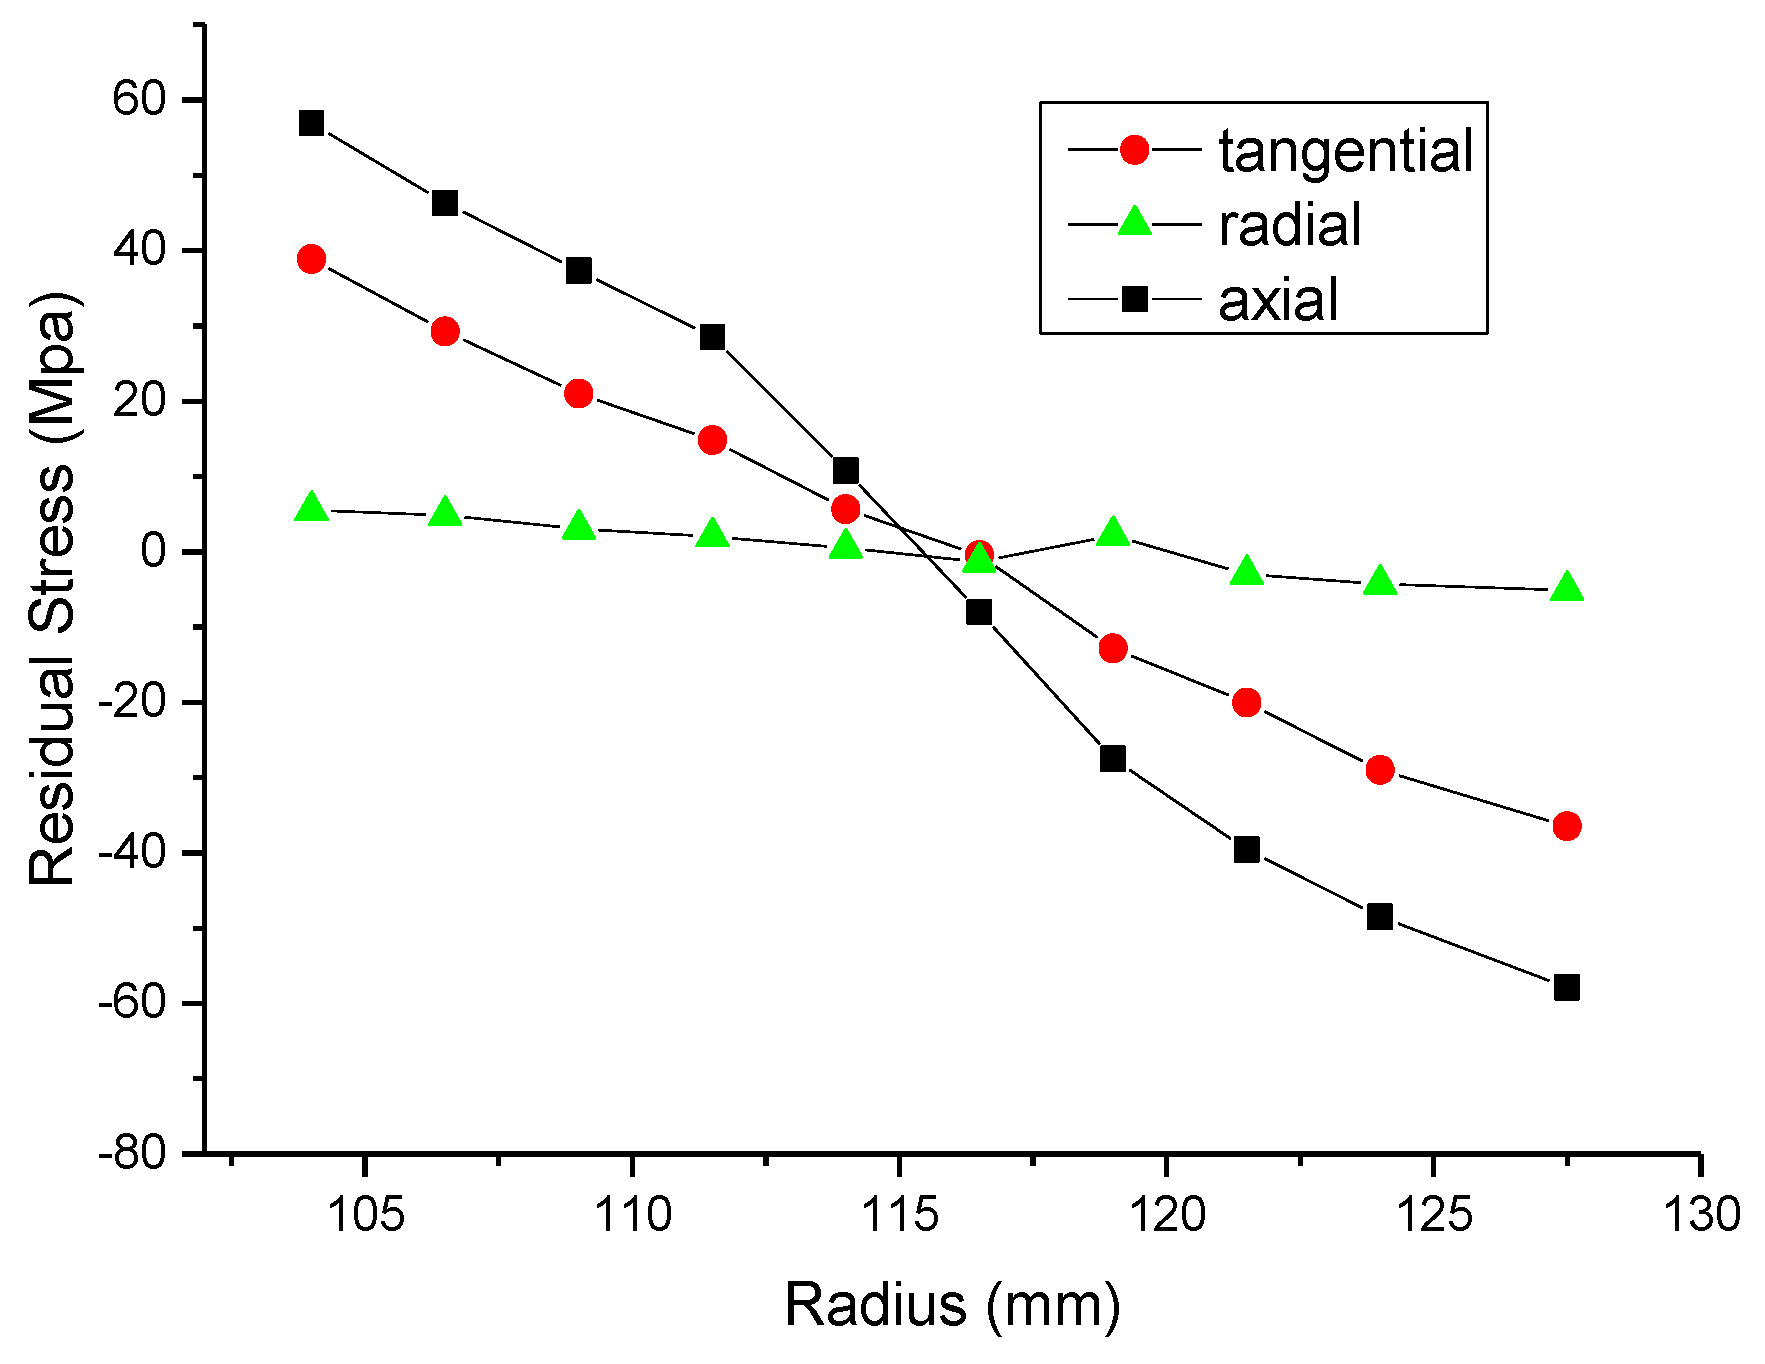
In the FE simulation, FIRS and MIRS were applied to the model. The FIRS was asymmetrically distributed in the radius direction. The surfaces of the outer circle generated compressive residual stress and the inner circle generated tensile stress, as shown in
Figure 8. A layer of MIRS was generated in the machining process. The thickness of each layer was 150 μm. The stress distribution was detailed in
Section 3. The strain energy and deformation were obtained by FEM.
During the simulation of machining, the original process (the order of material removal was 1-2-3-4-5-6-7-8-9) and the optimized process (1-2-3-4-8-9-5-6-7) were compared.
Figure 16a–d and
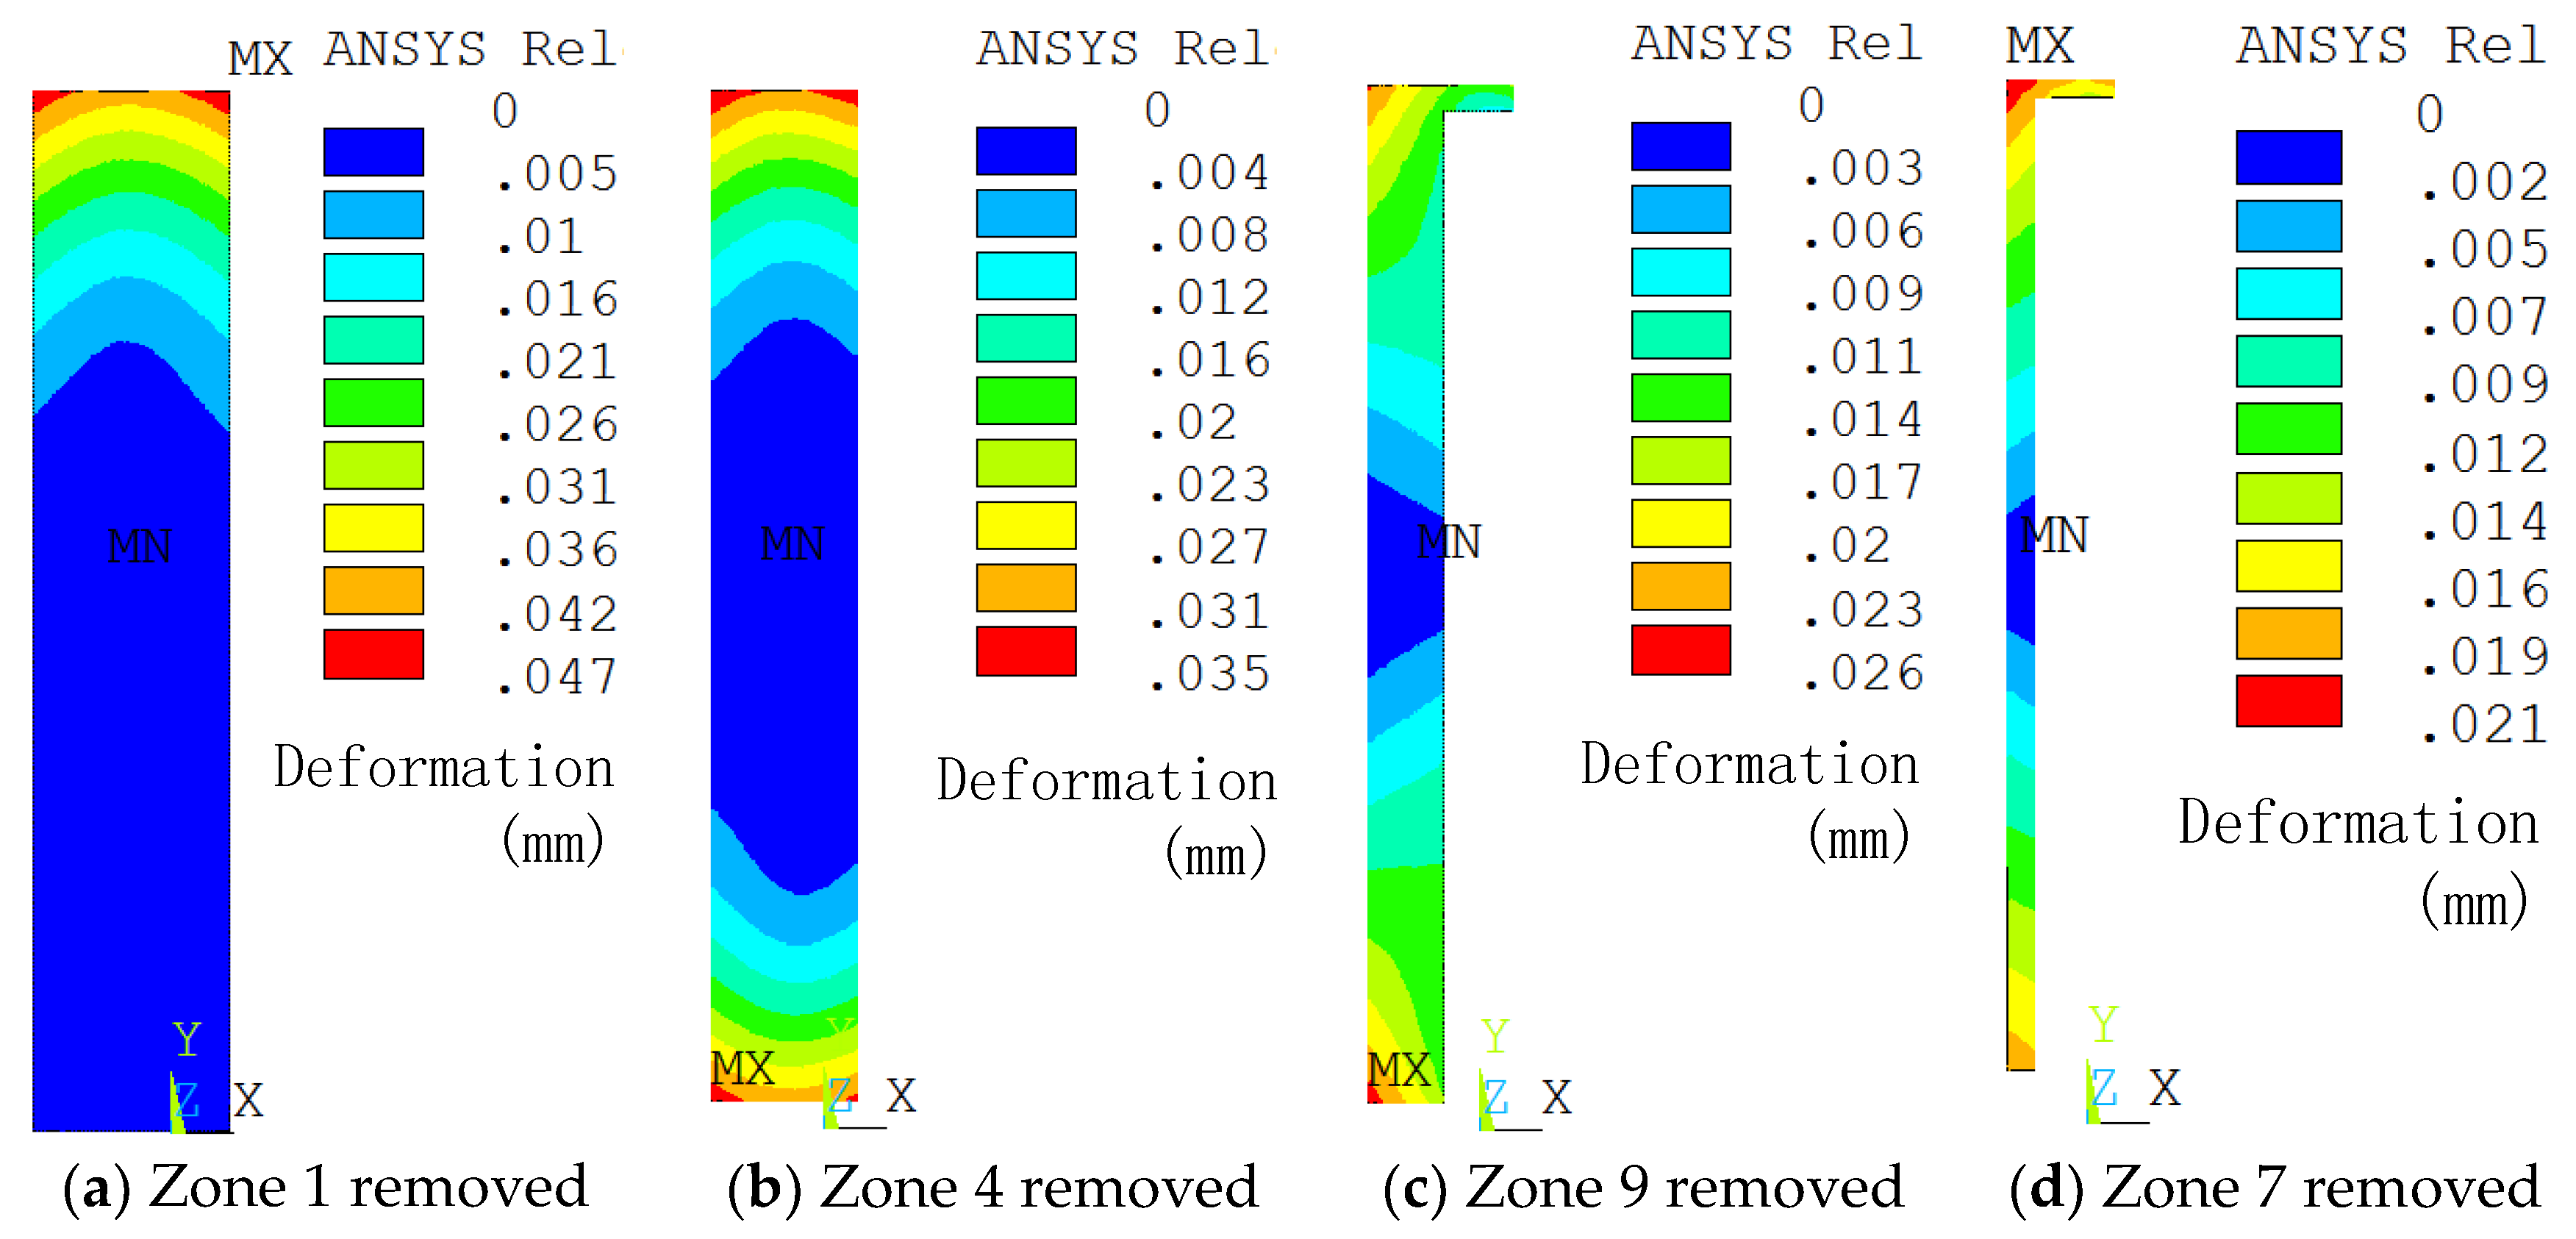
Figure 17a–d present the total deformation of the part as the proportion of material removed varied, which provides beneficial information for studying the effect of strain energy in removed material on the distortion. To further investigate the relationship between strain energy and part distortion in the turning simulation, the maximum deformation was selected as the research object.
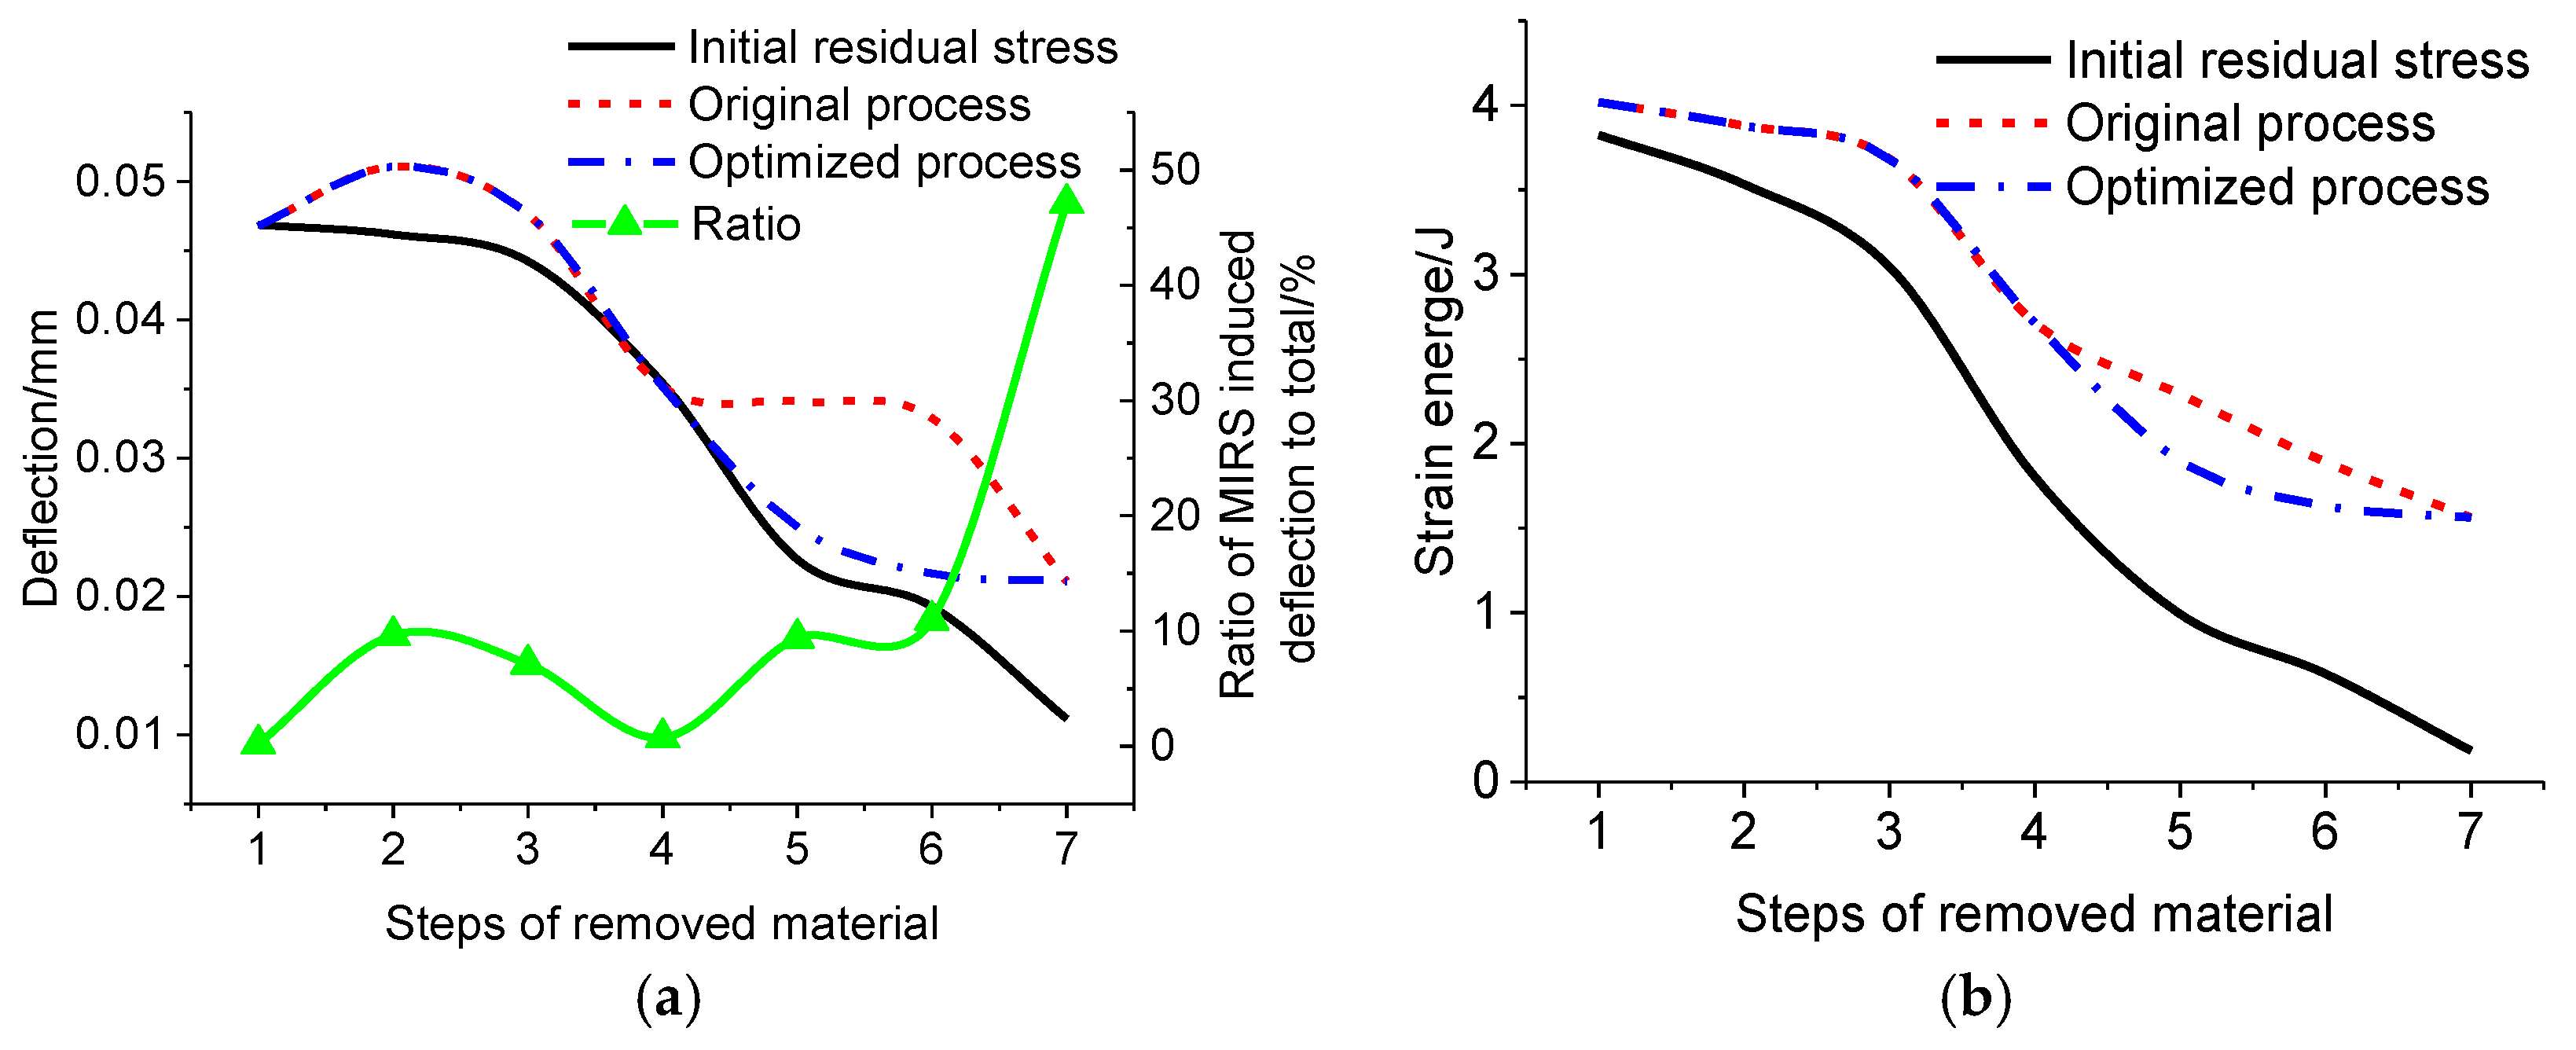
Figure 18 presents the maximum deflection and strain energy as a function of the removal sequences. The solid curve represents the effect of FIRS on the deflection and strain energy without MIRS. The dash line represents the deflection and strain energy with FIRS and MIRS during the original process. The dash-dot line represents the deflection and strain energy with FIRS and MIRS after optimized processing. As illustrated in
Figure 18a, at the beginning of the material removal, the first material removed (Zones 1 & 2) was the upper end and inner circle of the ring respectively. The total deformation increased with the growth of material removal; meanwhile, the deflection reached a maximum value of 0.051 mm after removing Zone 2. The removal of tensile stress Zone 2 resulted in the deformation of the ring. In the optimized process, when the compressive stress in Zones 4, 8 and 9 was removed, reverse deformation resulted, so that the deformation of the ring decreased from 0.051 to 0.025 mm. The results are shown in
Figure 17b,c. As shown in
Figure 17d, the distortion was stable at the end of the process (i.e., Zones 5, 6 and 7), which eventually reached 0.021 mm. For the original process, the removal of tensile stress Zones 5, 6 and 7 occurred prior to the machining of compressive stress Zones 8 and 9, as shown in
Figure 16c,d, so the deformation suddenly dropped down to 0.021 mm at the end of the turning (i.e., Zones 8 & 9). The sudden decrease at the end of the process would have badly disturbed the deformation control, since no sufficient allowance could be removed to correct the form error. Thus, the optimized process firstly cut away the zones of compressive residual stress from the workpiece and then removed the zones of tensile residual stress, which was better for deformation control.
As shown in
Figure 18a, the solid line with triangles stands for the ratio of MIRS-produced deformation to the total deformation. In the beginning (i.e., Zones 1 and 2), the material removal added to the newly finished surface. The layer of MIRS was generated in the finished surface. So, the ratio climbed to 9.6% with the growth of material removal. The machining of Zones 3 and 4 induced by MIRS resulted in reverse deformation compared with Zones 1 and 2. Therefore, the ratio decreased. When more material was removed, the workpiece stiffness reduced. The MIRS-induced deformation increased, but the total deformation decreased. Consequently, the ratio reached 47.1% at the end of process. Therefore, FIRS and MIRS significantly affect deformation. In the beginning of process, the FIRS played a leading role. Along with the decrease in the stiffness of the workpiece, the MIRS gradually became the dominant effect.
In terms of strain energy, the total potential energy, , was the sum of the initial strain energy within the forging blank of an aero engine case, , and the machining-induced strain energy, , stored in the deformed body. The strain energy obtained via FEM was the minimum potential energy in each process. Specifically, in the beginning (i.e., Zone 1 to Zone 3), the strain energy in the remaining material slowly dropped. During the optimized process, when the material from Zones 4 and 8 was removed, there was a rapid decline in strain energy. However, in the final stage (Zone 5 to Zone 7), the declined slightly. The strain energy in the original process showed a slower decrease compared with the optimized process. There is a downside to this: the more strain energy the workpiece stored, the more unstable the workpiece became. So, when the material removal volume was equal, the storage of less strain energy in the workpiece symbolized a better optimized process. The strain energy of the optimized process remained below the original process from the fifth to the seventh step. So, the optimized process was better than the original one.
As illustrated in
Figure 18b, the difference between the two curves (the solid curve and the dash-dot one) was the machining-induced strain energy (
). As material removal increased, the initial strain energy,
, was reduced, but
increased. According to Equation (7),
increased when there was a rise in the volume of material removal. In other words, the more material removed, the larger the ratio of machining-induced strain energy to total strain energy. As illustrated in
Figure 18, the curves of deformation and strain energy were very alike.
In regard to the deformation and strain energy, their fluctuation and stability were two important factors used to judge the quality of the processes. The machining process included seven steps, as illustrated in
Figure 18. The average differences in the adjacent data points for the two processes are listed in
Table 3. The optimized average difference was 31% of the original average difference from the fifth to seventh step. Therefore, for the optimized process, the deformation was more stable at the end of the process which would benefit the deformation control.


