Article

Characterization of Deformation Mechanisms in Mg Alloys by Advanced Acoustic Emission Methods

1
Department of Physics of Materials, Faculty of Mathematics and Physics, Charles University, Ke Karlovu 5, 121 16 Prague 2, Czech Republic
2
Laboratory for Neutron Scattering and Imaging, Paul Scherrer Institut, 5232 Villigen, Switzerland
3
The Czech Academy of Sciences, Nuclear Physics Institute, Řež 130, 250 68 Řež, Czech Republic
*
Author to whom correspondence should be addressed.
Metals 2018, 8(8), 644; https://doi.org/10.3390/met8080644
Submission received: 31 July 2018 / Revised: 14 August 2018 / Accepted: 14 August 2018 / Published: 16 August 2018
(This article belongs to the Special Issue Advances in Acoustic Emission Testing of Metals and Alloys)

Abstract

:
Adaptive sequential k-means (ASK) analysis of acoustic emission (AE) data was used to analyze the sources of AE during compression of three AZ31 magnesium samples with different initial texture. The results were compared to the classical hit-based approach. Observation of the deformed microstructure shows that the ASK analysis can distinguish very well between the signal originating in deformation twinning and dislocation slip. Moreover, together with microstructural analysis, the ASK algorithm revealed another source of AE for one of the samples, which was shown to be the double twinning.

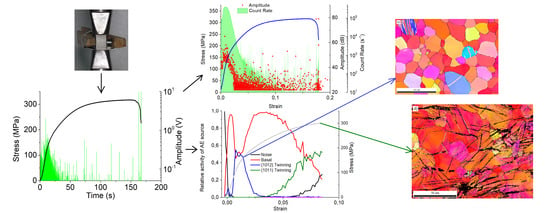
Graphical Abstract

1. Introduction

1.1. Magnesium Alloys

Magnesium alloys represent the lowest-density structural metals (along with toxic beryllium) and are, thus, a highly perspective material for modern applications. Moreover, by alloying magnesium, it is possible to obtain a combination of outstanding mechanical properties, biocompatibility, and increased corrosion resistance [1,2]. The hexagonal close-packed structure causes a complex deformation behavior in magnesium alloys, where a concurrent activity of several deformation mechanisms is necessary. The activity of an individual deformation mechanism is strongly dependent on the texture, alloying elements, or temperature.
Generally, the slip system with the lowest critical shear stress is the ( 0002 ) 11 2 ¯ 0 basal slip, followed by the { 10 1 ¯ 0 } 11 2 ¯ 0 prismatic slip. Together, they provide only four independent slip systems and none of these provides deformation in the c direction. To ensure the compatibility of the plastic deformation, another deformation mechanism has to be activated. The possibilities are { 11 2 ¯ 2 } 11 2 ¯ 3 2nd order pyramidal slip (which requires high stress or temperature) or deformation twinning [3].
Twinning is a change in the orientation of part of the grain. The parent grain and the twin have a symmetrical orientation along the twinning plane. This results in a significant change in the crystallographic texture during deformation. There are several differences between dislocation slip and twinning. Unlike dislocation slip, twinning is a polar mechanism (unidirectional), which results in the activation of twinning in different grains during compressive and tensile loading. Twinning can only accommodate a limited amount of deformation, and when the twinning is exhausted, another deformation system (dislocation slip or secondary twinning) has to be activated.
The most common twinning system in magnesium alloys is extension twinning on the { 10 1 ¯ 2 } twinning plane. Extension twinning means that elongation is caused along the c-axis. Other twinning mechanisms observed during deformation of magnesium alloys are { 11 2 ¯ 2 } extension twinning and { 10 1 ¯ 1 } and { 11 2 ¯ 1 } compression twinning [4].
The probability of the activation of a particular slip system depends strongly on the mutual orientation of the loading direction, slip plane, and slip direction and the critical resolved shear stress (CRSS), τ [5]. The orientation dependence is characterized by the Schmid factor (SF), m , which is defined by the cosine of the angle between loading axis and normal to slip plane (φ), and the cosine of the angle between loading axis and slip direction (λ):
m = cos φ cos λ .
For the dislocation slip, m reaches values between 0 and 0.5, and for twinning it reaches values from −0.5 to 0.5. The higher the value of m is, the more favorable is the orientation for a given deformation mechanism.

1.2. Acoustic Emission

Acoustic emission (AE) has been established as a powerful non-destructive technique for the study of deformation mechanisms [6,7,8]. It provides information about the dynamic processes during plastic deformation or corrosion processes from the entire sample volume. The sources of AE have generally different physical characteristics; however, the signal is modulated by the sample shape, microstructural characteristics, or characteristics of the sensor. Moreover, several sources of AE are usually concurrently active; therefore, it remains a challenging task to separate the AE signal from the different types of sources [9,10].
The classical approach for the evaluation of AE data, the so-called hit-based processing, is based on a set of parameters which define the AE event (threshold level, hit definition time, etc.) [11]. The computer-controlled system stores the characteristics of individual AE events (amplitude, frequency, counts, energy, etc.). In materials science, this approach can be successfully applied for general characterization, when the main goal is to investigate the influence of the experimental and material parameters on the deformation behavior (e.g., [12,13]). However, there are several drawbacks of this approach. The results are strongly dependent on the AE event individualization parameters. The continuous AE stream is not taken into account, and the signals below the threshold level are lost. This can partly be solved by recording the complete AE streaming dataset, which can be further used for post-processing. Different parameters can then be set, for example, to discriminate between strong and weak AE signals.
The frequency spectra-based analysis, where the characteristic features of the AE waveforms in the frequency domain are investigated, can help to discriminate between different sources of AE [14]. In this work, we applied the Adaptive sequential k-means (ASK) algorithm of Pomponi and Vinogradov [15,16]. With this method, an entire acoustic emission dataset is recorded and stored for post-processing. Data are not evaluated in the form of AE events, but are sectioned into consecutive individual realizations (“frames”) with length on the order of ms, and the power spectral density (PSD) function, G ( ω ) is calculated for each frame by computing the discrete Fourier transformation:
G ( ω ) = | t = t 0 t 1 f t e 2 π i t ω | 2 ,
where t0 and t1 are the time boundaries of a selected frame and ω is the AE signal frequency in the range from 0 to fs/2, where fs is the sampling frequency. Each consecutive frame is then compared to already evaluated frames and assigned either to the already existing cluster of frames, or to a newly created cluster. Discrimination between the signals coming from different sources is done on a statistical basis. For a more detailed description of the algorithm, see Ref. [15,16]. As a result, we determine the dominant source of AE in a given frame. However, it must be noted that the activity of other (weaker) sources within the time frame cannot be excluded. The AE energy E = 0 f s / 2 G ( ω ) d ω or mean frequency f m e a n = ( 0 f s / 2 ω G ( ω ) d ω ) / E can be calculated from the PSD function.

2. Materials and Methods

The deformation tests were performed on a rolled AZ31 (3 wt.% Al, 0.8 wt.% Zn, 0.2 wt.% Mn) magnesium alloy sheet. The coordinate system related to the sheet was the rolling direction (RD), the normal direction (ND)–out of the sheet plane, and the transverse direction (TD). For the deformation tests, samples with dimensions of 10 × 6.5 × 6.5 mm3 were cut from the sheet. The samples were cut in three different directions: (1) ND, (2) 45° (between RD and ND), and (3) RD, in order to obtain crystallographic textures (Figure 1), which will be further related to the observed deformation mechanisms. The sheet exhibited a typical strong basal texture in ND.
In order to discuss the active deformation mechanisms, SF for basal, prismatic, and 2nd order pyramidal slip, and { 10 1 ¯ 2 } extension and { 10 1 ¯ 1 } compression twinning were evaluated. The CRSS values had to be taken into account. The comparison of SF for given deformation mechanisms is as follows: basal slip ≅ { 10 1 ¯ 2 } twinning < prismatic slip << 2nd order pyramidal ≅ { 10 1 ¯ 1 } twinning [17]. This means that the other mechanisms were expected to be active only if the orientation was not suitable for basal slip or extension twinning. The initial texture was taken from the EBSD maps containing more than 16,000 grains.
The probability density functions (PDF) of SFs for each orientation are shown in Figure 2. The RD sample was well oriented for twinning (the median value of SF is 0.43) and basal slip was also expected to be active. Sample 45 was well oriented for basal slip (SF median value 0.43); extension twinning was also not excluded. The ND sample was unfavorably oriented for extension twinning (only 7.4% of grains had positive SF); basal slip was expected, but SF had a relatively low median value of 0.3. Prismatic slip was also not expected to contribute significantly; therefore, the activity of the 2nd order pyramidal slip or { 10 1 ¯ 1 } compression twinning was necessary.
The samples were deformed using a universal deformation machine Instron 5882 (Instron, Boston, MA, USA) at a strain rate of 10 3   s 1 . The AE response was recorded using a computer-controlled PCI-2 device from the Physical Acoustic Corporation (PAC, New York, NJ, USA). The threshold level for the hit-based detection was set to 22 dB, slightly above the background noise, which is mostly a combination of intrinsic electronic background noise and the noise of the transducer and the amplifier [18]. One PICO-200-750 KHz (PAC, New York, NJ, USA) lightweight miniature AE sensor with integral coaxial cable (∅ 5 mm, height 4 mm) was mounted on the side of the sample using vacuum grease and a wooden clip. This setup provided constant pressure during the experiment (Figure 3). A PAC 2/4/6 preamplifier set to provide a gain of 60 dB in the frequency band 100–1200 kHz was used. The complete AE data (data streaming) were recorded with the sampling frequency of 5 MHz. Data were evaluated using the classical hit-based approach as well as the ASK analysis. The same set of clusters with identical statistical characteristics (as determined in the first analysis) was used for all analyses in order to ensure consistency of results.
The microstructure of deformed samples was investigated by a light microscope Olympus GX 51 and a scanning electron microscope (SEM) ZEISS Auriga Compact (ZEISS, Oberkochen, Germany) equipped with an electron backscatter diffraction (EBSD) detector (EDAX, Mahwah, NJ, USA). The samples were deformed up to 1% of plastic deformation and up to the fracture in order to investigate the deformed microstructure. The samples for metallography were first grinded, then polished down to 1 μm using a diamond paste, and finally electrochemically polished by the Struers Lectropol device. Etching with a solution of picric acid, vinegar acid, water, and ethanol was used to reveal the microstructure. The samples for SEM were also grinded and polished in the same way, with the final step of ion polishing by the Leica EM RES102 (Leica Microsystems, Wetzlar, Germany) system.

3. Results

The deformation curves in all three directions and the raw AE response are shown in Figure 4. The surface displacement is converted to an electric signal which is amplified to the ± 10 V range. The envelope curve of these electric signals is shown. The yield stress of both the RD and 45 samples was ~88 MPa, whereas the yield stress of the ND sample was ~150 MPa. The RD and 45 deformations curves exhibited the S-shape which is typical of the { 10 1 ¯ 2 } extension twinning, while the curve of the sample in the ND direction had a convex shape. In contrast, the AE response was similar for the ND and 45 directions and much stronger for the RD direction. The AE signal maxima in all three directions were observed around the yield point.

3.1. Hit-Based Evaluation

The AE results evaluated by the classical approach are shown in Figure 5. All the samples exhibited peaks in the count rate and amplitude around the yield point. The RD sample exhibited the strongest AE signal and a wide plateau in the count rate in the latter stages of deformation. Twinning is known to be the main source of AE in Mg alloys and to have a higher energy than basal dislocational slip [10,19], suggesting that twinning was the dominant source of AE up to about 5% of deformation of the RD sample. This explanation is also consistent with the SF calculations (Figure 2). When the AE signal started to decrease, a strong work hardening could be observed on the deformation curves. This is connected with the exhaustion of twinning and the related texture change [20].
The AE amplitudes of the ND and 45 samples exhibited a similar evolution and magnitude. The count rate peak was slightly wider for the 45 sample. These results suggested that the deformation of these two samples was dislocation-dominated, which was again consistent with their SFs (Figure 2). The 45 sample was plastically deformed by the basal slip, resulting in a relatively low yield stress, and the ND sample was deformed by the combination of basal slip and 2nd order pyramidal slip (which requires a much higher CRSS [17]), resulting in higher yield stress.

3.2. ASK Analysis

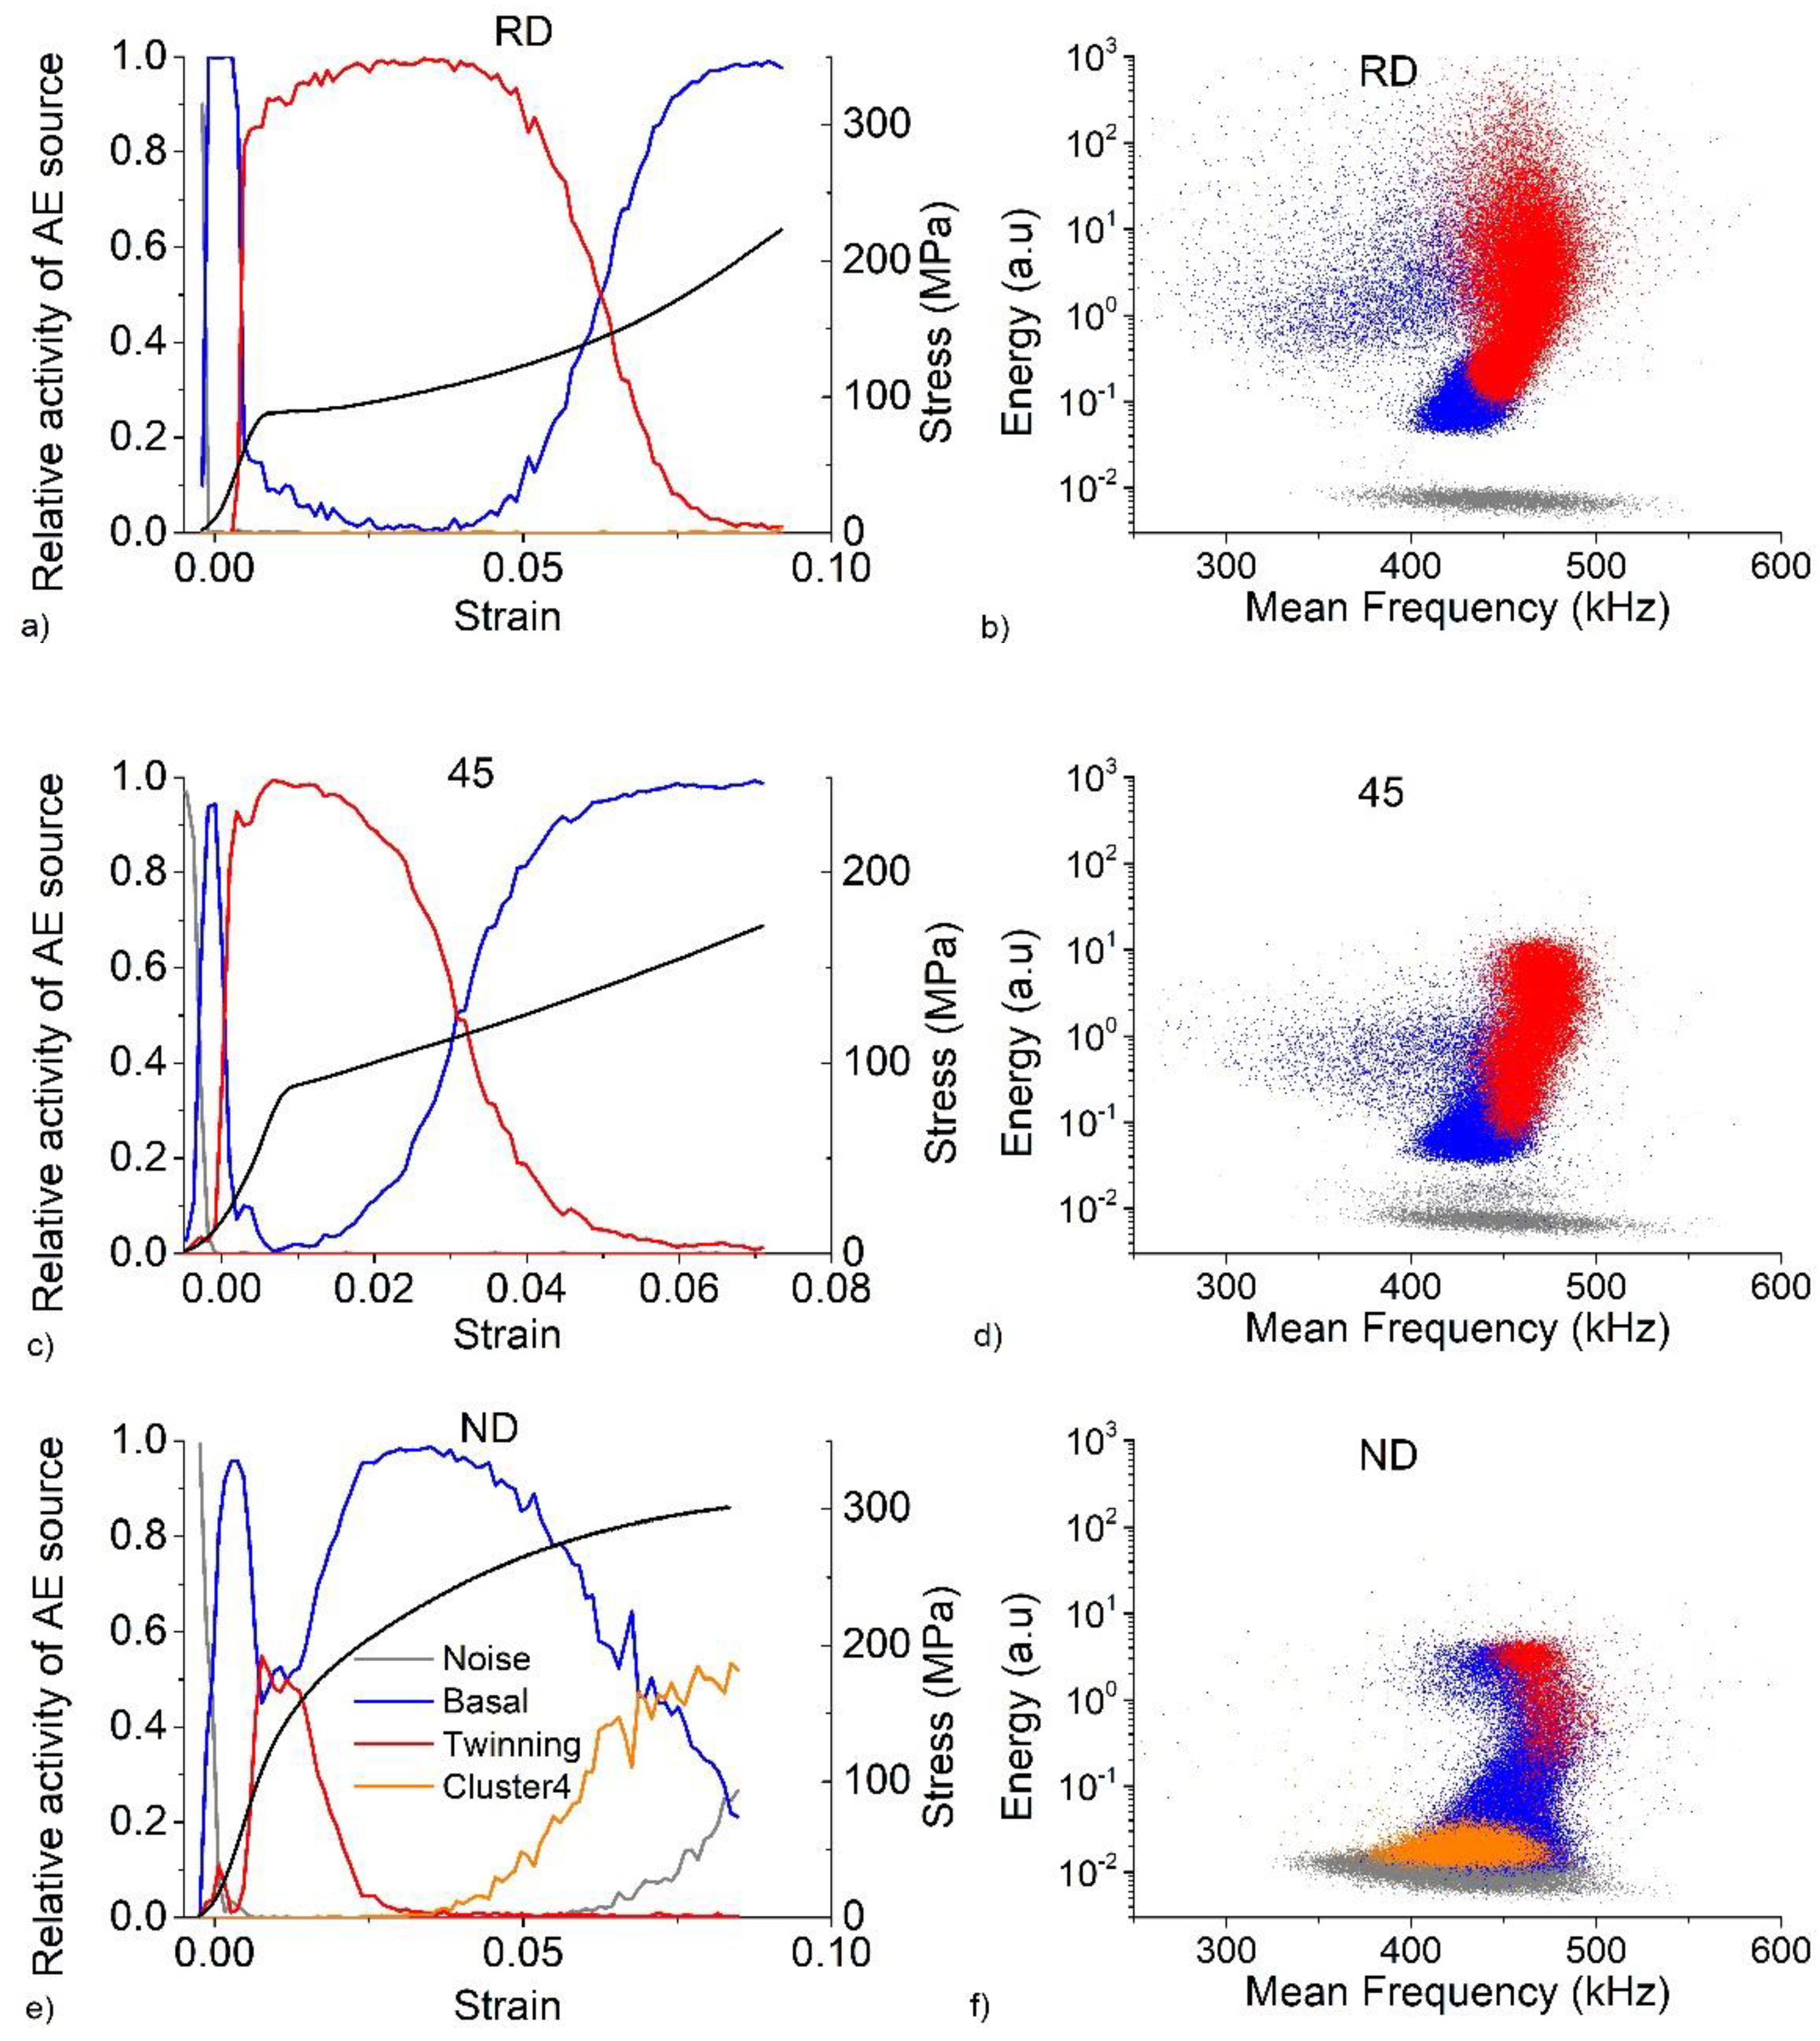
The results of the ASK analysis are shown in Figure 6. Figure 6a,c,e shows the time evolution of the number of frames assigned to each individual cluster. The number of frames is averaged over 1 s and normalized to unity. Figure 6b,d,f shows the projection of the PSD function parameters to the 2D energy vs. mean frequency plot. The ASK algorithm naturally divided the AE signal into four clusters. The first cluster was automatically assigned to the background noise as it was recorded before the deformation test. The second cluster represented the basal slip. It occurred at the beginning of deformation and had a relatively low energy. The third cluster belonged to the extension twinning because it had the highest energy. For more details on the criteria for assigning the AE sources to the clusters, see Ref. [21]. The ND sample exhibited the activity of another source of AE. This source had a relatively low energy and was active at higher stresses. In order to reveal the source of AE belonging to this cluster, the microstructural analysis had to be done.

3.3. EBSD

The deformed microstructure after 1% plastic strain is shown in Figure 7. The RD sample shows a highly twinned microstructure. The twins even propagated through the grain boundaries and created long stripes preferably aligned along the TD direction. The 45 and ND samples showed only a few twinned grains with more twins in the 45 sample, where the twins were also thicker. Using the misorientation analysis, all the twins were identified as { 10 1 ¯ 2 } tensile twins.

4. Discussion

The results for the RD sample were consistent using both AE evaluation methods, the classical hit-based approach and the ASK clustering analysis in the frequency domain. The results suggested that the main deformation mechanism in the RD direction was the { 10 1 ¯ 2 } tensile twinning, which was dominant up to 5% plastic strain. This result is consistent with the fact that tensile twins can accommodate up to 6.4% deformation [4]. The observed microstructure also confirms a large number of nucleated and grown twins. Basal slip was the second active deformation mechanism in the RD sample, which started to be dominant when twining was exhausted. All these data were also consistent with the SF analysis, showing that twinning is the preferential deformation mechanism for most of the grains.
A similar consistency was observed with the ND samples. Both AE analysis methods showed only low activity of twinning. The ASK analysis suggested a small amount of twinning around the yield point, but it was not considered to be the main source of AE, nor the important deformation mechanism. The activity of basal slip was consistent with the SF analysis, which showed that basal slip was the only possible system with low CRSS.
The results for the 45 sample were rather ambiguous. The classical approach showed a similar AE response to the ND sample, but the ASK analysis suggested that the dominant source of AE around the yield point was deformation twinning. On the other hand, the SF analysis suggested basal slip as the dominant deformation mechanism; however, it also did not exclude twinning activity. The microstructure of the 45 sample after 1% of plastic deformation exhibited more twins than in the case of the ND sample, and the twins also appeared to be thicker. Together with the S-shape of the deformation curve typical of extension twinning, these results showed that twinning was an important deformation mechanism, as predicted by the ASK analysis, but not the dominant one.
The ASK analysis also predicted another source of AE during loading of the ND sample, which started to be active around 235 MPa. In order to resolve this source of AE, the ND samples were deformed to two different stress levels, and, thereafter, the microstructure was investigated (Figure 8).
Although the microstructure of the sample deformed to 225 MPa was similar to the ND sample in Figure 7c containing undeformed grains and only a few narrow twins, the sample deformed to 270 MPa exhibited deformed microstructure with a large number of twins. Using EBSD, the twins were identified as { 10 1 ¯ 1 } { 10 1 ¯ 2 } double twins, thus resolving the deformation mechanism underlying the occurrence of Cluster 4 in Figure 6. Although twinning has a generally higher energy of AE, Vinogradov et al. [22] related the energy of AE to the propagation speed of twins. The increased dislocation density caused the presence of internal stresses, which significantly reduced the propagation speed of twins and the energy of the AE signal. The activity of this deformation mechanism was also observed by other authors [23,24].

5. Conclusions

We presented a comparison of the traditional hit-based method for the AE data evaluation and the recently introduced ASK clustering analysis operating in the frequency domain, which were used to investigate deformation mechanisms in AZ31 magnesium alloy with a strong crystallographic texture loaded in three different directions (RD, ND, and 45° (between RD and ND)). The main conclusions are as follow:
  • Both methods were consistent for the RD and ND samples and successfully identified the deformation mechanisms which were shown to be the basal slip and deformation twinning. However, the 45 sample showed some differences. Additional experiments supported the conclusions of the ASK analysis.
  • The ASK analysis together with microstructural observations identified an additional source of AE during the deformation of the ND sample, which was shown to be the { 10 1 ¯ 1 } { 10 1 ¯ 2 } double twinning.
  • In this way, the ASK analysis proved to be a useful tool in discriminating between different sources of AE even if the classical hit-based approach reaches its limitations.

Author Contributions

Conceptualization, J.C. and K.M.; Validation, J.C., M.K. and P.M.; Formal Analysis, J.C.; Investigation, J.C., J.D., P.M., and M.K.; Resources, K.M.; Data Curation, X.X.; Writing-Original Draft Preparation, J.C.; Writing-Review and Editing, M.K.

Funding

This work was financially supported by the Czech Science Foundation (grant No. 14-36566G), and the Operational Program Research, Development and Education, The Ministry of Education, Youth, and Sports (OP RDE, MEYS) (grant No. CZ.02.1.01/0.0/0.0/16_013/0001794).

Acknowledgments

The authors are grateful to Alexei Vinogradov at Norwegian University of Science and Technology for providing the source code for the ASK analysis method.

Conflicts of Interest

The authors declare no conflict of interest.

References

  1. Nie, J.F.; Muddle, B.C. Characterisation of strengthening precipitate phases in a Mg–Y–Nd alloy. Acta Mater. 2000, 48, 1691–1703. [Google Scholar] [CrossRef]
  2. Janeček, M.; Král, R.; Dobroň, P.; Chmelík, F.; Šupík, V.; Holländer, F. Mechanisms of plastic deformation in AZ31 magnesium alloy investigated by acoustic emission and transmission electron microscopy. Mat. Sci. Eng. A-Struct. 2007, 462, 311–315. [Google Scholar] [CrossRef]
  3. Agnew, S.R.; Duygulu, O. Plastic anisotropy and the role of non-basal slip in magnesium alloy AZ31B. Int. J. Plast. 2005, 21, 1161–1193. [Google Scholar] [CrossRef]
  4. Christian, J.W.; Mahajan, S. Deformation Twinning. Prog. Mater. Sci. 1995, 39, 1–157. [Google Scholar] [CrossRef]
  5. Schmid, E.; Boas, W. Kristallplastizität (Struktur und Eigenschaften der Materie in Einzeldarstellungen), 1st ed.; Springer: Heidelberg/Berlin, Germany, 1935; p. 373. [Google Scholar]
  6. Huang, M.; Jiang, L.; Liaw, P.; Brooks, C.; Seelev, R.; Klarstrom, D. Using acoustic emission in fatigue and fracture materials research. JOM 1998, 50, 1–12. [Google Scholar]
  7. Chmelík, F.; Lukáč, P.; Janeček, M.; Moll, F.; Mordike, B.L.; Kainer, K.-U.; Langdon, T.G. An evaluation of the creep characteristics of an AZ91 magnesium alloy composite using acoustic emission. Mater. Sci. Eng. A 2002, 338, 1–7. [Google Scholar] [CrossRef]
  8. Lou, X.Y.; Li, M.; Boger, R.K.; Agnew, S.R.; Wagoner, R.H. Hardening evolution of AZ31B Mg sheet. Int. J. Plast. 2007, 23, 44–86. [Google Scholar] [CrossRef]
  9. Heiple, C.R.; Carpenter, S.H. Acoustic Emission Produced by Deformation of Metals and Alloys—A Review: Part I. J. Acoust. Em. 1987, 6, 177–204. [Google Scholar]
  10. Heiple, C.R.; Carpenter, S.H. Acoustic Emission Produced by Deformation of Metals and Alloys—A Review: Part II. J. Acoust. Em. 1987, 6, 215–237. [Google Scholar]
  11. Shashkov, I.V.; Lebedkina, T.A.; Lebyodkin, M.A.; Dobron, P.; Chmelik, F.; Kral, R.; Parfenenko, K.; Mathis, K. Acoustic-emission study of intermittency of plastic flow during twinning and dislocation glide. Acta Phys. Pol. A 2012, 122, 430–434. [Google Scholar] [CrossRef]
  12. Dobroň, P.; Bohlen, J.; Chmelík, F.; Lukáč, P.; Letzig, D.; Kainer, K.U. Acoustic emission during stress relaxation of pure magnesium and AZ magnesium alloys. Mat. Sci. Eng. A-Struct. 2007, 462, 307–310. [Google Scholar] [CrossRef] [Green Version]
  13. Chmelik, F.; Klose, F.B.; Dierke, H.; Sachl, J.; Neuhauser, H.; Lukac, P. Investigating the Portevin-Le Chatelier effect in strain rate and stress rate controlled tests by the acoustic emission and laser extensometry techniques. Mat. Sci. Eng. A Struct. 2007, 462, 53–60. [Google Scholar] [CrossRef]
  14. Scruby, C.; Wadley, H.; Sinclair, J.E. The origin of acoustic-emission during deformation of aluminum and an aluminum-magnesium alloy. Philos. Mag. A 1981, 44, 249–274. [Google Scholar] [CrossRef]
  15. Pomponi, E.; Vinogradov, A. A real-time approach to acoustic emission clustering. Mech. Syst. Sig. Process. 2013, 40, 791–804. [Google Scholar] [CrossRef]
  16. Vinogradov, A.; Lazarev, A.; Linderov, M.; Weidner, A.; Biermann, H. Kinetics of deformation processes in high-alloyed cast transformation-induced plasticity/twinning-induced plasticity steels determined by acoustic emission and scanning electron microscopy: Influence of austenite stability on deformation mechanisms. Acta Mater. 2013, 61, 2434–2449. [Google Scholar] [CrossRef]
  17. Chapuis, A.; Driver, J.H. Temperature dependency of slip and twinning in plane strain compressed magensium single crystals. Acta Mater. 2011, 59, 1986–1994. [Google Scholar] [CrossRef]
  18. Holt, J. Electronic noise in acoustic-emission measurements. Non-Destr. Test. 1976, 9, 66–70. [Google Scholar] [CrossRef]
  19. Drozdenko, D.; Bohlen, J.; Chmelík, F.; Lukáč, P.; Dobroň, P. Acoustic emission study on the activity of slip and twin mechanisms during compression testing of magnesium single crystals. Mat. Sci. Eng. A-Struct. 2016, 650, 20–27. [Google Scholar] [CrossRef] [Green Version]
  20. Mathis, K.; Capek, J.; Zdrazilova, Z.; Trojanova, Z. Investigation of tension-compression asymmetry of magnesium by use of the acoustic emission technique. Mat. Sci. Eng. A-Struct. 2011, 528, 5904–5907. [Google Scholar] [CrossRef]
  21. Mathis, K.; Csiszar, G.; Capek, J.; Gubicza, J.; Clausen, B.; Lukas, P.; Vinogradov, A.; Agnew, S.R. Effect of the loading mode on the evolution of the deformation mechanisms in randomly textured magnesium polycrystals—Comparison of experimental and modeling results. Int. J. Plast. 2015, 72, 127–150. [Google Scholar] [CrossRef]
  22. Vinogradov, A.; Vasilev, E.; Seleznev, M.; Máthis, K.; Orlov, D.; Merson, D. On the limits of acoustic emission detectability for twinning. Mater. Lett. 2016, 183, 417–419. [Google Scholar] [CrossRef]
  23. Barnett, M.R. Twinning and the ductility of magnesium alloys Part II. “Contraction” twins. Mat. Sci. Eng. A-Struct. 2007, 464, 8–16. [Google Scholar] [CrossRef]
  24. Lentz, M.; Risse, M.; Schaefer, N.; Reimers, W.; Beyerlein, I.J. Strength and ductility with {1011}—{1012} double twinning in a magnesium alloy. Nat. Commun. 2016, 7, 11068. [Google Scholar] [CrossRef] [PubMed]
Figure 1. Inverse pole figure of samples cut in the ND, 45° between RD and ND, and RD directions.
Metals 08 00644 g001
Figure 2. Histograms of SF of the initial texture for extension twinning and basal slip.
Metals 08 00644 g002aMetals 08 00644 g002b
Figure 3. Picture of the experimental setup and mounting of the AE sensor.
Metals 08 00644 g003
Figure 4. The deformation curves of the samples (a) RD, (b) 45, and (c) ND and the concurrently recorded raw AE signals.
Metals 08 00644 g004
Figure 5. The deformation curves with the count rate and amplitude of AE events.
Metals 08 00644 g005
Figure 6. Relative activity of AE sources evaluated by the ASK analysis (a,c,e) and the projection of the clusters in the 2D mean frequency vs. energy diagrams (b,d,f).
Metals 08 00644 g006
Figure 7. Microstructure of (a) RD, (b) 45, (c) ND samples deformed in compression to 1% plastic strain. Loading direction is perpendicular to the picture for all the sample.
Metals 08 00644 g007
Figure 8. Microstructure of the 45 samples deformed to (a) 225 MPa, (b) 270 MPa observed by light microscopy and (c) sample deformed to fracture observed by EBSD.
Metals 08 00644 g008