Article

Effect of Cooling Path on Microstructure Features and Tensile Properties in a Low Carbon Mo-V-Ti-N Steel

1
State Key Laboratory of Metastable Materials Science and Technology, Yanshan University, Qinhuangdao 066004, China
2
Qinhuangdao Vocational and Technical College, Qinhuangdao 066100, China
3
National Engineering Research Center for Equipment and Technology of Cold Strip Rolling, Yanshan University, Qinhuangdao 066004, China
*
Author to whom correspondence should be addressed.
Metals 2018, 8(9), 677; https://doi.org/10.3390/met8090677
Submission received: 12 August 2018 / Revised: 25 August 2018 / Accepted: 27 August 2018 / Published: 29 August 2018

Abstract

:
The two-stage controlled rolling and cooling of a low carbon Mo-V-Ti-N steel at different cooling paths was simulated through a Gleeble 3500 system. The microstructure and tensile properties of each sample were examined by estimating their dependence on the cooling paths. It was indicated that a mixed microstructure of polygonal ferrite (PF), acicular ferrite (AF), granular bainitic ferrite (GBF), and a martensite-austenite (M-A) constituent was developed in each sample. Results showed that application of the reduced cooling rate and elevated finishing cooling temperature led to the increases in the effective ferrite grain size and the precipitate amount despite a decrease in dislocation density, which eventually resulted in the overall yield strength. It also led to an increasing amount of M-A constituent, which lowered the yield ratio and, thereby, enhanced the capacity for strain hardening. In addition, the underlying mechanism for the correlations among the cooling path, the microstructure, and the yield strength was considered.

1. Introduction

Low carbon (C) microalloying steel has been increasingly used for buildings, bridges, and pipelines because of their excellent combination of high strength, satisfactory toughness, and good weldability [1,2,3,4,5,6]. As the easily-welded steel commonly limits the C content, an appropriate addition of microalloying elements (Nb, V, Ti etc.) is normally essential for an improved strength and toughness combination via a properly-controlled phase transformation, which results in a fine-grained microstructure, enhanced precipitation, and densified dislocation, etc. [7]. Particularly, previous works have shown that the appropriate nitrogen (N) addition to low-C vanadium microalloying steels could lead to a high-density fine particles of V(C, N) precipitate and a simultaneous fine-grained ferritic microstructure via the pinning [8,9] and heterogeneously nucleating effects [10]. In addition, their high heat-input weldability could be improved through the intragranular polygonal/acicular ferrite (IGPF/IGAF) nucleation at (Ti, V)(C, N) particles in the coarse-grained heat affected zone (CGHAZ), which could be enhanced by an appropriately-controlled N content [10,11].
In addition to previously mentioned micro-alloying methods, the reasonably-designed schedule for Thermo-Mechanical Controlled Processing (TMCP) is also essential for the desired microstructure and mechanical properties. Previous studies [12,13] have extensively estimated the effects of TMCP parameters for two-stage controlled rolling and cooling including the finish rolling temperature (FRT) [14] and the hot rolling reduction (HRR) [13,15], which accelerated the cooling rate (ACR) [16] on the γ→α phase transformation, the final microstructure, and the mechanical properties. These investigations reported that the microstructure comprising quasi polygonal ferrite (QPF), acicular ferrite (AF), granular bainitic ferrite (GBF), and/or lath bainitic ferrite (LBF) as well as a small amount of martensite-austenite (M-A) constituent normally developed in a low-C niobium (Nb)-microalloying steel. The decreased FRT [14] and the increased ACR [17] could lead to an effective ferritic and/or bainitic grain refinement and an increasing dislocation density, which ultimately resulted in the enhanced yield strength (YS) and impact toughness and, in turn, the elevated yield ratio (YR). However, when the ACR is above a critical value, a hard phase of martensite (M), for example, could form, which is probably detrimental to the ductility and/or toughness. Conversely, a coarse microstructure consisting of PF and precipitated particles in a large size might form at a low ACR, which is supposed to bring about a poor combination of strength and toughness [18]. Therefore, it is vital to optimize the ACR for consequently producing an even stronger and tougher microstructure via an effectively control of the γ→α transformation. It was also proposed that, for an appropriate combination of high YS and low YR, both the soft ferritic phase in an appropriate effective grain size and a hard M-A constituent phase in proper morphology should be controlled through properly regulating the FRT [14] or the ACR [17].
Apart from the ACR, the finish cooling temperature (FCT) is supposed to be another key TMCP parameter in the accelerated cooling stage [17] since it seems to have strong effects on the final ferritic and bainitic microstructure and mechanical properties of low-C Nb-microalloying steel (such as X80 pipeline [5]), which have still not received much attention. On the other side, the low-carbon V-Ti-N microalloyed steel used to be processed via one-stage controlled rolling in the γ recrystallization region for a fine-grained PF formation [2]. However, any attempt to process this type of steel through controlled rolling in the γ non-recrystallization region and subsequent controlled cooling at different parameters, has been rarely reported so far, based on the authors’ knowledge.
For this attempt, a low-C Mo-V-Ti-N steel was used for the two-stage controlled rolling and cooling simulations and the effects of changed cooling path (ACR and FCT) on the microstructure and tensile properties were examined extensively. The mechanisms governing the correlations among the cooling path, the microstructure, and the properties were deliberated.

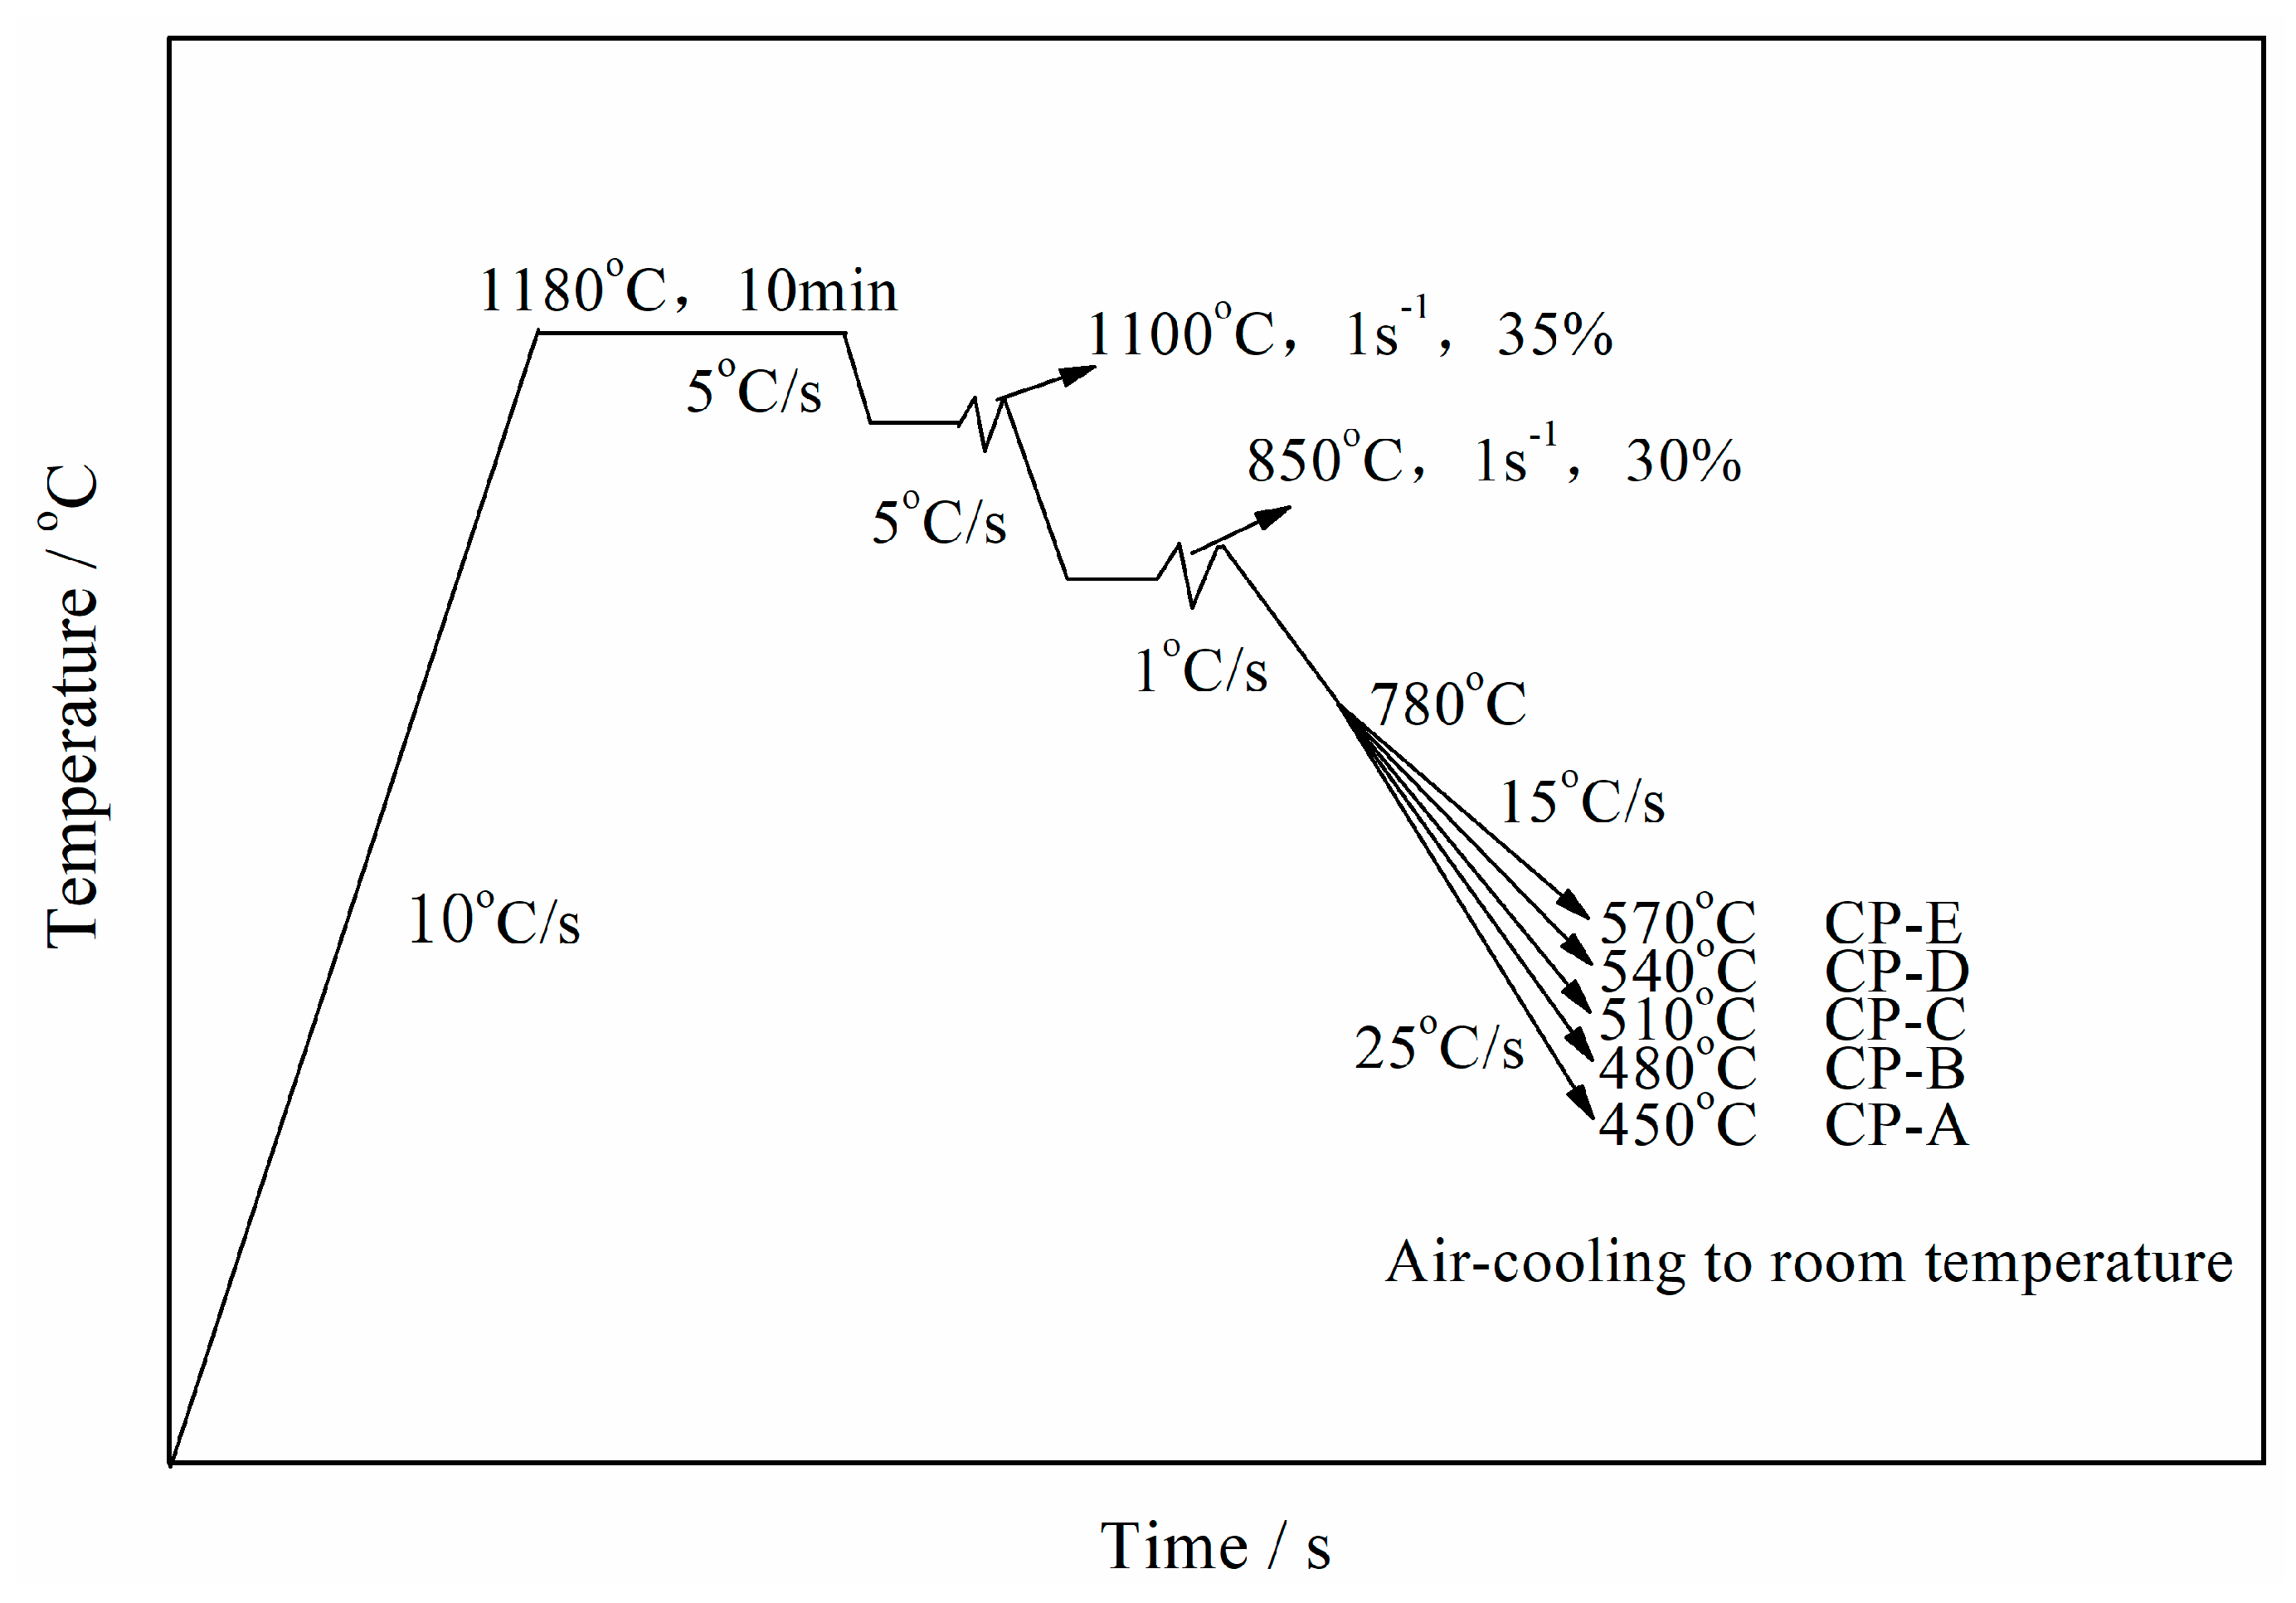
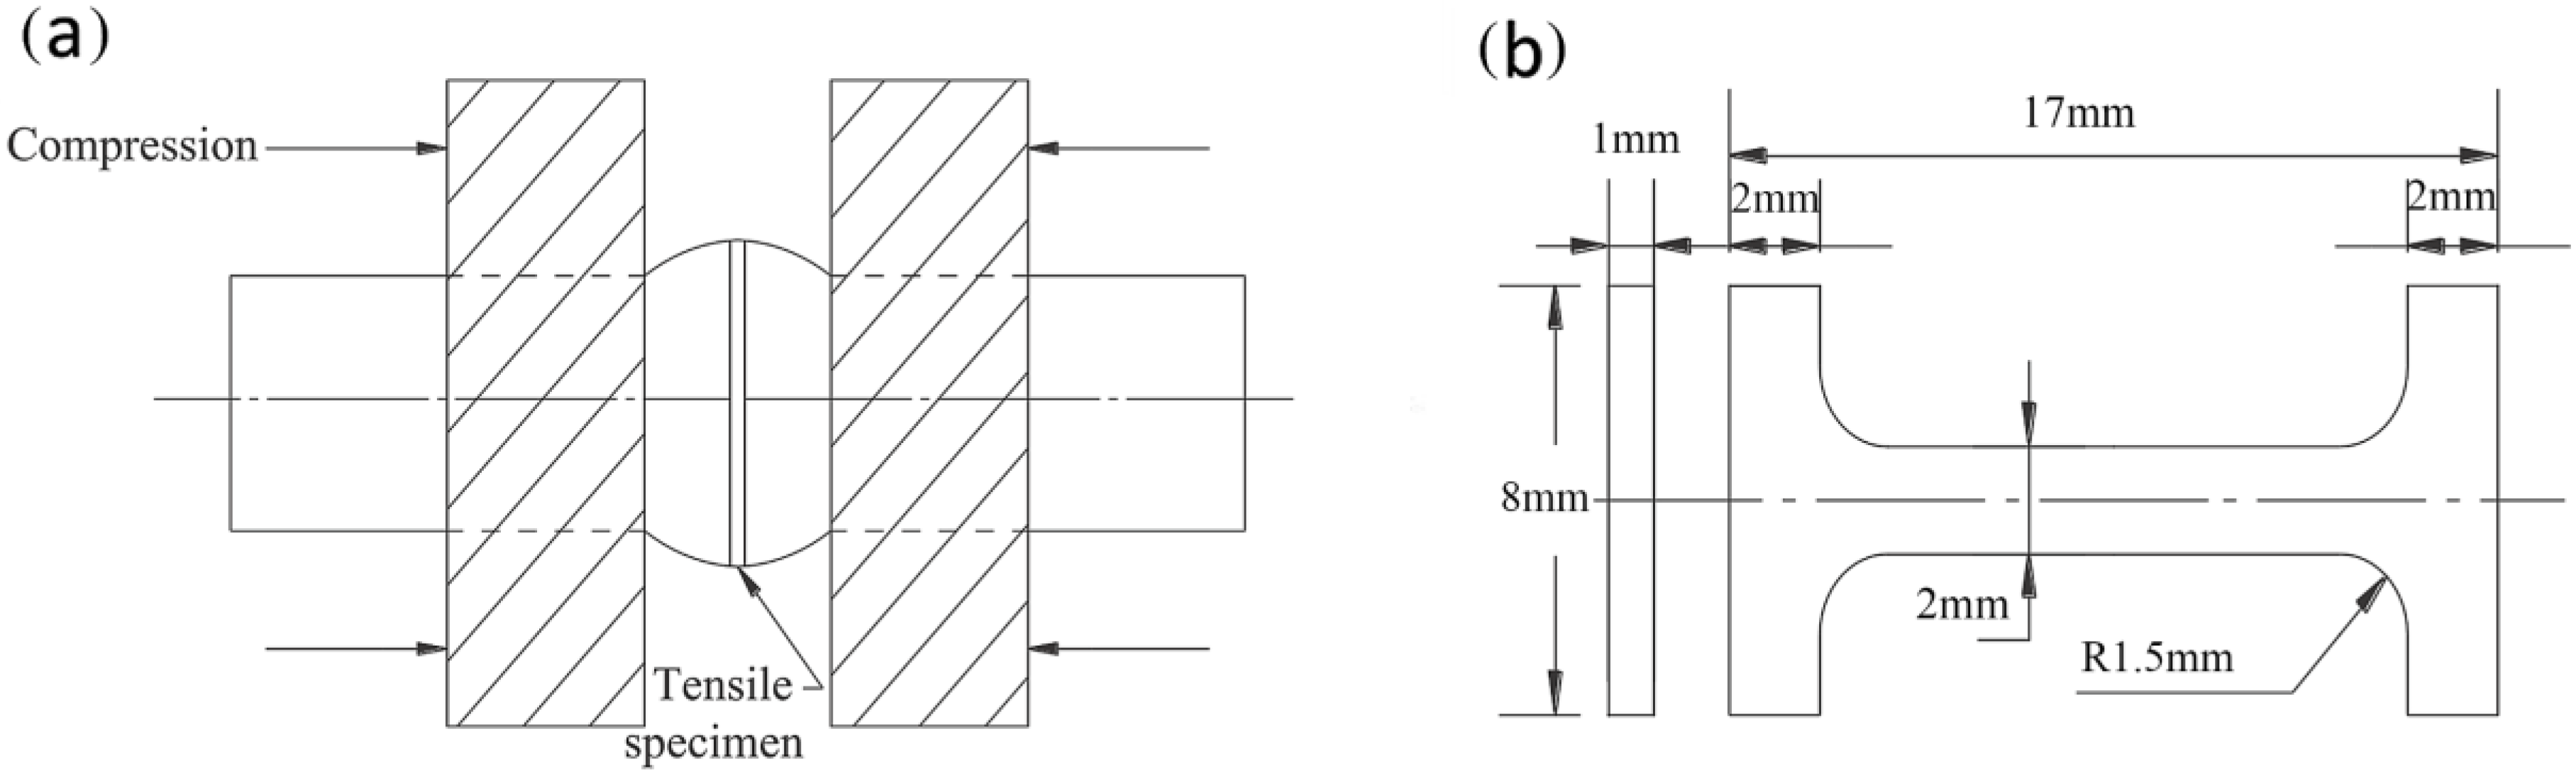
2. Materials and Methods

A low-C Mo-V-Ti-N steel for the present investigation was melted in a 50-kg vacuum furnace (ZGL0.025-100-2.5/4D, Jinzhou Zhongzhen Dianlu Co., Ltd., Jinzhou, China) and the ingot was hot-rolled to a 16 mm-thickness plate with the chemical compositions determined by a direct-reading spectrometer analysis of the sample taken from the center of the experimental steel plate and listed in Table 1. The round bar samples of Φ 15 mm × 75 mm (diameter × length) were cut from the steel plate for the TMCP tests.
The simulated TMCP was conducted in a thermo-simulator (Gleeble 3500, Dynamic Systems Inc., Delaware, NY, USA) and the schedule for the TMCP simulation was schematically shown in Figure 1. The samples were first heated to 1180 °C and soaked for 10 min for the ingot reheating simulation. Afterward, the samples were cooled to 1100 °C and compressed in the γ recrystallization region with a deformation amount of 35% for a rough rolling simulation. Then the samples were further cooled to 850 °C and compressed in the γ non-recrystallization region with a deformation amount of 30% for a finish rolling simulation. After the two-step controlled rolling simulation was completed, the controlled cooling simulation was performed subsequently. Accelerated cooling commenced at 780 °C with a series of cooling rates from 25 °C/s to 15 °C/s. Then it was interrupted at a series of finish cooling temperatures from 450 °C to 570 °C (sign as a cooling path A to E, Figure 1) and it was air-cooled to room temperature. The simulated TMCP method has ever been effectively used in previous works reported in ref. [16,19].
After the simulation, the microstructures of different samples were characterized in details. For the optical microscopy (OM) observations, the samples were cross-sectioned at the position of the thermocouple, which was fixed, polished mechanically, etched in a 4% nital, and observed in an optical microscope (Axiover-200MAT, Carl Zeiss Microimaging GmbH, Jena, Germany). After LePera’s reagent was used for etching the metallographic sample, the M-A constituent was observed [16]. The size and the area fraction of M-A constituent were determined with the software (Image-Pro PlusTM, Version 5.0, Media Cybernetics, Inc., Rockville, MD, USA). For the quantitative determination of the M-A constituent in each sample, at least 10 fields of view containing more than 1000 particles were examined at a magnification of 2000×. The samples for Electron backscatter diffraction (EBSD) analyses were electrolytically polished in the solution of 5% glycerinum, 10% perchloric, and acid 85% alcohol. Lately, the electropolished samples were analyzed in a Scanning Electron Microscope (SEM, Hitachi S–3400, Hitachi, Tokyo, Japan) with a TSL EBSD system (Hikari EDAX, EDAX Inc., Mahwah, NJ, USA) equipped. The EBSD scans were performed via a step size of 0.2 μm. The EBSD effective grain size against the different misorientation tolerance angle was determined as the equivalent circle diameter related to the individual grain area. The detailed M-A constituent and ferrite matrix in each sample were further examined in a transmission electron microscope (TEM, JEM–2010, JEOL, Tokyo, Japan). For TEM sample preparation, the slice was cut parallel to the metallographic section, punched into the disc of 3 mm diameter, and electropolished for thinning. The thinned slice was electropolished in a solution of 7% perchloric acid and glacial acetic acid at room temperature during which a voltage of 25 V and current of 55 to 65 mA were used. Lastly, X-ray diffraction (XRD) was used to quantify the dislocation density of each sample, according to the method described in References [5,20]. The XRD spectrum for each sample was obtained via scanning in a diffractometer (Rigaku D/max–2500/PC, Rigaku, Tokyo, Japan) and a scanning angle (2θ) ranging from 30° to 110° and a step size of 0.02° were used. Three samples were tested for each simulated specimen and the average value was reported.
The tensile properties of the samples were measured using the micro-sample tensile technique, which is shown in Figure 2 [16]. The micro-sample was cross-sectioned from the sample at the position the thermocouple was fixed. Lately, the room-temperature tension was performed in a tensile testing machine (Inspekt Table 100, Hegewald & Peschke, Nossen, Germany) with a tension rate of 0.25 mm/min. Twice tensile testing were performed for each sample and their mean value was taken as the tensile properties. The yield strength (YS) was measured as the 0.2% offset stress (Rp0.2).

3. Results

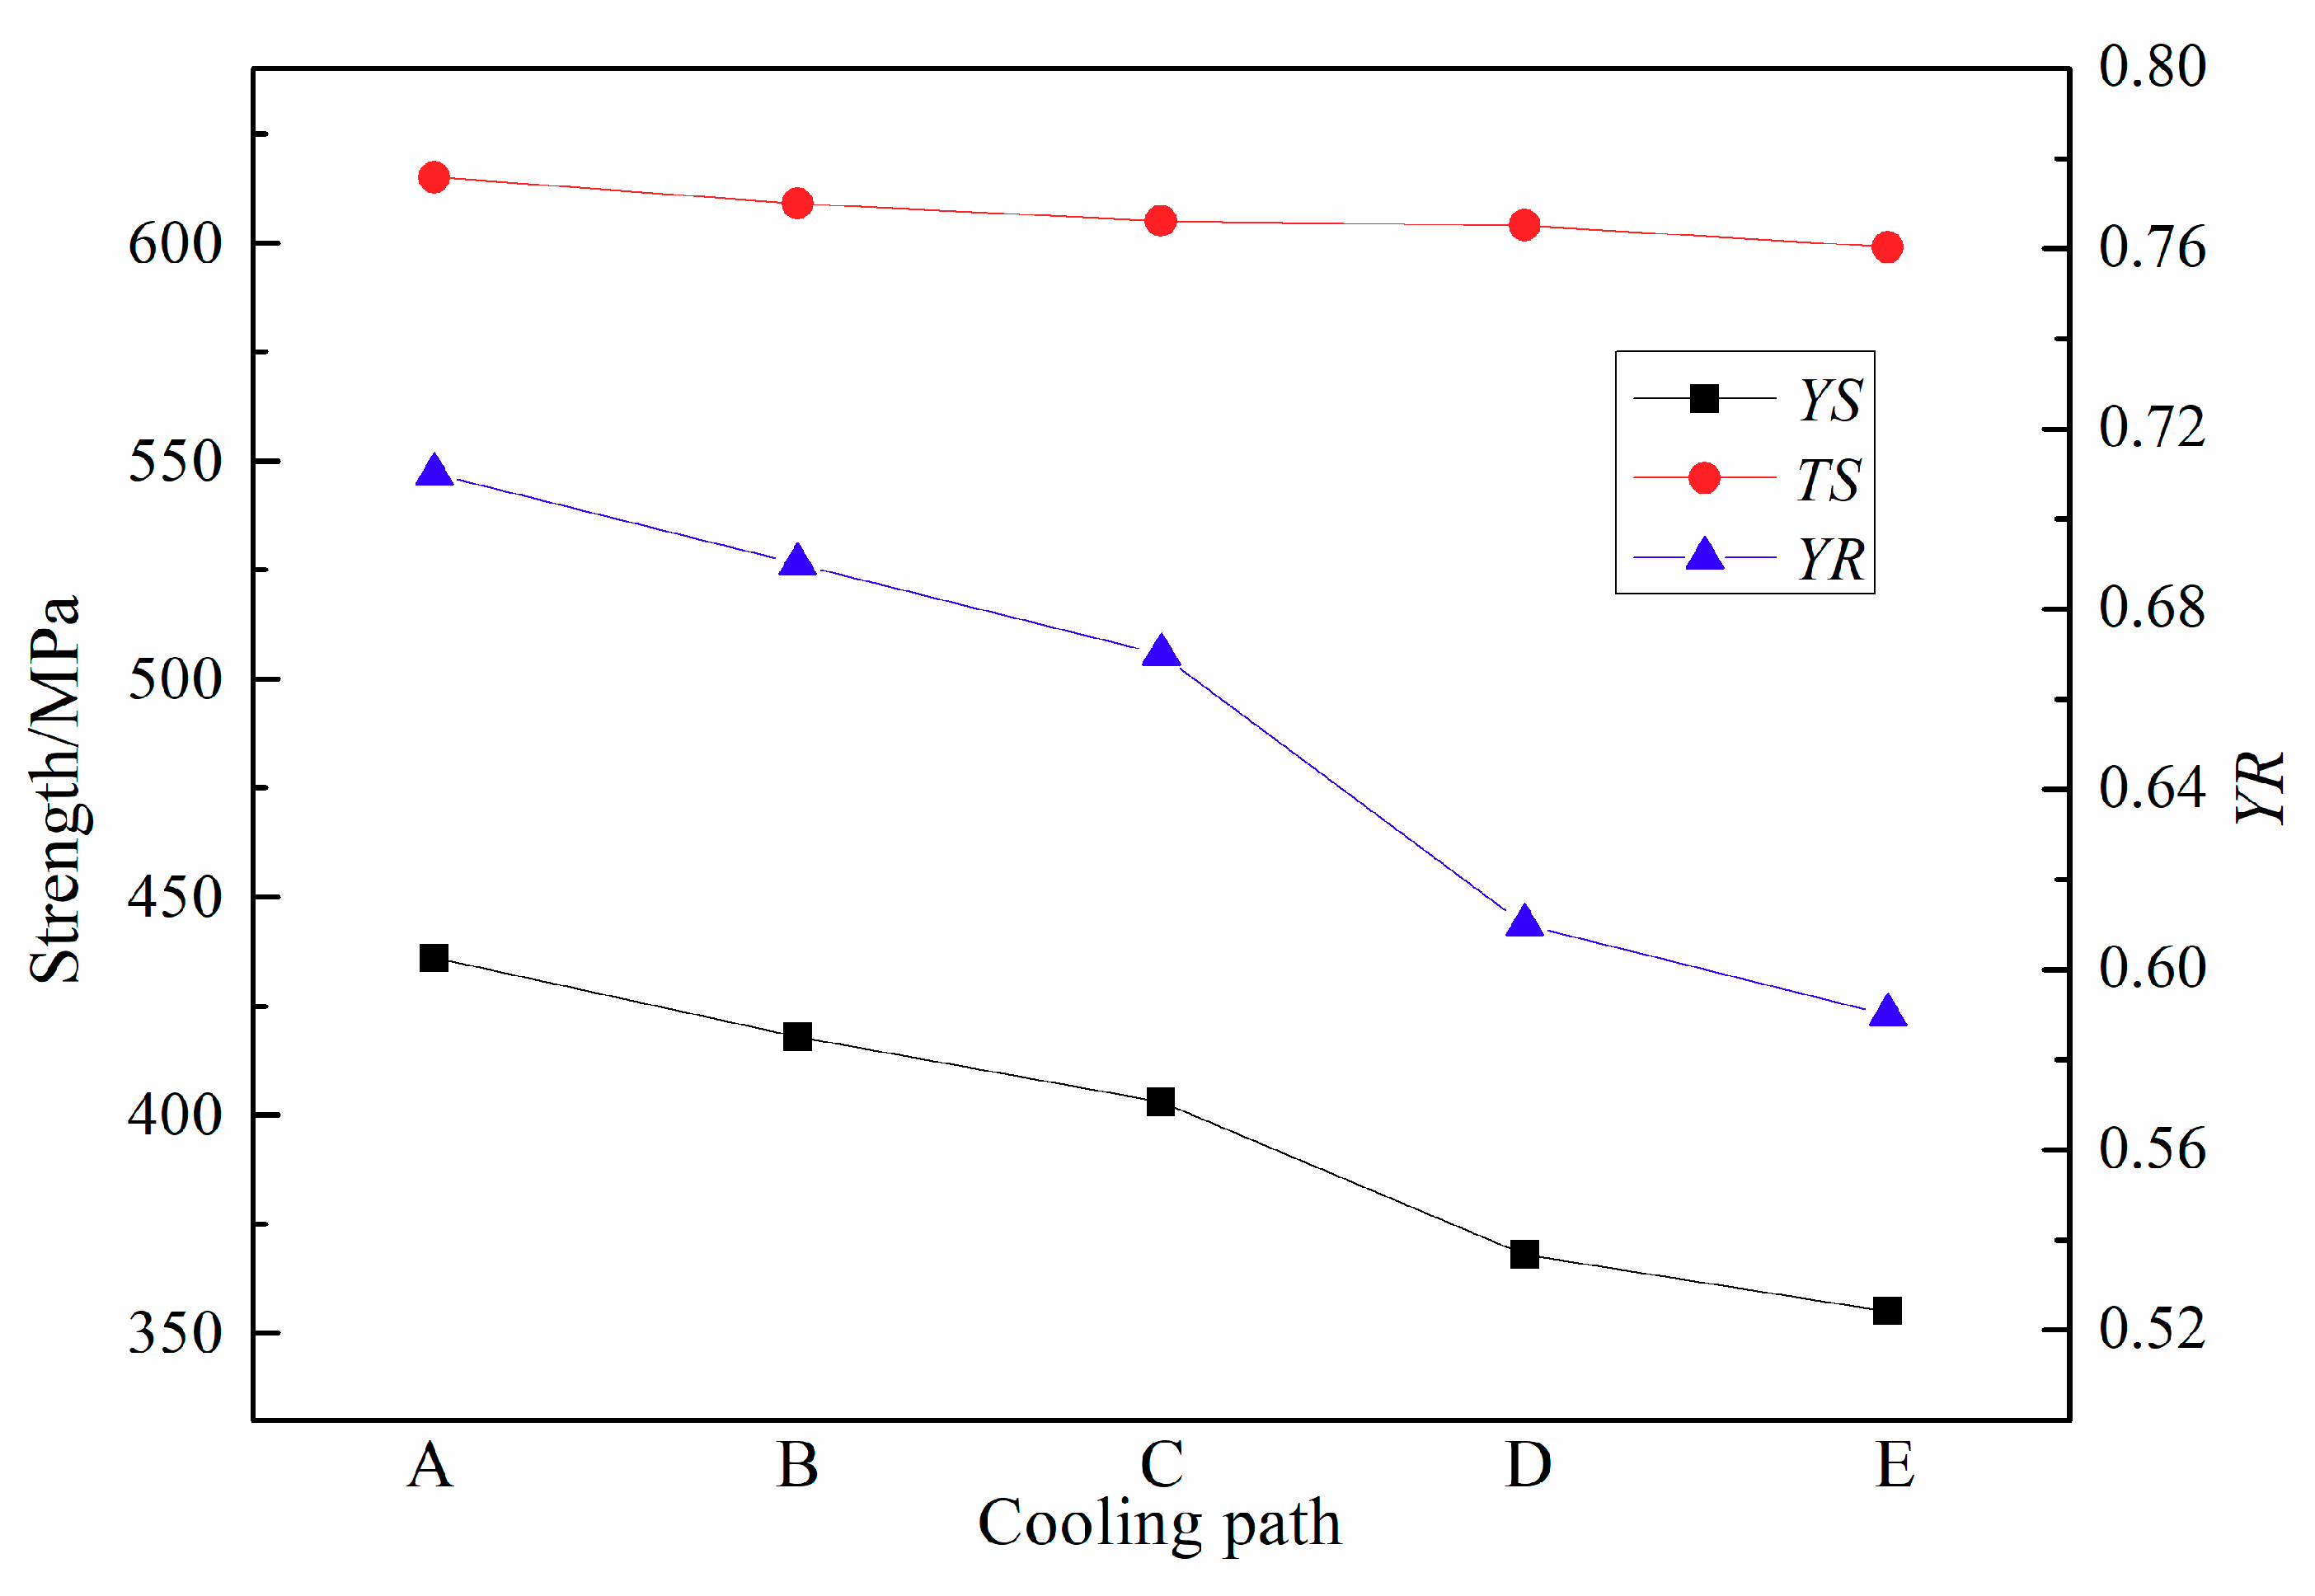
3.1. Tensile Properties
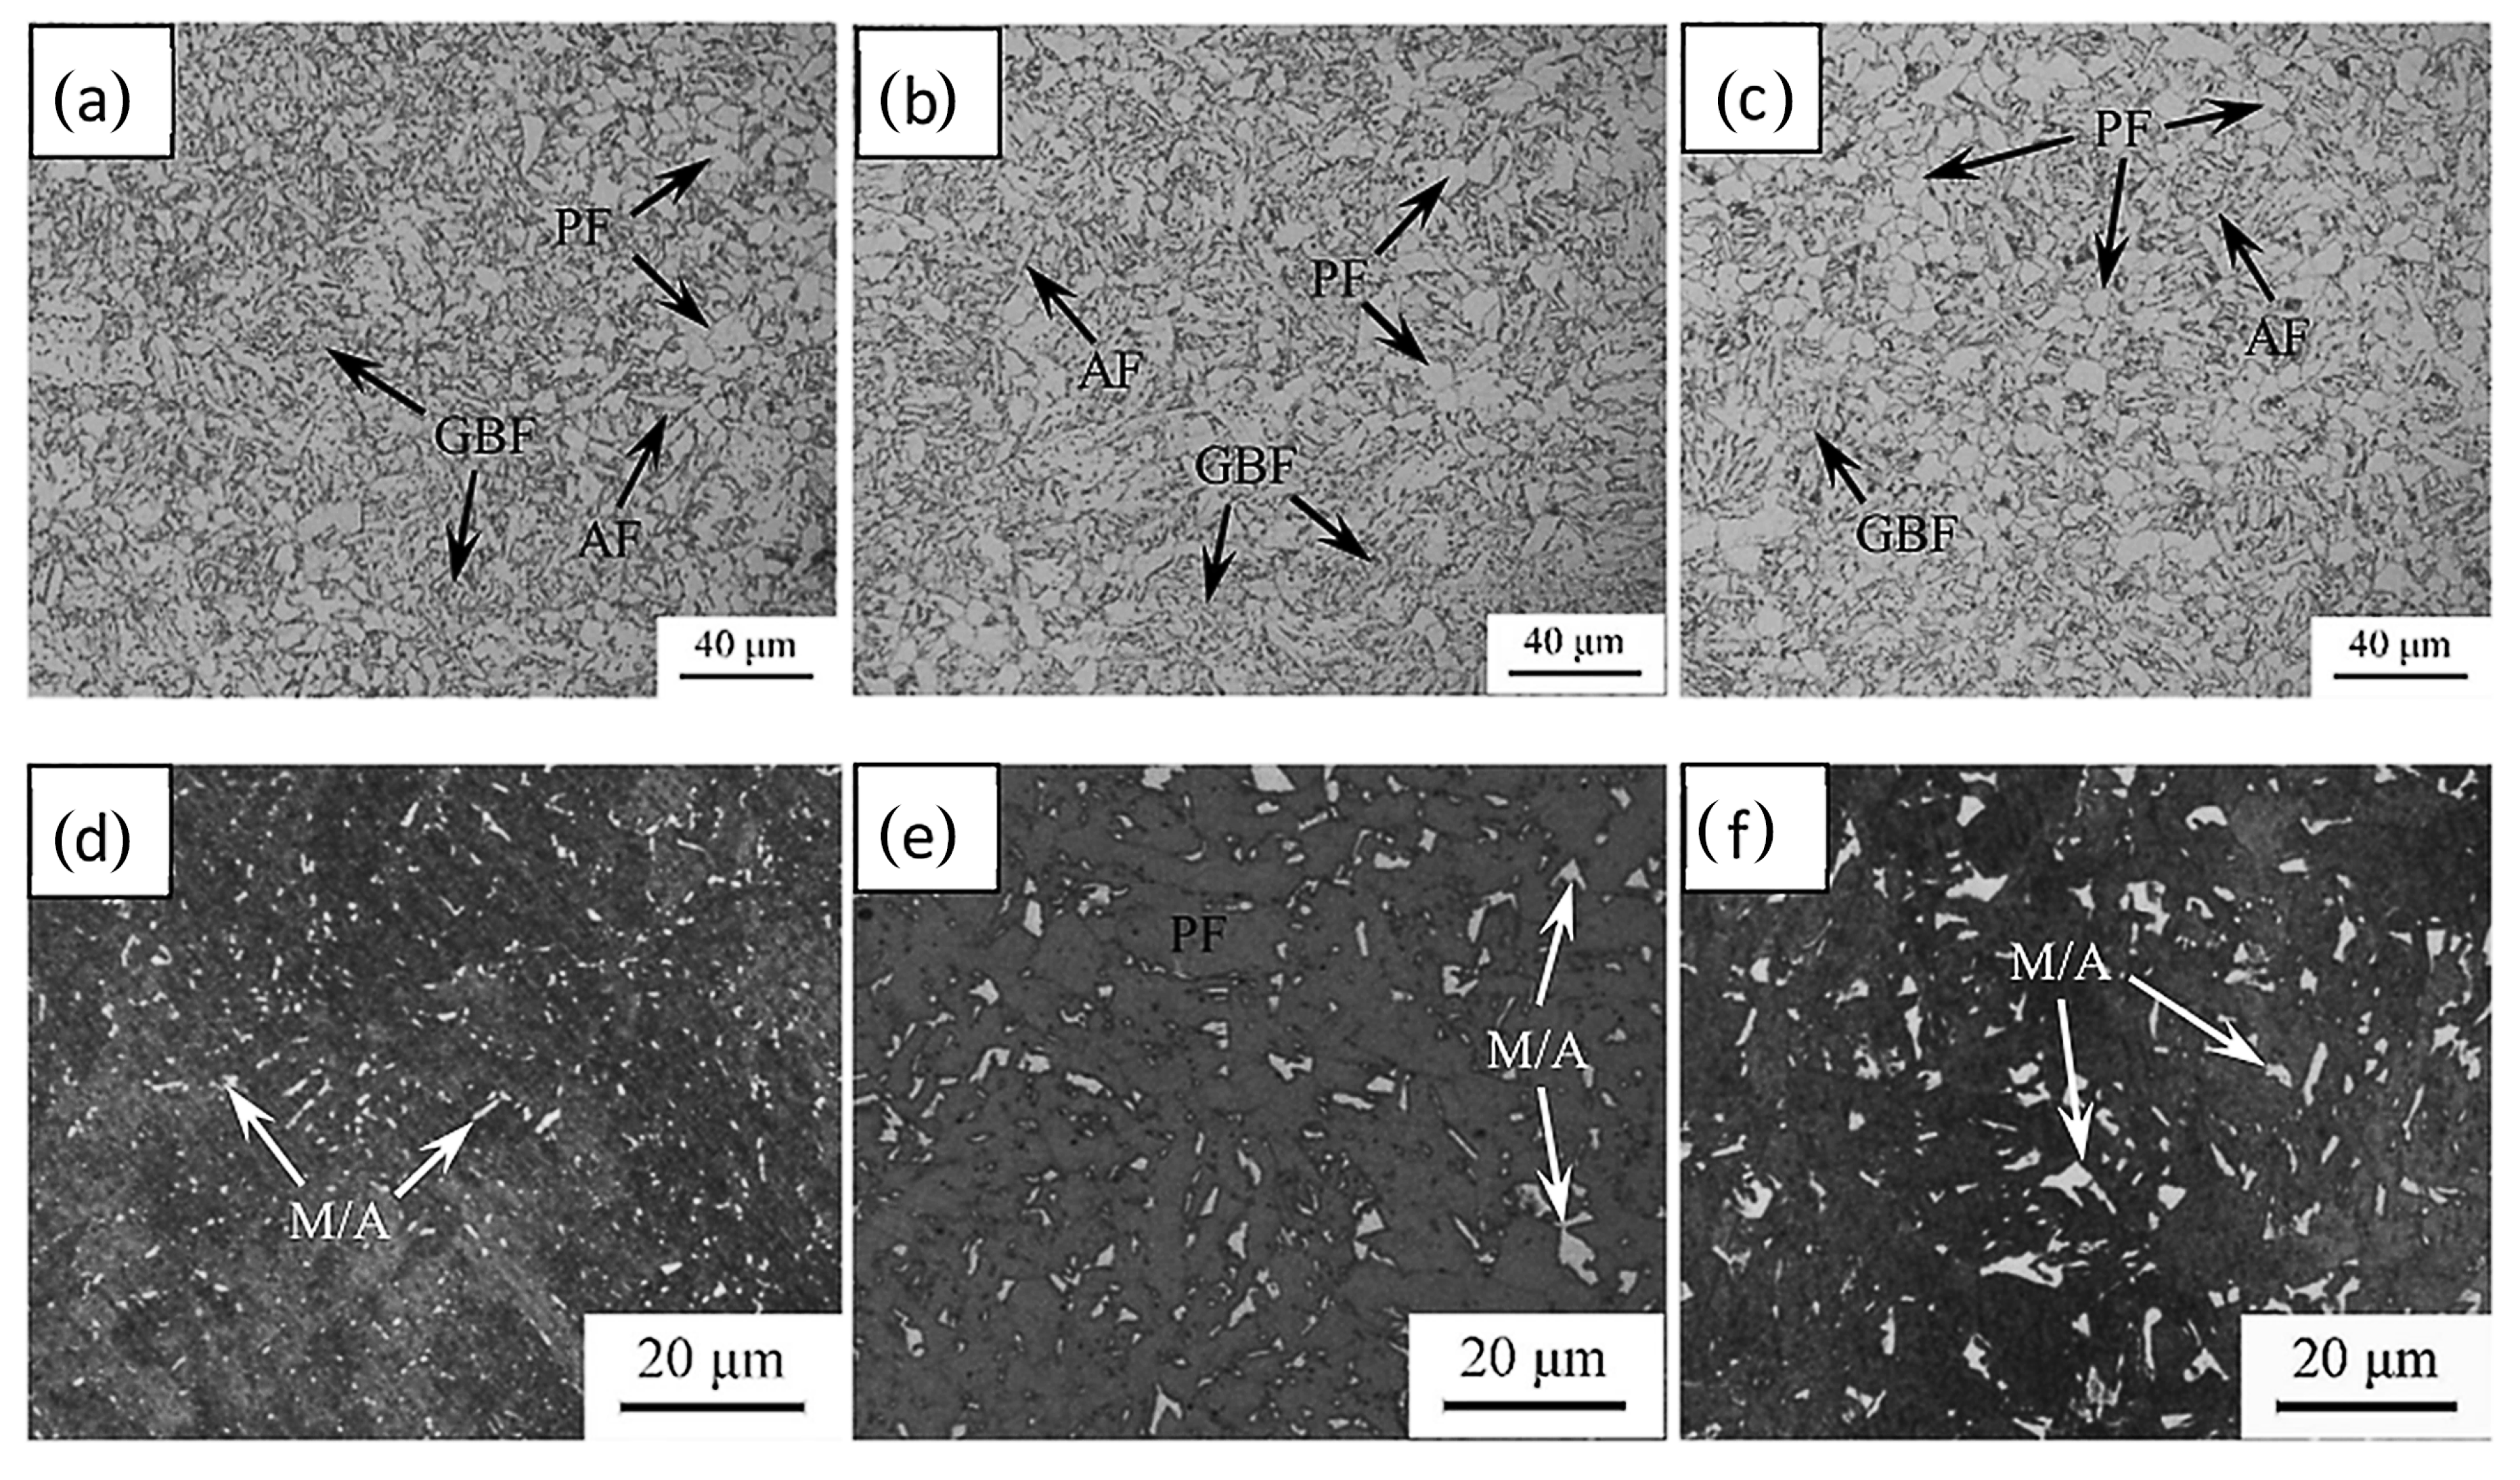
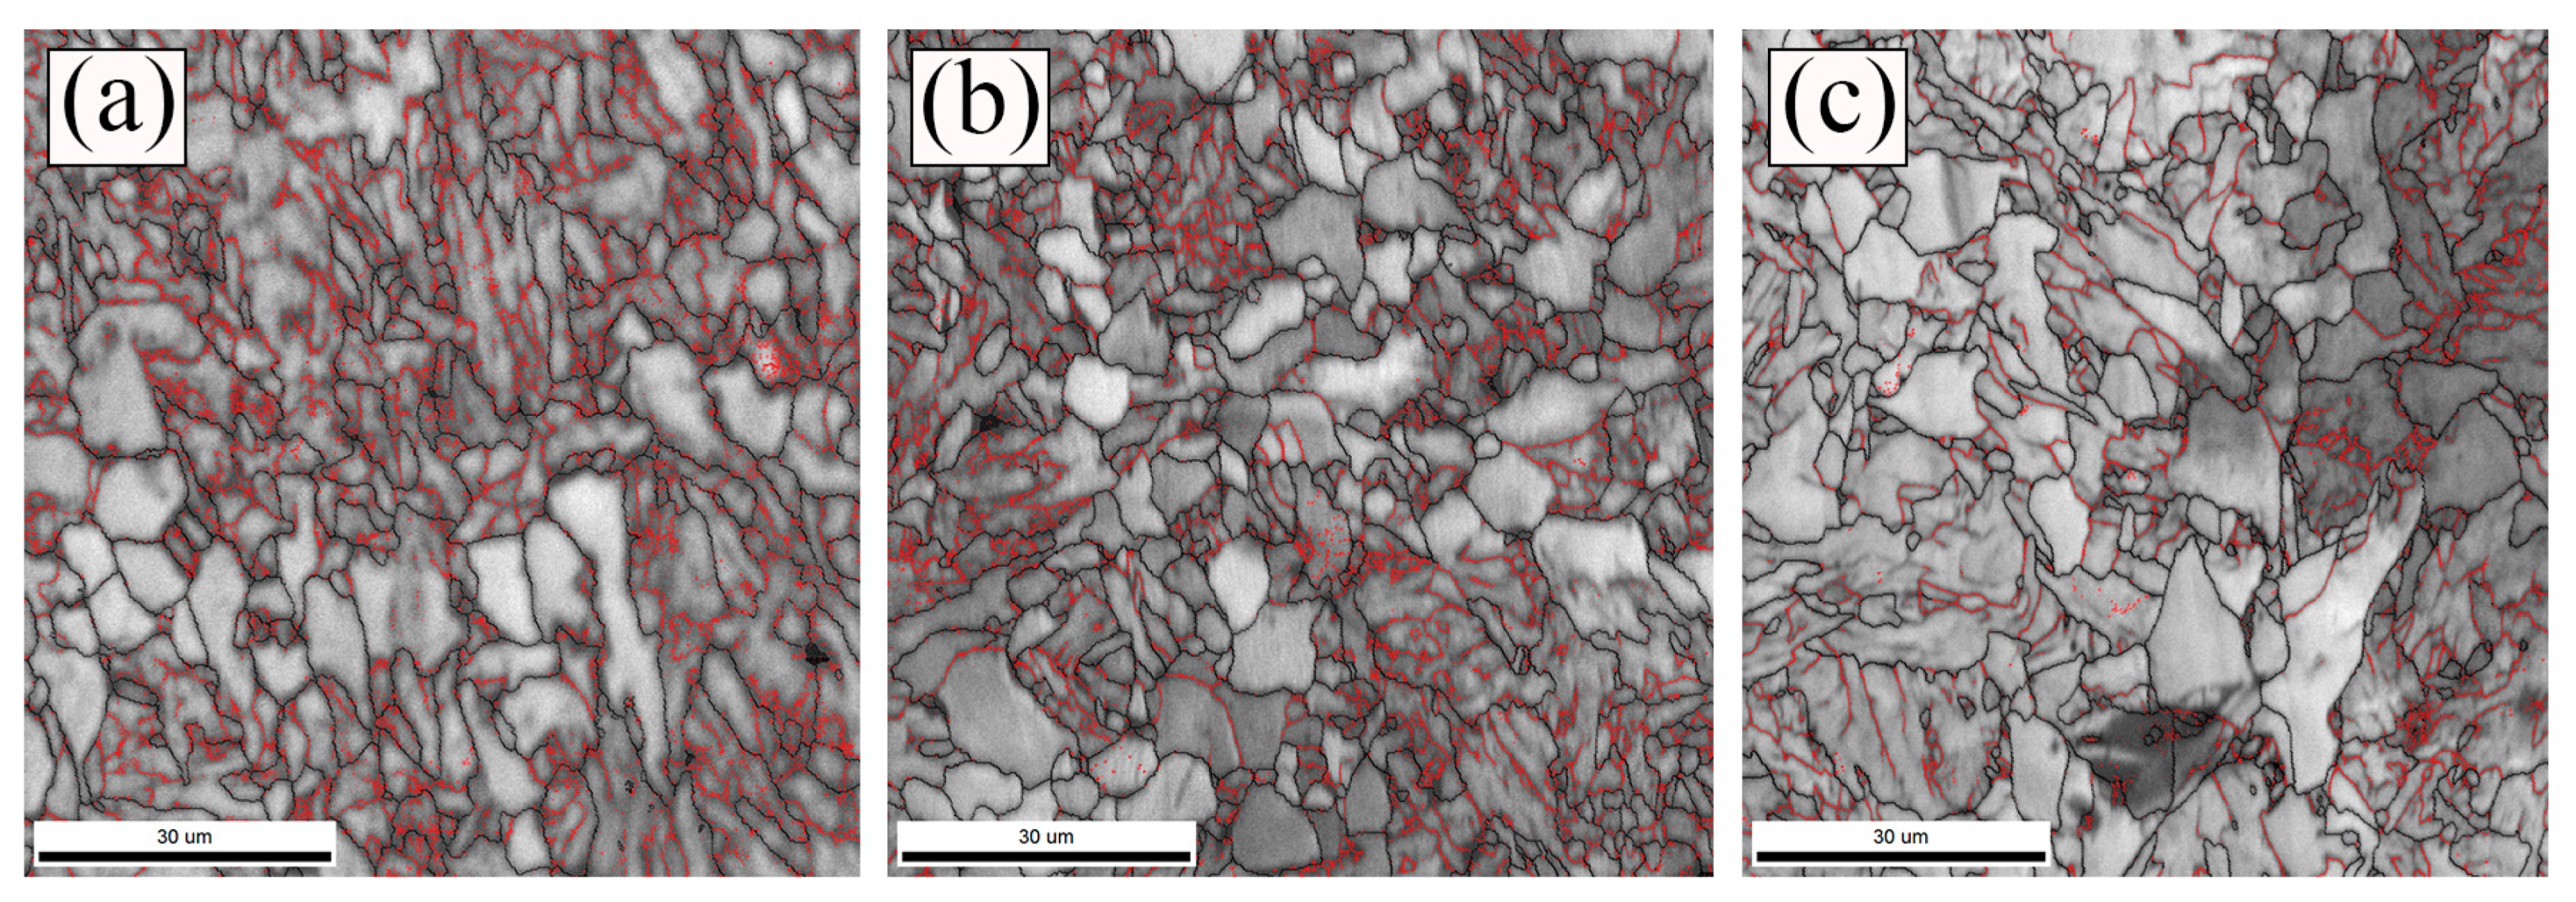
Each sample was tensile tested with the stress-strain curve shown in Figure 3 and the tensile properties indicated in Figure 4, as the function of the cooling path (CP). As displayed in this figure, the yield/tensile strength (YS/TS) decreased from 436/615 to 355/599 MPa along with the changes from the cooling path A (CP-A) to the cooling path E (CP-E). The yield ratio (YR), which is equal to the ratio of the YS to the TS, decreased evidently from 0.71 to 0.59. The YR is a subordinate indicator for the evaluation of a strain hardening capacity. A lowered YR for this low-C V-Ti-N steel could lead to a better strain hardening capacity, according to ref. [16,19].

3.2. Microstructure

The typical OM observations of different CP samples are shown in Figure 5. As shown in Figure 5a–c, the microstructure of each sample was constituted of polygonal ferrite (PF), acicular ferrite (AF), and granular bainitic ferrite (GBF) and dispersed with M-A islands. The PF and AF amount increased with the changes from CP-A to CP-E while the GBF amount decreased.
The M-A constituent morphologies were also examined in detail, which is shown in Figure 5d–f. The M-A constituents in the sample of CP-A were homogeneously distributed in a smaller size. In contrast, the M-A constituents in the sample of CP-E differed in shape and size including larger massive and smaller, slender particles. The area fraction of M-A constituents, fM-A, was quantified and summarized in Table 2 and exhibited a significant increase with the changes from CP-A to CP-E.
The typical TEM observations of different CP samples are shown in Figure 6. As the figure shows, the polygonal, acicular, and plate-like ferrite as well as the island-like microstructure developed in each cooling path sample. With the changes from CP-A to CP-E, the polygonal and acicular ferrite amount increased while the plate-like ferrite amount decreased. The island phase was determined as an M-A constituent through TEM observations of both bright and dark fields (Figure 6d,e) and selected an area diffraction pattern (Figure 6f). These M-A constituents could be divided into two groups: slender M-A island scattered at the GBF boundaries and massive M-A island surrounded by the AF and/or PF.
Previous work [7,21] reported that the grain boundary with a low misorientation angle can control the dislocation movement. Iza-Mendia et al. [22] further suggested that the effective subgrain surrounded by the low misorientation angle boundaries with a threshold angle of 2° comprised the smallest effective microstructural unit controlling the yield strength. In this work, the microstructure of different CP samples were also examined quantitatively via the EBSD scanning over an angle range of 2° to 30° with the misorientation image maps shown in Figure 7. The effective grain size of PF + AF + GBF microstructure was determined from five random fields as the mean equivalent diameter (MED) using a statistic method, which is summarized in Table 2. The MED of the PF + AF + GBF mixture increased monotonously with the changes from CP-A to CP-E. The fraction of the low angle grain boundary (LAGB) with the misorientation angle of 2° to 15° decreased with the changes from CP-A to CP-E.

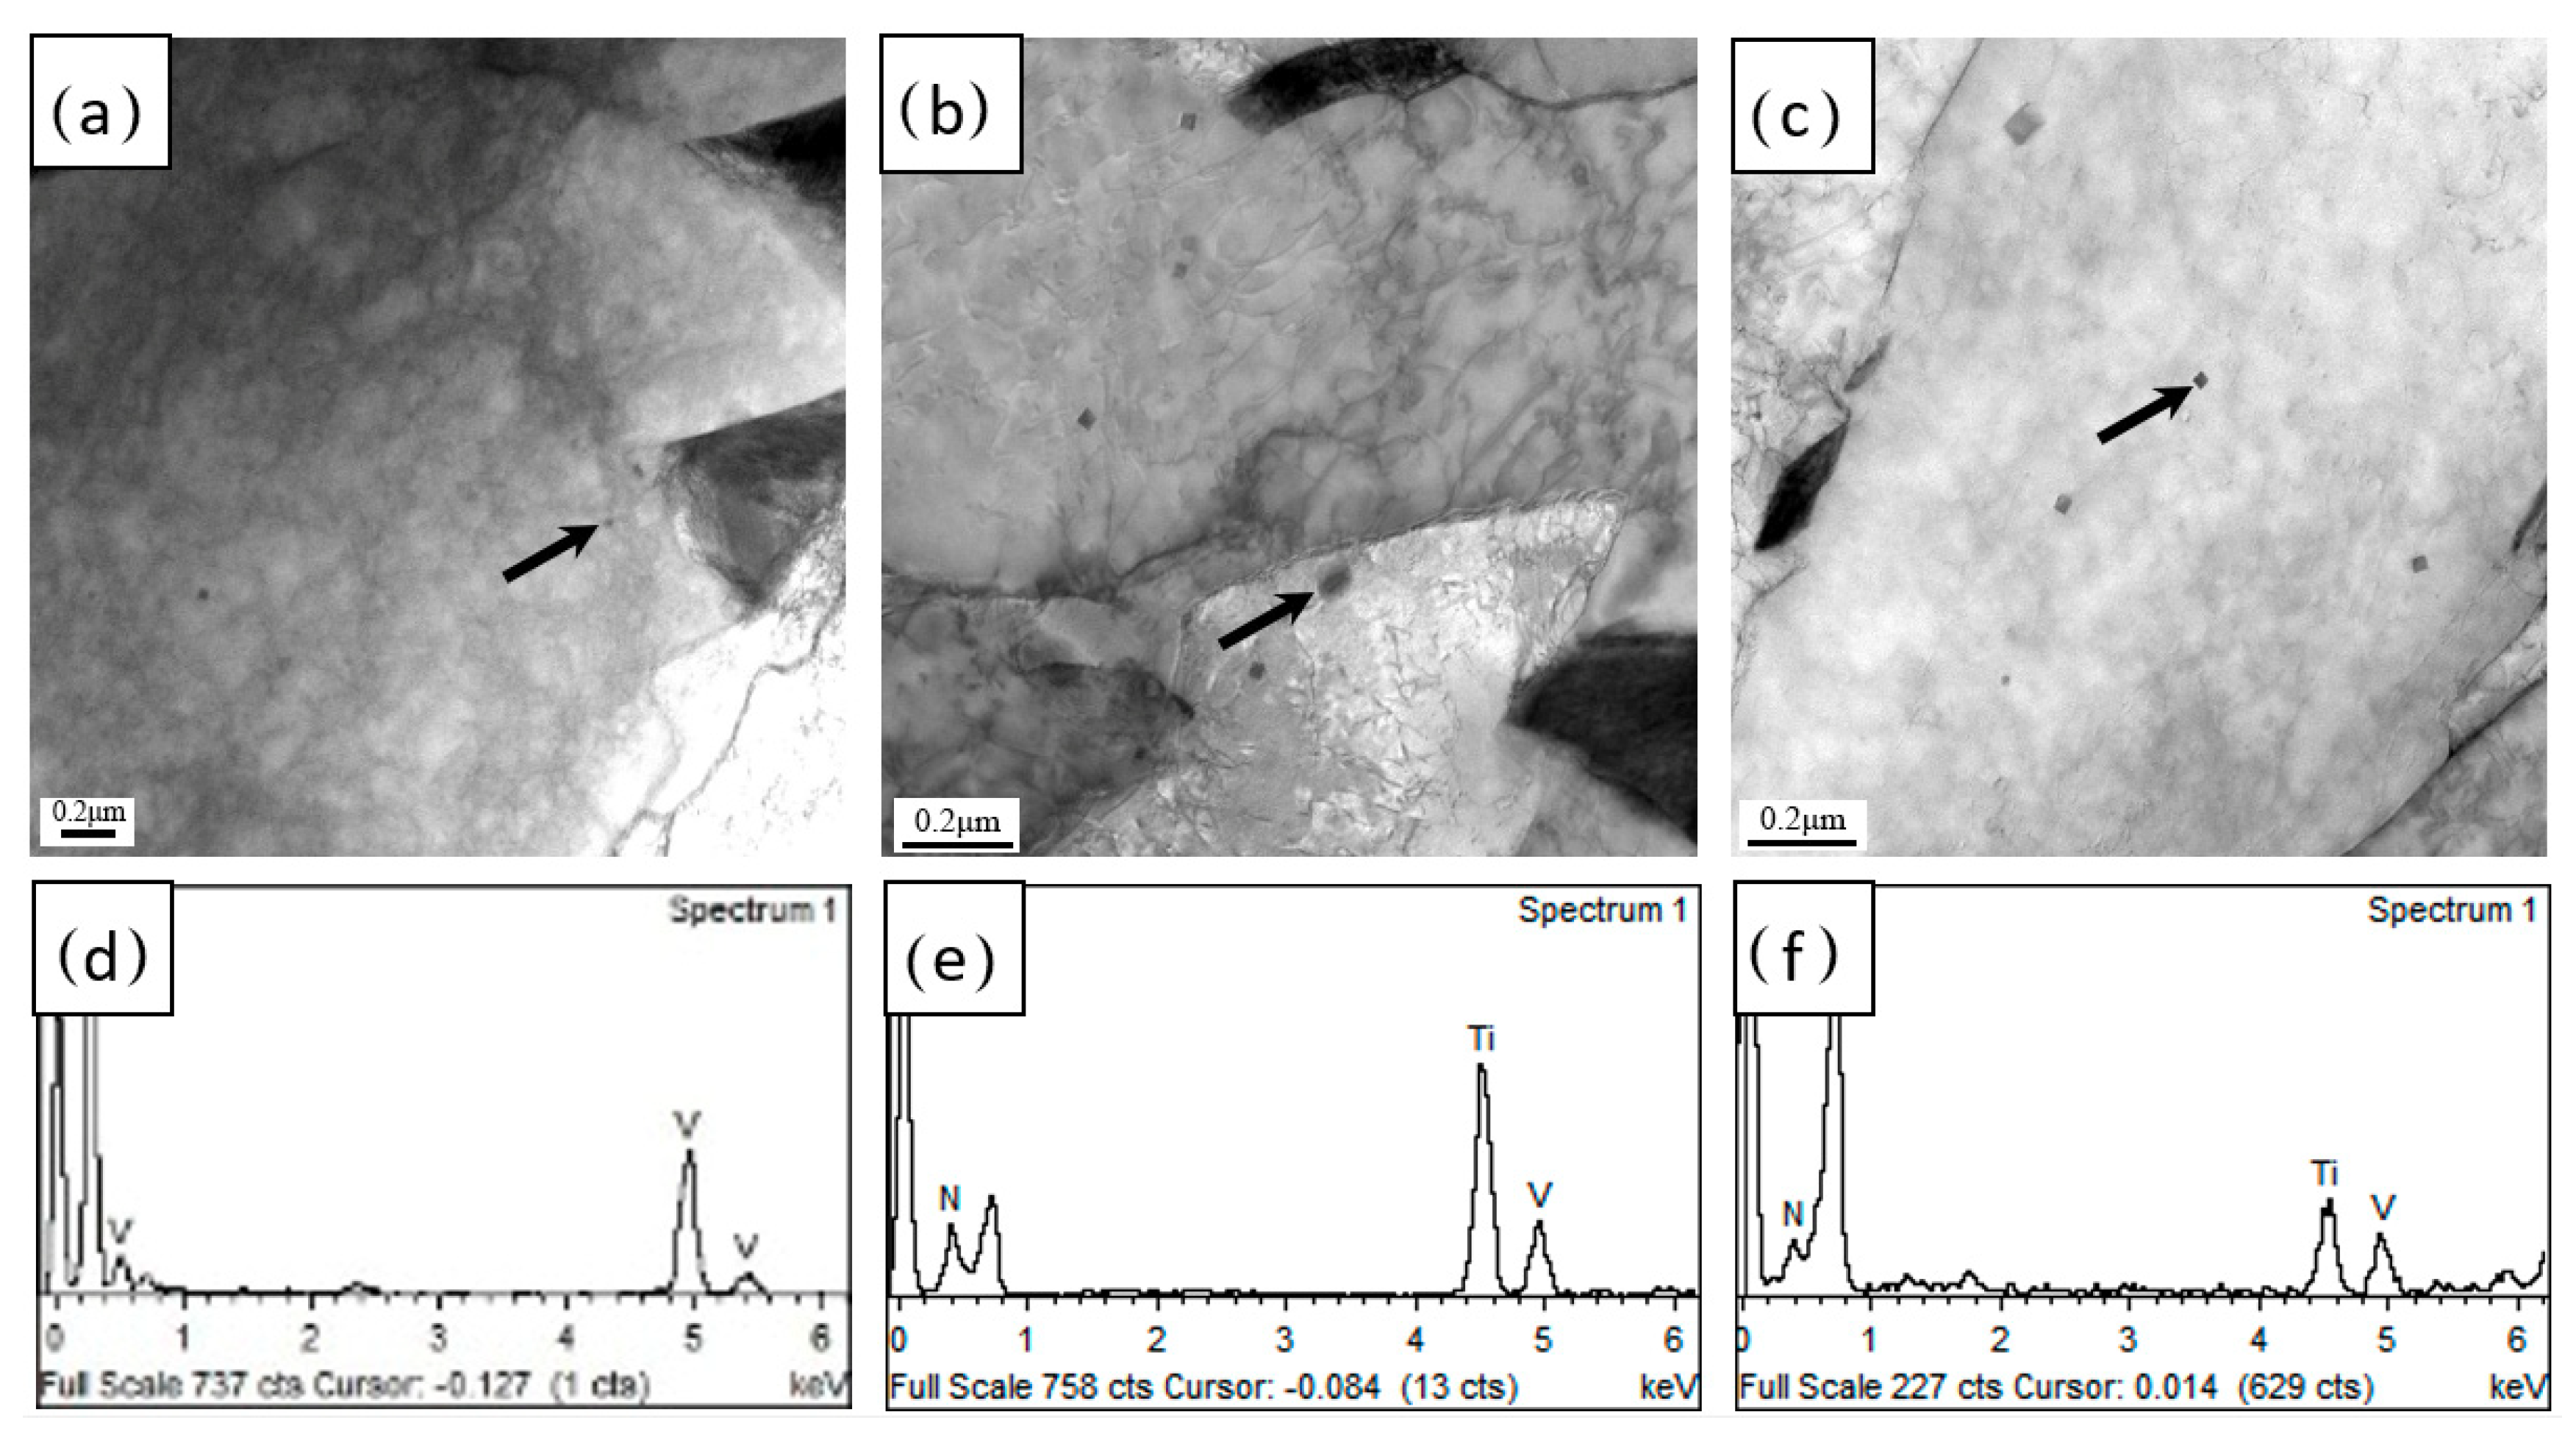
3.3. Precipitation and Dislocations

The observed typical precipitates and corresponding EDX analyses in each CP sample by TEM were shown in Figure 8. The precipitated particles could be classified into two different types by their composition/shape/size including: the Ti-rich (Ti,V)(C,N)/cubic/30–100 nm and the V(C,N)/spherical/10–20 nm precipitates. The former one was a complex precipitate of the TiN, which likely survived during the reheating stage, and the V(C,N), which formed on the controlled rolling and cooling stageswhile the latter one might form on the controlled cooling stage. The average size and the volume fraction (Dp/fp) of precipitated particles in each CP sample was further quantitatively determined, which is shown in Table 2 in which both increased along with the changes from CP-A to CP-E.
The XRD spectra corresponding to different CP samples were presented in Figure 9. With this XRD spectrum used, the dislocation density, ρ, was calculated using the following equation.
ρ = 6 π ε 2 b 2
where ε represents nonuniform strain and b is the Burgers vector for the dislocation in α-phase. Both ε and b were determined by XRD line profiles [20].
The average dislocation density, ρ, in each CP sample was determined, which is shown in Table 2. The present value was around 2 × 10¹⁴ m−2 and was close to the obtained results from the similar ferritic and bainitic microstructure via XRD line profiles (i.e., (1–7) × 1015 m−2) [5,20] and EBSD (i.e., (2–3) × 1014 m−2) [23]. This indicates a very reasonable result. In addition, as pointed out in Table 2, the average density of dislocations in the PF + AF + GBF matrix decreased with the changes from CP-A to CP-E.

4. Discussion

A mixed microstructure of PF + AF + GBF with the dispersed M-A constituent, which is shown in Figure 5 and Figure 6, developed in different CP samples undergoing the initial cooling from 850 to 780 °C and the subsequent cooling from 780 °C to a series of finish cooling temperatures from 570 to 450 °C through their respective paths during which the γ→α phase transition occurred in low-C Mo-V-Ti-N steel. The microstructural features were quantified and are summarized in Table 2. The PF, AF, and M-A constituent increased along with the changes from CP-A to CP-E while the GBF decreased, which results in the simultaneous decreases in YS, TS, and YR of different degrees. The mechanism controlling the correlations among the CP, the microstructure, and the tensile properties was further examined in the following sections.

4.1. Effect of the Cooling Path on the Microstructure

4.1.1. Effect of the Cooling Path on the PF + AF + GBF Matrix

When considering the microstructure controlled by the CP, the same sample as the one for TMCP simulation was prepared, reheated, two-step hot compressed, and cooled at a rate of 15 to 25 °C/s according to Figure 1. The expansion curves were measured using a dilatometry, which is shown in Figure 10. It is believed that the whole transformation occurred in two stages: γ→PF + AF + GBF + γ’ and γ’→M-A and produced a mixture microstructure of PF + AF + GBF + M-A.
The transformation products of PF, AF, and GBF were in sequence of the phase transition temperature domain, according to previous studies [24,25]. In addition, the PF/AF nucleates possibly at the Ti-riched (Ti,V)(C,N) particles [10] and in the dislocation substructure [26]. Furthermore, Figure 5 and Figure 6 demonstrate that the amount of PF and AF increased with the changes from CP-A to CP-E. The GBF, which appeared mainly at the PAG, PF, and AF boundaries decreased accordingly.
Of all the CP samples considered, the CP-A sample should have the highest supercooling degree for the whole γ→PF + AF + GBF phase transformation since the deformed samples underwent different cooling paths and a subsequent air-cooling. This would probably cause the highest nucleation rate for this transformation of γ→PF + AF + GBF and ultimately lead to the finest equivalent grain of the PF + AF + GBF mixed microstructure. Due to this, as Figure 7 and Table 2 show, the equivalent grain size (i.e., the MED) of this PF + AF + GBF mixed microstructure increased with the changes from CP-A to CP-E.
Furthermore, the GBF was assumed to transform in a lower temperature domain (i.e., a lower Bs, representing the starting temperature for bainite transformation) and correspondingly had a higher dislocation density than the PF and AF (Figure 6) based on Bhadeshia et al. [27,28]. In their studies, the dislocation density of bainite was negatively correlated with the Bs, as the bainitic transformation took place in the temperature ranging from 297 °C to 647 °C. With the changes from CP-A to CP-E, the amount of GBF decreased, which leads to a decreased average density of dislocation, ρ, in the PF + AF + GBF matrix, which is shown in Figure 6 and in Table 2.
In addition, the fraction of LAGB in each CP sample has also been summarized in Table 2. The LAGB could be also regarded as an EBSD grain boundary closely related to a pileup of dislocations, according to ref. [21]. Therefore, the decreased average density of dislocation corresponded with a decreasing fraction of LAGB.

4.1.2. Effect of the Cooling Path on the M-A Constituent

The amount of PF and AF increased with the changes from CP-A to CP-E, which is shown in Figure 5 and Figure 6, and accordingly the surrounded area by adjacent PF and AF increased, which resulted in an increased amount of metastable austenite (γ′) during the continuous cooling transformation.
The γ→PF + AF + GBF + γ′ transition taking place in a relatively high temperature region was followed by the diffusion of C and N atoms from the α to the γ′. According to Speer et al. [29] and Toji et al. [30], the carbon partitioning from carbon-supersaturated α to metastable γ′ during the inter-critical thermal process is essential for the austenite stabilization. On the other hand, the partitioning of substitutional alloying elements such as Mn, Si, and Mo seems not to be neglected in this process [31,32]. Actually, Seo et al. [33] recently reported that carbon partitioning could be completed within 3 s while the partitioning of Mn and Si into austenite was effectively initiated after carbon partitioning and their diffusion distances were less than 10 nm for a partitioning of 300 s. Therefore, it was supposed that the interstitial atom partitioning probably has a much stronger impact on the γ′ stabilization than the substitutional atom partitioning. This would produce the C and N atoms enriched in γ′, which is estimated from TEM observations. Furthermore, with the changes from CP-A to CP-E, the cooling rate decreased, the finish cooling temperature increased, and the holding time at a higher temperature increased, which promoted the diffusion of C and N atoms. Consequently, the enrichment of C and N atoms might increase and thereby stabilize the γ′ to a certain degree [34]. The metastable γ′ might transform to the M-A constituent [16] subsequently in air cooling. Thus, the changes from CP-A to CP-E eventually led to an increase in the amount of the M-A constituent, which is shown in Figure 5 and Figure 6 and Table 2.
Additionally, in comparison to other samples, the CP-E sample stayed at a relatively high temperature domain for a relatively long duration, which allowed a relatively sufficient C/N atom diffusion from the α to the γ′ and ultimately led to the massive M-A constituent formation in the subsequent air-cooling. This is presented in Figure 6c. In contrast, the CP-A sample allowed a deficient C and N atom diffusion and, accordingly, the small-sized slender M-A constituent formation, which is presented in Figure 6a.

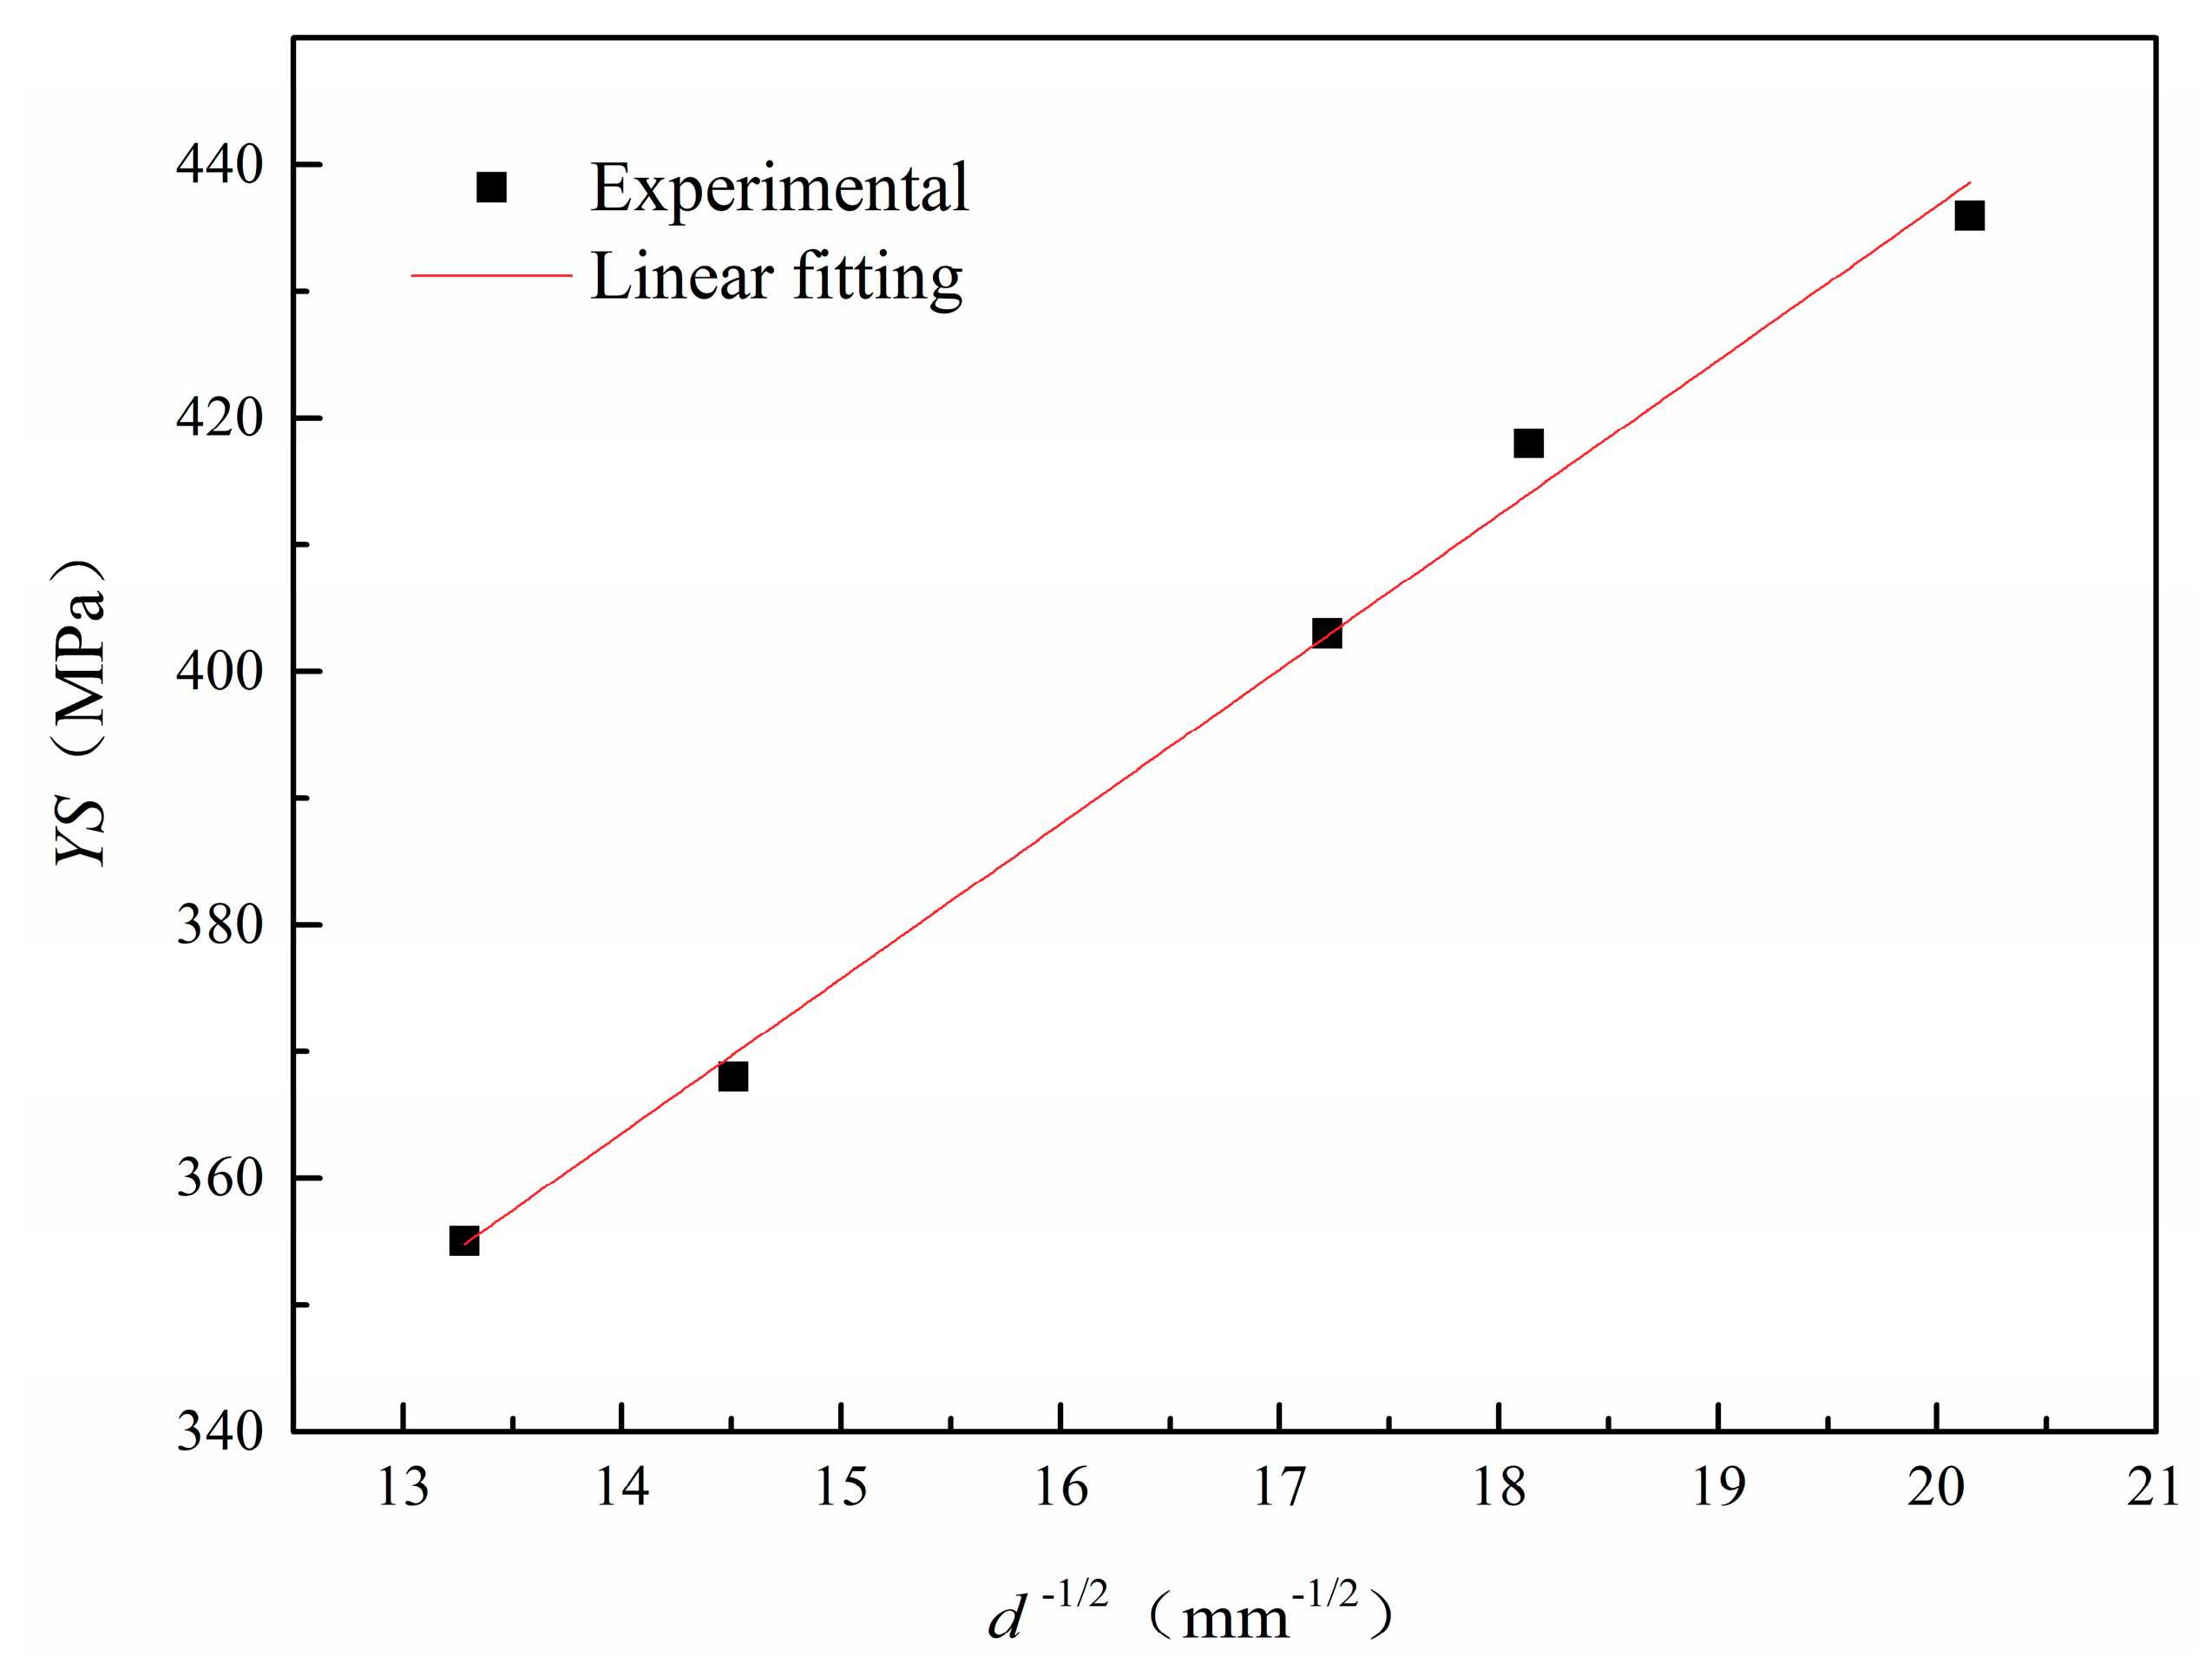
4.2. Effect of the Cooling Path on the YS

The ultimate microstructure of different CP samples was comprised of PF + AF + GBF + M-A, which covers a diverse range of microstructural characteristics including the effective grain size of PF + AF + GBF matrix, precipitate, dislocation, and the M-A constituent, etc. All these characteristics (Table 2) could affect the YS, which ought to change with the CP.
To estimate the effect of the grain size on the YS, σy, the following Hall–Petch relation [35,36] was used.
σ y = σ 0 + k HP d 1 / 2
where σ0 represents the other strengthening mechanisms. kHP·d−1/2 stands for the boundary strengthening. kHP is the structural constant used in this work for characterizing the impact of the PF + AF + GBF effective grain size on the YS and d is the effective grain size in accordance with the MEDθ for the mixed PF + AF + GBF grains with boundaries at the misorientation angle of θ. Generally speaking, Hall–Petch relation is usually used for the description of the dependence of yield strength on the dHAGB. However, the EBSD technique has been recently developed for determining the size (mean equivalent diameter, MED) of LAGB with the misorientation angle ranging from 2° to 15°. Some precious works [7,20,21] reported that the LAGB could have an influence on the yield strength by controlling the dislocation movement. ref. [16] reported that the LAGB followed the Hall–Petch relation more than the HAGB because of a higher correlation factor for linear fitting than the latter. The value of σy for different CP samples was plotted against the MED−1/2 for a misorientation tolerance angle of 2° to 30°. The corresponding correlation coefficients were determined as 0.92–0.98. In contrast, the MED–1/2 for a relatively low misorientation tolerance angle of 2° to 15° displayed a better linear relation to the σy. A linear fitting was made as the σy vs. MED−1/2 for each CP sample with the misorientation angle of 2° ≤ θ ≤ 15° estimated, as shown in Figure 11. The corresponding correlation coefficient was 0.98. The following equation was obtained via linear regression.
σ g = 193 + 12 d 1 / 2
The boundary strengthening contribution to the YS is estimated by the effective PF + AF + GBF grain in each CP sample. It is summarized in Table 3. As indicated in this table, the boundary strengthening decreased with the changes from CP-A to CP-E due to the increased effective grain size (MED2°θ15°) of the mixed PF + AF + GBF microstructure (Table 2).
The dislocation strengthening contribution, σd, to the YS was determined by using the equation [37] below.
σ d = α M G b ρ 1 / 2
where α is a constant and could be 0.15 [37], M is the Taylor factor value for ferritic steel determined as 2.73 [38], G is the shear modulus for low-carbon steel and equals 81.6 GPa [39], and b is the Burgers vector for α-Fe of the bcc structure and equals 0.248 nm [20]. The mathematical derivation and concrete results are also presented in the corresponding references. ρ is the dislocation density for each CP sample measured via XRD, which is presented in Table 2. The dislocation strengthening contribution to the YS of each CP sample is exhibited in Table 3. As indicated, the dislocation strengthening contribution decreased slightly based on the changes from CP-A to CP-E, which resulted from the thinner dislocations in the PF + AF + GBF matrix.
The Ti-rich (Ti,V)(C,N) complex particles formed in austenite of different CP samples in relatively small amounts and in a large size could offer a limited precipitation strengthening [9,40]. In contrast, the precipitation of small V(C,N) particles in high density in ferrite, as indicated in Figure 8 and Table 2, could produce a significant contribution to strengthening [41]. Therefore, the precipitation strengthening occurrence in each CP sample was estimated by using the following equation [19,38].
σ p = 11.3 f p 1 / 2 D p ln ( D p / 0.496 ) × 10 3
where fp and Dp are the volume fraction and average size of precipitated particles, which is presented in Table 2. The contributions of precipitation strengthening to the YS of different CP samples were shown in Table 3. As presented in this table, the contribution from precipitation strengthening increased with the changes from CP-A to CP-E, which caused a significant increase in the fp despite also leading to a slight increase in the Dp.
Besides the previously mentioned strengthening factors, the (σ0 + σs + σM-A) was determined as ~45 ± 5 MPa by referring to previous works in ref. [5,16] through the following equation.
σ 0 + σ s + σ M - A = σ y ( σ g + σ d + σ p )
where σ0 + σs + σM-A was the sum of lattice friction stress, solid solution strengthening, and strengthening by an M-A constituent. The sum σ0 + σs + σM-A for each CP sample was thus calculated and is summarized in Table 3. As presented, the σ0 + σs + σM-A increased with the changes from CP-A to CP-E, possibly owing to an increasing amount of the M-A constituent (Figure 5 and Figure 6 and Table 2). The M-A constituent is normally harder than the surrounding ferritic matrix, according to ref. [42,43], and hence it enhanced the YS. Table 2 and Table 3 displayed that the YS increased slightly with an increased portion of M-A particles. This estimation was in good agreement with previous works [44,45].
From all the strengthening contributions (Table 3) that are compared, it was found that the σg, σd, and σp accounted for 44% to 55%, 29% to 32%, and 6% to 8%, respectively, of the YS. This estimation indicates that, except the sum σ0 + σs + σM-A, all the microstructural attributes might be listed in ascending order by their contributions to strengthening as precipitates, dislocations, and effective grain of ferrite. Furthermore, the σg made up about half the YS and predominated over any other strengthening contributions, which indicate that the effective grain refinement was the one of the most efficient ways to enhance the YS of such a ferritic and bainitic steel.
To sum up, the changes from CP-A to CP-E caused a decrease in the supercooling degree for the γ→α transformation, coarsened the effective PF + AF + GBF grain, and thinned the dislocations accordingly, which led to the notable decrease in the strengthening contribution. In contrast, this change in the cooling path also led to a slightly increased amount of fine precipitated particles, which resulted in a slightly enhanced contribution to strengthening. Consequently, the overall YS decreased with the changes from CP-A to CP-E.

4.3. Effect of the Elevated Cooling Path on the TS and YR

The TS decreased slightly while the YS decreased significantly with the changes from CP-A to CP-E, which is shown in Figure 3 and Figure 4. This leads to increases in the strain-hardening magnitude Δσ and simultaneous decreases in the YR and increases in the capacity of work-hardening. This enhanced work-hardening capacity can probably offer an improved overloading resistance and an elevated defect tolerance to a steel structure [46].
The ultimate microstructure of different CP samples, which is shown in Figure 5 and Figure 6, was composed of the PF + AF + GBF + M-A constituent. Among these microstructural constituents, the M-A constituent could be harder than the ferritic and bainitic matrix, according to previous studies [42,43], and thereby act as a hard phase during the tension of this multiphase steel, for producing a locally high-degree plastic deformation of the surrounded ductile ferrite phase [47]. The overall strain-hardening capacity could, therefore, be enhanced due to an increasing amount of a hard phase [46,47].
Considering all the CP samples, the dependence of TS, Δσ, and YR on the amount of the M-A constituent was also determined, which is presented in Figure 12. The TS, the YS, and the YR, in turn, decreased almost linearly with an increased portion of the M-A constituent, fM-A, from 4.8% to 7.7%, due to the changes from CP-A to CP-C. When the CP and the corresponding fM-A were changed further to CP-E and 9.3%, respectively, the TS and YS decreased further, the Δσ enhanced, and the YR decreased drastically. The possible reason might be that an increase in the PF + AF + GBF grain size led to a substantial reduction in the YS.
Anyway, this attempt also showed that the yield ratio and the capacity for strain hardening have been improved markedly by reducing the cooling rate and elevating the finish cooling temperature for a controlled cooling schedule.

5. Conclusions

The two-stage controlled rolling and controlled cooling of a low-C Mo-V-Ti-N steel at different cooling paths (CP) were simulated and the effects of CP on the microstructure and tensile properties have been estimated in this study. The conclusions are summarized below.
  • The microstructure was primarily composed of PF, AF, GBF, and the M-A constituent in each CP sample. The reduced cooling rate and elevated finish cooling temperature led to a decrease in GBF and increases in PF, AF, and M-A constituent.
  • The reduced cooling rate and elevated cooling temperature caused an increased effective PF + AF + GBF grain size and an increased amount of precipitates despite a decreased dislocation density and ultimately resulted in the overall YS. They also caused an increase in the amount of M-A constituent, which lowered the YR and accordingly improved the capacity for strain-hardening of the mixed microstructure.

Author Contributions

Conceptualization, Q.W. Methodology, S.Z. Software, G.S. Validation, X.X. Formal Analysis, X.X. Investigation, S.Z. and G.S. Resources, Q.W. Data Curation, X.X. Writing-Original Draft Preparation, X.X. Writing-Review & Editing, X.X. Visualization, X.X. Supervision, X.X. Project Administration, Q.W. Funding Acquisition, Q.W.

Funding

This research was funded by [the National Natural Science Foundation of China] grant number [51471142] and [51671165]. The APC was funded by [51471142].

Acknowledgments

This work is supported by the National Natural Science Foundation of China (Grant No. 51471142 and No. 51671165).

Conflicts of Interest

The authors declare no conflict of interest.

References

  1. Chen, J.; Tang, S.; Liu, Z.-Y.; Wang, G.-D. Microstructural characteristics with various cooling paths and the mechanism of embrittlement and toughening in low-carbon high performance bridge steel. Mater. Sci. Eng. A 2013, 559, 241–249. [Google Scholar] [CrossRef]
  2. Chen, J.; Tang, S.; Liu, Z.; Wang, G. Influence of molybdenum content on transformation behavior of high performance bridge steel during continuous cooling. Mater. Des. 2013, 49, 465–470. [Google Scholar] [CrossRef]
  3. Hu, J.; Du, L.-X.; Wang, J.-J.; Xie, H.; Gao, C.-R.; Misra, R.D.K. Structure–mechanical property relationship in low carbon microalloyed steel plate processed using controlled rolling and two-stage continuous cooling. Mater. Sci. Eng. A 2013, 585, 197–204. [Google Scholar] [CrossRef]
  4. Morrison, W.B. Microalloy steels–The beginning. Mater. Sci. Technol. 2009, 25, 1066–1073. [Google Scholar] [CrossRef]
  5. Yakubtsov, I.A.; Poruks, P.; Boyd, J.D. Microstructure and mechanical properties of bainitic low carbon high strength plate steels. Mater. Sci. Eng. A 2008, 480, 109–116. [Google Scholar] [CrossRef]
  6. Zhao, M.-C.; Yang, K.; Shan, Y. The effects of thermo-mechanical control process on microstructures and mechanical properties of a commercial pipeline steel. Mater. Sci. Eng. A 2002, 335, 14–20. [Google Scholar] [CrossRef]
  7. Olasolo, M.; Uranga, P.; Rodriguez-Ibabe, J.M.; López, B. Effect of austenite microstructure and cooling rate on transformation characteristics in a low carbon Nb–V microalloyed steel. Mater. Sci. Eng. A 2011, 528, 2559–2569. [Google Scholar] [CrossRef]
  8. Loberg, B.; Nordgren, A.; Strid, J.; Easterling, K.E. The Role of Alloy Composition on the Stability of Nitrides in Ti-Microalloyed Steels during Weld Thermal Cycles. Metall. Trans. A 1984, 15, 33–41. [Google Scholar] [CrossRef]
  9. Wang, G.R.; Lau, T.W.; Weatherly, G.C.; North, T.H. Weld Thermal Cycles and Precipitation Effects in Ti-V-Containing Hsla Steels. Metall. Trans. Phys. Metall. Mater. Sci. USA 1989, 20A:10. [Google Scholar] [CrossRef]
  10. Shi, Z.; Chai, X.; Chai, F.; Su, H.; Pan, T.; Wang, Q.; Wang, R.; Yang, C. The mechanism of intragranular ferrite formed on Ti-rich (Ti,V)(C,N) precipitates in the coarse heat affected zone of a V–N–Ti microalloyed steel. Mater. Lett. 2016, 175, 266–270. [Google Scholar] [CrossRef]
  11. Shi, Z.; Yang, C.; Wang, R.; Su, H.; Chai, F.; Chu, J.; Wang, Q. Effect of nitrogen on the microstructures and mechanical properties in simulated CGHAZ of vanadium microalloyed steel varied with different heat inputs. Mater. Sci. Eng. A 2016, 649, 270–281. [Google Scholar] [CrossRef]
  12. Bandyopadhyay, P.S.; Ghosh, S.K.; Kundu, S.; Chatterjee, S. Evolution of Microstructure and Mechanical Properties of Thermomechanically Processed Ultrahigh-Strength Steel. Metall. Mater. Trans. A 2011, 42, 2742–2752. [Google Scholar] [CrossRef]
  13. Liu, Y.; Shao, Y.; Liu, C.; Chen, Y.; Zhang, D. Microstructure Evolution of HSLA Pipeline Steels after Hot Uniaxial Compression. Materials 2016, 9, 721. [Google Scholar] [CrossRef] [PubMed]
  14. Guo, B.; Fan, L.; Wang, Q.; Fu, Z.; Wang, Q.; Zhang, F. Effect of Finish Rolling Temperature on the Microstructure and Tensile Properties of Nb–Ti Microalloyed X90 Pipeline Steel. Metals 2016, 6, 323. [Google Scholar] [CrossRef]
  15. Tomita, Y. Effect of hot-rolling reduction on shape of sulfide inclusions and fracture toughness of AISI 4340 ultrahigh strength steel. Metall. Trans. A 1988, 19, 1555–1561. [Google Scholar] [CrossRef]
  16. Fan, L.; Zhou, D.; Wang, T.; Li, S.; Wang, Q. Tensile properties of an acicular ferrite and martensite/austenite constituent steel with varying cooling rates. Mater. Sci. Eng. A 2014, 590, 224–231. [Google Scholar] [CrossRef]
  17. Sung, H.K.; Lee, D.H.; Shin, S.Y.; Lee, S.; Yoo, J.Y.; Hwang, B. Effect of finish cooling temperature on microstructure and mechanical properties of high-strength bainitic steels containing Cr, Mo, and B. Mater. Sci. Eng. A 2015, 624, 14–22. [Google Scholar] [CrossRef]
  18. Zhang, J.; Wang, F.-M.; Yang, Z.-B.; Li, C.-R. Effect of Cooling Rate on Precipitation Behavior and Micromechanical Properties of Ferrite in V-N Alloyed Steel During a Simulated Thermomechanical Process. Metall. Mater. Trans. A 2017, 48, 6142–6152. [Google Scholar] [CrossRef]
  19. Fan, L.; Wang, T.; Fu, Z.; Zhang, S.; Wang, Q. Effect of heat-treatment on-line process temperature on the microstructure and tensile properties of a low carbon Nb-microalloyed steel. Mater. Sci. Eng. A 2014, 607, 559–568. [Google Scholar] [CrossRef]
  20. García-Mateo, C.; Caballero, F.G.; Bhadeshia, H.K.D.H. Mechanical Properties of Low-Temperature Bainite. Mater. Sci. Forum 2005, 500–501, 495–502. [Google Scholar] [CrossRef]
  21. Kaijalainen, A.J.; Suikkanen, P.P.; Limnell, T.J.; Karjalainen, L.P.; Kömi, J.I.; Porter, D.A. Effect of austenite grain structure on the strength and toughness of direct-quenched martensite. J. Alloys Compd. 2013, 577, S642–S648. [Google Scholar] [CrossRef]
  22. Iza-Mendia, A.; Gutiérrez, I. Generalization of the existing relations between microstructure and yield stress from ferrite–pearlite to high strength steels. Mater. Sci. Eng. A 2013, 561, 40–51. [Google Scholar] [CrossRef]
  23. Calcagnotto, M.; Ponge, D.; Demir, E.; Raabe, D. Orientation gradients and geometrically necessary dislocations in ultrafine grained dual-phase steels studied by 2D and 3D EBSD. Mater. Sci. Eng. A 2010, 527, 2738–2746. [Google Scholar] [CrossRef]
  24. Xu, F.; Wang, Y.; Bai, B.; Fang, H. CCT Curves of Low-Carbon Mn-Si Steels and Development of Water-Cooled Bainitic Steels. J. Iron Steel Res. Int. 2010, 17, 46–50. [Google Scholar] [CrossRef]
  25. Kim, Y.M.; Lee, H.; Kim, N.J. Transformation behavior and microstructural characteristics of acicular ferrite in linepipe steels. Mater. Sci. Eng. A 2008, 478, 361–370. [Google Scholar] [CrossRef]
  26. Zhao, M.-C.; Yang, K.; Xiao, F.-R.; Shan, Y.-Y. Continuous cooling transformation of undeformed and deformed low carbon pipeline steels. Mater. Sci. Eng. A 2003, 355, 126–136. [Google Scholar] [CrossRef]
  27. Bhadeshia, H.K.D.H.; Christian, J.W. Bainite in steels. Metall. Trans. A 1990, 21, 767–797. [Google Scholar] [CrossRef]
  28. Takahashi, M.; Bhadeshia, H.K.D.H. Model for transition from upper to lower bainite. Mater. Sci. Technol. 1990, 6, 592–603. [Google Scholar] [CrossRef]
  29. Speer, J.; Matlock, D.K.; De Cooman, B.C.; Schroth, J.G. Carbon partitioning into austenite after martensite transformation. Acta Mater. 2003, 51, 2611–2622. [Google Scholar] [CrossRef]
  30. Toji, Y.; Miyamoto, G.; Raabe, D. Carbon partitioning during quenching and partitioning heat treatment accompanied by carbide precipitation. Acta Mater. 2015, 86, 137–147. [Google Scholar] [CrossRef]
  31. Toji, Y.; Matsuda, H.; Herbig, M.; Choi, P.-P.; Raabe, D. Atomic-scale analysis of carbon partitioning between martensite and austenite by atom probe tomography and correlative transmission electron microscopy. Acta Mater. 2014, 65, 215–228. [Google Scholar] [CrossRef]
  32. Dai, Z.; Ding, R.; Yang, Z.; Zhang, C.; Chen, H. Elucidating the effect of Mn partitioning on interface migration and carbon partitioning during Quenching and Partitioning of the Fe-C-Mn-Si steels: Modeling and experiments. Acta Mater. 2018, 144, 666–678. [Google Scholar] [CrossRef]
  33. Seo, E.J.; Cho, L.; De Cooman, B.C. Kinetics of the partitioning of carbon and substitutional alloying elements during quenching and partitioning (Q&P) processing of medium Mn steel. Acta Mater. 2016, 107, 354–365. [Google Scholar] [CrossRef]
  34. Wang, S.-C.; Yang, J.-R. Effects of chemical composition, rolling and cooling conditions on the amount of martensite/austenite (M/A) constituent formation in low carbon bainitic steels. Mater. Sci. Eng. A 1992, 154, 43–49. [Google Scholar] [CrossRef]
  35. Hall, E.O. The Deformation and Ageing of Mild Steel: III Discussion of Results. Proc. Phys. Soc. Sect. B 1951, 64, 747. [Google Scholar] [CrossRef]
  36. Hansen, N. Hall–Petch relation and boundary strengthening. Scr. Mater. 2004, 51, 801–806. [Google Scholar] [CrossRef]
  37. Hughes, D.A. Microstructure evolution, slip patterns and flow stress. Mater. Sci. Eng. A 2001, 319, 46–54. [Google Scholar] [CrossRef]
  38. Rosenberg, J.M.; Piehler, H.R. Calculation of the taylor factor and lattice rotations for bcc metals deforming by pencil glide. Metall. Trans. 1971, 2, 257–259. [Google Scholar] [CrossRef]
  39. Wang, Z.H.; Wang, Y.L.; Cao, Y.; Wang, Z. Measurement of shear modulus of materials based on the torsional mode of cantilever plate. Constr. Build. Mater. 2016, 124, 1059–1071. [Google Scholar] [CrossRef]
  40. Baker, T.N. Processes, microstructure and properties of vanadium microalloyed steels. Mater. Sci. Technol. 2009, 25, 1083–1107. [Google Scholar] [CrossRef] [Green Version]
  41. Zhang, S.; Liu, K.; Chen, H.; Xiao, X.; Wang, Q.; Zhang, F. Effect of increased N content on microstructure and tensile properties of low-C V-microalloyed steels. Mater. Sci. Eng. A 2016, 651, 951–960. [Google Scholar] [CrossRef]
  42. Taylor, M.D.; Choi, K.S.; Sun, X.; Matlock, D.K.; Packard, C.E.; Xu, L.; Barlat, F. Correlations between nanoindentation hardness and macroscopic mechanical properties in DP980 steels. Mater. Sci. Eng. A 2014, 597, 431–439. [Google Scholar] [CrossRef]
  43. Xu, W.W.; Wang, Q.F.; Pan, T.; Su, H.; Yang, C.F. Effect of Welding Heat Input on Simulated HAZ Microstructure and Toughness of a V-N Microalloyed Steel. J. Iron Steel Res. Int. 2007, 14, 234–239. [Google Scholar] [CrossRef]
  44. Matsuda, F.; Ikeuchi, K.; Okada, H.; Hrivnak, I.; Park, H.-S. Effect of M-A Constituent on Fracture Behavior of 780 and 980MPa Class HSLA Steels Subjected to Weld HAZ Thermal Cycles (Materials, Metallurgy & Weldability). Trans. JWRI 1994, 23, 231–238. [Google Scholar]
  45. Zheng, X.; Kang, Y.; Meng, D.; Shou-yong, A.; Xia, D. Effect of Cooling Start Temperature on Microstructure and Mechanical Properties of X80 High Deformability Pipeline Steel. J. Iron Steel Res. Int. 2011, 18, 42–71. [Google Scholar] [CrossRef]
  46. Zare, A.; Ekrami, A. Influence of martensite volume fraction on tensile properties of triple phase ferrite–bainite–martensite steels. Mater. Sci. Eng. A 2011, 530, 440–445. [Google Scholar] [CrossRef]
  47. Hüper, T.; Endo, S.; Ishikawa, N.; Osawa, K. Effect of Volume Fraction of Constituent Phases on the Stress-Strain Relationship of Dual Phase Steels. ISIJ Int. 1999, 39, 288–294. [Google Scholar] [CrossRef]
Figure 1. Schematic schedule for the simulated TMCP with a different cooling path in Gleeble.
Metals 08 00677 g001
Figure 2. Schematically samples for TMCP simulation (a) and wire-cut for tensile testing (b).
Metals 08 00677 g002
Figure 3. Engineering stress-strain curve for each tensile tested sample with differing CP.
Metals 08 00677 g003
Figure 4. Tensile properties of the different CP samples.
Metals 08 00677 g004
Figure 5. Typical optical micrograph of different CP samples displaying matrix/M-A: CP-A (a,d), CP-C (b,e) and CP-E (c,f). CP—cooling path, M-A—martensite-austenite, PF—polygonal ferrite, AF—acicular ferrite, GBF—granular bainitic ferrite.
Metals 08 00677 g005
Figure 6. Typical TEM observations of different CP samples at CP-A (a), CP-C (b), and CP-E (c) and the M-A constituent via bright/dark field (d,e) and SADP (f). AF—acicular ferrite, PF—polygonal ferrite, GBF—granular bainitic ferrite, M-A—martensite-austenite, CP—cooling path, SADP—selected area diffraction pattern.
Metals 08 00677 g006
Figure 7. EBSD IPF maps for different CP samples at CP-A (a), CP-C (b), and CP-E (c) with the misorientation angle ranging from 2° to 15° and higher than 15° is indicated by the white and black lines, respectively. IPF—inverse pole figures, CP—cooling path.
Metals 08 00677 g007
Figure 8. Typical TEM micrographs of precipitates in different CP samples and corresponding EDX analyses at CP-A (a,d), CP-C (b,e), CP-E (c,f).
Metals 08 00677 g008
Figure 9. Typical XRD spectra for different CP samples.
Metals 08 00677 g009
Figure 10. Expansion curves and Ar3 measured at 15 °C/s, 20 °C/s, and 25 °C/s.
Metals 08 00677 g010
Figure 11. YS vs. d–1/2 for different CP samples. YS—yield strength, CP—cooling path, d—effective grain size.
Metals 08 00677 g011
Figure 12. TS, YS, Δσ, and YR of different samples as functions of the portion of the M-A constituent, fM-A. M-A—martensite-austenite, YS—yield strength, TS—tensile strength, Δσ—magnitude for strain hardening, YR—yield ratio.
Metals 08 00677 g012
Table 1. Chemical compositions of experimental steel (wt. %).
CMnSiSPMoVNTiAlsO
0.0651.450.200.0050.0080.250.0600.01200.00830.0050.0008
Table 2. Microstructural observation and quantification results for different CP samples.
CPPhase CompositionfM-A/%MED2°≤θ≤15°/μmf2°≤θ≤15°/%Dp/nmfp/%Ρ/×1014 m−2
APF + AF + GBF + M-A4.82.4670.319.81.86 × 10−42.32
BPF + AF + GBF + M-A6.33.0466.820.42.10 × 10−42.19
CPF + AF + GBF + M-A7.73.3760.721.12.35 × 10−42.05
DPF + AF + GBF + M-A8.64.7555.221.72.62 × 10−41.94
EPF + AF + GBF + M-A9.35.6749.822.32.81 × 10−41.90
CP—cooling path, fM-A—area fraction of M-A constituent, MED2°≤θ≤15°—mean equivalent diameter of ferritic grains with the boundaries at the misorientation angle in the range from 2° to 15°, defined as the average size of effective grains, f2≤θ≤15°—fraction of ferritic grains with the boundaries at the misorientation angle in range of 2–15°, Dp—average size of precipitated particles, fp—volume fraction of precipitated particles, ρ—dislocation density, M-A—martensite-austenite, PF—polygonal ferrite, AF—acicular ferrite, GBF—granular bainitic ferrite.
Table 3. Detailed strengthening contribution by the corresponding microstructural feature for each CP sample.
CPYS/MPaσg/MPaσd/MPaσp/MPaσ0 + σs + σM-A/MPa
A436 ± 12243 ± 8126 ± 325 ± 242
B418 ± 13225 ± 7124 ± 427 ± 142
C403 ± 10210 ± 7119 ± 429 ± 245
D368 ± 13175 ± 5115 ± 530 ± 348
E355 ± 14162 ± 8114 ± 432 ± 247
CP—cooling path, YS—yield strength, σg—grain boundary strengthening, σd—dislocation strengthening, σp—precipitation strengthening, σ0—friction stress of lattice, σs—solid solution strengthening, σM-A—strengthening contributed by the M-A constituent.

