Forming Process, Microstructure, and Mechanical Properties of Thin-Walled 316L Stainless Steel Using Speed-Cold-Welding Additive Manufacturing


Abstract
:Featured Application
Abstract
1. Introduction
2. Materials and Methods
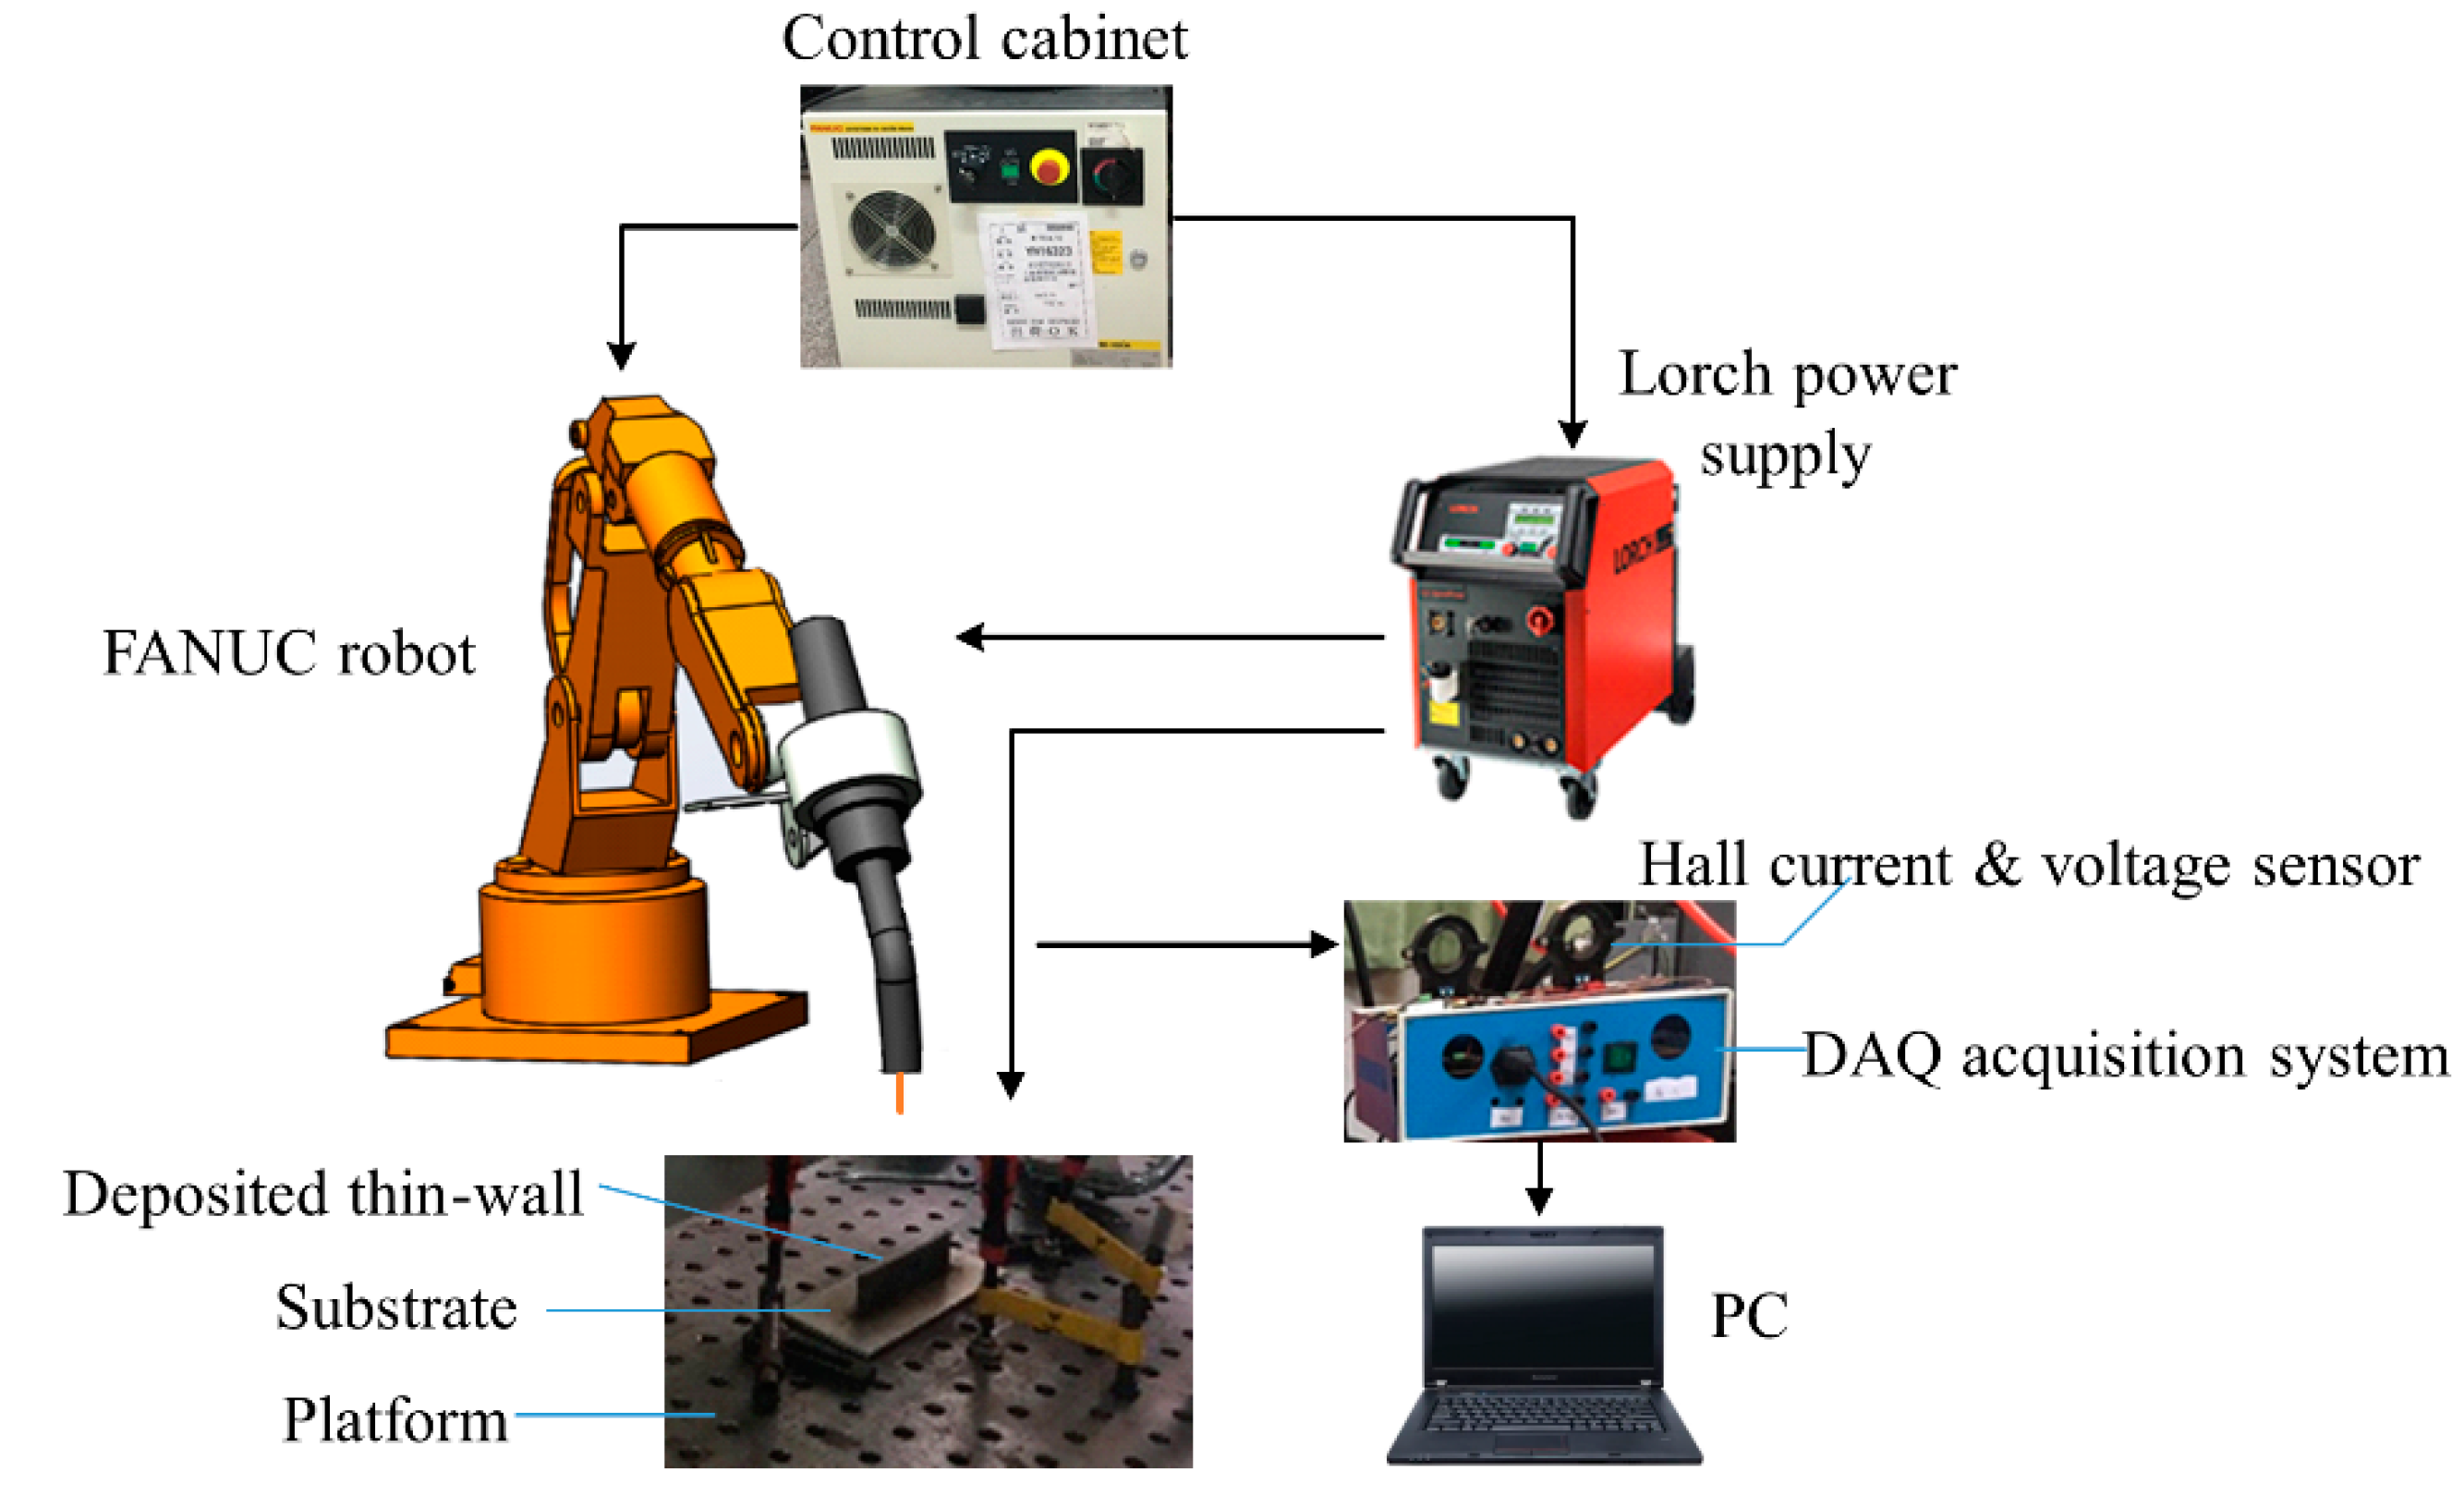
2.1. Test Materials and Equipment
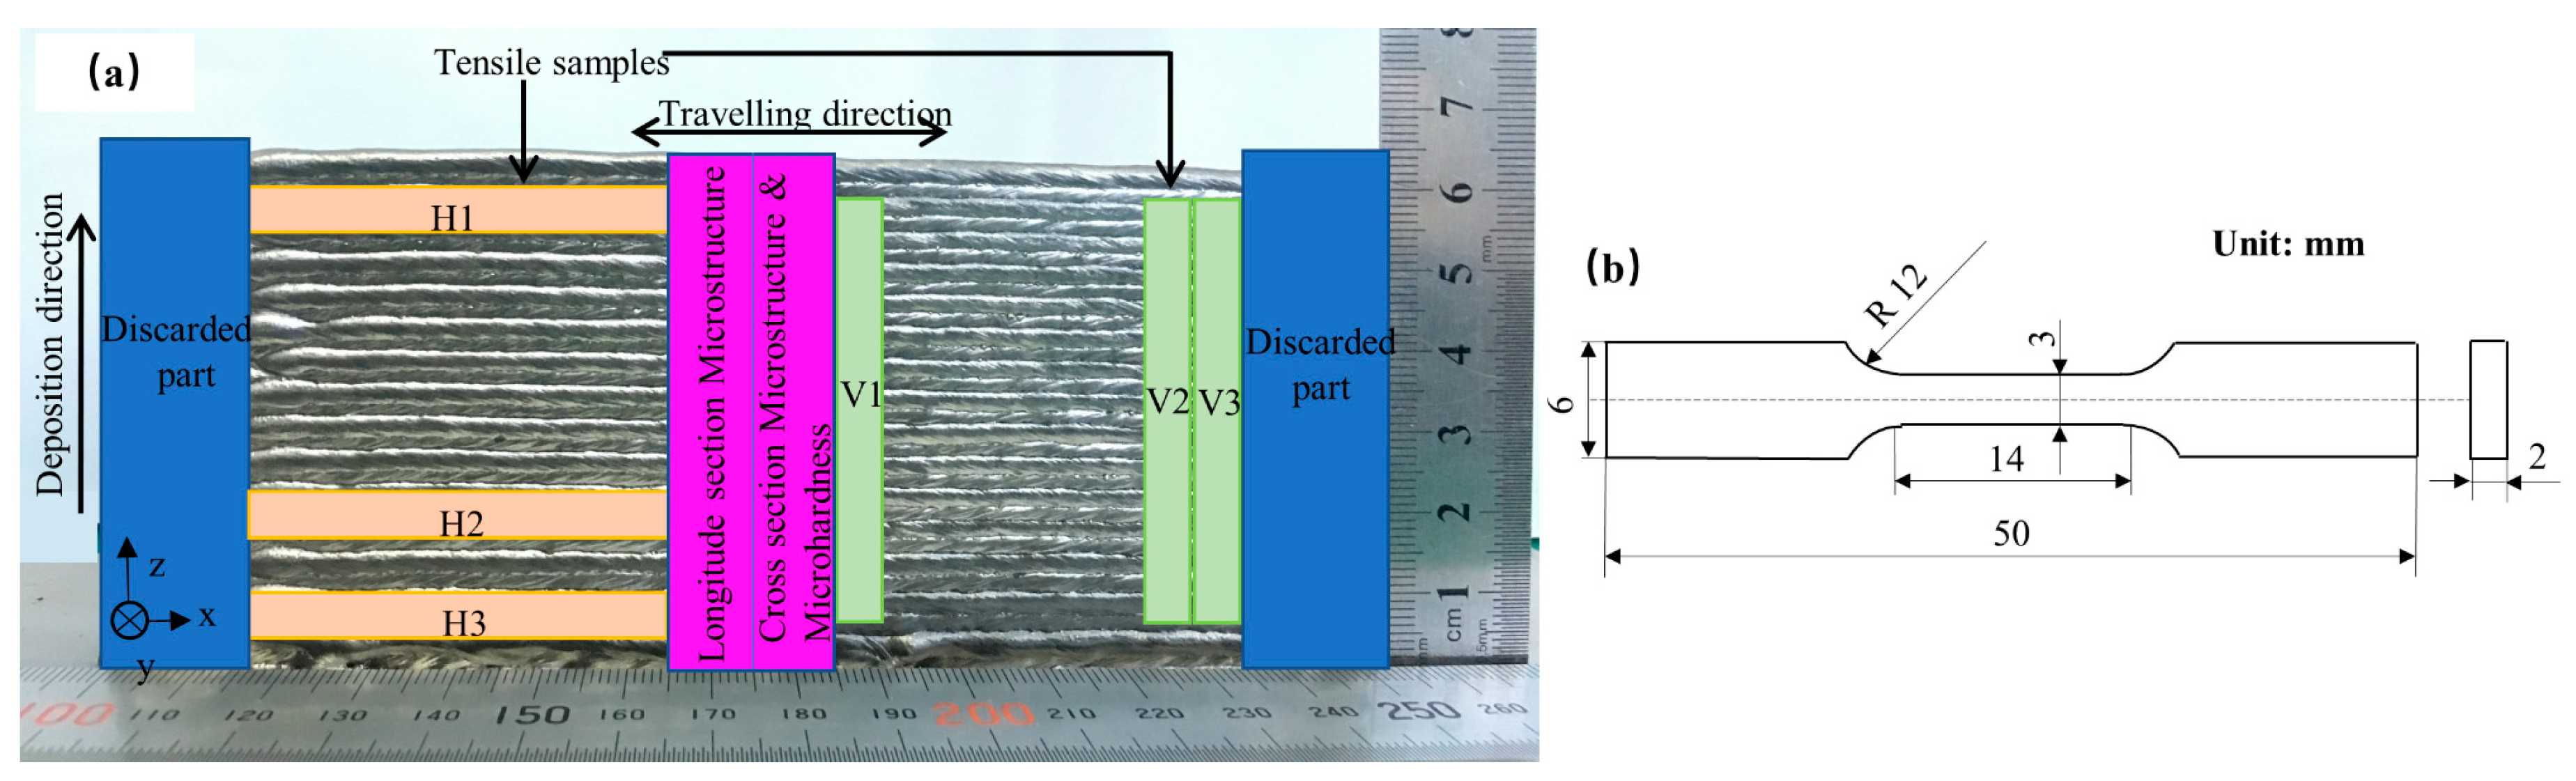
2.2. Experiment Conditions
3. Results and Discussion
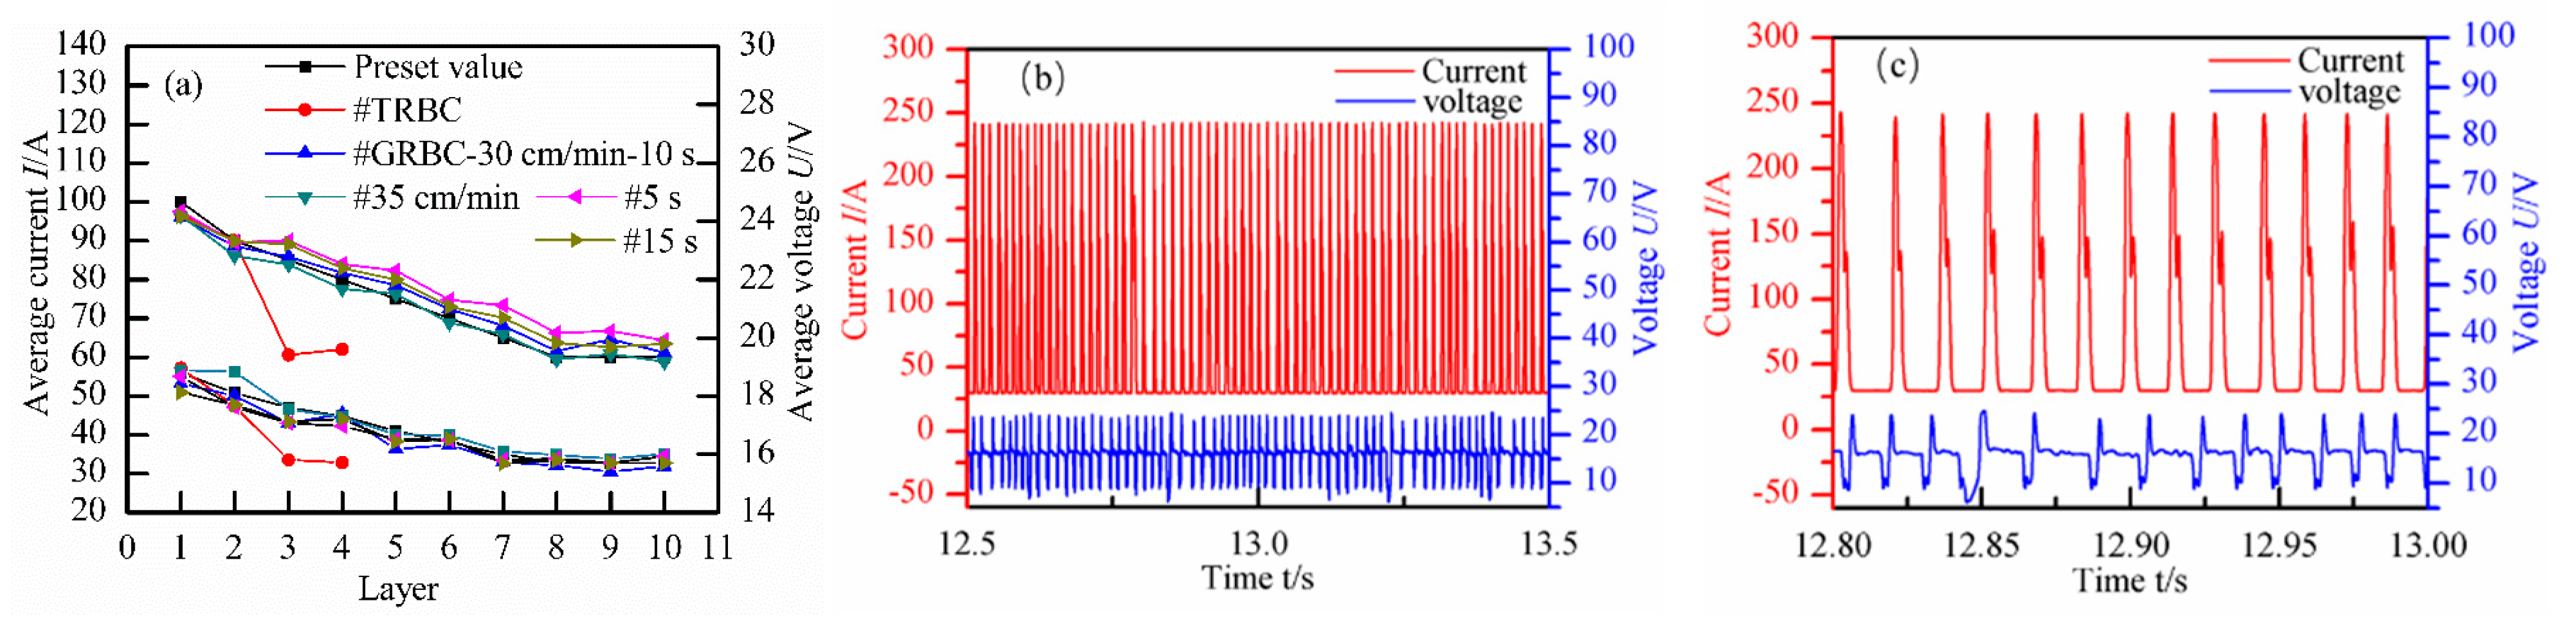
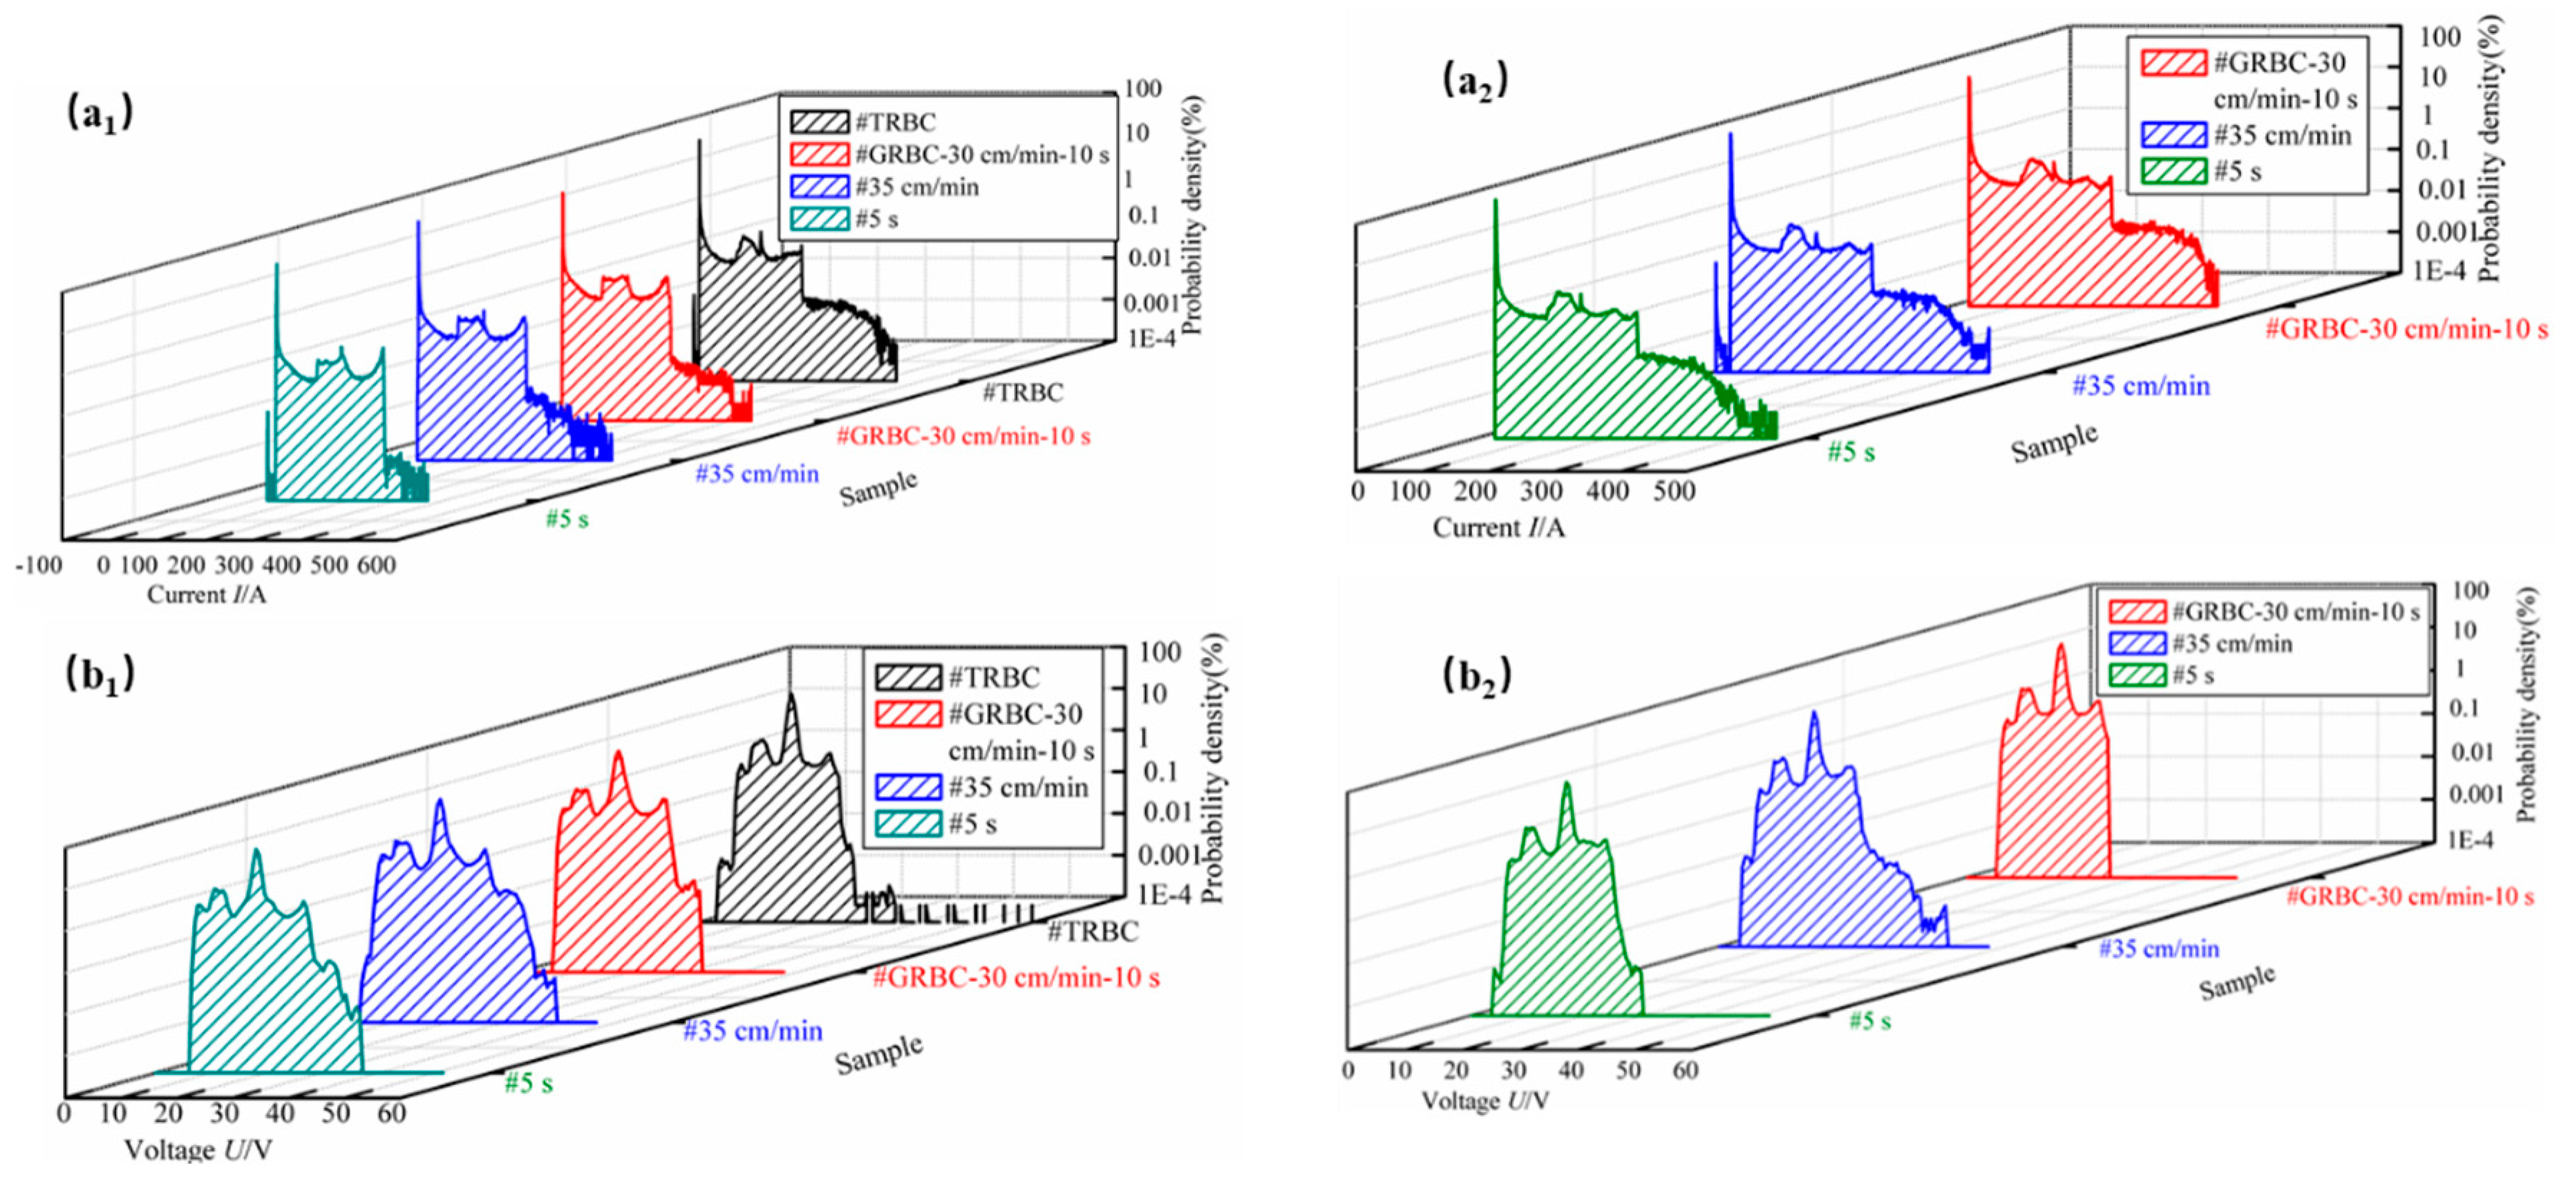
3.1. Waveform Analysis
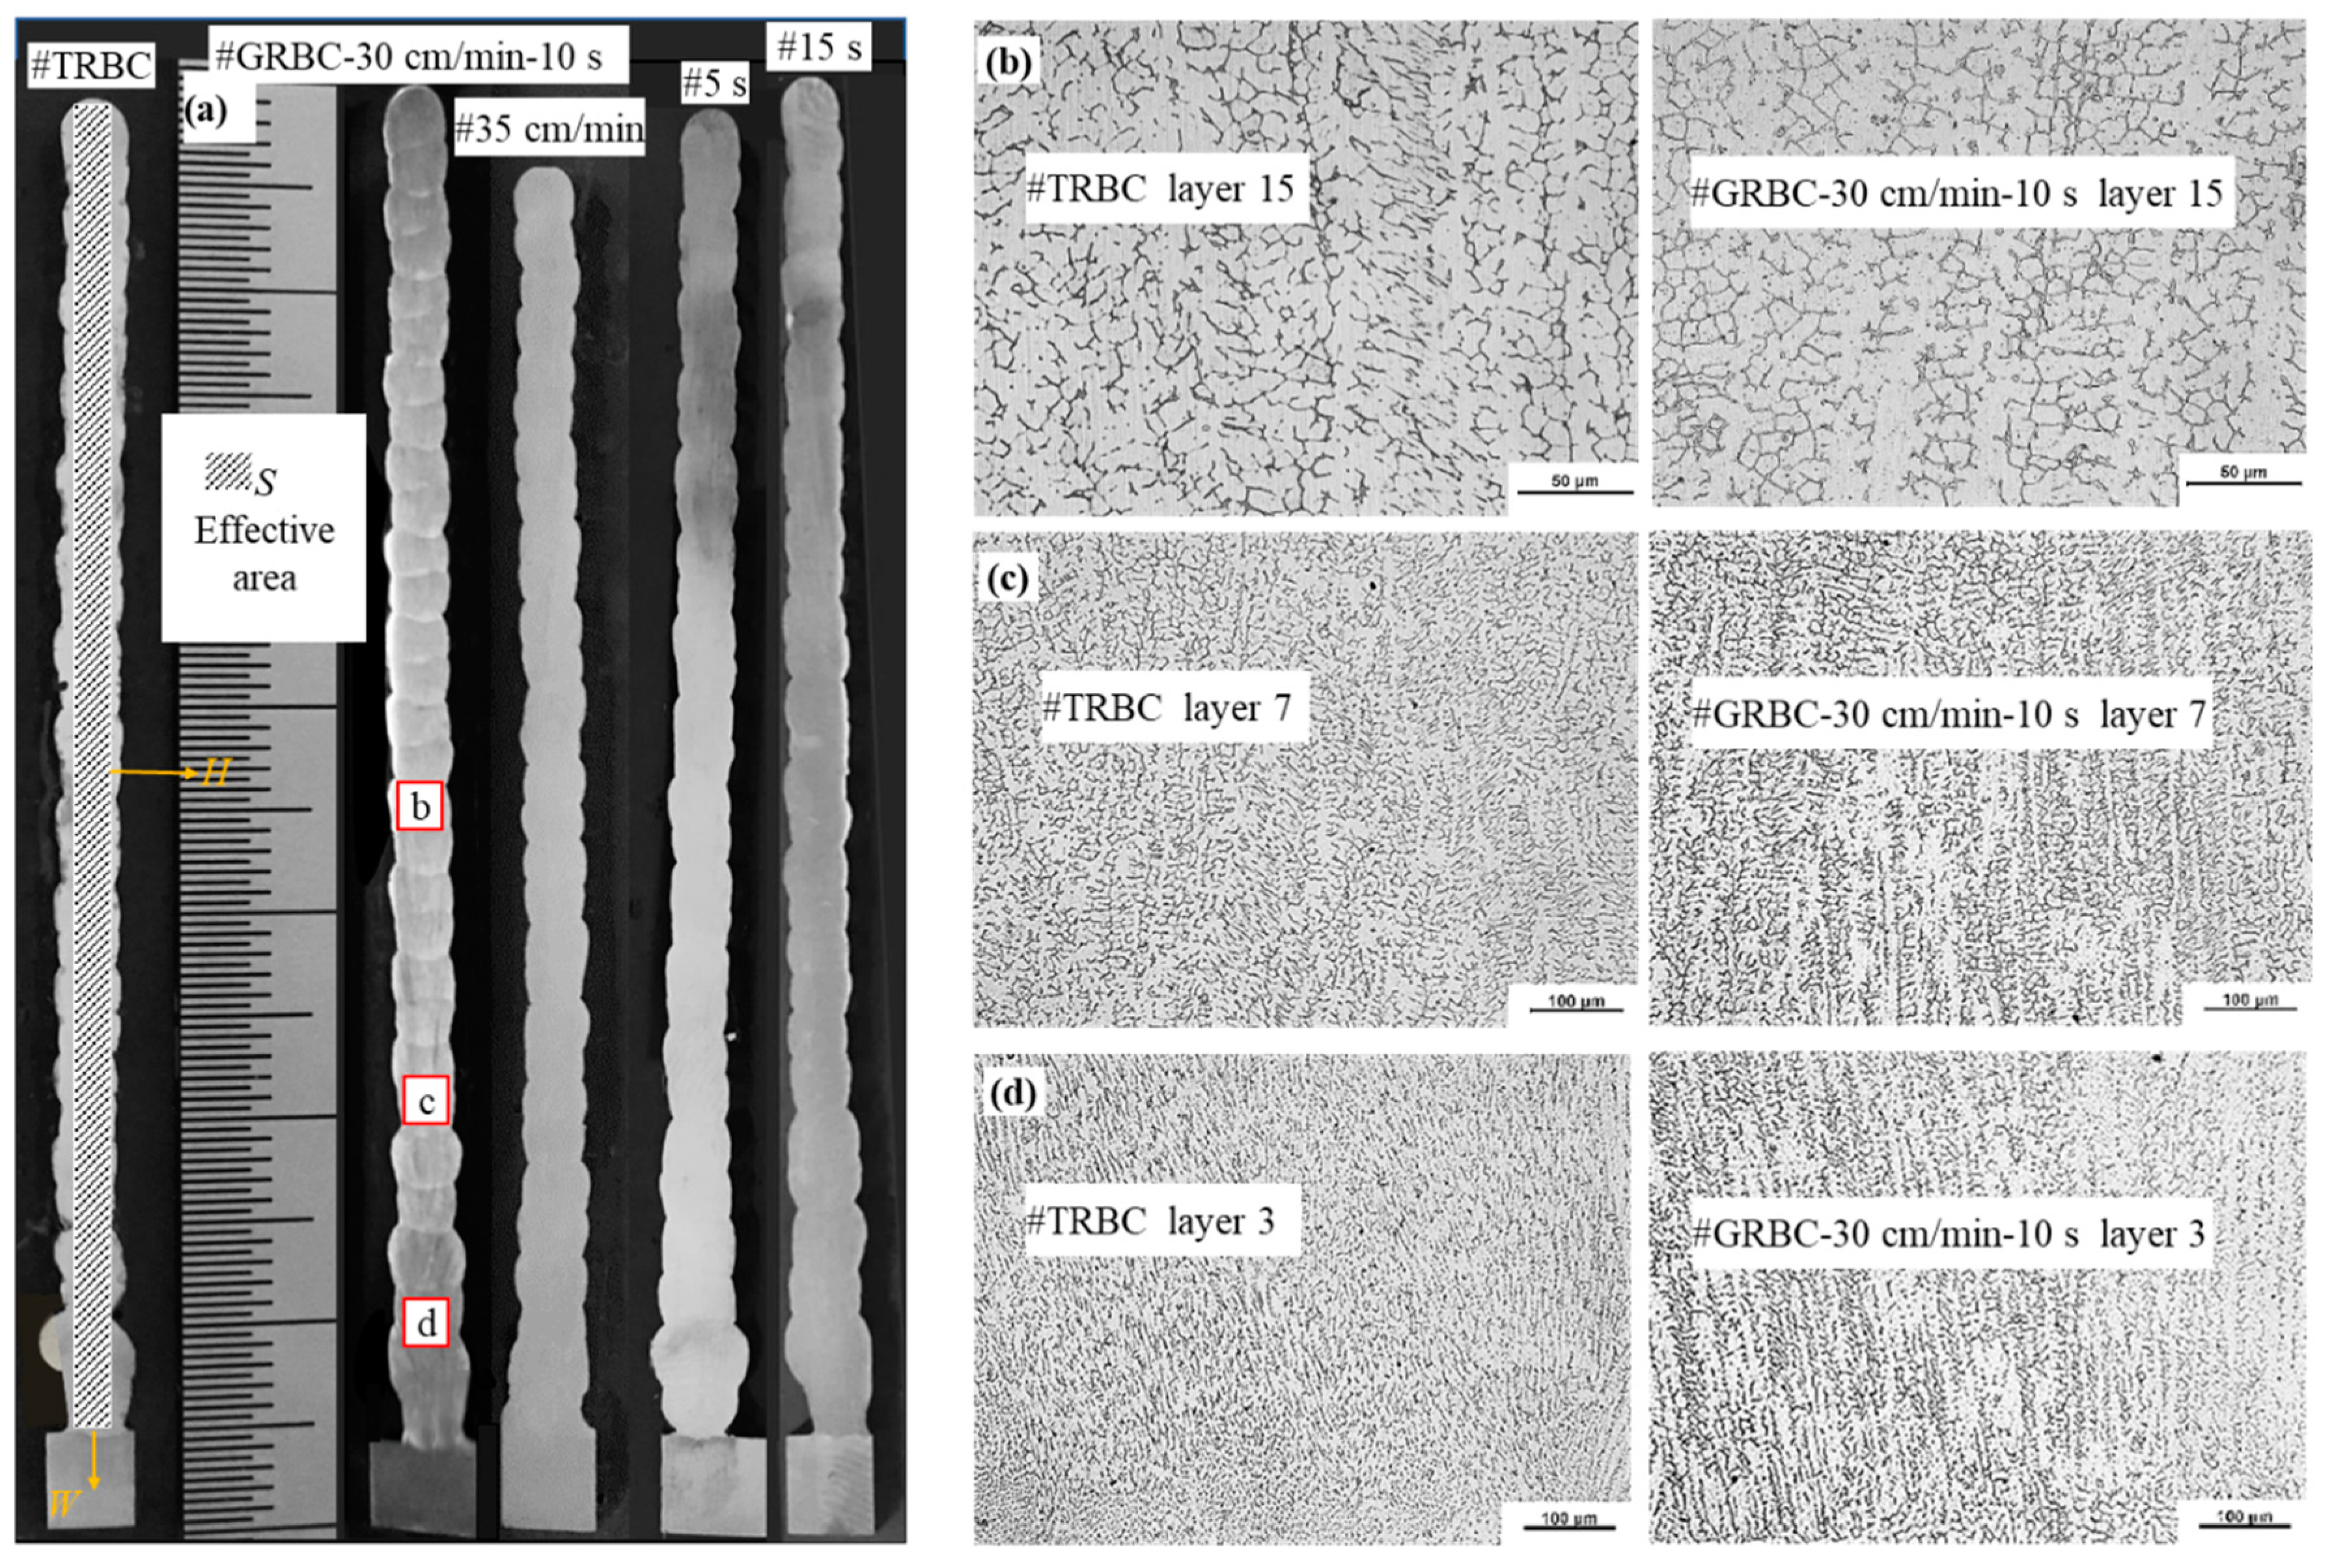
3.2. Macro Morphologies of Deposited Samples
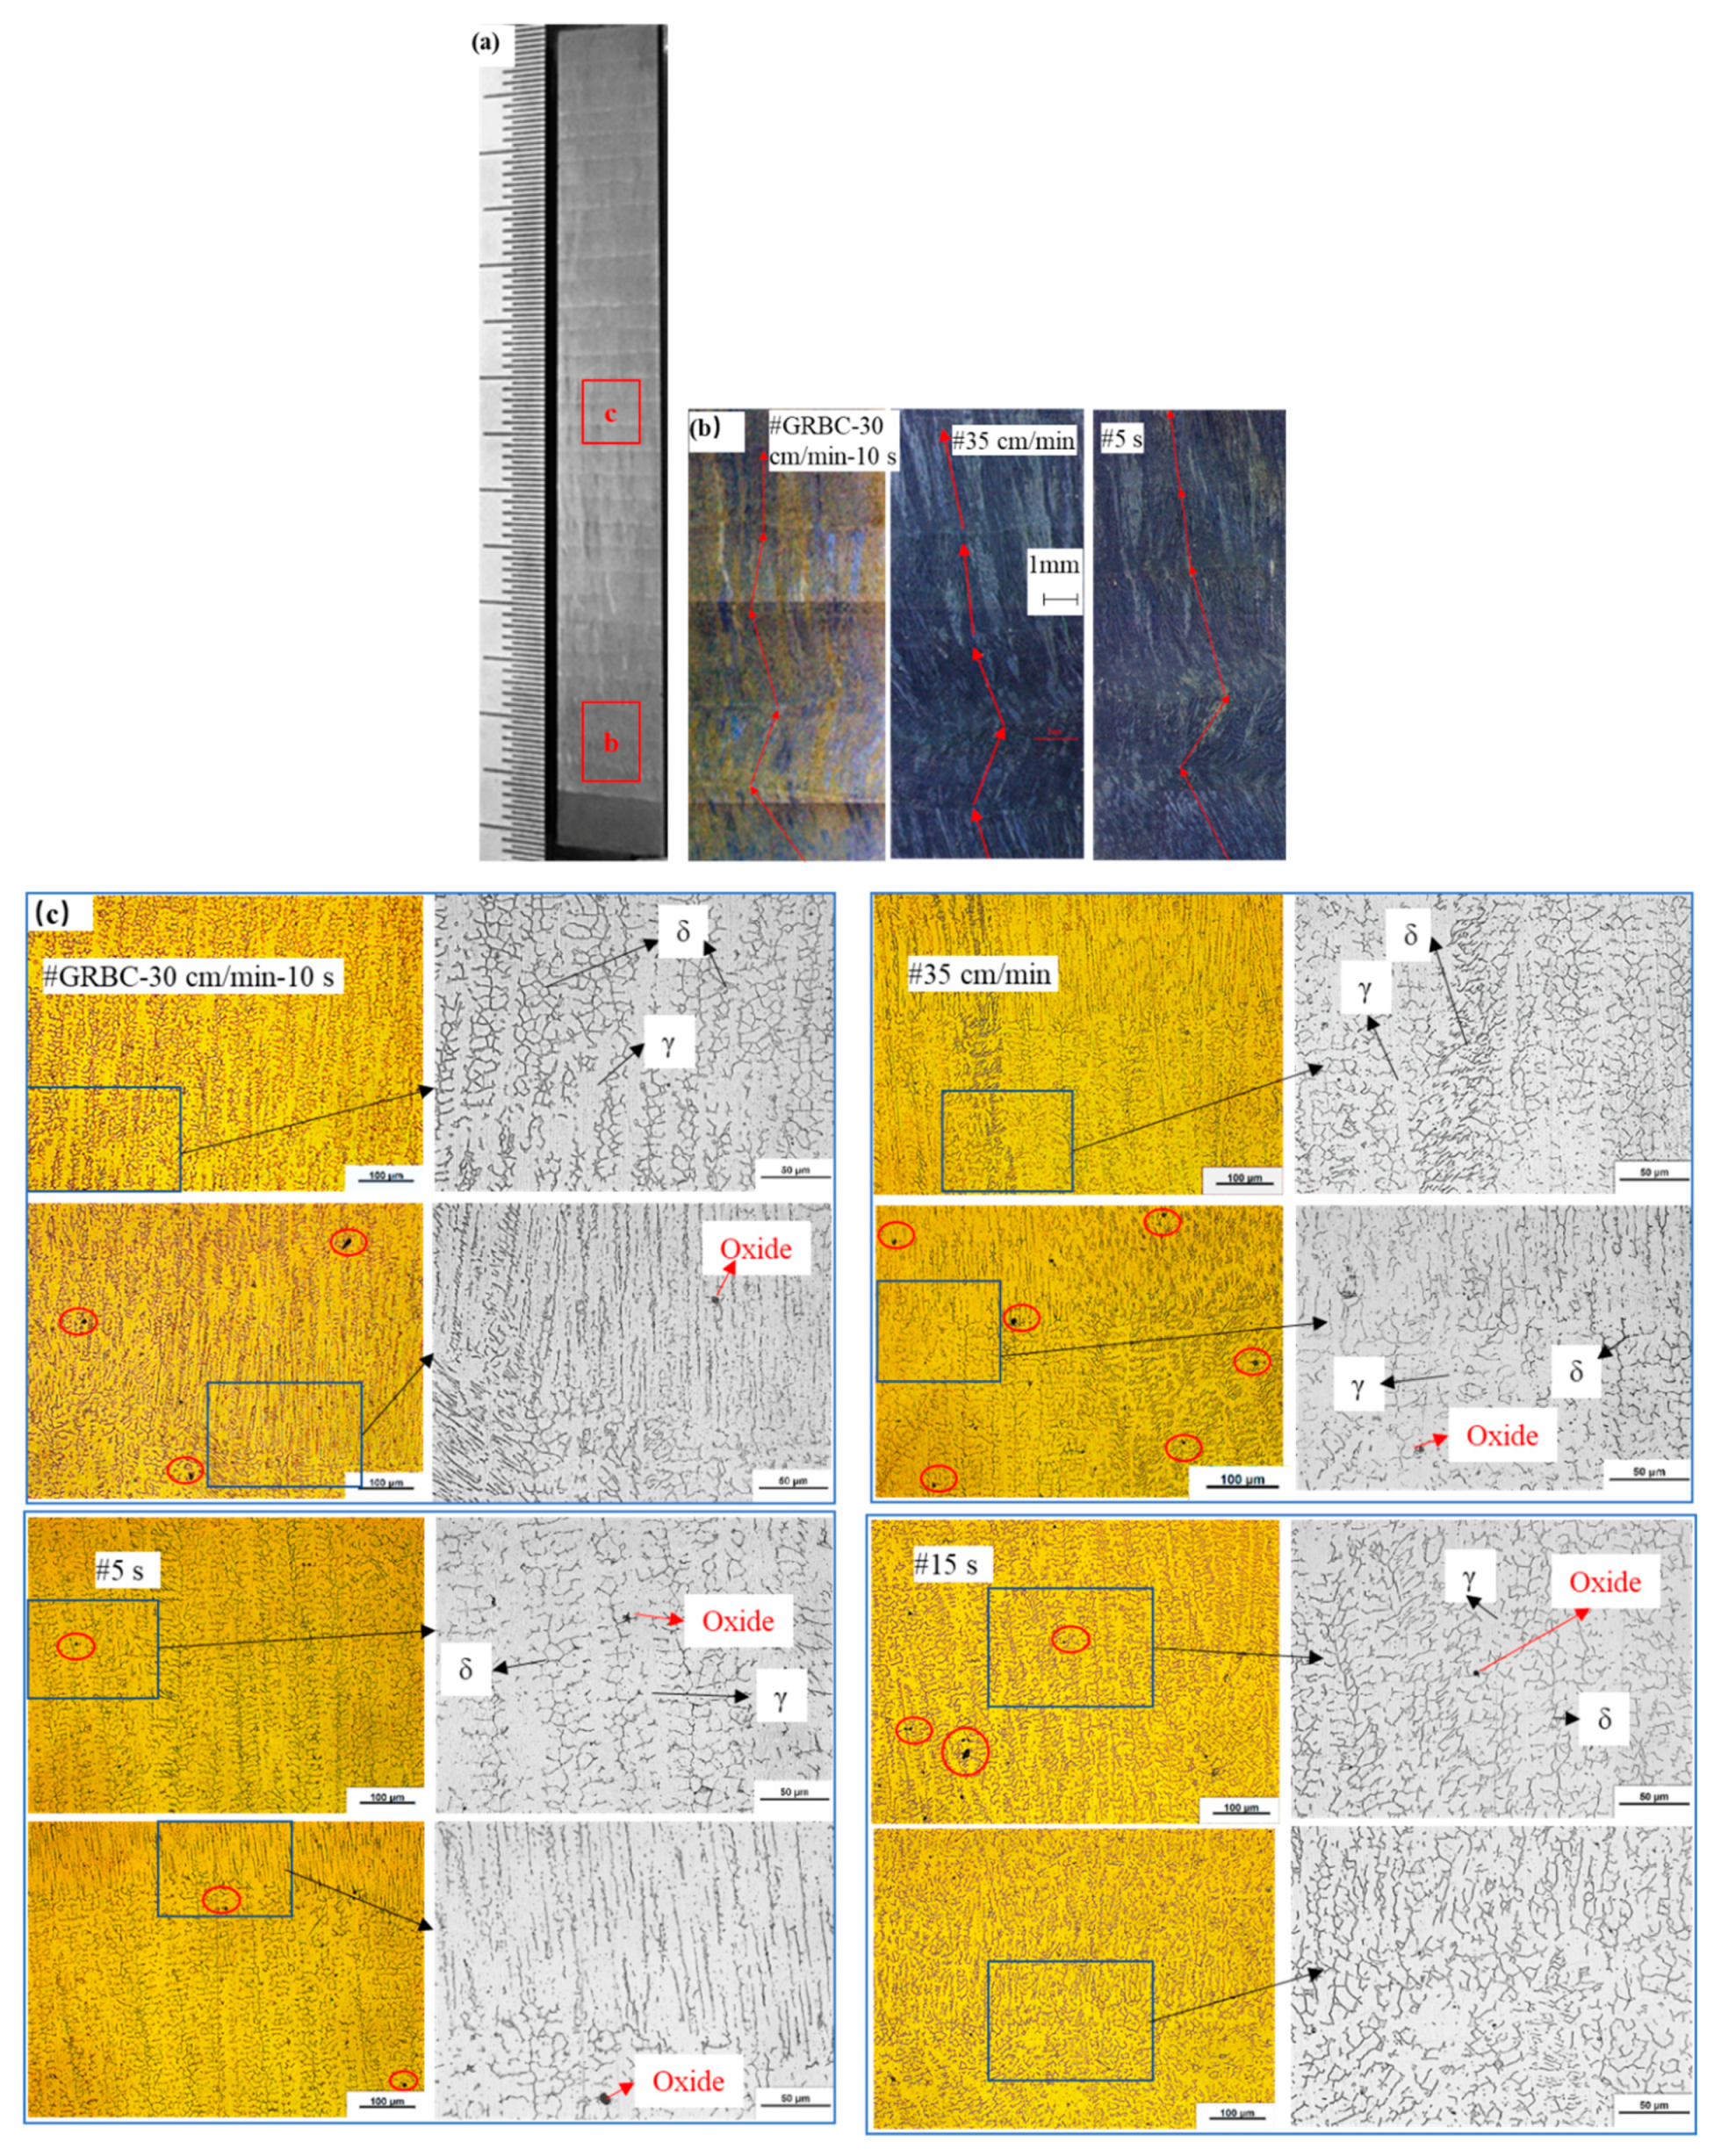
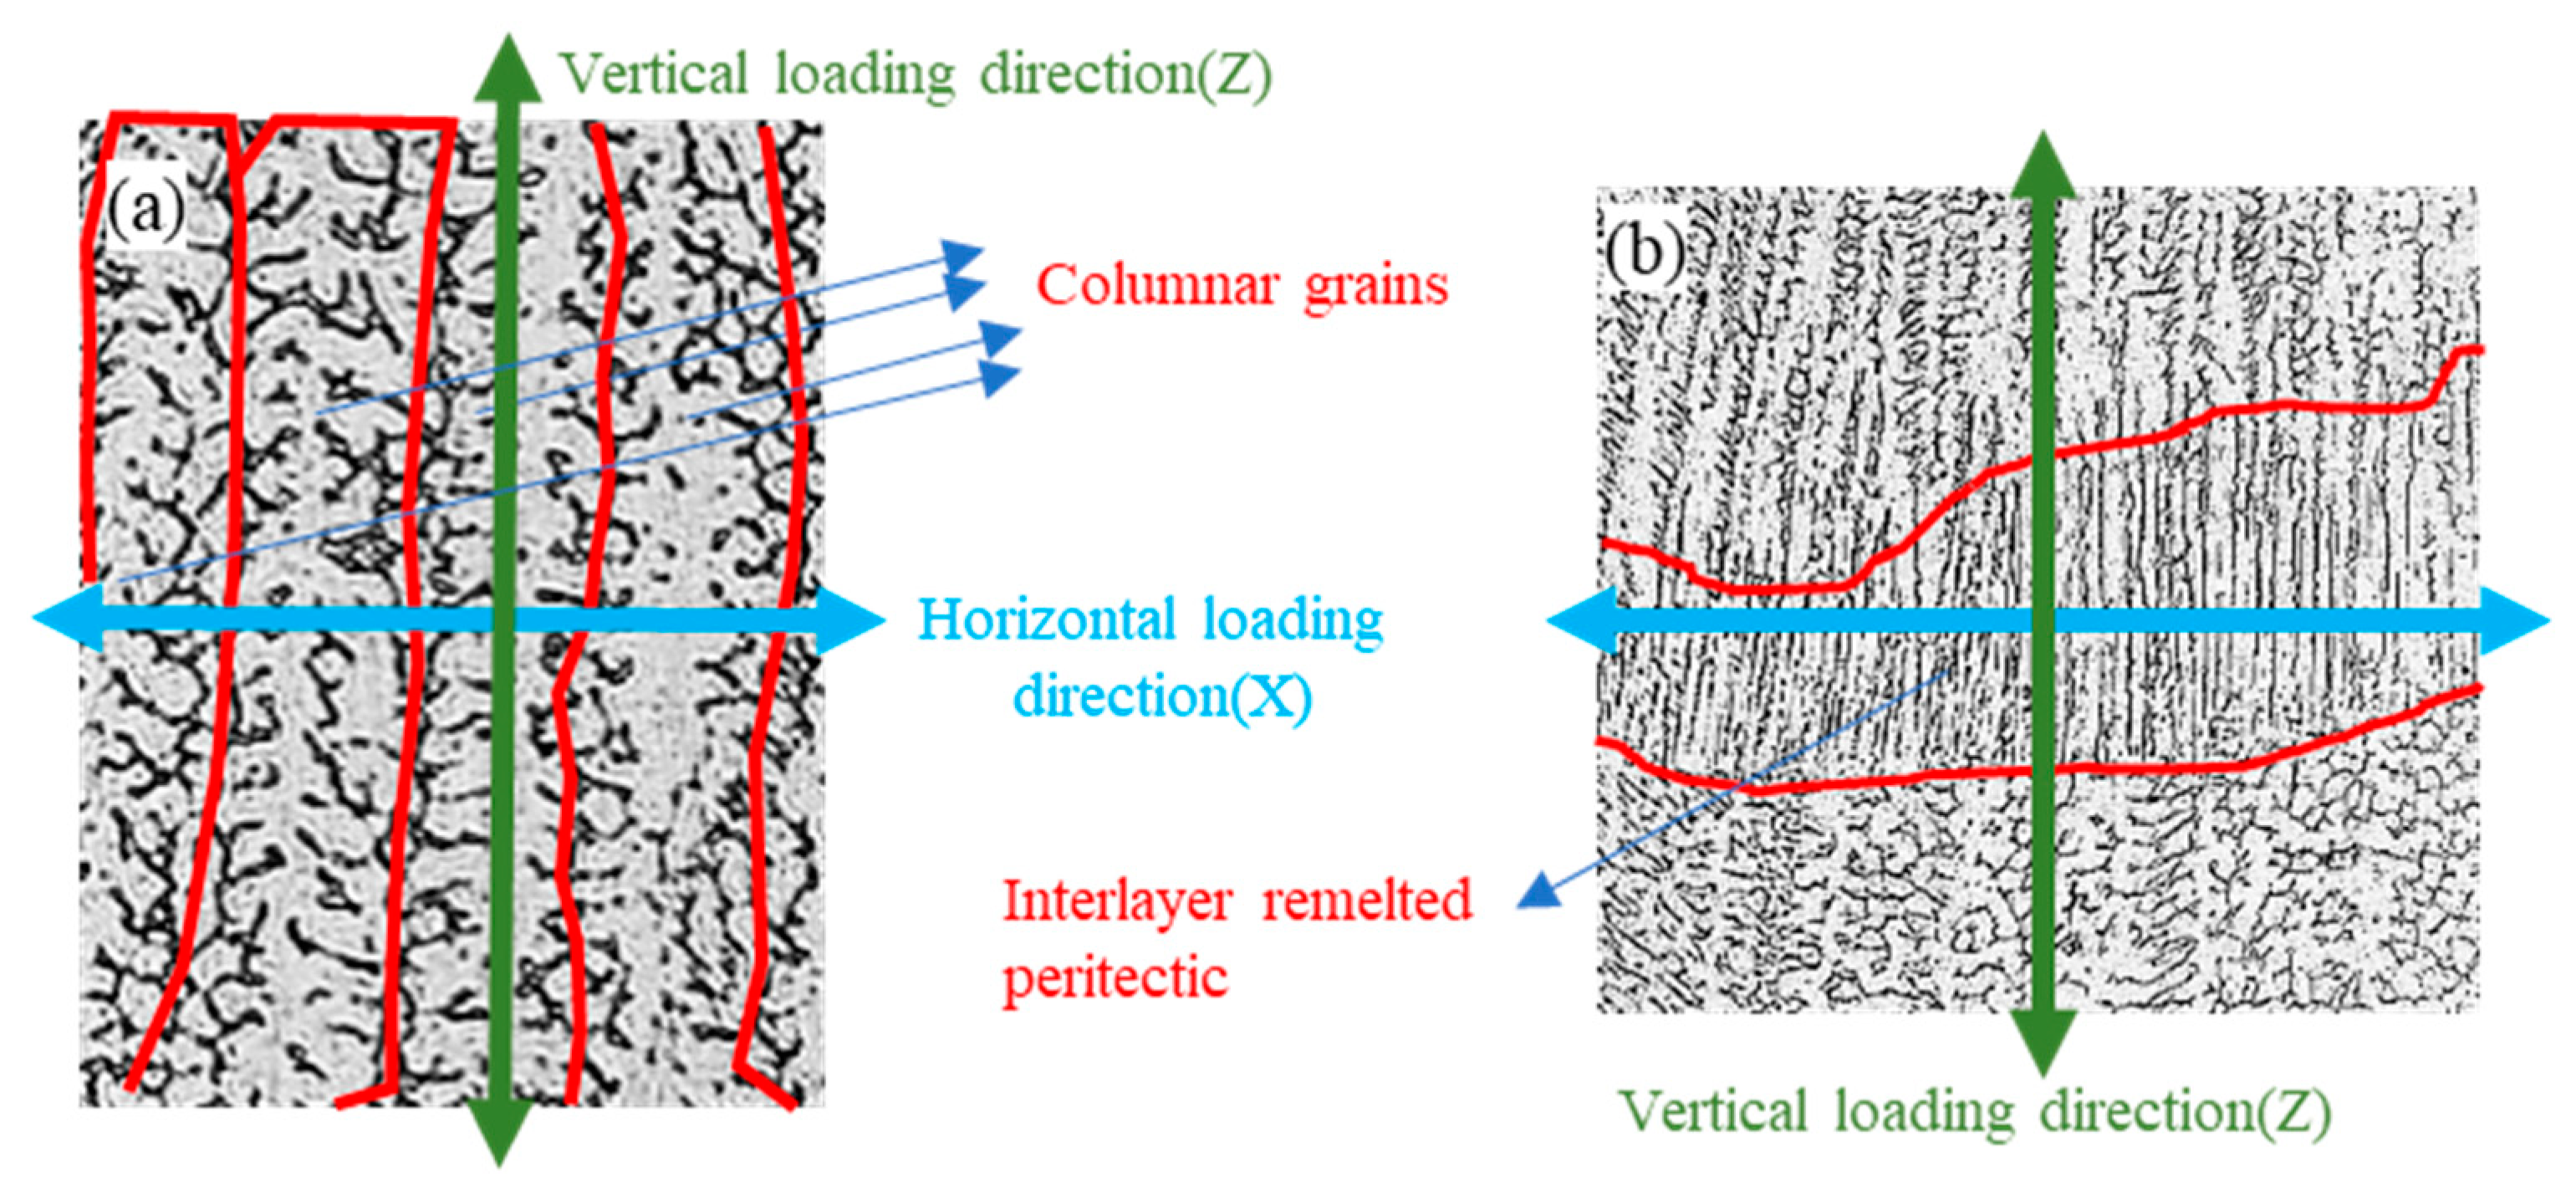
3.3. Microstructure
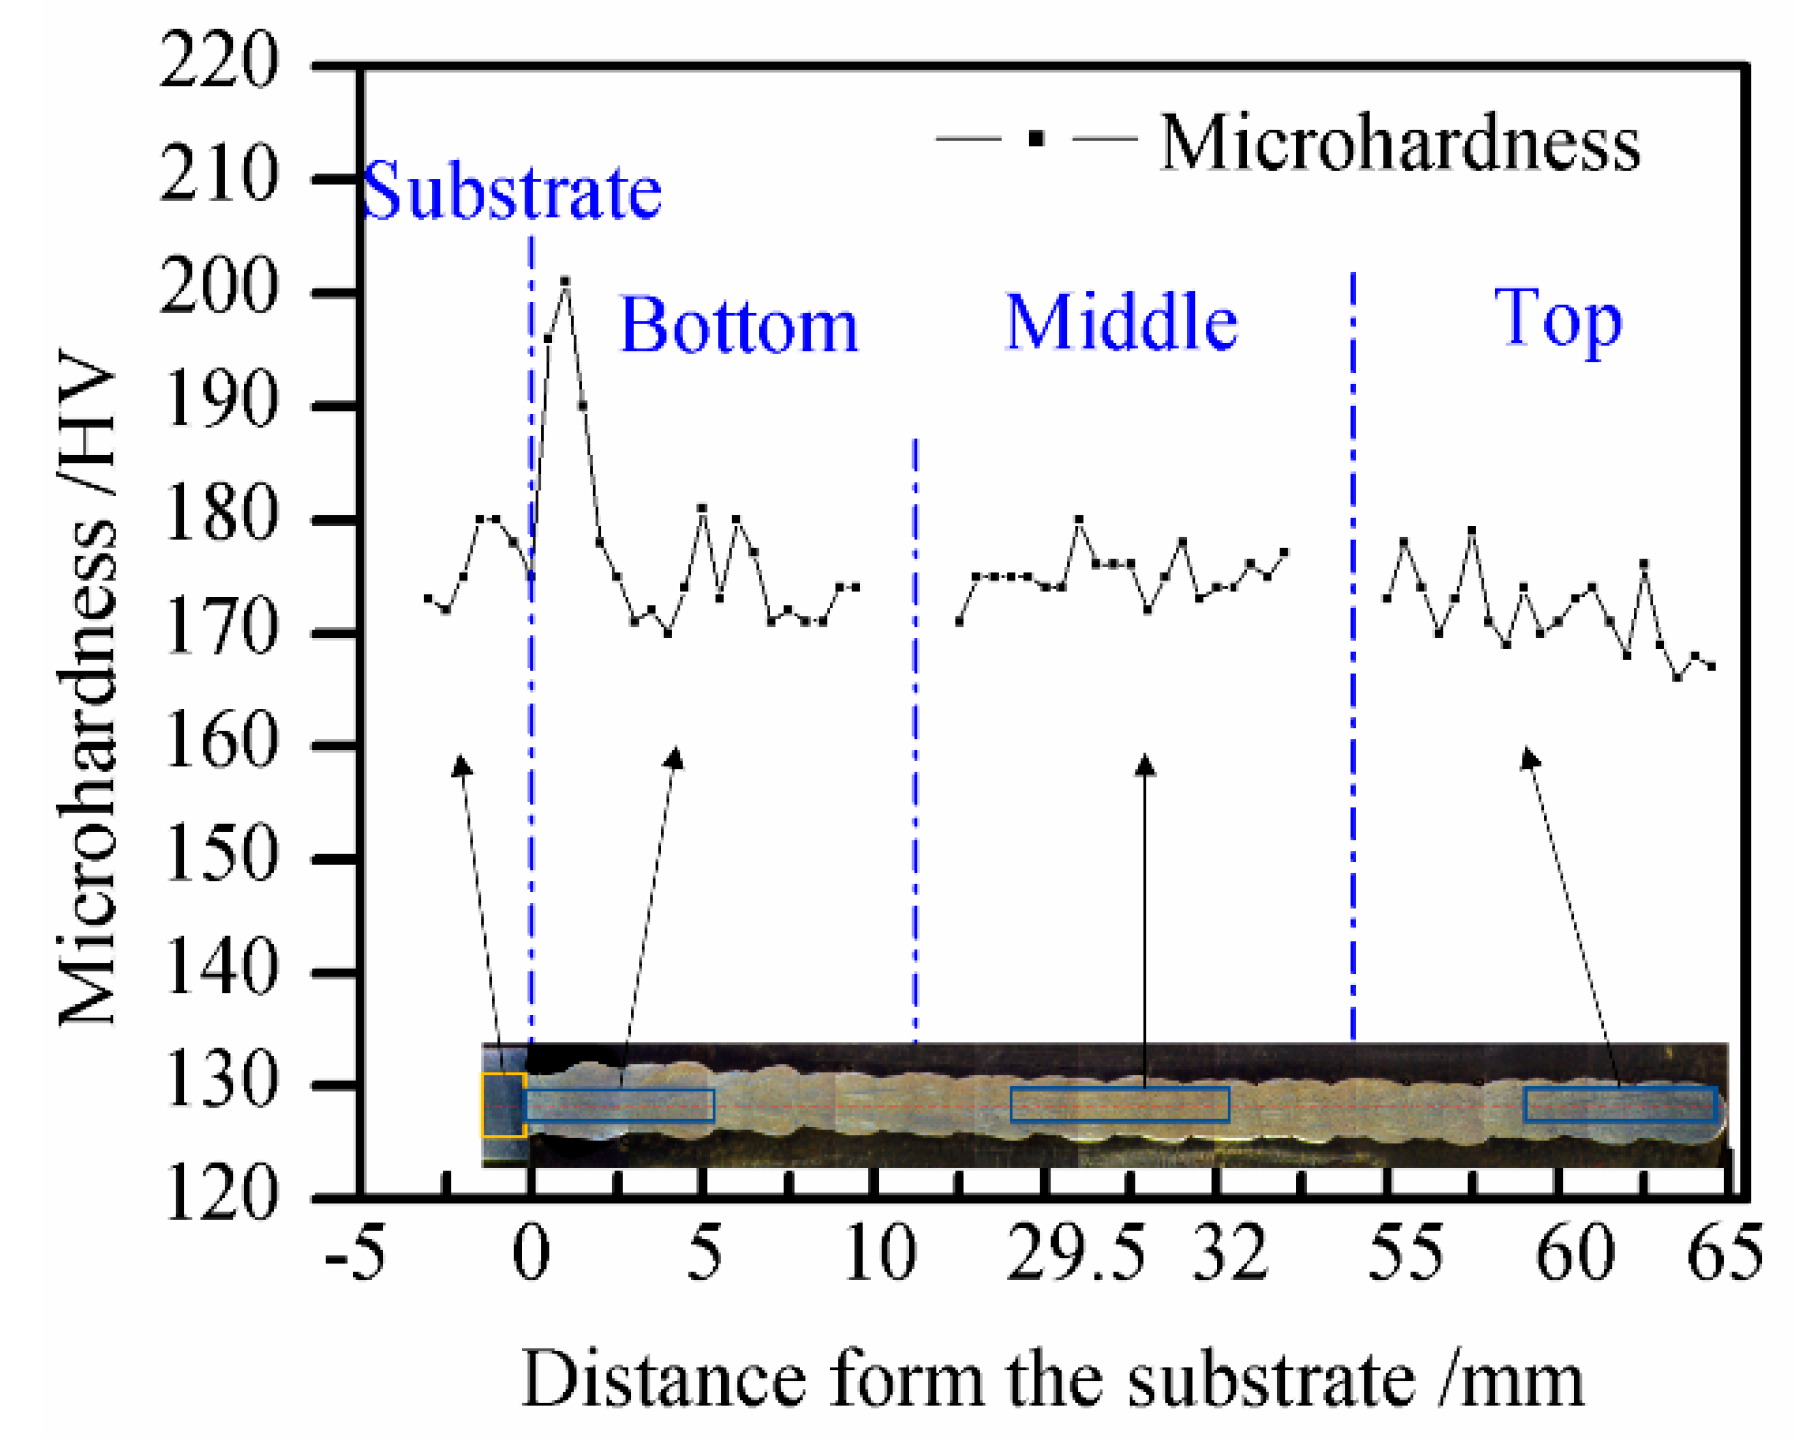
3.4. Microhardness
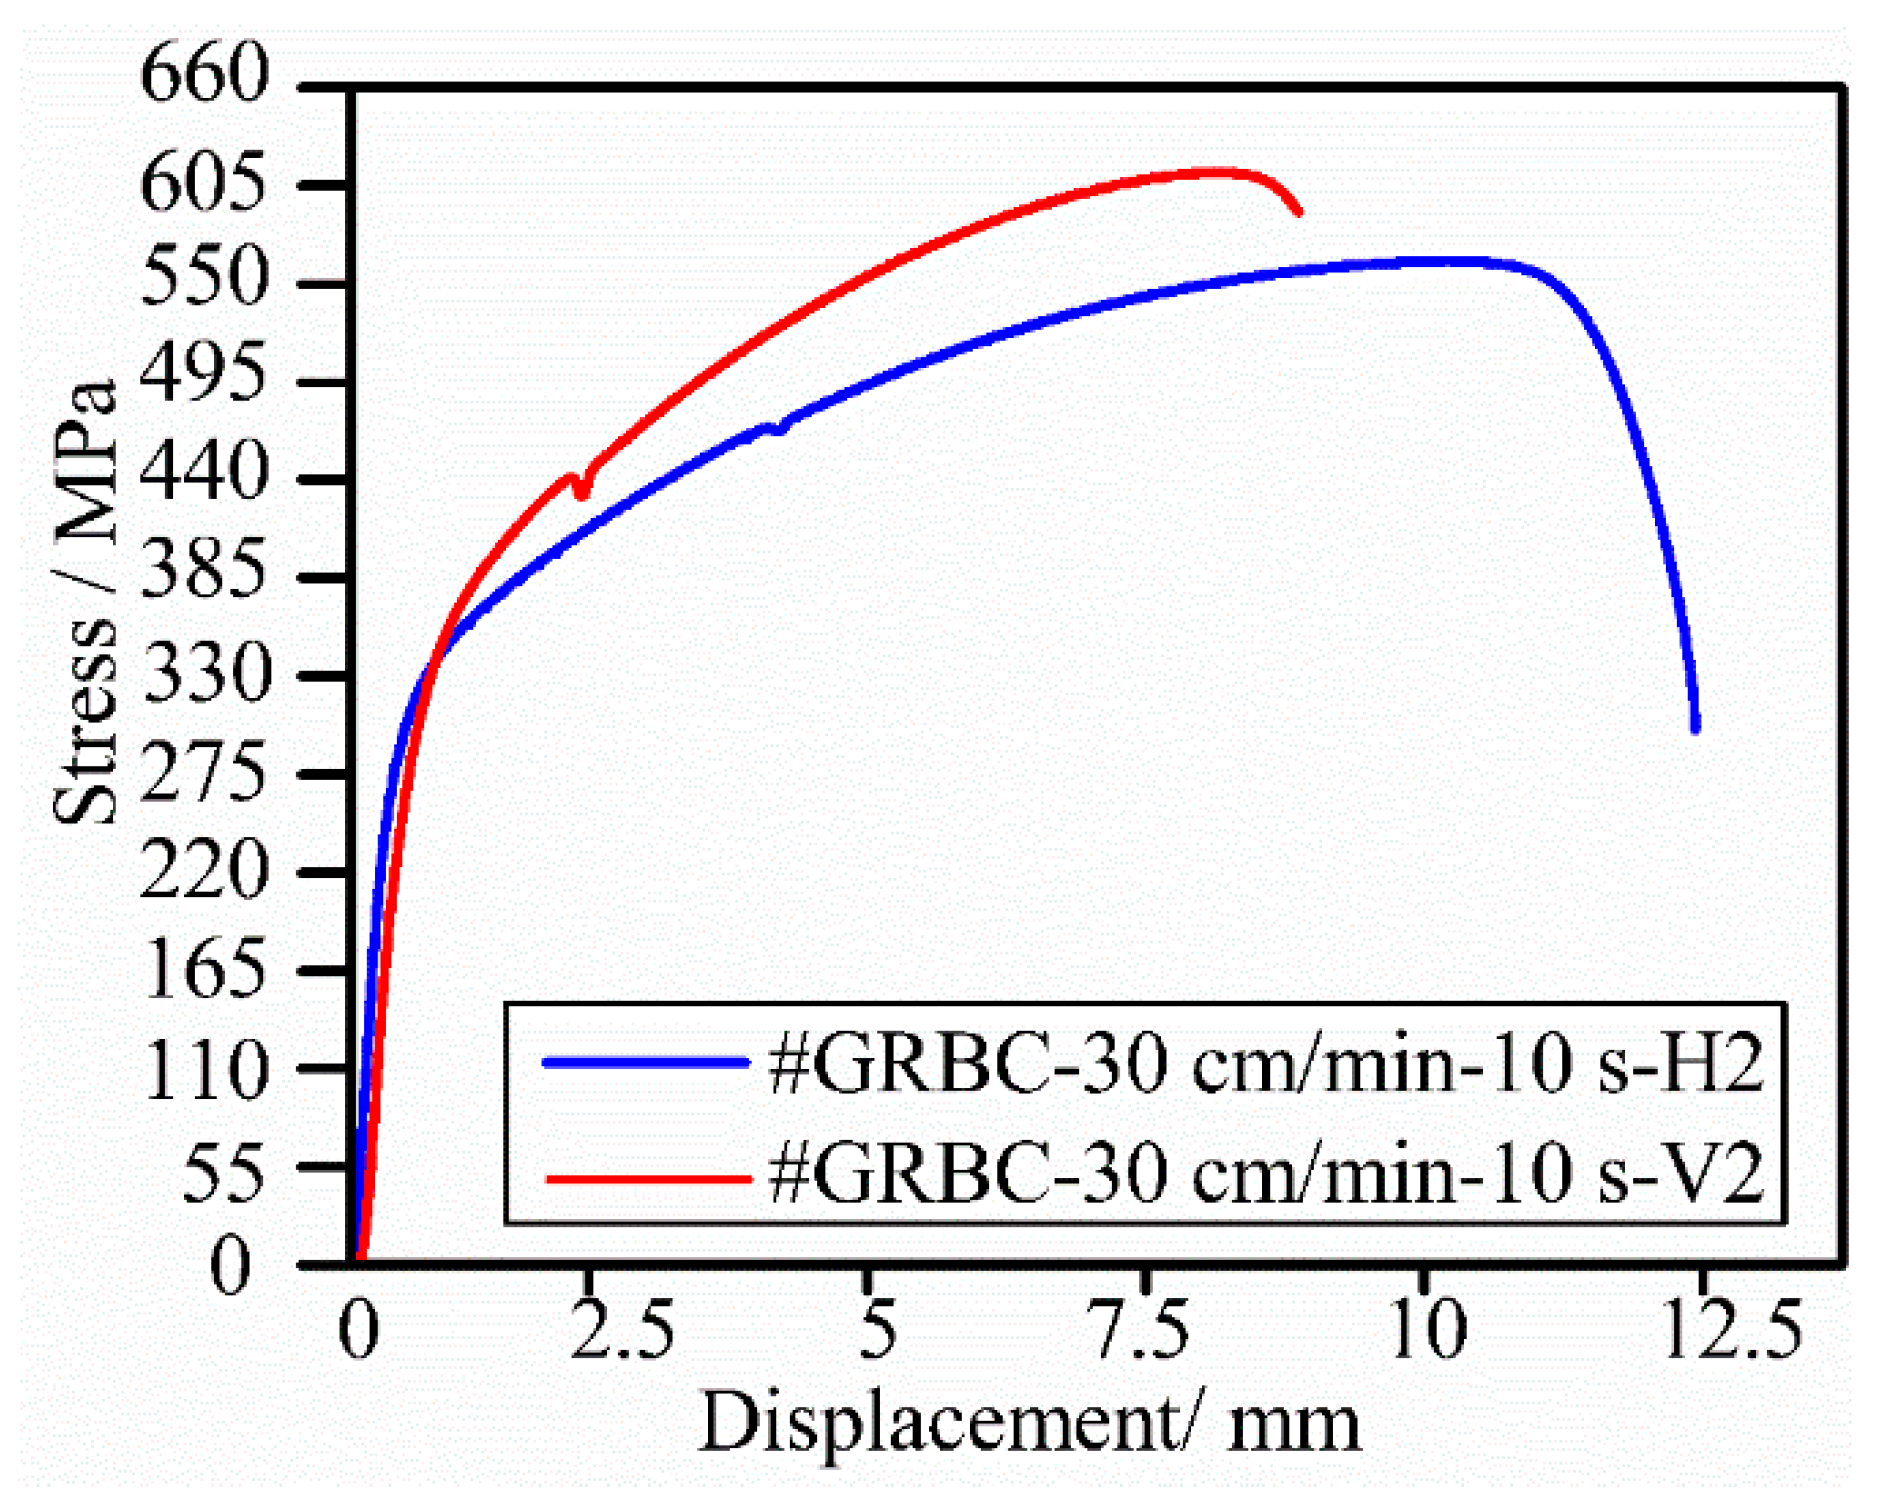
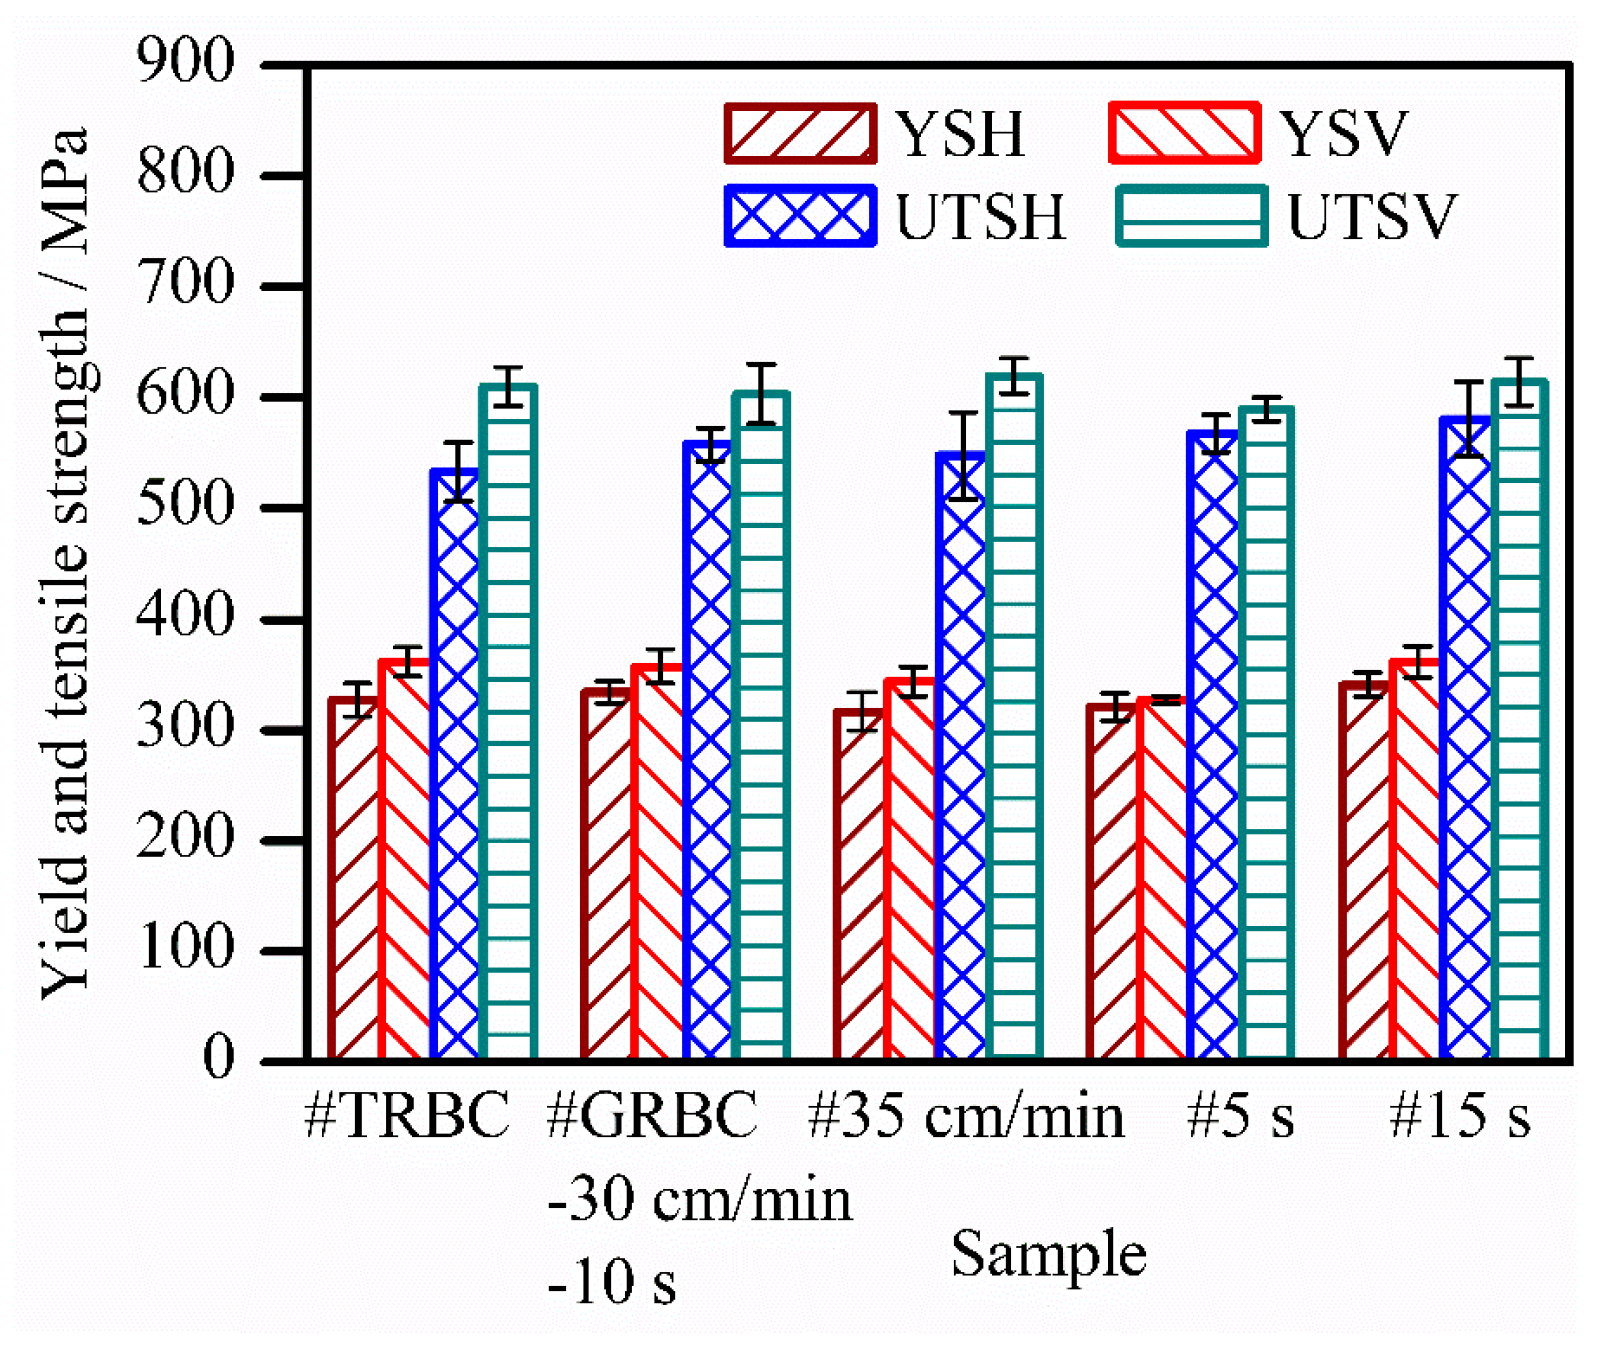
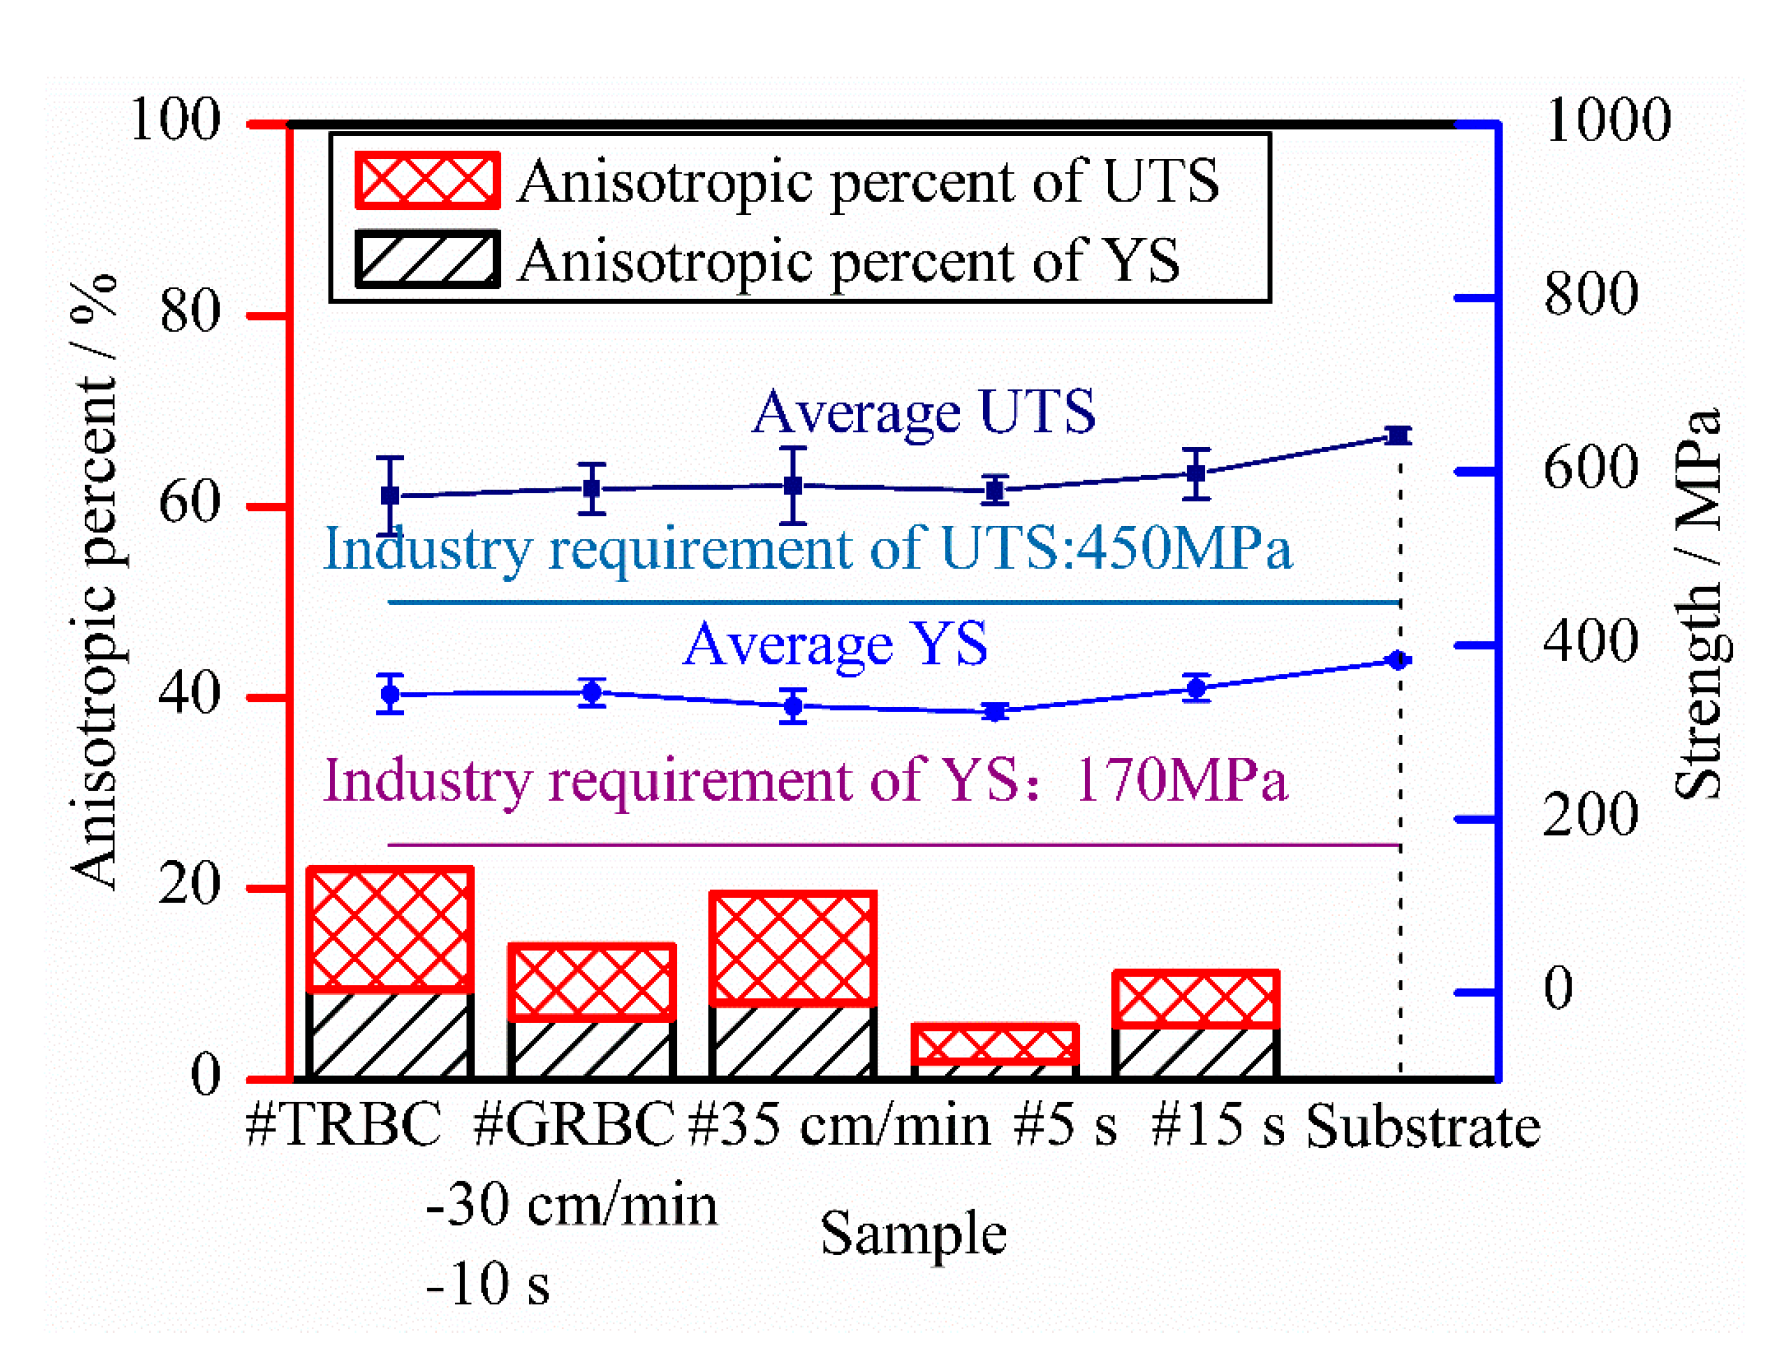
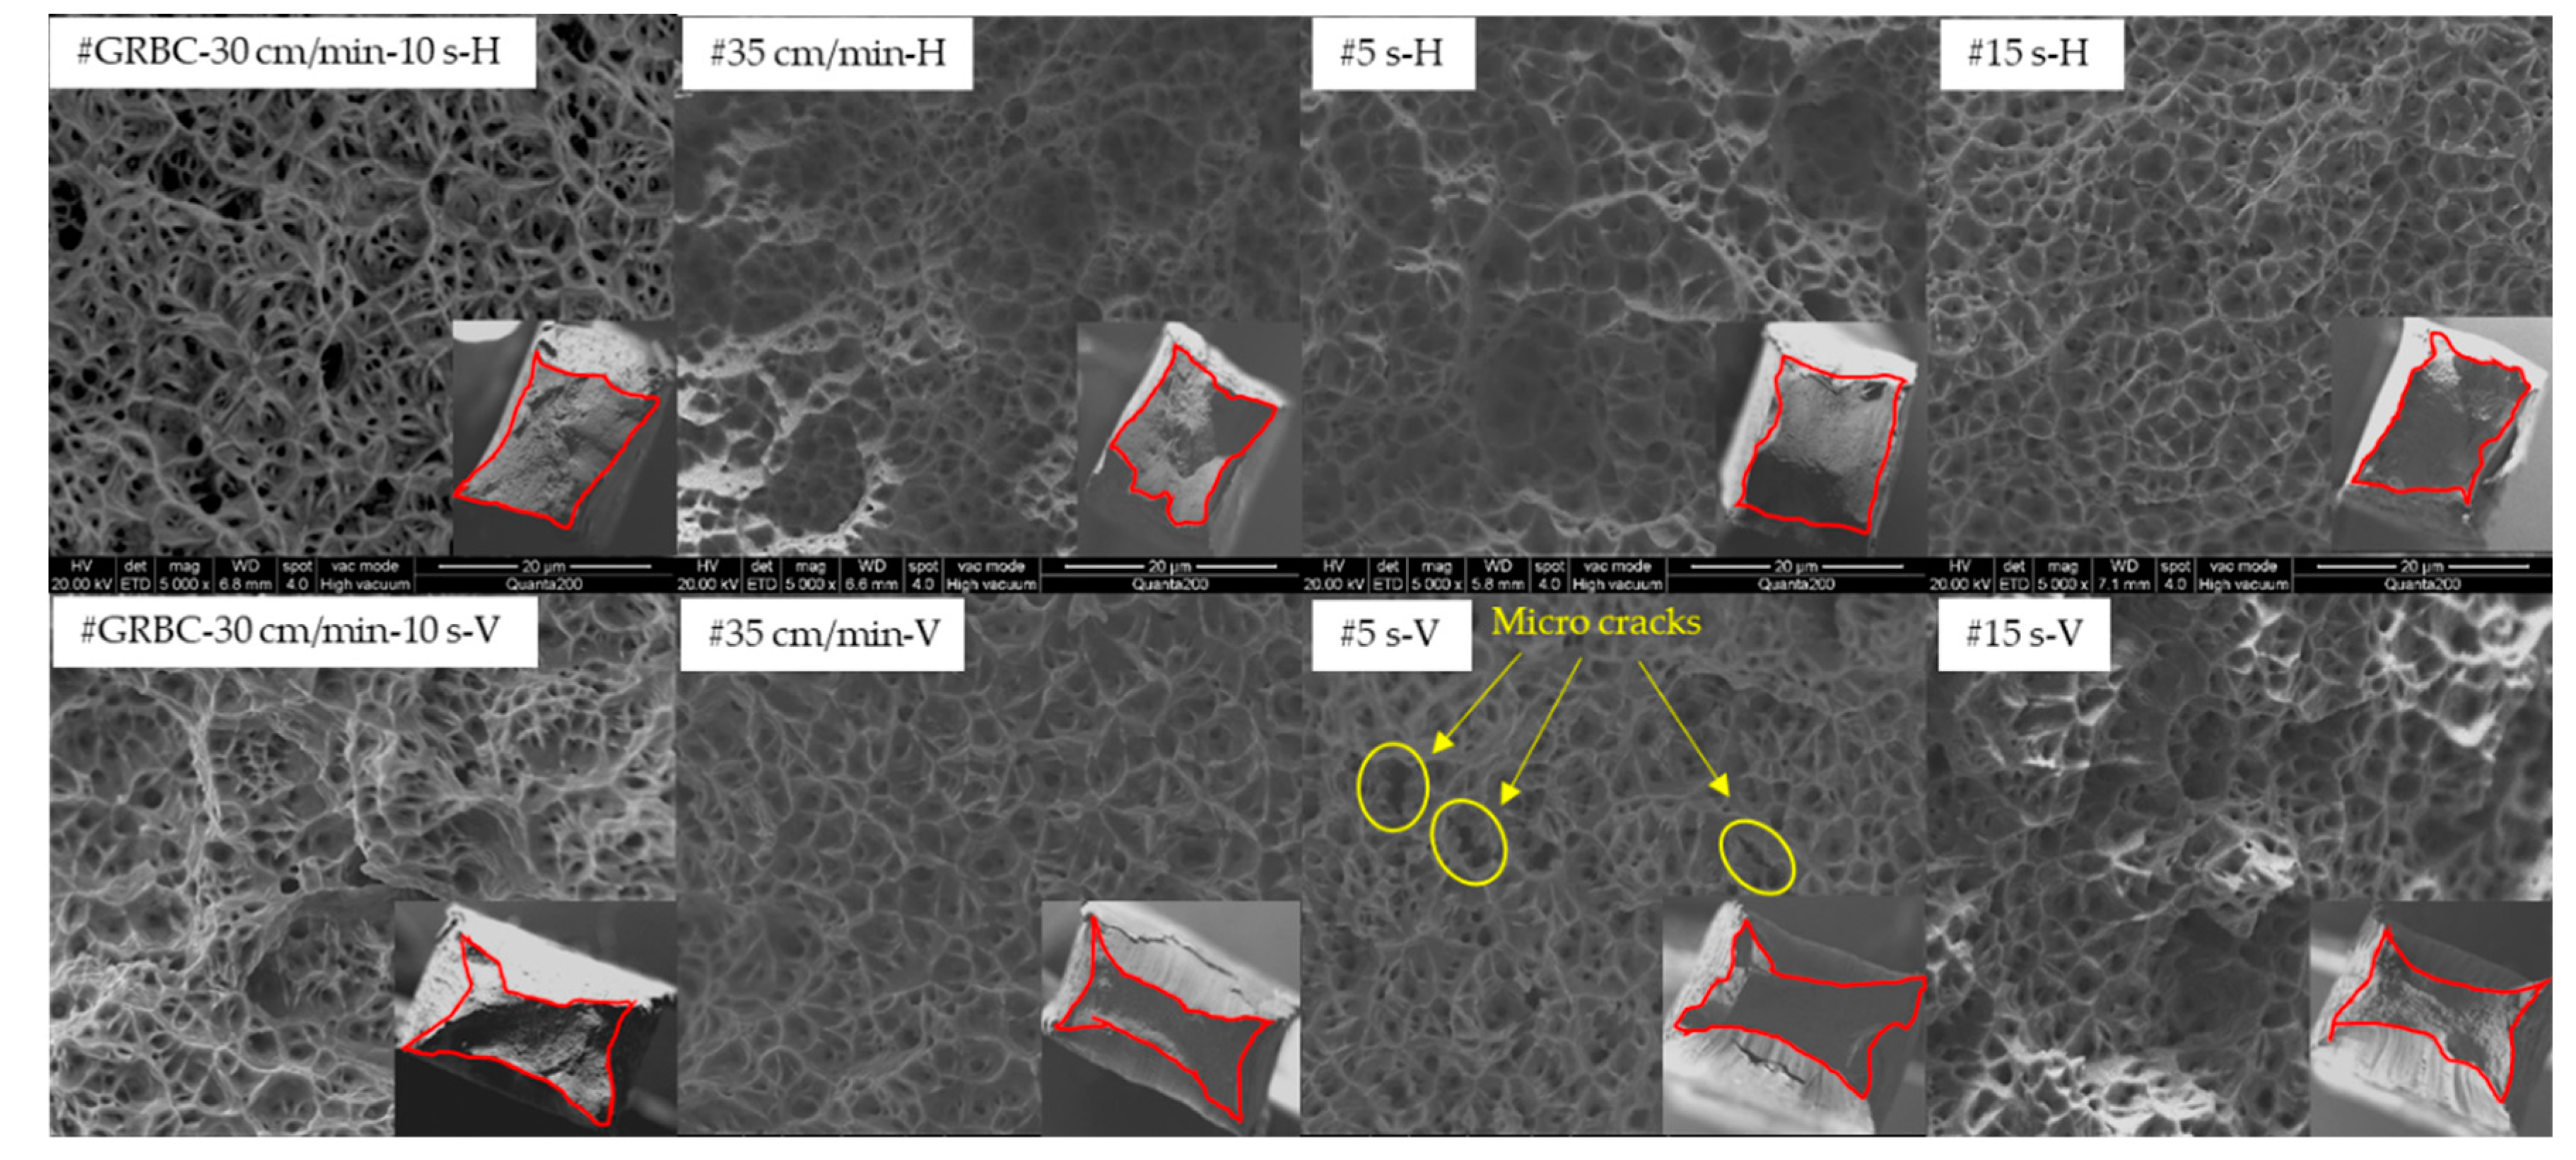
3.5. Tensile Properties
4. Conclusions
Author Contributions
Funding
Conflicts of Interest
References
- Cunningham, C.R.; WikshLand, S.; Xu, F.; Kemakolam, N.; Shokrani, A.; Dhokia, V. Cost modelling and sensitivity analysis of wire and arc additive manufacturing. Procedia Manuf. 2017, 11, 650–657. [Google Scholar] [CrossRef]
- Williams, S.W.; Martina, F.; Addison, A.C.; Ding, J.; Pardal, G.; Colegrove, P. Wire + arc additive manufacturing. Mater. Sci. Technol. 2016, 7, 641–647. [Google Scholar] [CrossRef]
- Jhavar, S.; Jain, N.K.; Paul, C.P. Development of micro-plasma transferred arc (μ-PTA) wire deposition process for additive layer manufacturing applications. J. Mater. Process. Technol. 2014, 214, 1102–1110. [Google Scholar] [CrossRef]
- Ding, D.; Pan, Z.; Cuiuri, D.; Li, H. Wire-feed additive manufacturing of metal components: Technologies, developments and future interests. Int. J. Adv. Manuf. Technol. 2015, 81, 465–481. [Google Scholar] [CrossRef]
- Xu, X.; Mi, G.; Luo, Y.; Jiang, P.; Shao, X.; Wang, C. Morphologies, microstructures, and mechanical properties of samples produced using laser metal deposition with 316L stainless steel wire. Opt. Lasers Eng. 2017, 94, 1–11. [Google Scholar] [CrossRef]
- Yang, D.; Wang, G.; Zhang, G. Thermal analysis for single-pass multi-layer GMAW based additive manufacturing using infrared thermography. J. Mater. Process. Technol. 2017, 244, 215–224. [Google Scholar] [CrossRef]
- Zhang, Y.M.; Chen, Y.; Li, P.; Male, A.T. Weld deposition-based rapid prototyping: A preliminary study. J. Mater. Process. Technol. 2003, 135, 347–357. [Google Scholar] [CrossRef]
- Jiang, Y.L. Research on the Rapid Prototyping Technology and Forming Process of Aluminum Alloy Based on the CMT. Master’s Thesis, Harbin Institute of Technology, Harbin, China, 2013. [Google Scholar]
- Xiong, J. Forming Characteristics in Multi-Layer Single-Bead GMA Additive Manufacturing and Control for Deposition Dimension. Master’s Thesis, Harbin Institute of Technology, Harbin, China, 2014. [Google Scholar]
- Xiong, J.; Li, Y.; Li, R.; Yin, Z. Influences of process parameters on surface roughness of multi-layer single-pass thin-walled parts in GMAW-based additive manufacturing. J. Mater. Process. Technol. 2018, 252, 128–136. [Google Scholar] [CrossRef]
- Wei, F.U.; Shengsun, H.U.; Yuhuan, Y. Effect of droplet transition on rapid prototyping by P-MIG. J. Mech. Eng. 2009, 45, 95–99. [Google Scholar]
- Montevecchi, F.; Venturini, G.; Grossi, N.; Scippa, A.; Campatelli, G. Idle times selection for wire arc additive manufacturing: A finite element based technique. Addit. Manuf. 2018, 21, 479–486. [Google Scholar] [CrossRef]
- Wu, Q.; Ma, Z.; Chen, G.; Liu, C.; Ma, D.; Ma, S. Obtaining fine microstructure and unsupported overhangs by low heat input pulse arc additive manufacturing. J. Manuf. Process. 2017, 27, 198–206. [Google Scholar] [CrossRef]
- Martina, F.; Mehnen, J.; Williams, S.W.; Colegrove, P.; Wang, F. Investigation of the benefits of plasma deposition for the additive layer manufacture of Ti-6Al-4V. J. Mater. Process. Technol. 2012, 212, 1377–1386. [Google Scholar] [CrossRef]
- Shen, C.; Pan, Z.; Cuiuri, D.; Dong, B.; Li, H. In-depth study of the mechanical properties for Fe3Al based iron aluminide fabricated using the wire-arc additive manufacturing process. Mater. Sci. Eng. A 2016, 669, 118–126. [Google Scholar] [CrossRef]
- Shen, C.; Liss, K.D.; Pan, Z.; Wang, Z.; Li, X.; Li, H. Thermal cycling of Fe3Al based iron aluminide during the wire-arc additive manufacturing process: An in-situ neutron diffraction study. Intermetallics 2018, 92, 101–107. [Google Scholar] [CrossRef]
- Xu, X.; Ganguly, S.; Ding, J.; Guo, S.; Williams, S.; Martina, F. Microstructural evolution and mechanical properties of maraging steel produced by wire + arc additive manufacture process. Mater. Charact. 2017, 1–11. [Google Scholar] [CrossRef]
- Demir, A.G. Micro laser metal wire deposition for additive manufacturing of thin-walled structures. Opt. Lasers Eng. 2018, 100, 9–17. [Google Scholar] [CrossRef]
- Cong, B.; Ding, J.; Williams, S. Effect of arc mode in cold metal transfer process on porosity of additively manufactured Al-6.3%Cu alloy. Int. J. Adv. Manuf. Technol. 2015, 76, 1593–1606. [Google Scholar] [CrossRef]
- Gomez Ortega, A.; Corona Galvan, L.; Deschaux-Beaume, F.; Mezrag, B.; Rouquette, S. Effect of process parameters on the quality of aluminium alloy Al5Si deposits in wire and arc additive manufacturing using a cold metal transfer process. Sci. Technol. Weld. Join. 2017, 23, 316–332. [Google Scholar] [CrossRef]
- Gu, J.; Ding, J.; Williams, S.W.; Gu, H.; Ma, P.; Zhai, Y. The effect of inter-layer cold working and post-deposition heat treatment on porosity in additively manufactured aluminum alloys. J. Mater. Process. Technol. 2016, 230, 26–34. [Google Scholar] [CrossRef]
- Li, F.; Chen, S.; Shi, J.; Zhao, Y.; Tian, H. Thermoelectric cooling-aided bead geometry regulation in wire and arc-based additive manufacturing of thin-walled structures. Appl. Sci. 2018, 8, 207. [Google Scholar] [CrossRef]
- Wang, H.; Jiang, W.; Ouyang, J.; Kovacevic, R. Rapid prototyping of 4043 Al-alloy parts by VP-GTAW. J. Mater. Process. Technol. 2004, 148, 93–102. [Google Scholar] [CrossRef]
- Li, J.; Li, H.; Huang, C.; Xiang, T.; Ni, Y.; Wei, H. Welding process characteristics of pulse on pulse MIG arc brazing of aluminum alloy to stainless steel. Int. J. Adv. Manuf. Technol. 2016, 91, 1057–1067. [Google Scholar] [CrossRef]
- Guo, N.; Guo, W.; Xu, C.S.; Du, Y.P.; Feng, J.C. Effect of boric acid concentration on the arc stability in underwater wet welding. J. Mater. Process. Technol. 2016, 229, 244–252. [Google Scholar] [CrossRef]
- Sequeira Almeida, P.M. Process control and development in wire and arc additive manufacturing. Cranfield Univ. 2012, 30, 218–226. [Google Scholar] [CrossRef]
- Lin, X.; Huang, W.D. Laser additive manufacturing of high-performance metal components. Sci. Sin. 2015, 45, 1111–1126. [Google Scholar] [CrossRef]
- Liberini, M.; Astarita, A.; Campatelli, G.; Scippa, A.; Montevecchi, F.; Venturini, G. Selection of optimal process parameters for wire arc additive manufacturing. Procedia Cirp 2017, 62, 470–474. [Google Scholar] [CrossRef]
- Geng, H.; Li, J.; Xiong, J.; Lin, X.; Zhang, F. Geometric limitation and tensile properties of wire and arc additive manufacturing 5A06 aluminum alloy parts. J. Mater. Eng. Perform. 2017, 26, 621–629. [Google Scholar] [CrossRef]
- Wang, P.; Sharon Nai, M.L.; Tan, X.; Sin, W.J.; Tor, S.B.; Wei, J. Anisotropic Mechanical Properties in a Big-Sized Ti-6Al-4V Plate Fabricated by Electron Beam Melting. In TMS 2016 145th Annual Meeting & Exhibition; Springer International Publishing: Cham, Switzerland, 2016; pp. 5–12. [Google Scholar]
- Cain, V.; Thijs, L.; Van Humbeeck, J.; Van Hooreweder, B.; Knutsen, R. Crack propagation and fracture toughness of Ti6Al4V alloy produced by selective laser melting. Addit. Manuf. 2015, 5, 68–76. [Google Scholar] [CrossRef]
- Alcisto, J.; Enriquez, A.; Garcia, H.; Hinkson, S.; Steelman, T.; Silverman, E. Tensile properties and microstructures of laser-formed Ti-6Al-4V. J. Mater. Eng. Perform. 2011, 20, 203–212. [Google Scholar] [CrossRef]
- Wang, T.; Zhang, Y.; Wu, Z.; Shi, C. Microstructure and properties of die steel fabricated by WAAM using H13 wire. Vacuum 2018, 149, 185–189. [Google Scholar] [CrossRef]
- Standard Specification for Stainless Steel Forgings; 100 Barr Harbor Drive; ASTM: West Conshohocken, PA, USA, 2015.
- Villanueva, D.M.; Junior, F.C.; Plaut, R.L.; Padilha, A.F. Comparative study on sigma phase precipitation of three types of stainless steels: Austenitic, superferritic and duplex. Met. Sci. J. 2006, 22, 1098–1104. [Google Scholar] [CrossRef]
- Zhong, Y.; Rännar, L.; Liu, L.; Koptyug, A.; Wikman, S.; Olsen, J. Additive manufacturing of 316L stainless steel by electron beam melting for nuclear fusion applications. J. Nucl. Mater. 2017, 486, 234–245. [Google Scholar] [CrossRef]


| C | Si | Mn | S | Cu | P | Cr | Ni | Mo | Fe |
|---|---|---|---|---|---|---|---|---|---|
| 0.016 | 0.51 | 2.14 | 0.014 | 0.03 | 0.013 | 18.96 | 12.73 | 2.32 | bal. |
| Sample | Layers | Deposition Current I/A | Wire Feed Speed WFS/m·min−1 | Scanning Speed V/ cm·min−1 | Deposition Voltage U/V | Cooling Time t/s |
|---|---|---|---|---|---|---|
| #TRBC | (1st) | 100 | 7 | 30 | 18.8 | 10 |
| (2nd) | 90 | 6.1 | 18.1 | |||
| (3rd–30th) | 60 | 3.8 | 15.7 | |||
| #GRBC-30 cm/min-10 s | (1st) | 100 | 7 | 30 | 18.8 | 10 |
| (2nd) | 90 | 6.1 | 18.1 | |||
| (3rd) | 85 | 5.7 | 17.6 | |||
| (4th) | 80 | 5.4 | 17.3 | |||
| (5th) | 75 | 5 | 16.8 | |||
| (6th) | 70 | 4.6 | 16.4 | |||
| (7th) | 65 | 4.2 | 16 | |||
| (8th–30th) | 60 | 3.8 | 15.7 | |||
| #35 cm/min | Same as above | Same as above | Same as above | 35 | Same as above | 10 |
| #0 s | Same as above | Same as above | Same as above | 30 | Same as above | 0 |
| #5 s | Same as above | Same as above | Same as above | 30 | Same as above | 5 |
| #15 s | Same as above | Same as above | Same as above | 30 | Same as above | 15 |
| Sample | DR(%) | EDRM(%/min) | DT (min) | Average Height Per Layer (mm) | ||
|---|---|---|---|---|---|---|
| #TRBC | 30.028 | 12.307 | 40.985% | 2.006 | 20.43 | 2.17 |
| #GRBC-30 cm/min-10 s | 31.511 | 16.90 | 53.62% | 2.625 | 20.43 | 2.167 |
| #35 cm/min | 27.01 | 14. 40 | 53.3% | 2.915 | 18.283 | 2.03 |
| #5 s | 31.511 | 16.70 | 52.99% | 2.94 | 18.017 | 2.13 |
| #15 s | 31.511 | 14.73 | 46.74% | 2.045 | 22.85 | 2.18 |
| Sample | Yield Strength (MPa) | Ultimate Tensile Strength (MPa) | Sample | Yield Strength (MPa) | Ultimate Tensile Strength (MPa) |
|---|---|---|---|---|---|
| #TRBC-H1 | 335.00 | 537.40 | #GRBC-30 cm/min-10 s-H1 | 330.17 | 541.08 |
| #TRBC-H2 | 310.00 | 498.77 | #GRBC-30 cm/min-10 s-H2 | 345.67 | 561.38 |
| #TRBC-H3 | 336.83 | 563.78 | #GRBC-30 cm/min-10 s-H3 | 327.17 | 570.56 |
| #TRBC-V1 | 370.33 | 628.19 | #GRBC-30 cm/min-10 s-V1 | 369.17 | 628.04 |
| #TRBC-V2 | 371.11 | 616.07 | #GRBC-30 cm/min-10 s-V2 | 364.17 | 606.68 |
| #TRBC-V3 | 342.56 | 585.83 | #GRBC-30 cm/min-10 s-V3 | 339.50 | 574.68 |
| #35 cm/min-H1 | 307.33 | 524.30 | #5 s-H1 | 307.00 | 551.39 |
| #35 cm/min-H2 | 306.17 | 525.75 | #5 s-H2 | 325.63 | 567.09 |
| #35 cm/min-H3 | 336.67 | 593.59 | #5 s-H3 | 330.17 | 584.99 |
| #35 cm/min-V1 | 359.56 | 634.47 | #5 s-V1 | 329.17 | 600.53 |
| #35 cm/min-V2 | 336.67 | 602.56 | #5 s-V2 | 323.00 | 579.75 |
| #35 cm/min-V3 | 336.67 | 621.44 | #5 s-V3 | 329.17 | 589.26 |
| #15 s-H1 | 333.33 | 564.69 | BM1 | 383.33 | 641.24 |
| #15 s-H2 | 335.83 | 558.86 | BM2 | 380.21 | 651.78 |
| #15 s-H3 | 353.00 | 619.28 | BM3 | 385.85 | 630.59 |
| #15 s-V1 | 373.00 | 637.98 | - | - | - |
| #15 s-V2 | 345.83 | 609.24 | - | - | - |
| #15 s-V3 | 365.50 | 595.88 | - | - | - |
© 2019 by the authors. Licensee MDPI, Basel, Switzerland. This article is an open access article distributed under the terms and conditions of the Creative Commons Attribution (CC BY) license (http://creativecommons.org/licenses/by/4.0/).
Share and Cite
Wu, W.; Xue, J.; Wang, L.; Zhang, Z.; Hu, Y.; Dong, C. Forming Process, Microstructure, and Mechanical Properties of Thin-Walled 316L Stainless Steel Using Speed-Cold-Welding Additive Manufacturing. Metals 2019, 9, 109. https://doi.org/10.3390/met9010109
Wu W, Xue J, Wang L, Zhang Z, Hu Y, Dong C. Forming Process, Microstructure, and Mechanical Properties of Thin-Walled 316L Stainless Steel Using Speed-Cold-Welding Additive Manufacturing. Metals. 2019; 9(1):109. https://doi.org/10.3390/met9010109
Chicago/Turabian StyleWu, Wei, Jiaxiang Xue, Leilei Wang, Zhanhui Zhang, Yu Hu, and Changwen Dong. 2019. "Forming Process, Microstructure, and Mechanical Properties of Thin-Walled 316L Stainless Steel Using Speed-Cold-Welding Additive Manufacturing" Metals 9, no. 1: 109. https://doi.org/10.3390/met9010109
APA StyleWu, W., Xue, J., Wang, L., Zhang, Z., Hu, Y., & Dong, C. (2019). Forming Process, Microstructure, and Mechanical Properties of Thin-Walled 316L Stainless Steel Using Speed-Cold-Welding Additive Manufacturing. Metals, 9(1), 109. https://doi.org/10.3390/met9010109