Article

Hardness Prediction in Hot Stamping Process by Local Blank Heating Based on Quench Factor Analysis

1
Precision Manufacturing Systems Division, Pusan National University, 2, Busandaehak-ro 63beon-gil, Geumjeong-gu, Busan 46241, Korea
2
Graduate School of Convergence Science, Pusan National University, 2, Busandaehak-ro 63beon-gil, Geumjeong-gu, Busan 46241, Korea
3
Faculty of Mechanical & Automotive Engineering, Keimyung University, 1095 Dalgubeol-daero, Dalseo-gu, Daegu 42601, Korea
4
School of Mechanical Engineering, Pusan National University, 2, Busandaehak-ro 63beon-gil, Geumjeong-gu, Busan 46241, Korea
*
Author to whom correspondence should be addressed.
Metals 2019, 9(1), 29; https://doi.org/10.3390/met9010029
Submission received: 21 November 2018 / Revised: 10 December 2018 / Accepted: 13 December 2018 / Published: 29 December 2018

Abstract

:
Recently, the hot stamping process using local blank heating has been widely used to manufacture lightweight and crashworthy automotive parts. However, the hardness prediction of hot stamped parts produced using local blank heating is difficult because it involves many process variables, such as the heating temperature, heating time, and cooling rate. The purpose of this study was to predict the hardness of hot stamped parts fabricated using local blank heating based on quench factor analysis (QFA). The volume fraction of austenite was measured to consider the phase transformation in the heating stage, and it was expressed by the Johnson–Mehl–Avrami–Kolmogorov (JMAK) equation. Additionally, a dilatometry test was performed to measure the hardness according to the cooling rates, which was used to determine the material constants for QFA. Finite-element simulation was performed to predict the temperature histories during the hot stamping process and the results were used to predict the hardness according to QFA with the JMAK equation. A hot stamping experiment with local blank heating equipment was performed, and the predicted and experimental results were compared for verification of the proposed hardness prediction method.

1. Introduction

Recently, reducing the car body weight has emerged as an important issue in the automotive industry because of the strengthened fuel efficiency and emission regulations [1,2]. The hot stamping process is widely used to manufacture automotive parts for reducing the car body weight and achieving high formability and excellent dimensional accuracy [3,4]. However, hot stamped parts are unsuitable as crash absorbing parts because of their high strength and low ductility. To solve these problems, the hot stamping process with a tailored blank is used in the manufacturing of car body parts [5].
Local blank heating means that the complete thermal cycle above austenitization would be applied only in high-strength region, whereas the other zone would be heated below the Ac3 temperature to control the phase transformation of austenite [6]. Therefore, the microstructure of partial austenite is transformed into martensite, and excellent ductility is achieved during the hot stamping process. However, the process design of hot stamped parts subjected to local blank heating is difficult to determine because it involves many process variables, such as the heating temperature, heating time, and cooling rate.
To design the hot stamping process, the hardness of the part was predicted beforehand, which is reflected in the manufacturing process. Therefore, it is important to predict the hardness accurately, and many studies have been performed in this area. Hardness prediction is conventionally performed via finite-element (FE) simulation based on kinematic transformation theory and empirical models such as the K–V model, Li’s model, or the A–O model [7,8]. George et al. [9] predicted the hardness in the hot stamping process involving local tool heating using the A–O model. Tang et al. [10] performed hardness prediction according to a modified A–O model considering the deformation path of the sheet. Hippchen et al. [11] suggested a modified A–O model considering diffusionless and diffusion-controlled phase transformations in indirect hot stamping with tailored properties. Wilsius et al. [12] predicted the temperature, strain, and thinning in hot stamping involving local blank heating, but hardness prediction was not conducted. As previously mentioned, hardness prediction for a tailored blank is limited to local tool heating; therefore, hardness prediction for local blank heating is needed to achieve a process design method.
In this study, the hardness of hot stamped parts subjected to local blank heating was predicted using quench factor analysis (QFA). The volume fraction of austenite was measured to consider the phase transformation in the heating stage, and was expressed by the Johnson–Mehl–Avrami–Kolmogorov (JMAK) equation. A dilatometry test was also performed to measure the hardness according to the cooling rates, which was used to determine the material constants for QFA. FE simulation was performed to predict the temperature histories during the hot stamping process and the results were used to predict the hardness according to QFA with the JMAK equation. A hot stamping experiment with local blank heating equipment was performed to compare the predicted and experimental results for verification of the proposed hardness prediction method.

2. Methodology for Hardness Prediction

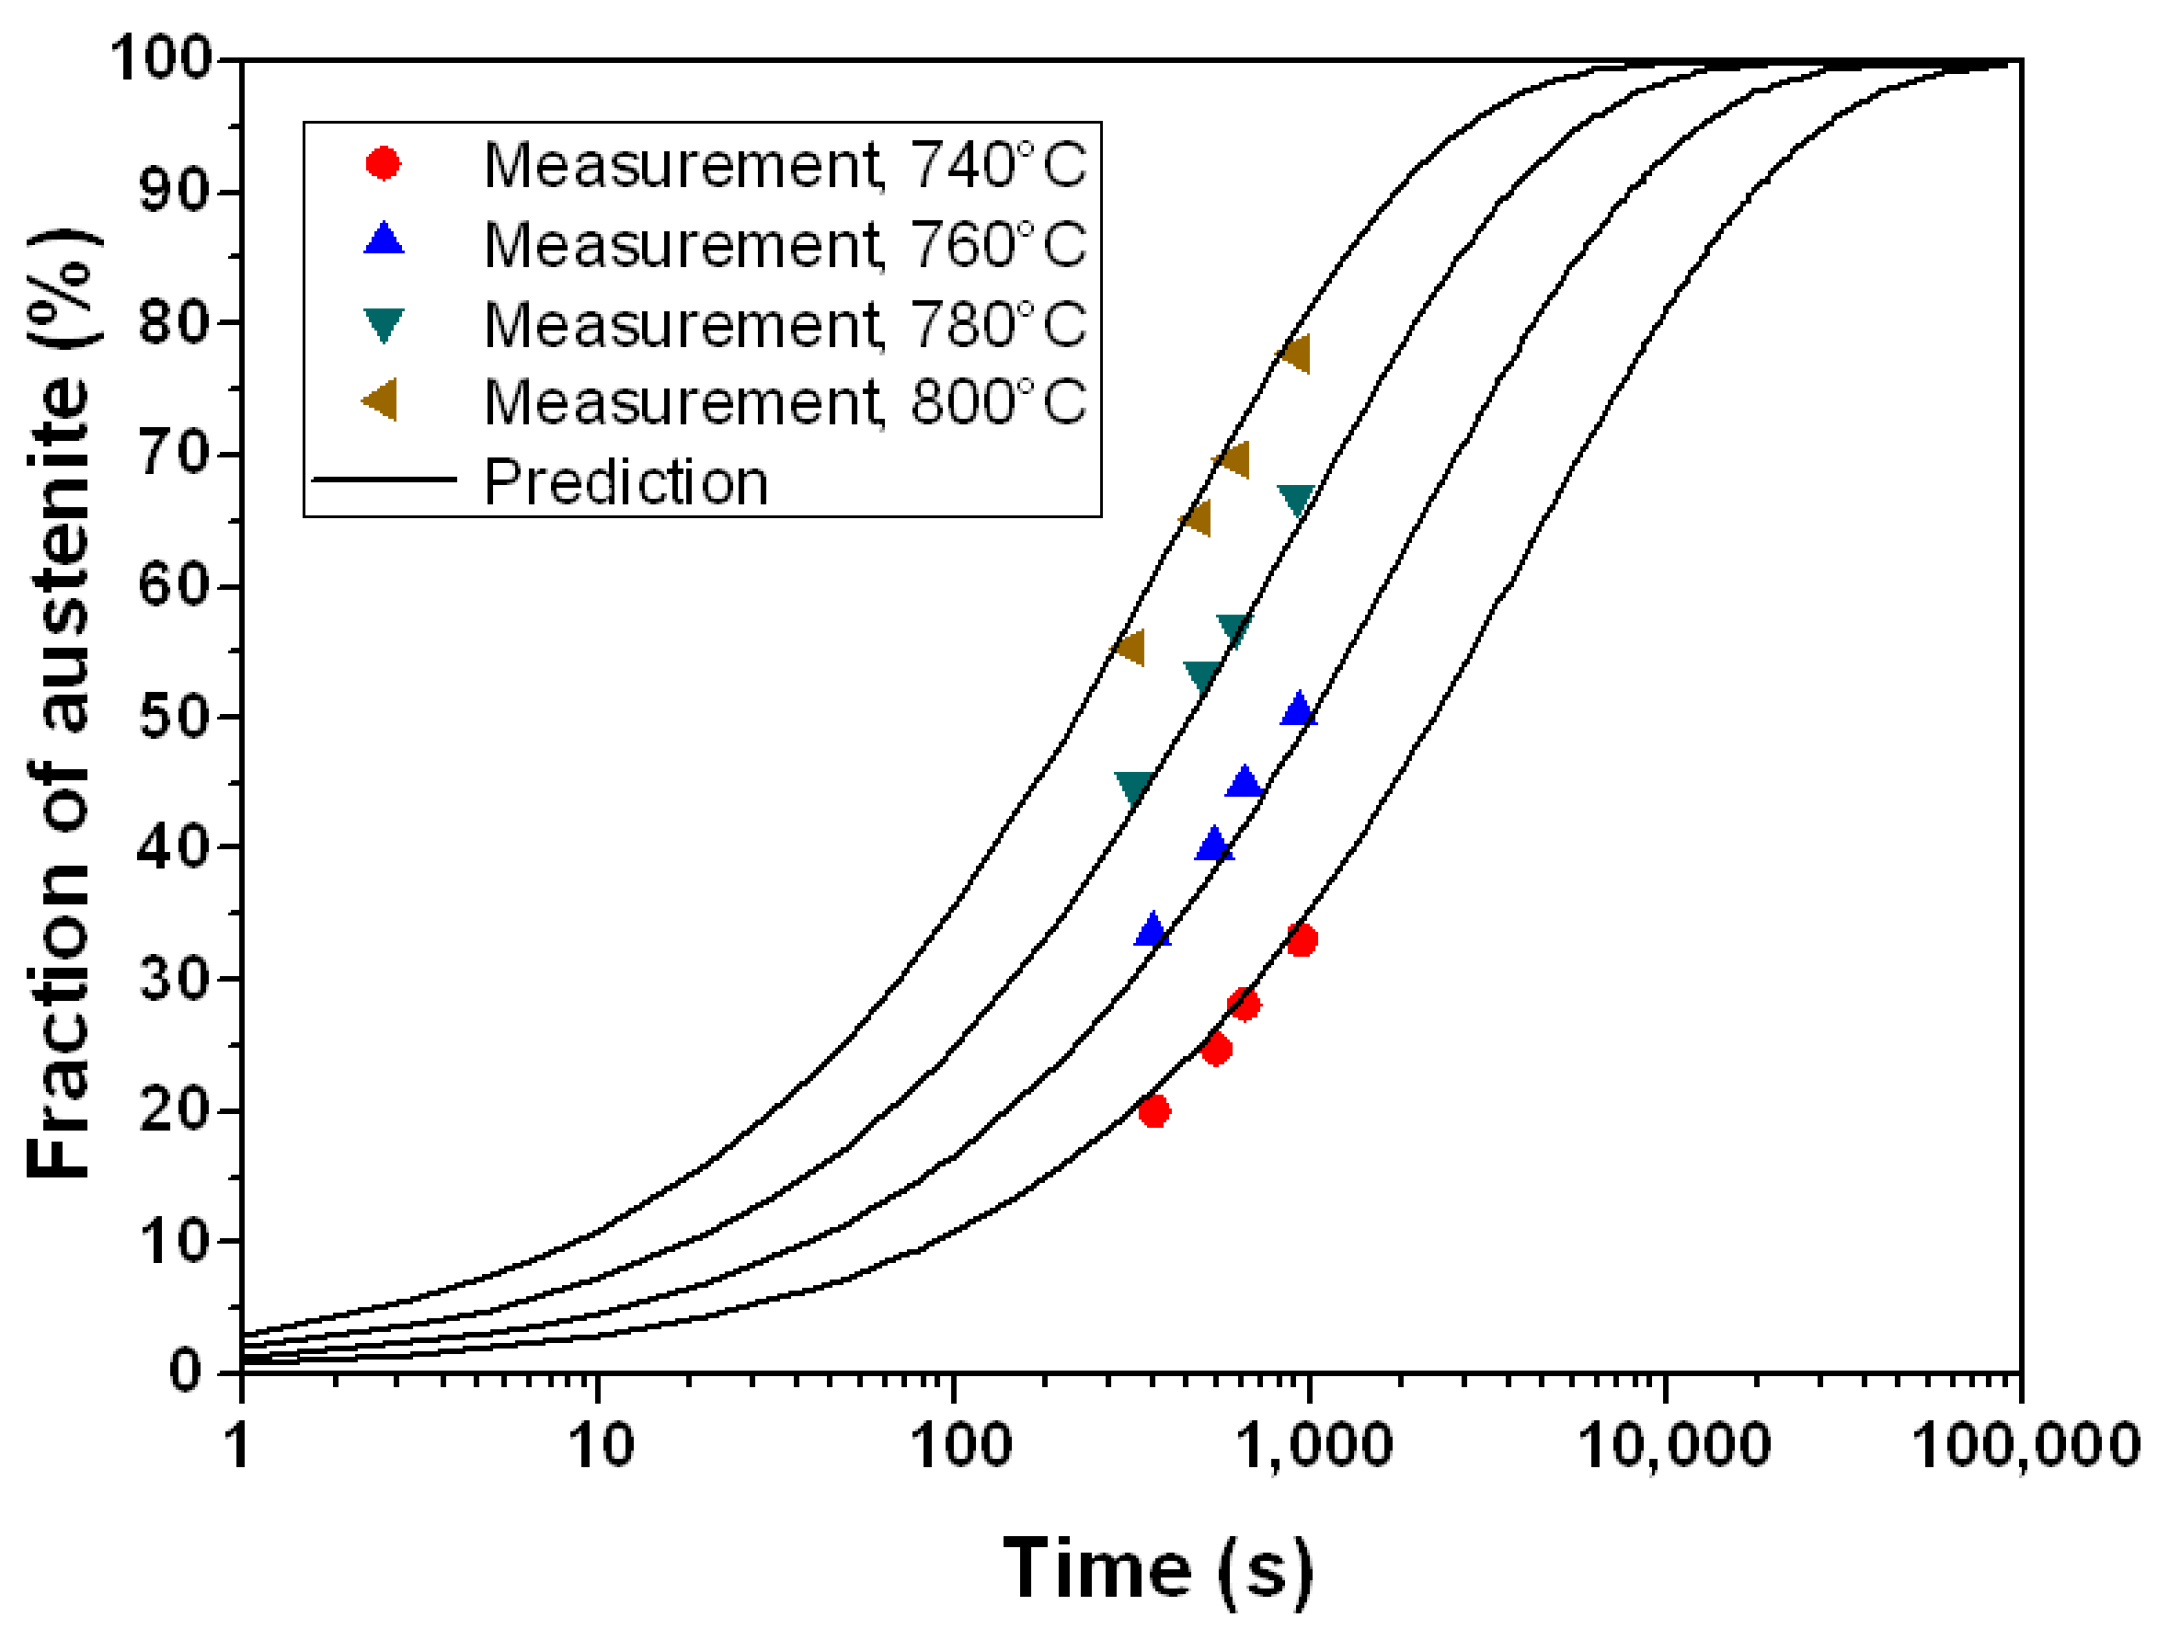
2.1. Prediction of Volume Fraction

The volume fraction of austenite should be considered according to the heating conditions in order to predict the hardness for a locally heated blank; however, the existing hardness-prediction model assumes the full austenite phase of the sheets in the hot stamping process. In this study, the JMAK equation is applied to predict the volume fraction of austenite according to the heating temperature and time.
The JMAK equation is an empirical equation that can describe the phase transformation behavior with nucleation and growth, and is defined as follows:
X = 1 exp ( k t n )
where n is the Avrami exponent, k is a rate constant related to nucleation and growth, t is the heating time, and X is the volume fraction of the transformed phase. k can also be expressed by Equation (2), because nucleation and growth are generally represented by Arrhenius behavior.
k = A exp ( E R T c )
where A is the frequency factor, E is the activation energy for phase transformation, R is the gas constant (8.3143 J/K·mol), and Tc is the heating temperature.
According to Equations (1) and (2), the volume fraction of the transformed phase is defined as follows:
X = 1 exp ( A t n exp ( E R T c ) )
The volume fraction of austenite for various heating conditions should be measured to determine the Avrami exponent n and the rate constant k. In this study, heated specimens were quenched by water, and then the volume fraction of martensite in the quenched specimens was measured because austenite was transformed to martensite at a cooling rate of >30 °C/s.
In this study, zinc-coated boron steel was used, and its chemical compositions are presented in Table 1. In the experiment, the range of the heating temperature was 720 to 800 °C, and the range of the holding time was 0 to 10 min. Specimens were heated in an electronic furnace according to the aforementioned conditions and then manually transferred to a water bath within 1 s in order to prevent the phase transformation from the austenite phase to a ductile phase, such as ferrite, pearlite, or bainite.
The quenched specimens were etched via the LePera method to measure the volume fraction of martensite. The microstructure of the etched specimens was observed using an optical microscope, and the volume fraction of martensite was measured by image analysis.
Figure 1 shows the experimental results for the volume fraction of austenite according to the heating temperature and holding time. The microstructure of the quenched specimens consisted of martensite generated by the phase transformation and a mixed phase of ferrite and pearlite for the initial structure. In the case of heating at 720 °C, the volume fraction of austenite was not affected by the holding time, whereas the volume fraction of austenite for other heating temperatures increased with the holding time.
According to the experimental results, the material constants of boron steel for the JMAK equation were determined, as shown in Table 2. Figure 2 shows the results of the comparison between the experimental and predicted volume fractions of austenite, indicating that the JMAK equation precisely predicted the volume fraction of austenite.

2.2. Prediction of Hardness

QFA presents a single number Q, which is related to the cooling curve or rate of the material and the transformation kinetics of the particular alloy during quenching. The transformation and hardening characteristics of the material are expressed by the time‒temperature‒property function. This function is a mathematical expression relating the transformation temperatures and times to the mechanical properties of the quenched material, and it is generally given as follows:
C T = K 1 K 2 exp ( K 3 K 4 2 R T ( K 4 T ) 2 ) exp ( K 5 R T )
where CT is the critical time required to precipitate a constant amount of solute. K1 is a constant equal to the natural logarithm of the volume fraction for the untransformed material during quenching, K2 is a constant related to the reciprocal of the number of nucleation sites, K3 is a constant related to the energy required to form a nucleus, K4 is a constant related to the solvus temperature (K), K5 is a constant related to the activation energy for diffusion, R is a gas constant, and T is the average temperature (K) between successive time steps.
An incremental quench factor (q) for each time step in the transformation range is first calculated to determine the quench factor (Q). The values of the incremental quenching factor are summed over the transformation range to produce cumulative Q, as follows:
Q = q = T = M s T = A c 3 Δ t C T
where Δt is the time step. The quench factor reflects the process variables, such as the blank thickness, die temperature, and heat transfer characteristics of the materials. Therefore, the quench factor could be related to the mechanical properties of the quenched material, such as the hardness and strength, according to Equation (6).
P p = P min + ( P max P min ) exp ( K 1 Q )
where Pp is the predicted property, and Pmin and Pmax are minimum and maximum properties of the quenched part, respectively.
In this study, Equation (6) was modified to consider the change in the volume fraction of austenite according to the heating conditions because QFA only describes the hardenability of materials with a fully austenitic structure.
P p = [ P min + ( P max P min ) exp ( K 1 Q ) ] X + P i ( 1 X )
where X is the volume fraction of austenite predicted using the JMAK equation, and Pi is the mechanical property for the initial boron steel. Therefore, the predicted mechanical property, Pp, could be determined according to the volume fraction of austenite and the hardenability of boron steel.
Experimentally measured hardness data for various cooling rates were needed to determine the material constants for QFA. In this study, a dilatometer test was performed to measure the hardness of boron steel using a dilatometer with a forced air cooling system. In this test, the specimen was heated to 900 °C for 5 min using a coil for induction heating, and then it was cooled at a cooling rate ranging from 0.5 to 100 °C/s. The hardness of the specimens was measured via a Vicker’s hardness test, and the results are shown in Figure 3. The range of the hardness was 142 to 457 HV, and the hardness increased as the cooling rate was fast. The hardness was particularly high when the cooling rate was higher than 30 °C/s, which was generally recognized as the critical cooling rate for boron steel.
In order to determine the material constants for QFA, the experimentally measured hardness was implemented flexible polyhedron search (FPS) proposed by Nelder and Mead, which is a nonlinear optimization method. In the FPS, the error tolerance was set to 10%, and K2 and K3 were determined through iterative calculation. The determined material constants are summarized in Table 3. K1 was generally set as −0.00501(ln(0.995)), K2 and K3 were calculated by FPS, K4 was the austenitizing temperature of 900 °C, and K5 was obtained from the literature as 40,000 J/mol [13]. Pmax and Pmin were measured as 509 HV for the water-quenched specimen and 142 HV for a dilatometry specimen at a cooling rate of 0.5 °C/s, respectively. Figure 4 shows the results of the comparison between the measured and predicted hardness values for various cooling rates, indicating that the QFA could precisely predict the hardness in the hot stamping process.

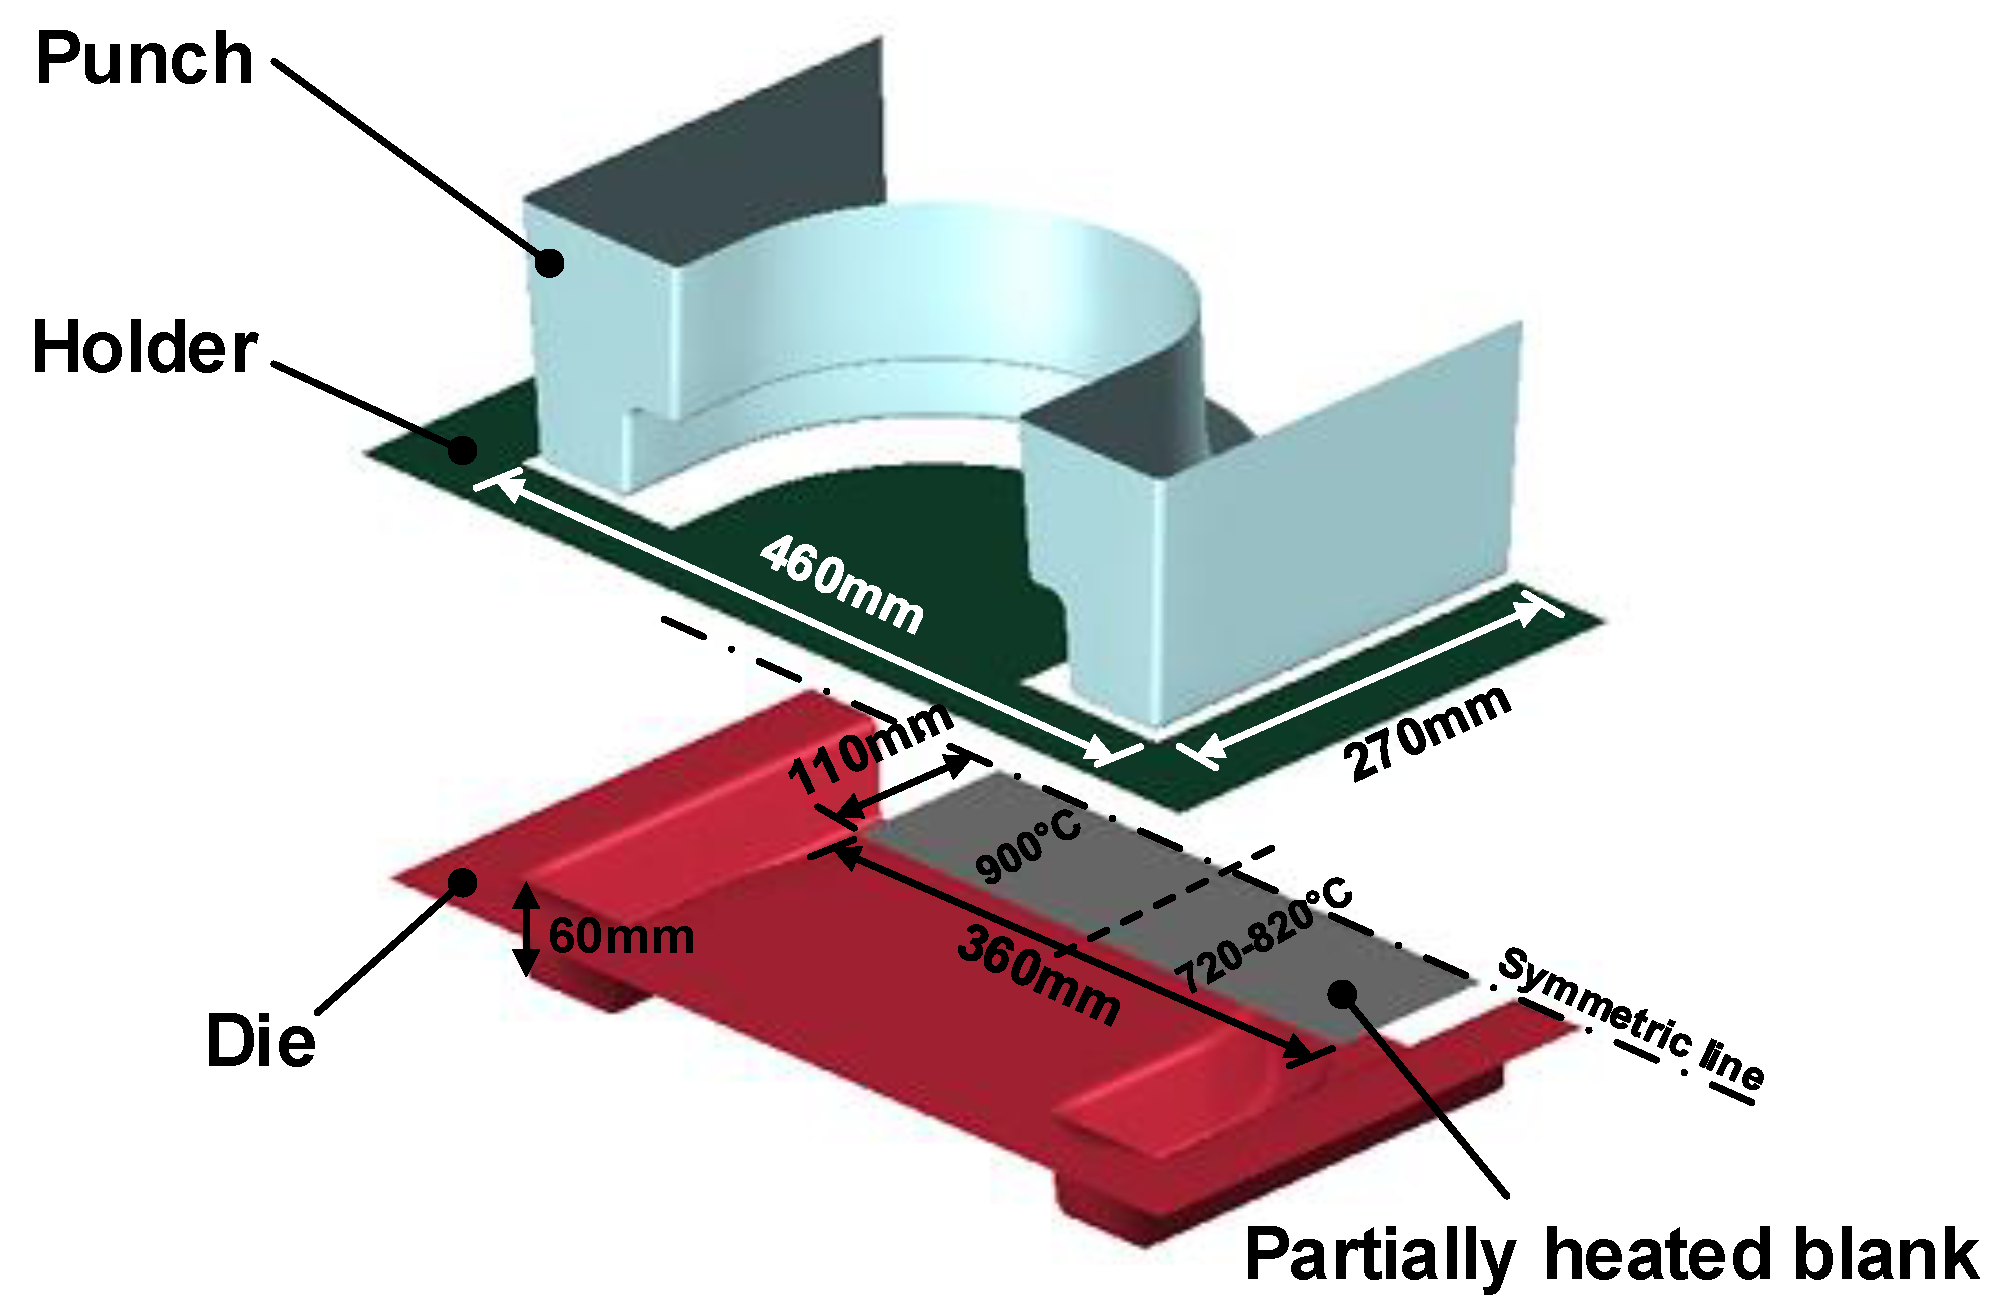
3. FE Simulation for Hot Stamping Process by Local Blank Heating

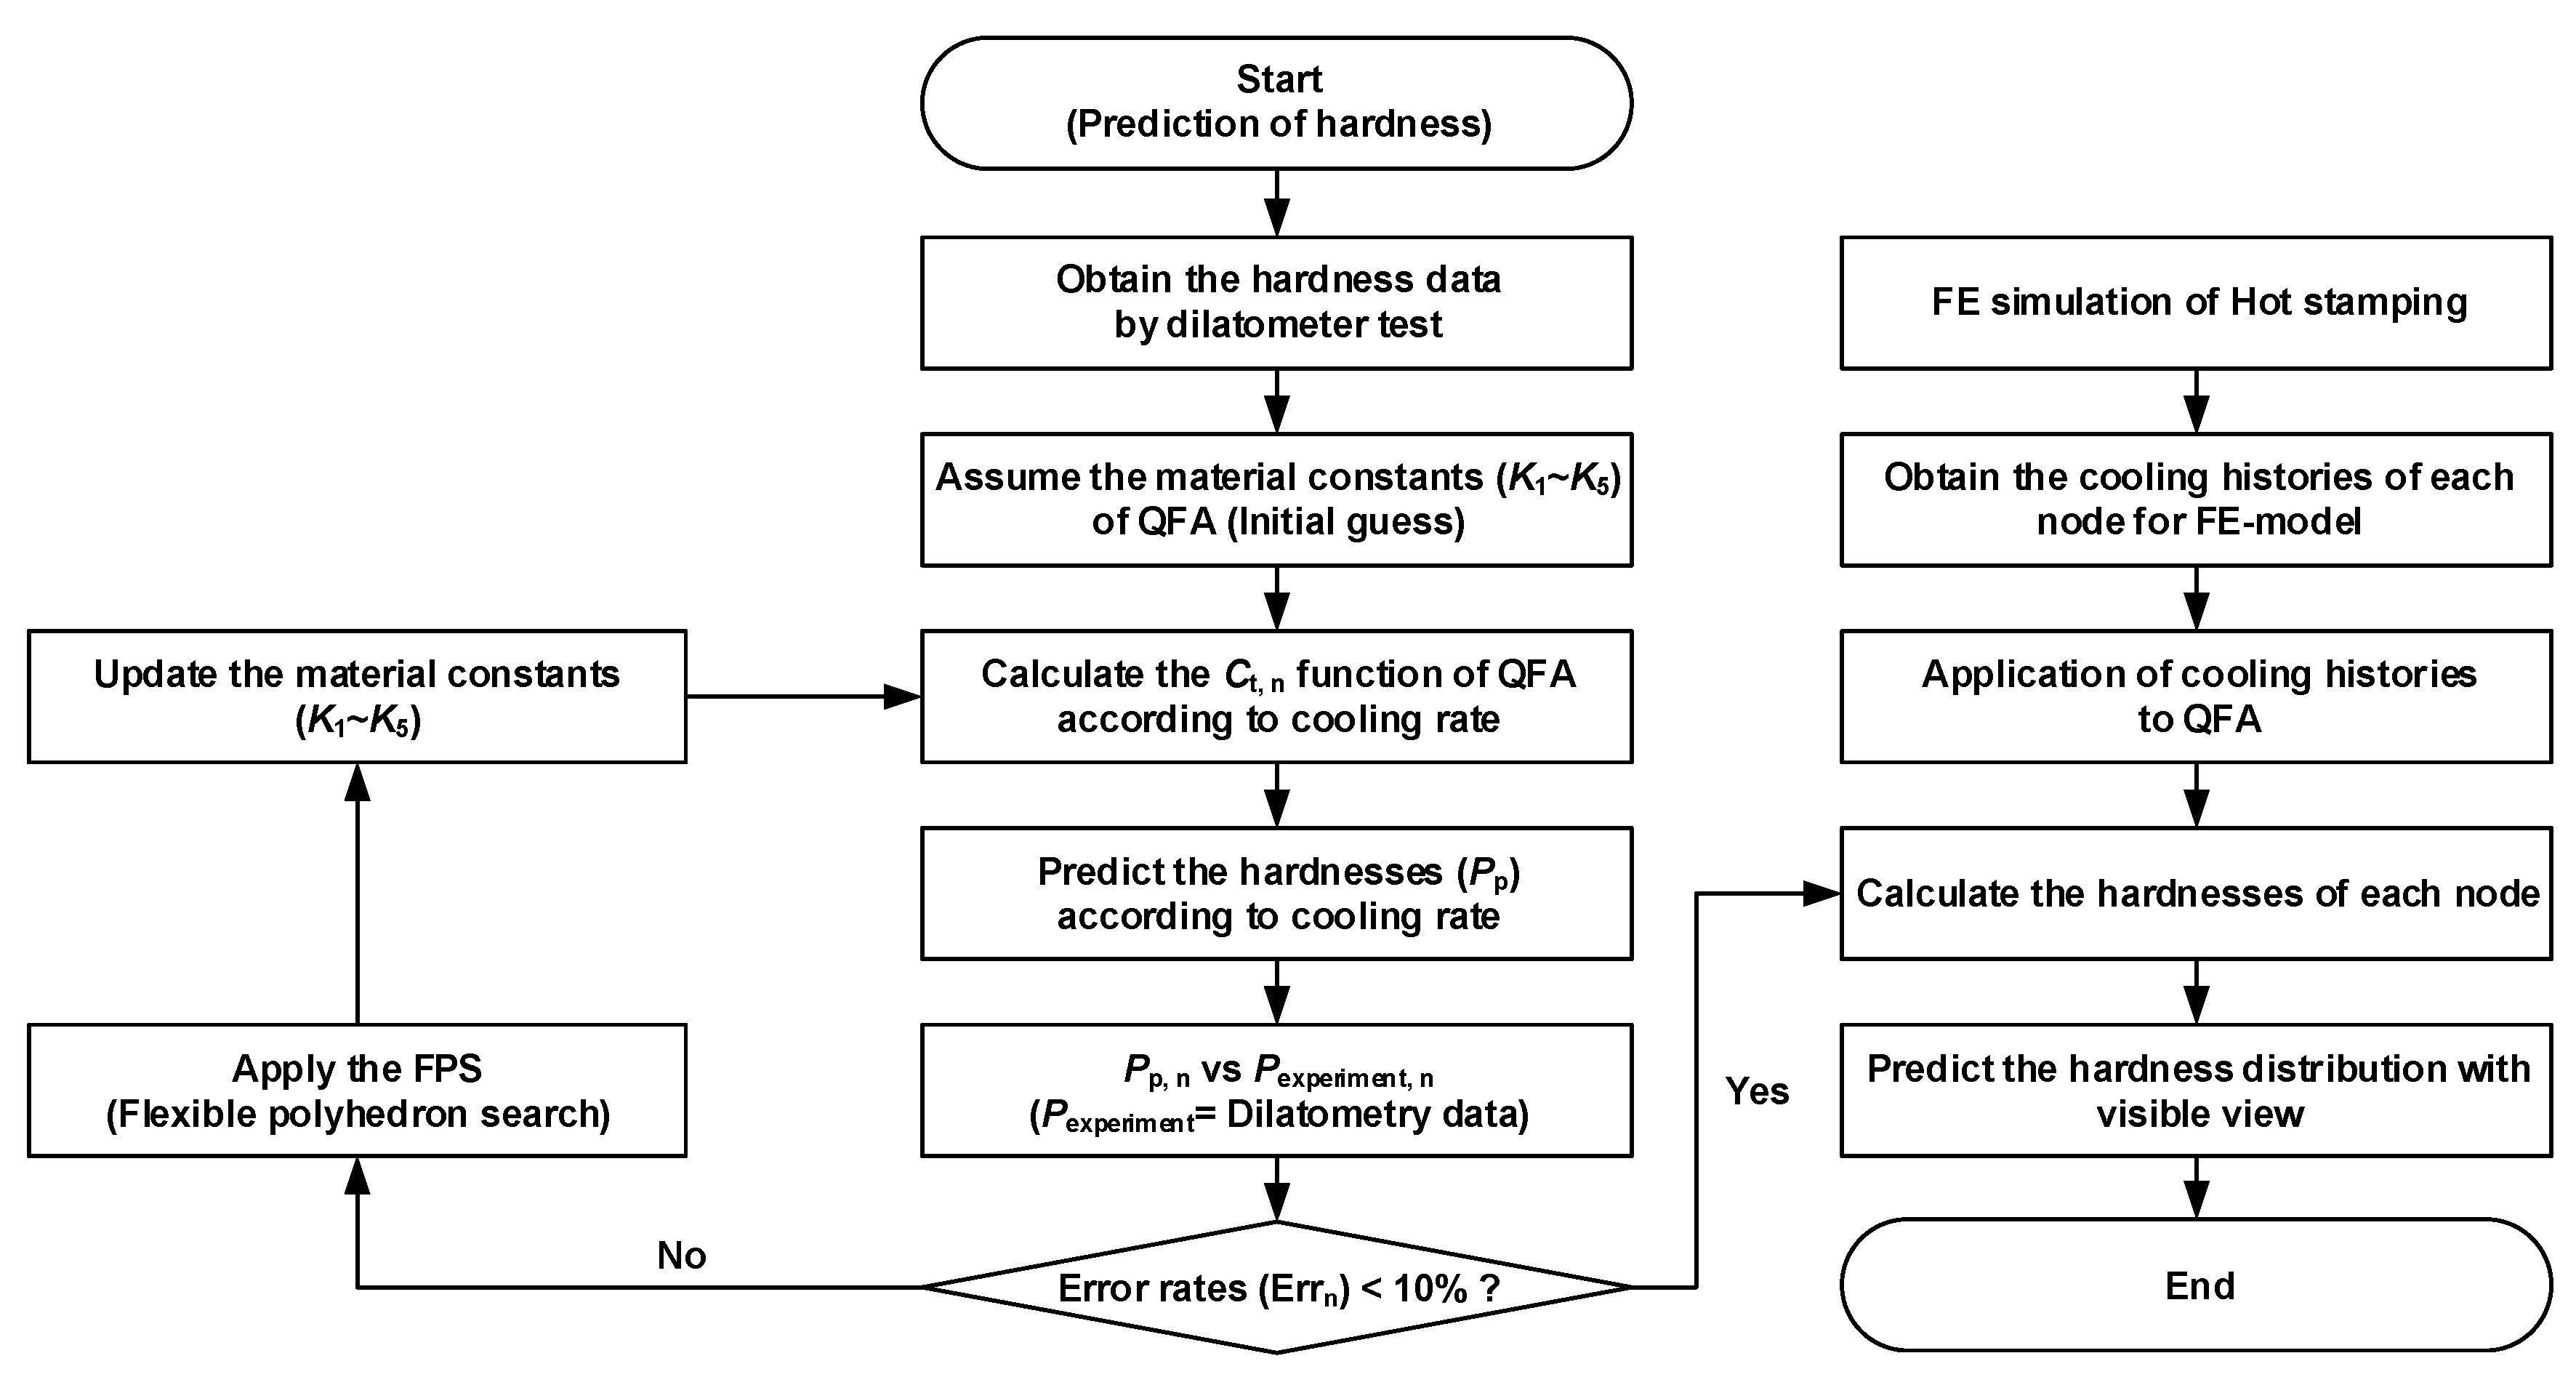
3.1. Procedure for Hardness Prediction

In the hot stamping process, the temperature history affects the phase transformation and mechanical properties of the final product, and should be precisely predicted. In this study, FE simulation was employed to predict the temperature histories for various heating conditions, and the results were applied to QFA. The procedure for hardness prediction is shown in Figure 5.
First, FE simulation was performed to predict the temperature histories of each node considering the mechanical and thermal properties. Then, the results of the FE simulation were used in the QFA to calculate the hardness of each node. Finally, the calculated hardness was mapped into the post-processor in order to visualize the hardness distribution for the hot stamped part.

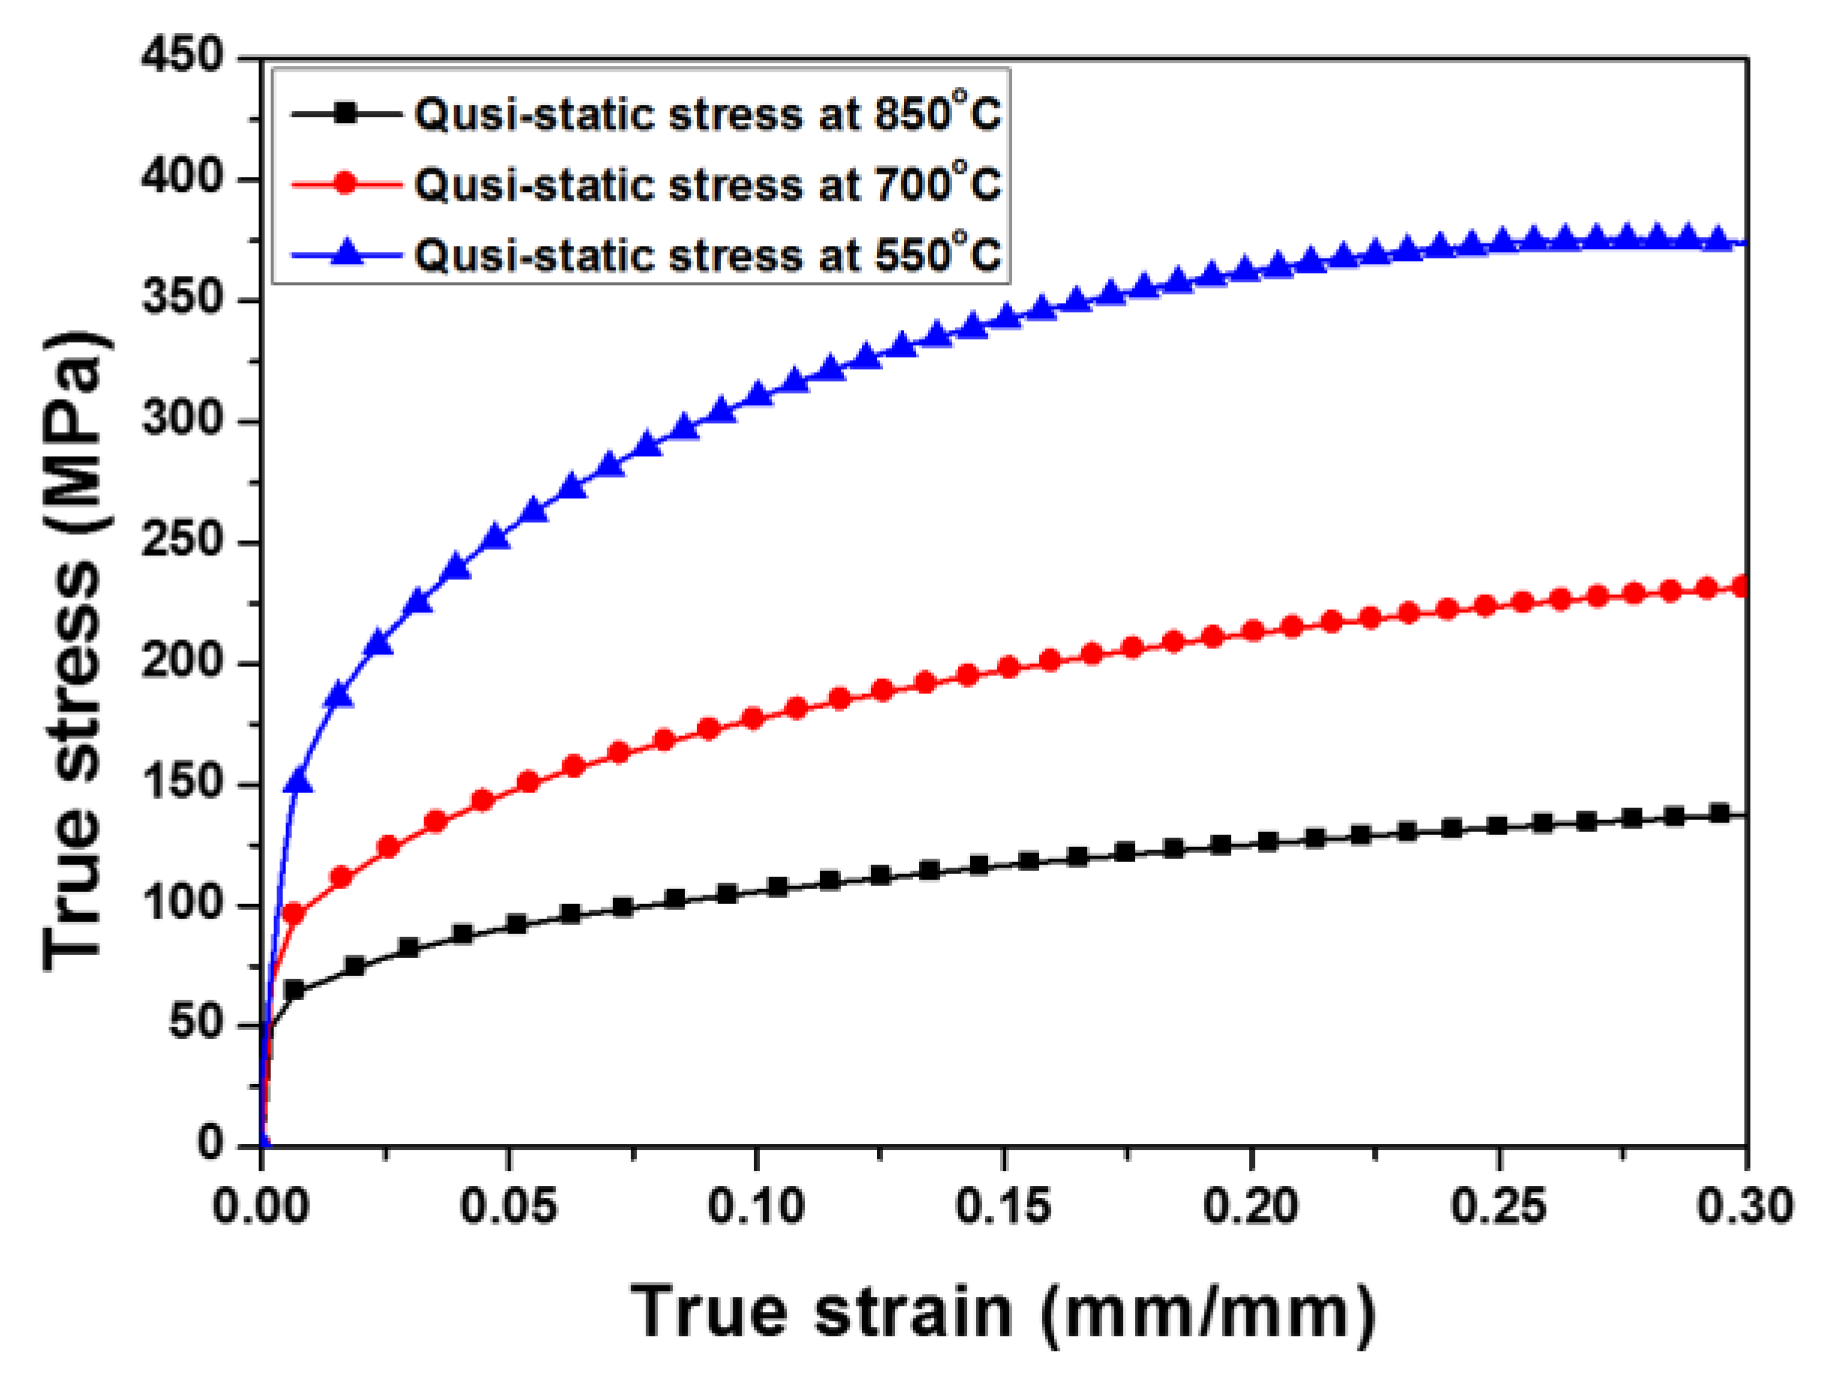
3.2. Conditions of FE-Simulation

FE simulation of the hot-stamping process involving local blank heating was performed using the commercial software JStamp/NV, and the FE model is shown in Figure 6. The size of the initial blank was W200 mm × L360 mm × t1.5 mm, and the FE simulation was performed with symmetric conditions and the time-scaling technique for analysis efficiency. The specimen was a shell element with seven integration points in the thickness direction and a uniform size of 2.0 mm × 2.0 mm, and the tool was assumed to be a rigid body. The Cowper–Symonds model was adopted as a constitutive equation to describe the material behavior of boron steel, and can be expressed as follows [14]:
σ d y n = σ s t a t [ 1 + ( ε ˙ C ) ] 1 p
where σdyn is the dynamic stress; σstat is the quasi-static stress at a strain rate of 0.1/s; ε ˙ is the strain rate; and C and p are material constants related to the strain rate and temperature, respectively. The strain–stress curve at the quasi-static state is shown in Figure 7, and the material constants for the Cowper–Symonds model are presented in Table 4.
The conditions of the FE simulation and the thermomechanical properties of boron steel are presented in Table 5. The FE simulation was performed for the entire hot stamping process, including heating, transferring, forming, and quenching. In the heating stage, the high-strength region of the blank was heated to 900 °C, and the low-strength region of the blank was heated to 720, 770, and 820 °C for 5 min. Then, the heated blank was transferred to the die within 10 s, and the blank was formed by a forming punch at 20 mm/s for 3 s. Finally, the formed blank was quickly quenched via heat transfer between the tools and the blank for 20 s.

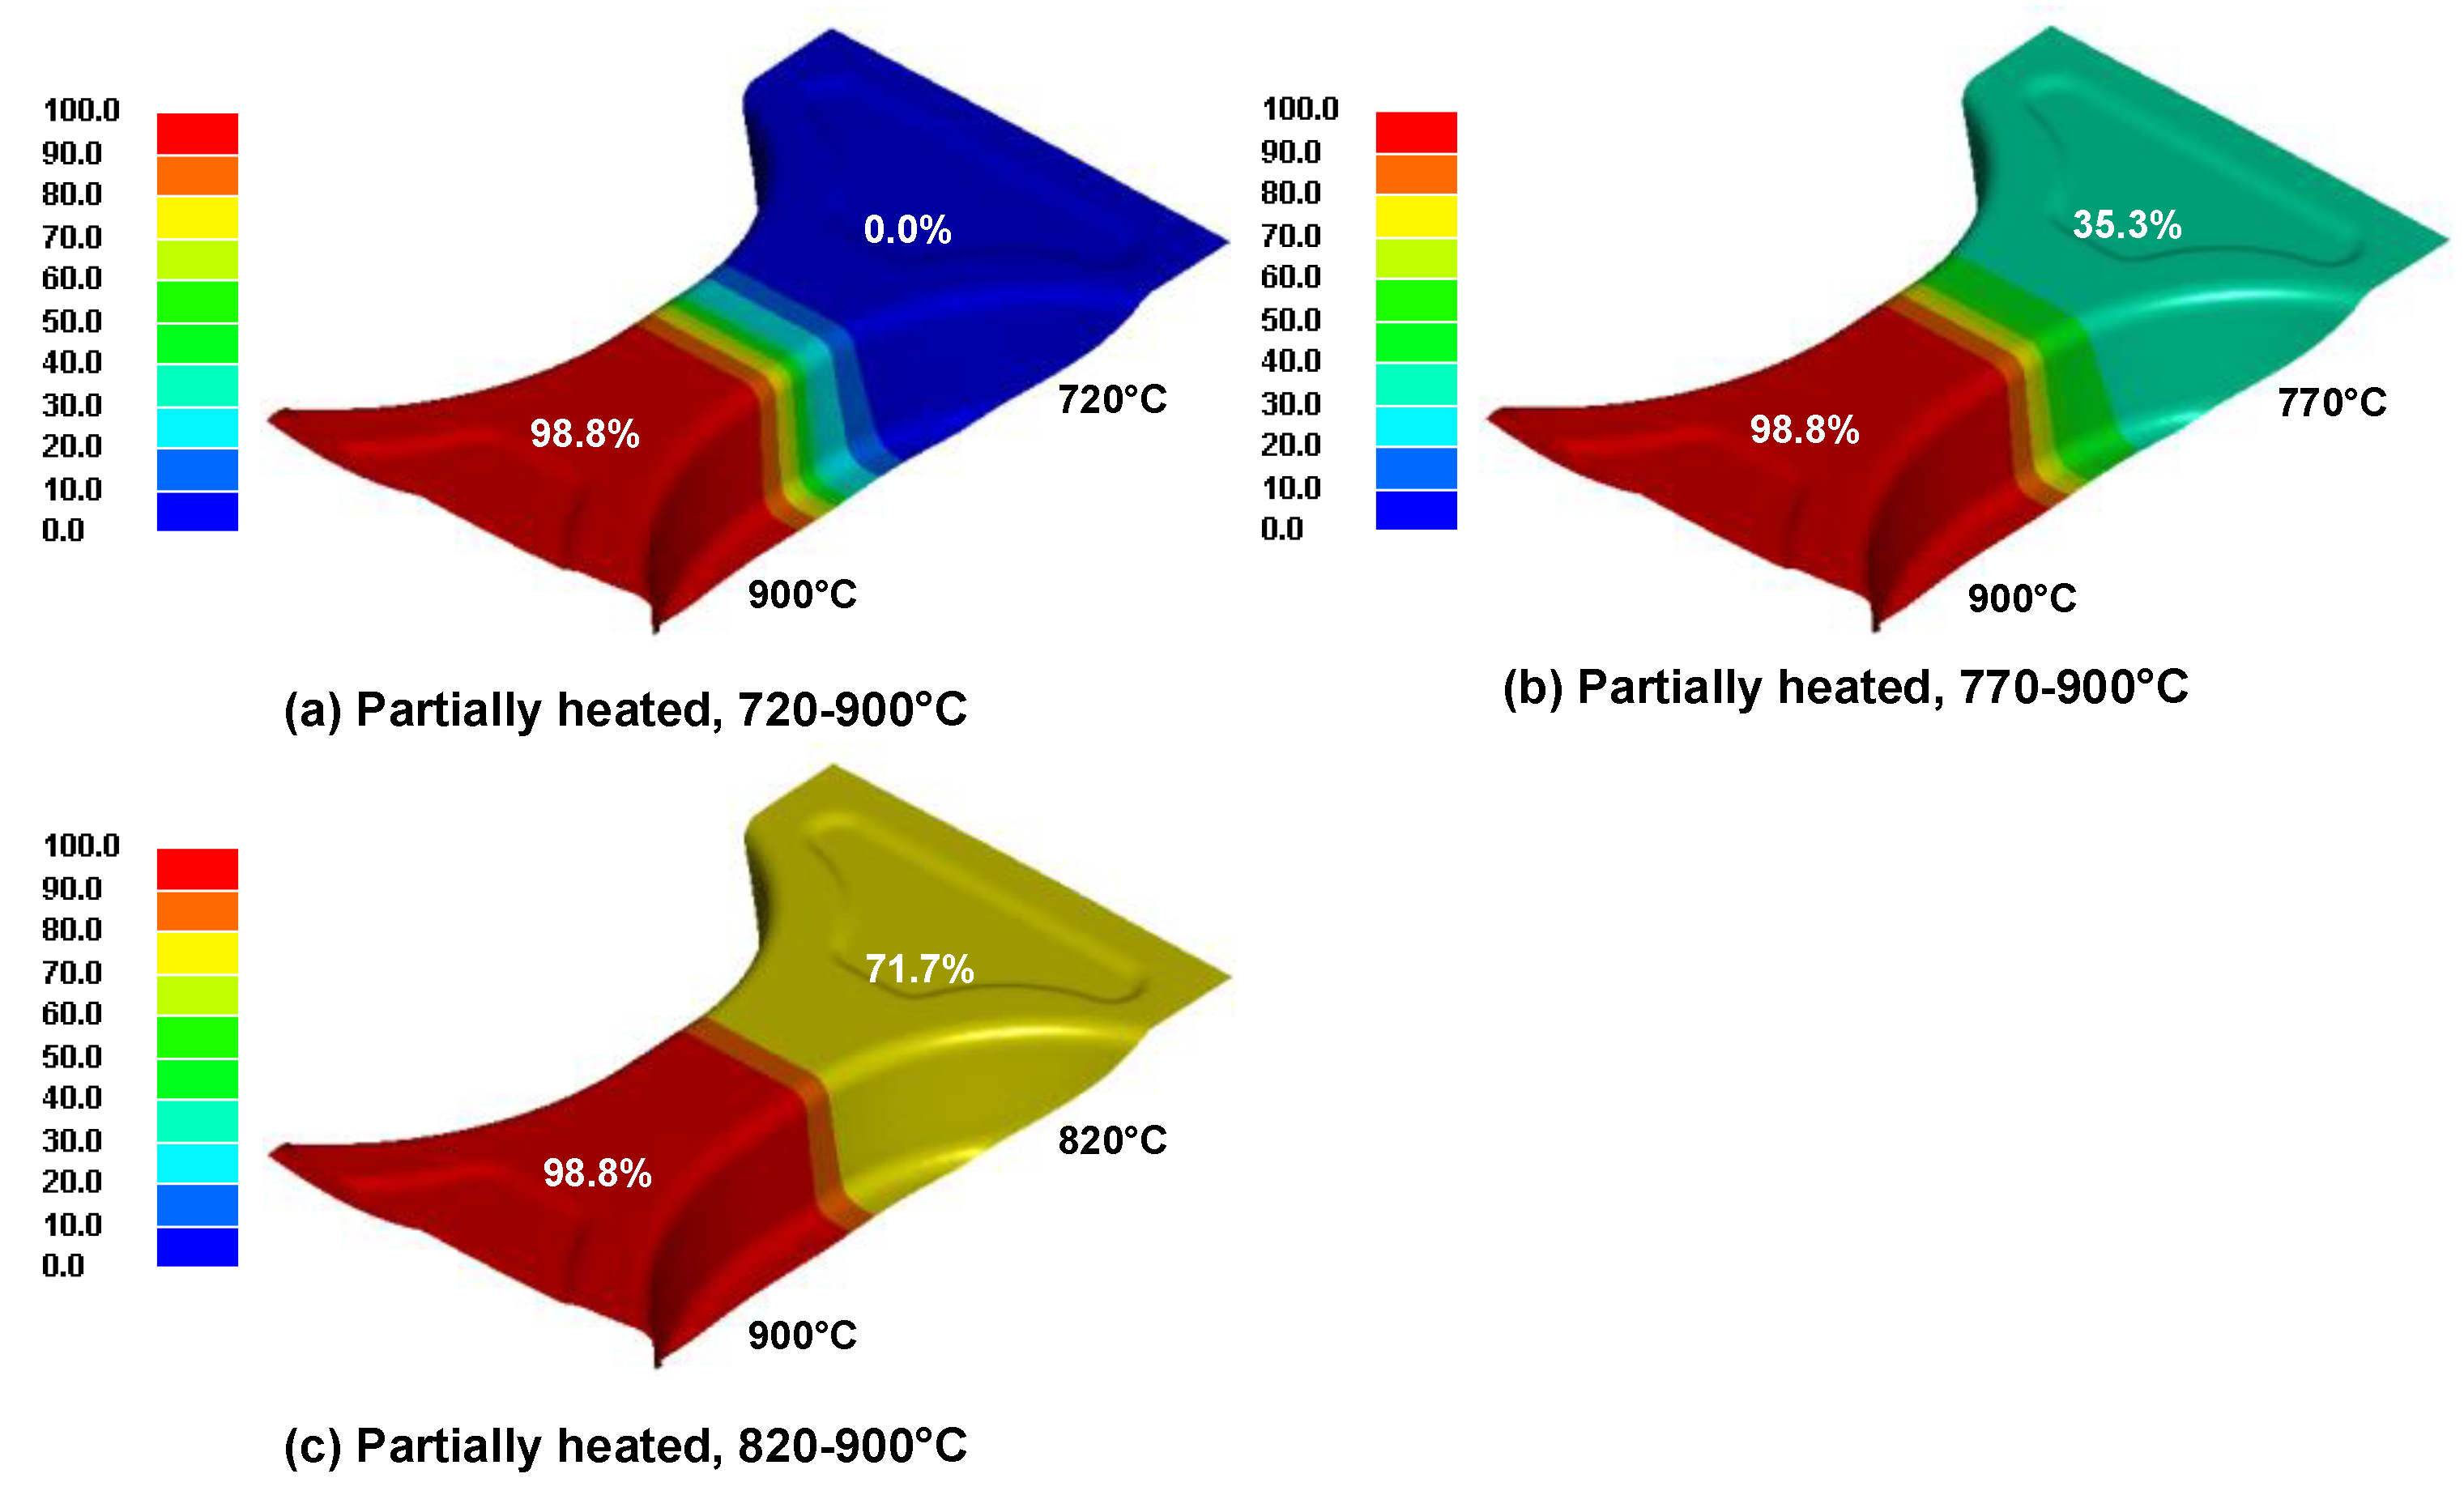
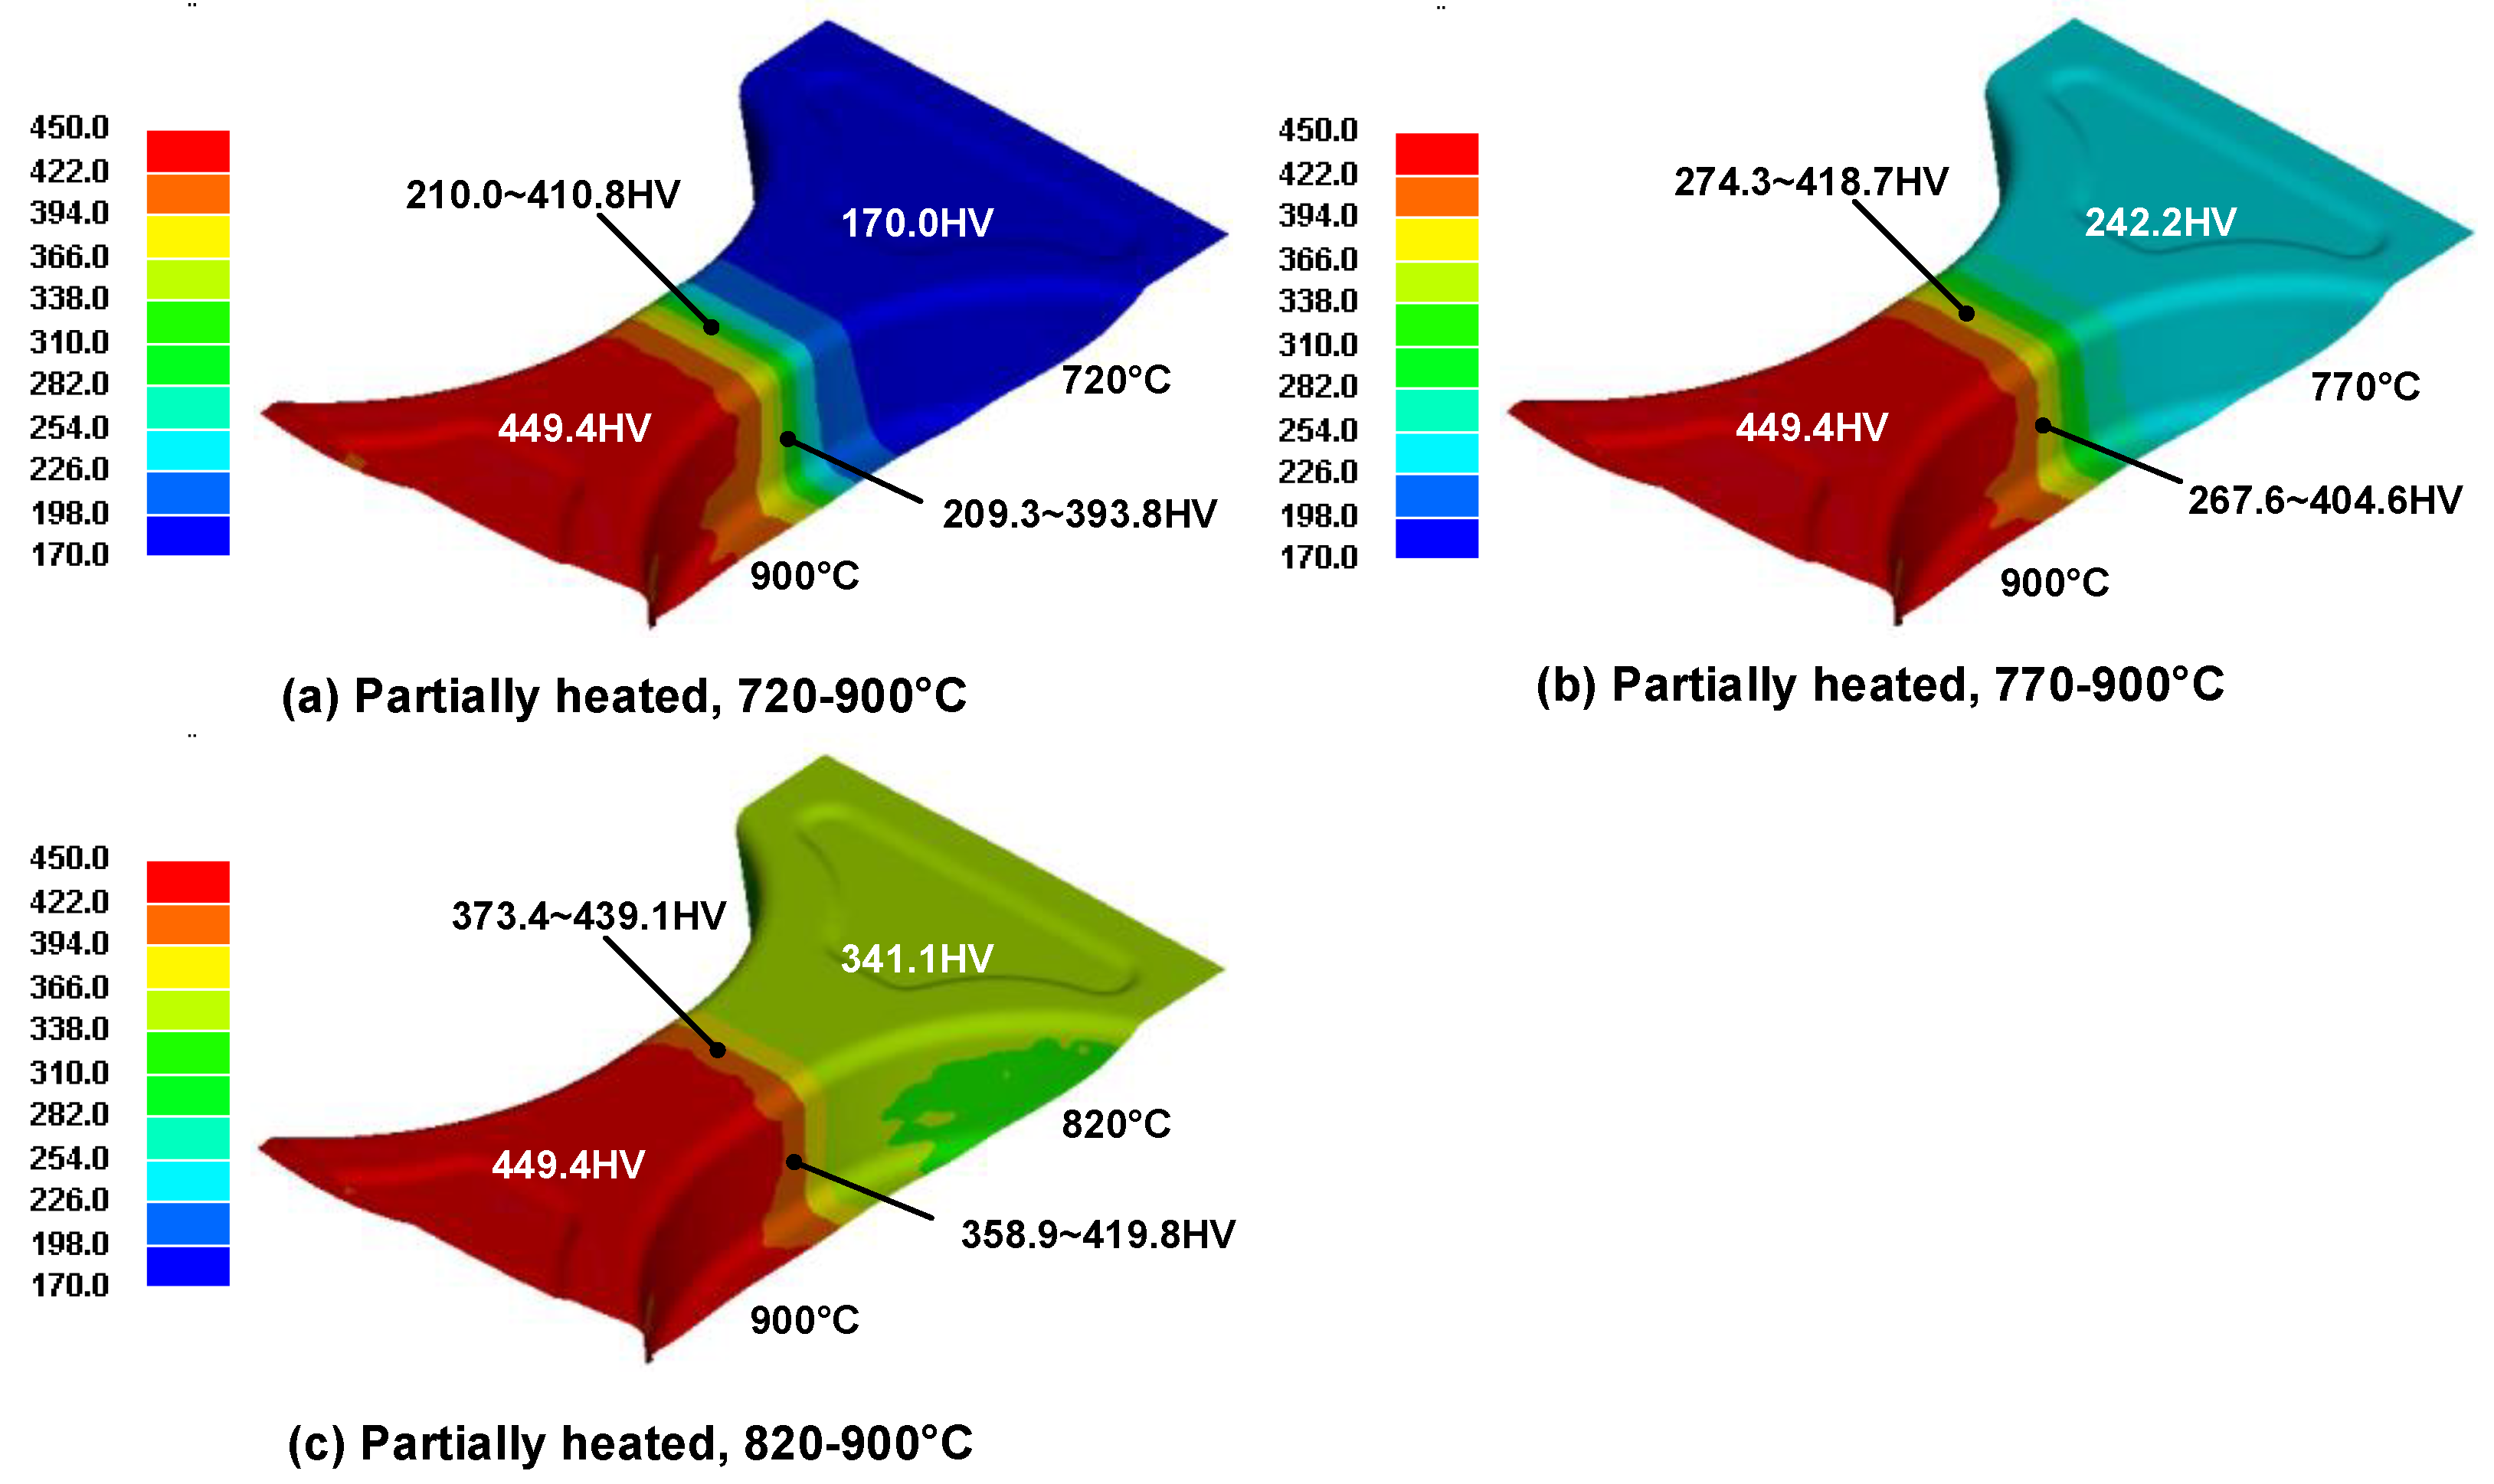
3.3. Prediction Results for Volume Fraction and Hardness

In the hot stamping process with local blank heating, the volume fraction of austenite according to the heating condition significantly affects the mechanical properties of the final products; thus, it should be accurately predicted. In this study, the heating temperature history was applied to the JMAK equation in order to predict the volume fraction of austenite according to the heating temperature.
Figure 8 shows the predicted volume fraction of austenite for the final product. In the high-strength region, the microstructure of the blank was mostly transformed from the mixed phase of ferrite and pearlite into austenite. In the low-strength region, the microstructure of the blank heated to 720 °C was not changed, whereas the volume fraction of austenite increased with the heating temperature at heating temperatures above 770 °C. In the transition zone of the blank, the volume fraction of austenite increased as the measuring point moved closer to the high-strength region; it was 18.9% to 86.0% for a heating temperature of 720 °C, 37.3% to 88.8% for a heating temperature of 770 °C, and 72.6% to 96.1% for a heating temperature of 820 °C.
In addition, the cooling history is a key parameter that influences the mechanical properties of the final product. In this study, the cooling temperature history was used in QFA in order to predict the hardness distribution of the parts, and the predicted volume fraction of austenite was considered for precise prediction.
Figure 9 shows the predicted hardness distribution for the final product. The average hardness in the high-strength region was 449.4 HV, which is similar to the value for the conventional hot stamped part, because most of the microstructure heated to 900 °C consisted of austenite and was transformed into martensite. The average hardness in the low-strength region for a heating temperature of 720 °C was 170.0 HV, which is similar to the value for the initial boron steel, and the hardness increased with the heating temperature at heating temperatures above 770 °C. The average hardness for heating temperatures of 770 and 820 °C was 242.2 HV and 341.1 HV, respectively. In the transition zone of the blank, the hardness increased as the measuring point moved closer to the high-strength region, in accordance with the prediction results for the volume fraction of austenite. In all areas of the hot-stamped part, the hardness was proportional to the volume fraction of austenite, except for the wall side of the part, because the cooling rate at the wall side decreased owing to the non-uniform contact between the tool and the blank.

4. Experimental Verification

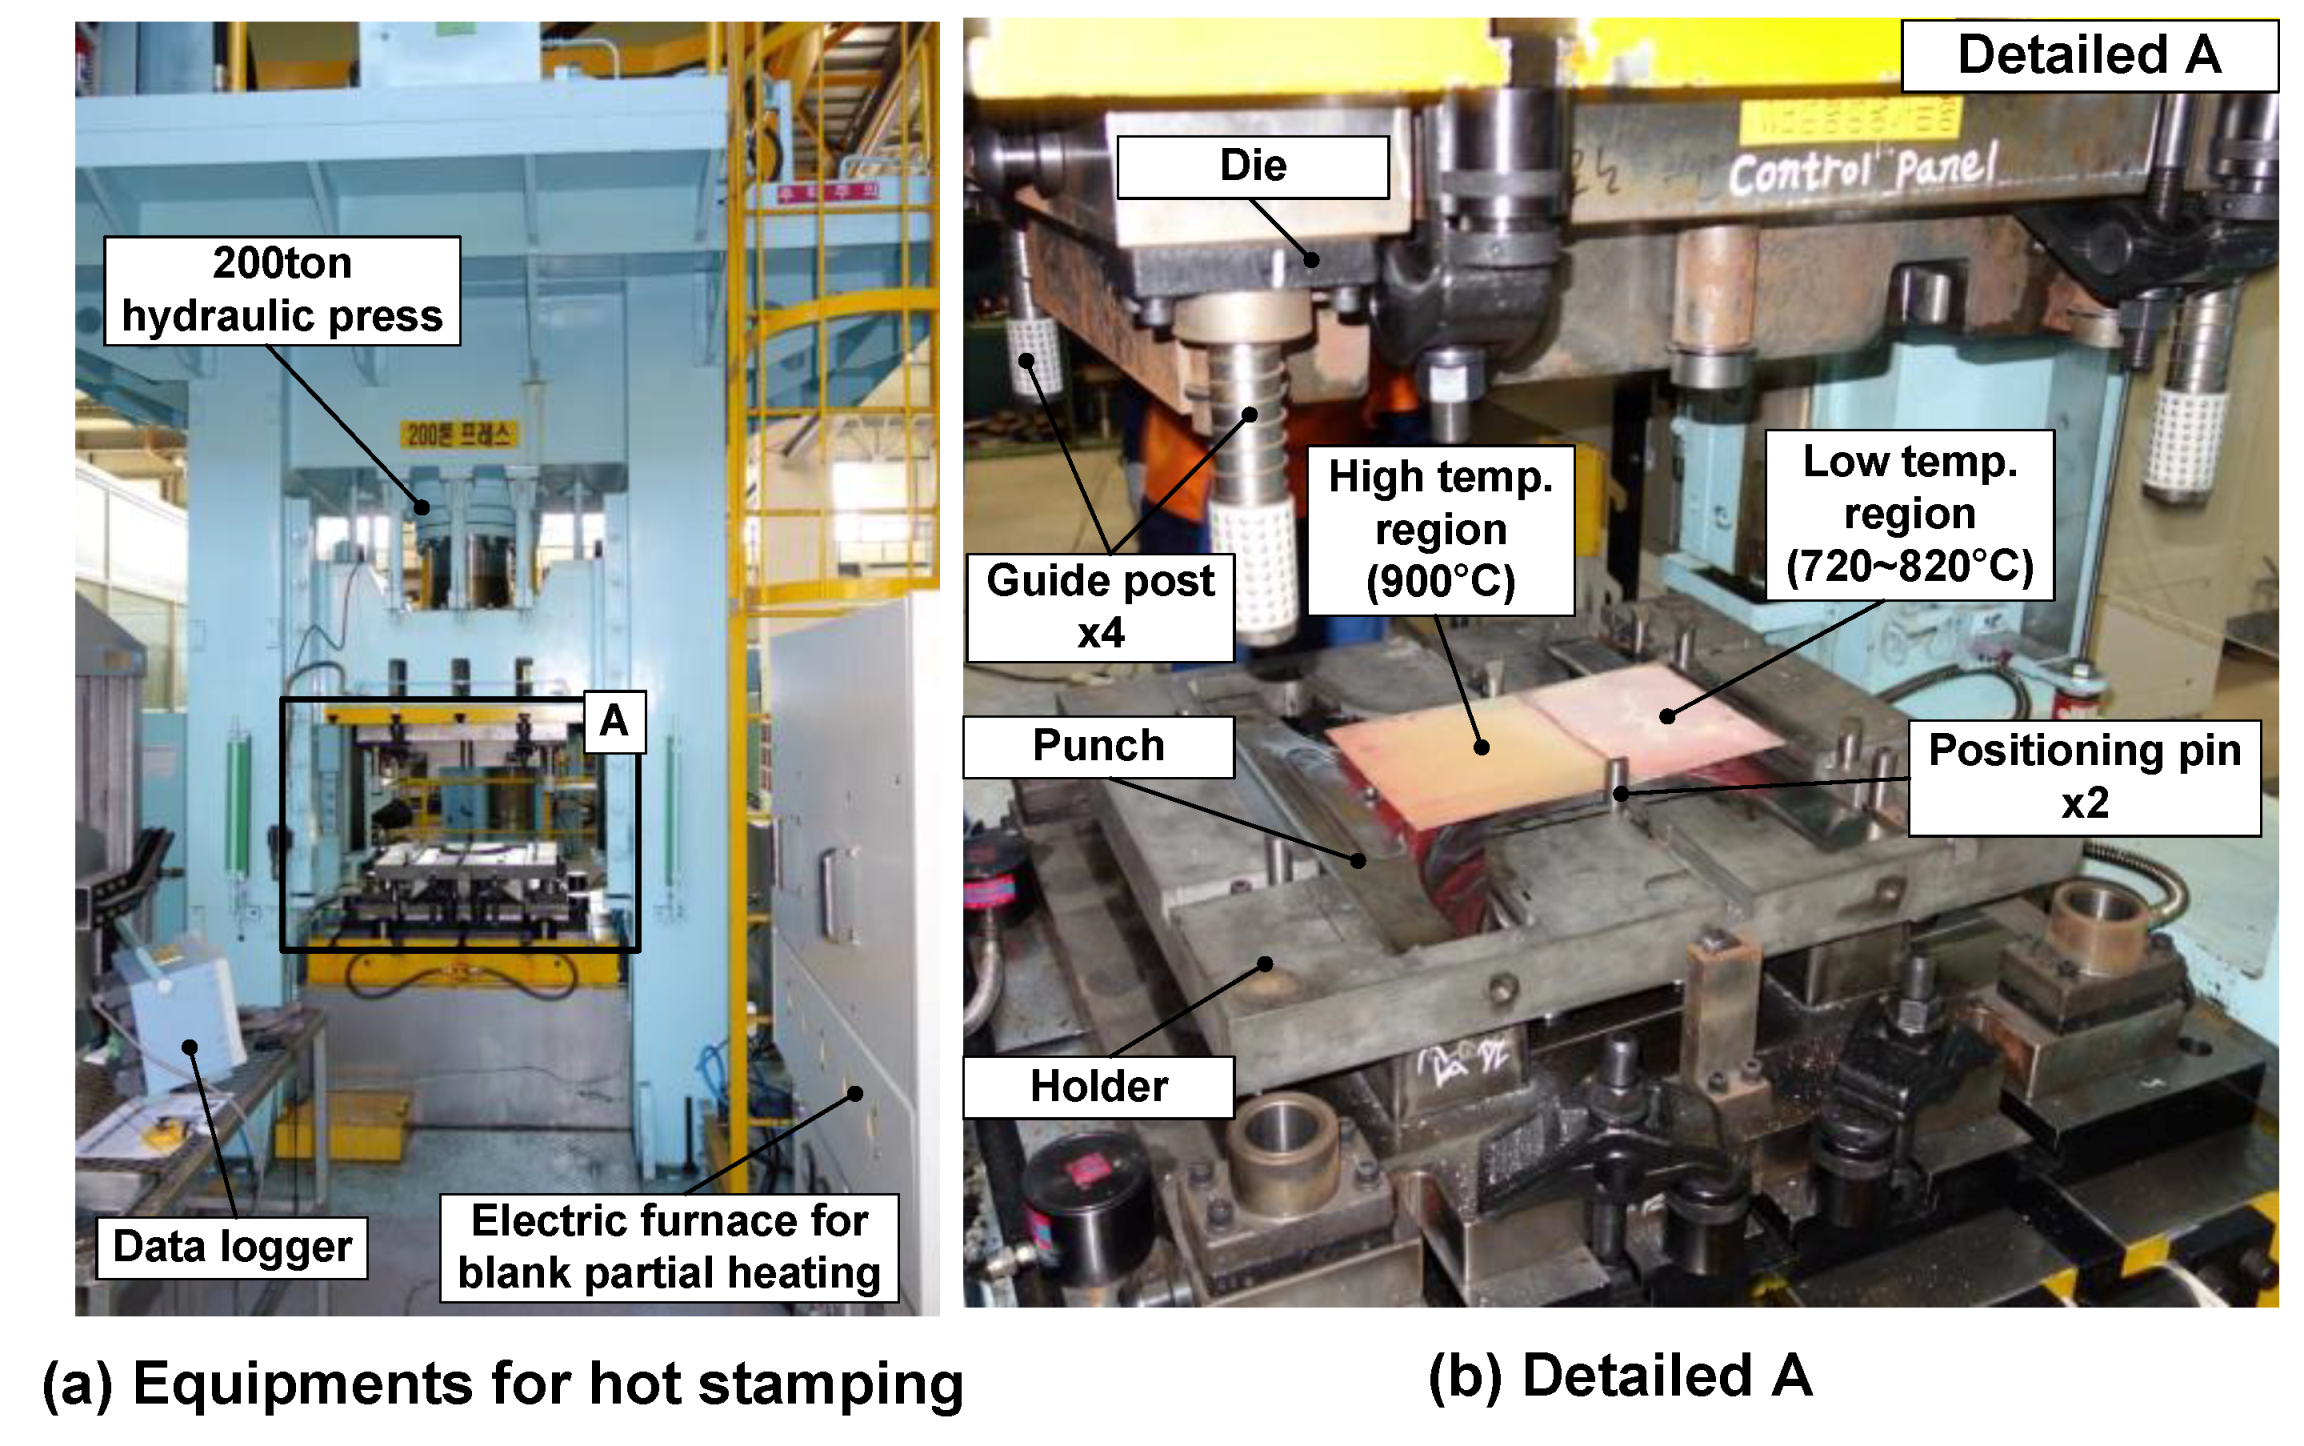
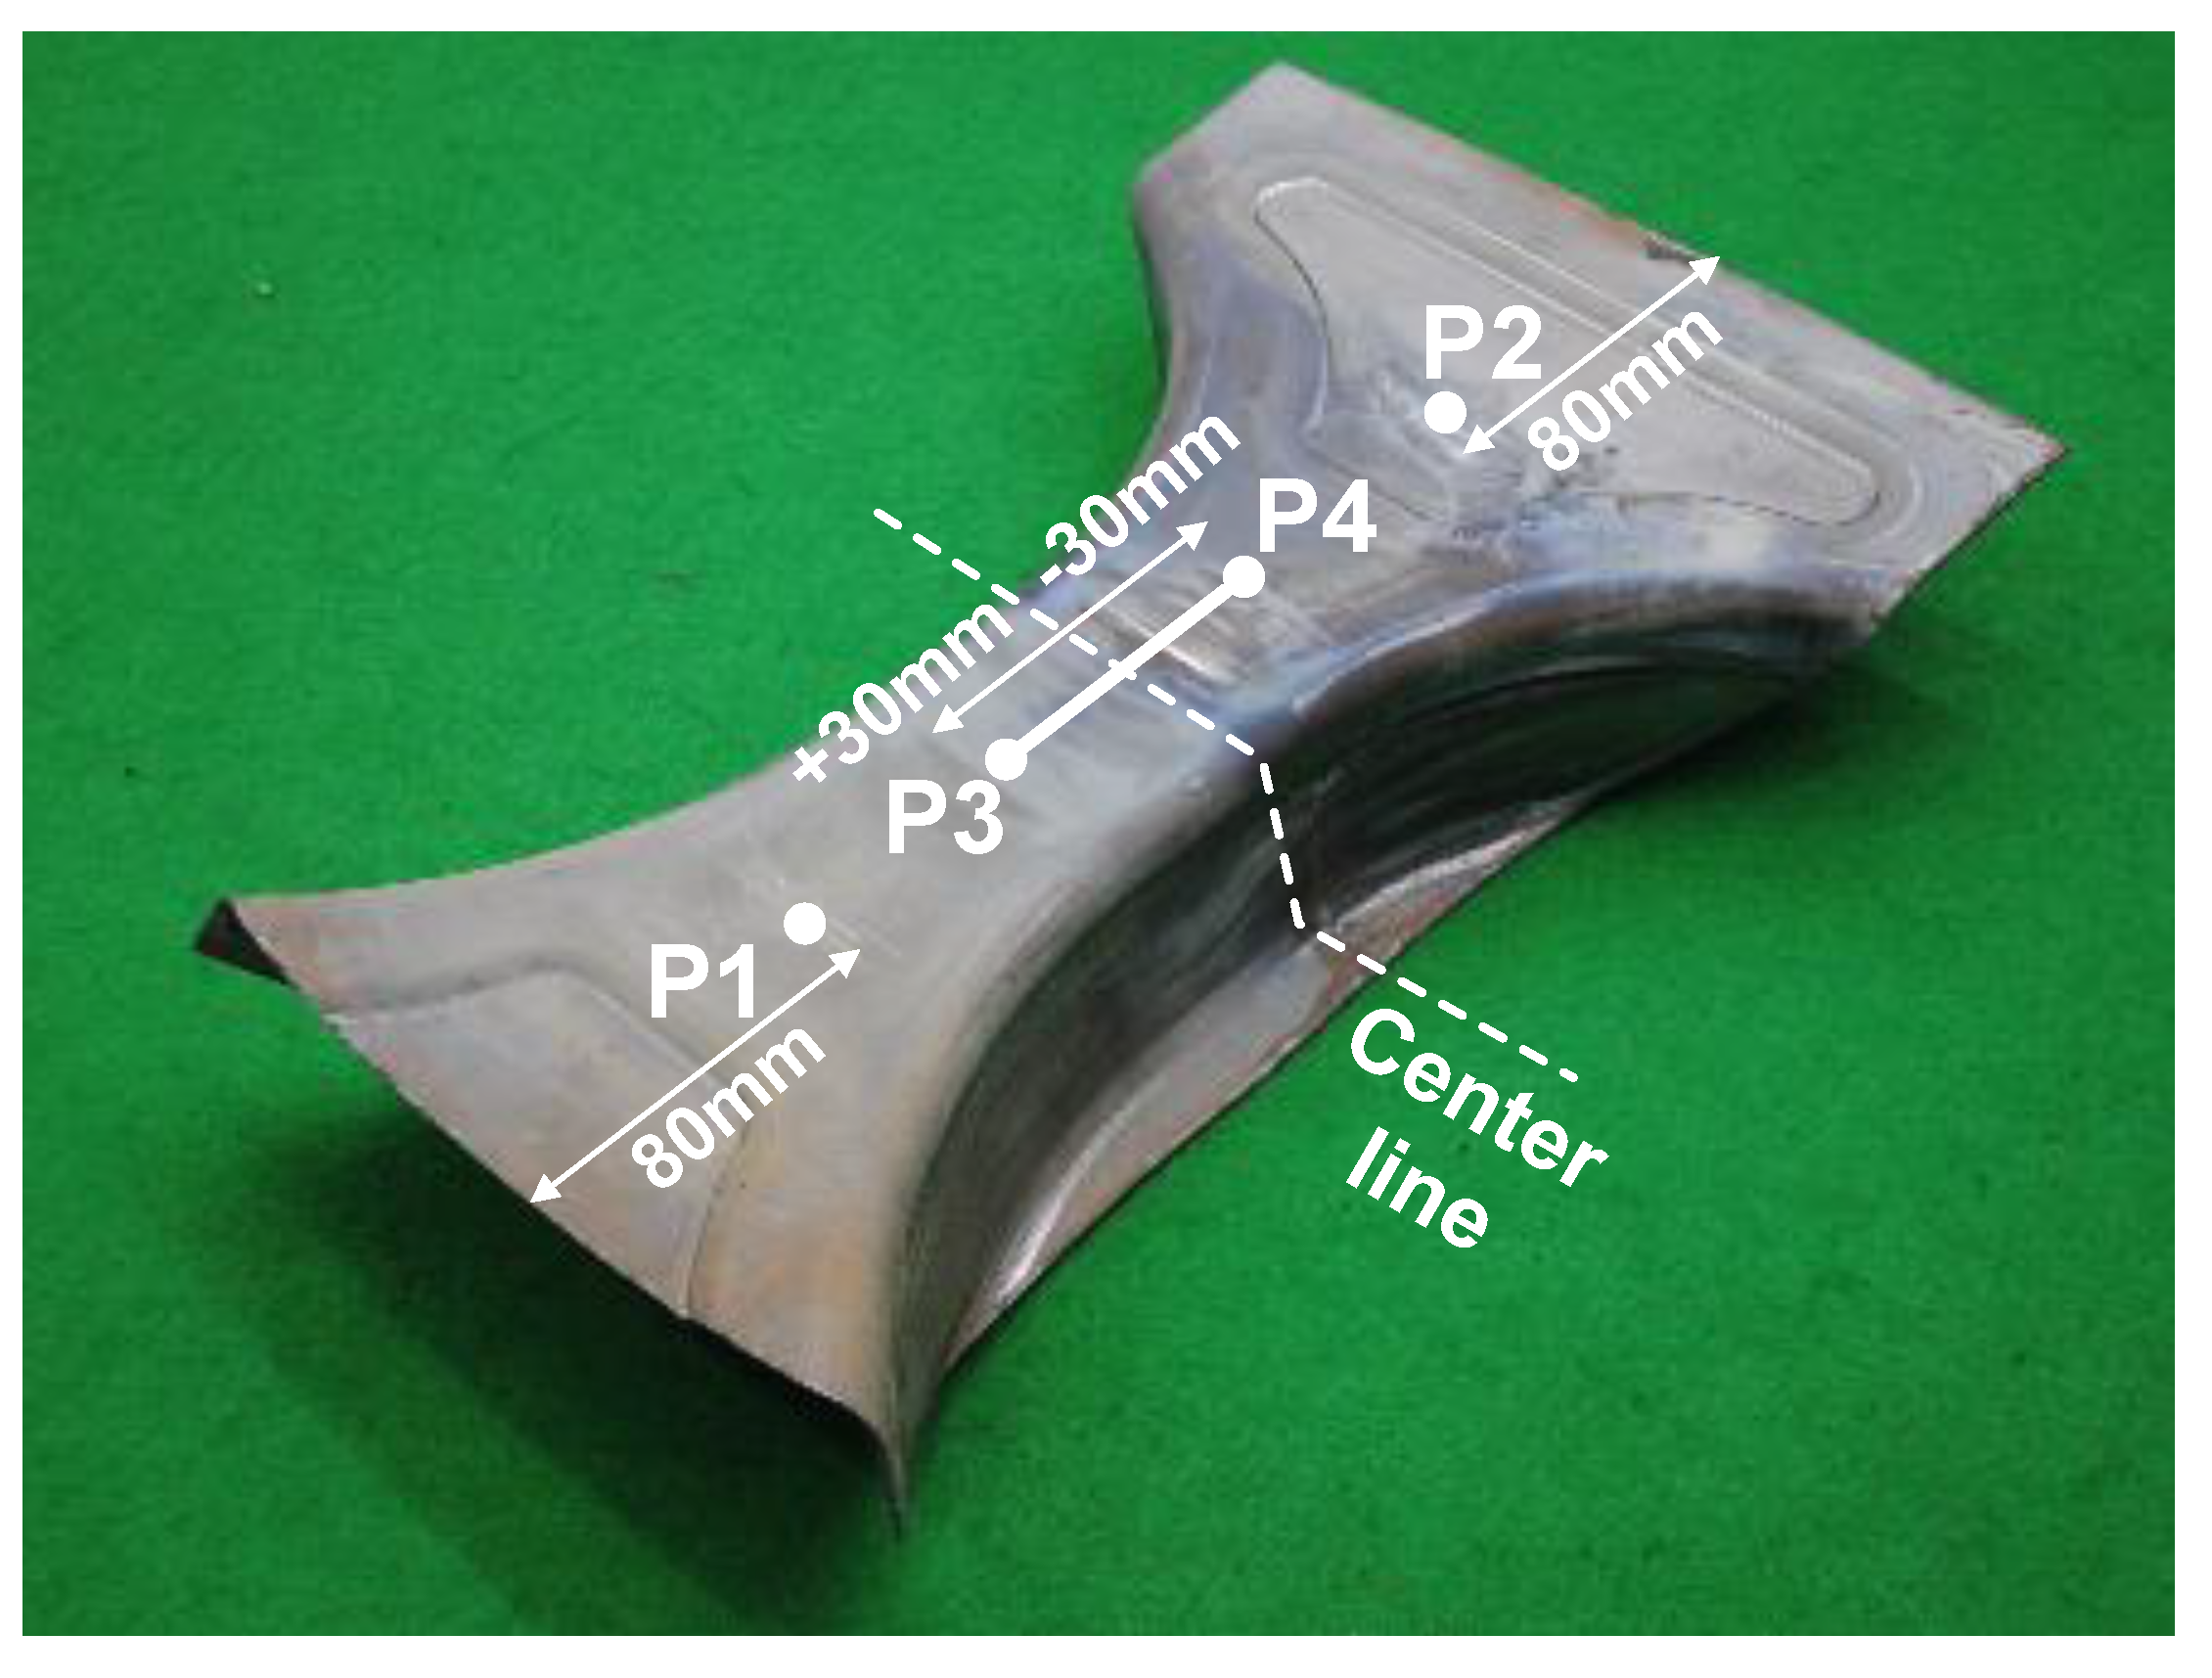
4.1. Conditions of Hot Stamping Experiment

In this study, an experiment involving hot stamping with local blank heating was performed to validate the suggested prediction method for the hardness and volume fraction of austenite. The equipment for the experiment consisted of a furnace for local blank heating, a tool for hot stamping, and a 200-ton hydraulic press, as shown in Figure 10a. The initial blank used in the experiment was rectangular and had dimensions of W200 mm × L360 mm × t1.5 mm. The blank was locally heated by an electric furnace under the same conditions used for the FE simulation and was manually transferred to the die within 10 s. The tools used for the hot-stamping experiment consisted of a punch, die, and holder, as shown in Figure 10b. Four guideposts were used to prevent mismatching between the punch and the die, and positioning pins were used for efficiently transferring the blank. After the transferring stage, the blank was formed by the punch within 3 s, after which it was quenched for 20 s.
In the hot stamping experiment, the temperature histories were measured using a K-type thermocouple and a data logger to confirm the reliability of the FE simulation. Volume-fraction and hardness measurements for the hot stamped part were also performed to validate the suggested prediction method using the JMAK equation and QFA. The volume fraction of a specimen etched using the LePera method was measured using an optical microscope and image analysis, and the hardness of the specimen was measured using an MXT‒Alpha microhardness tester with an indentation load of 500 g for a dwell time of 10 s. The temperature, volume fraction, and hardness were measured for the top side of the hot stamped part, as shown in Figure 11.

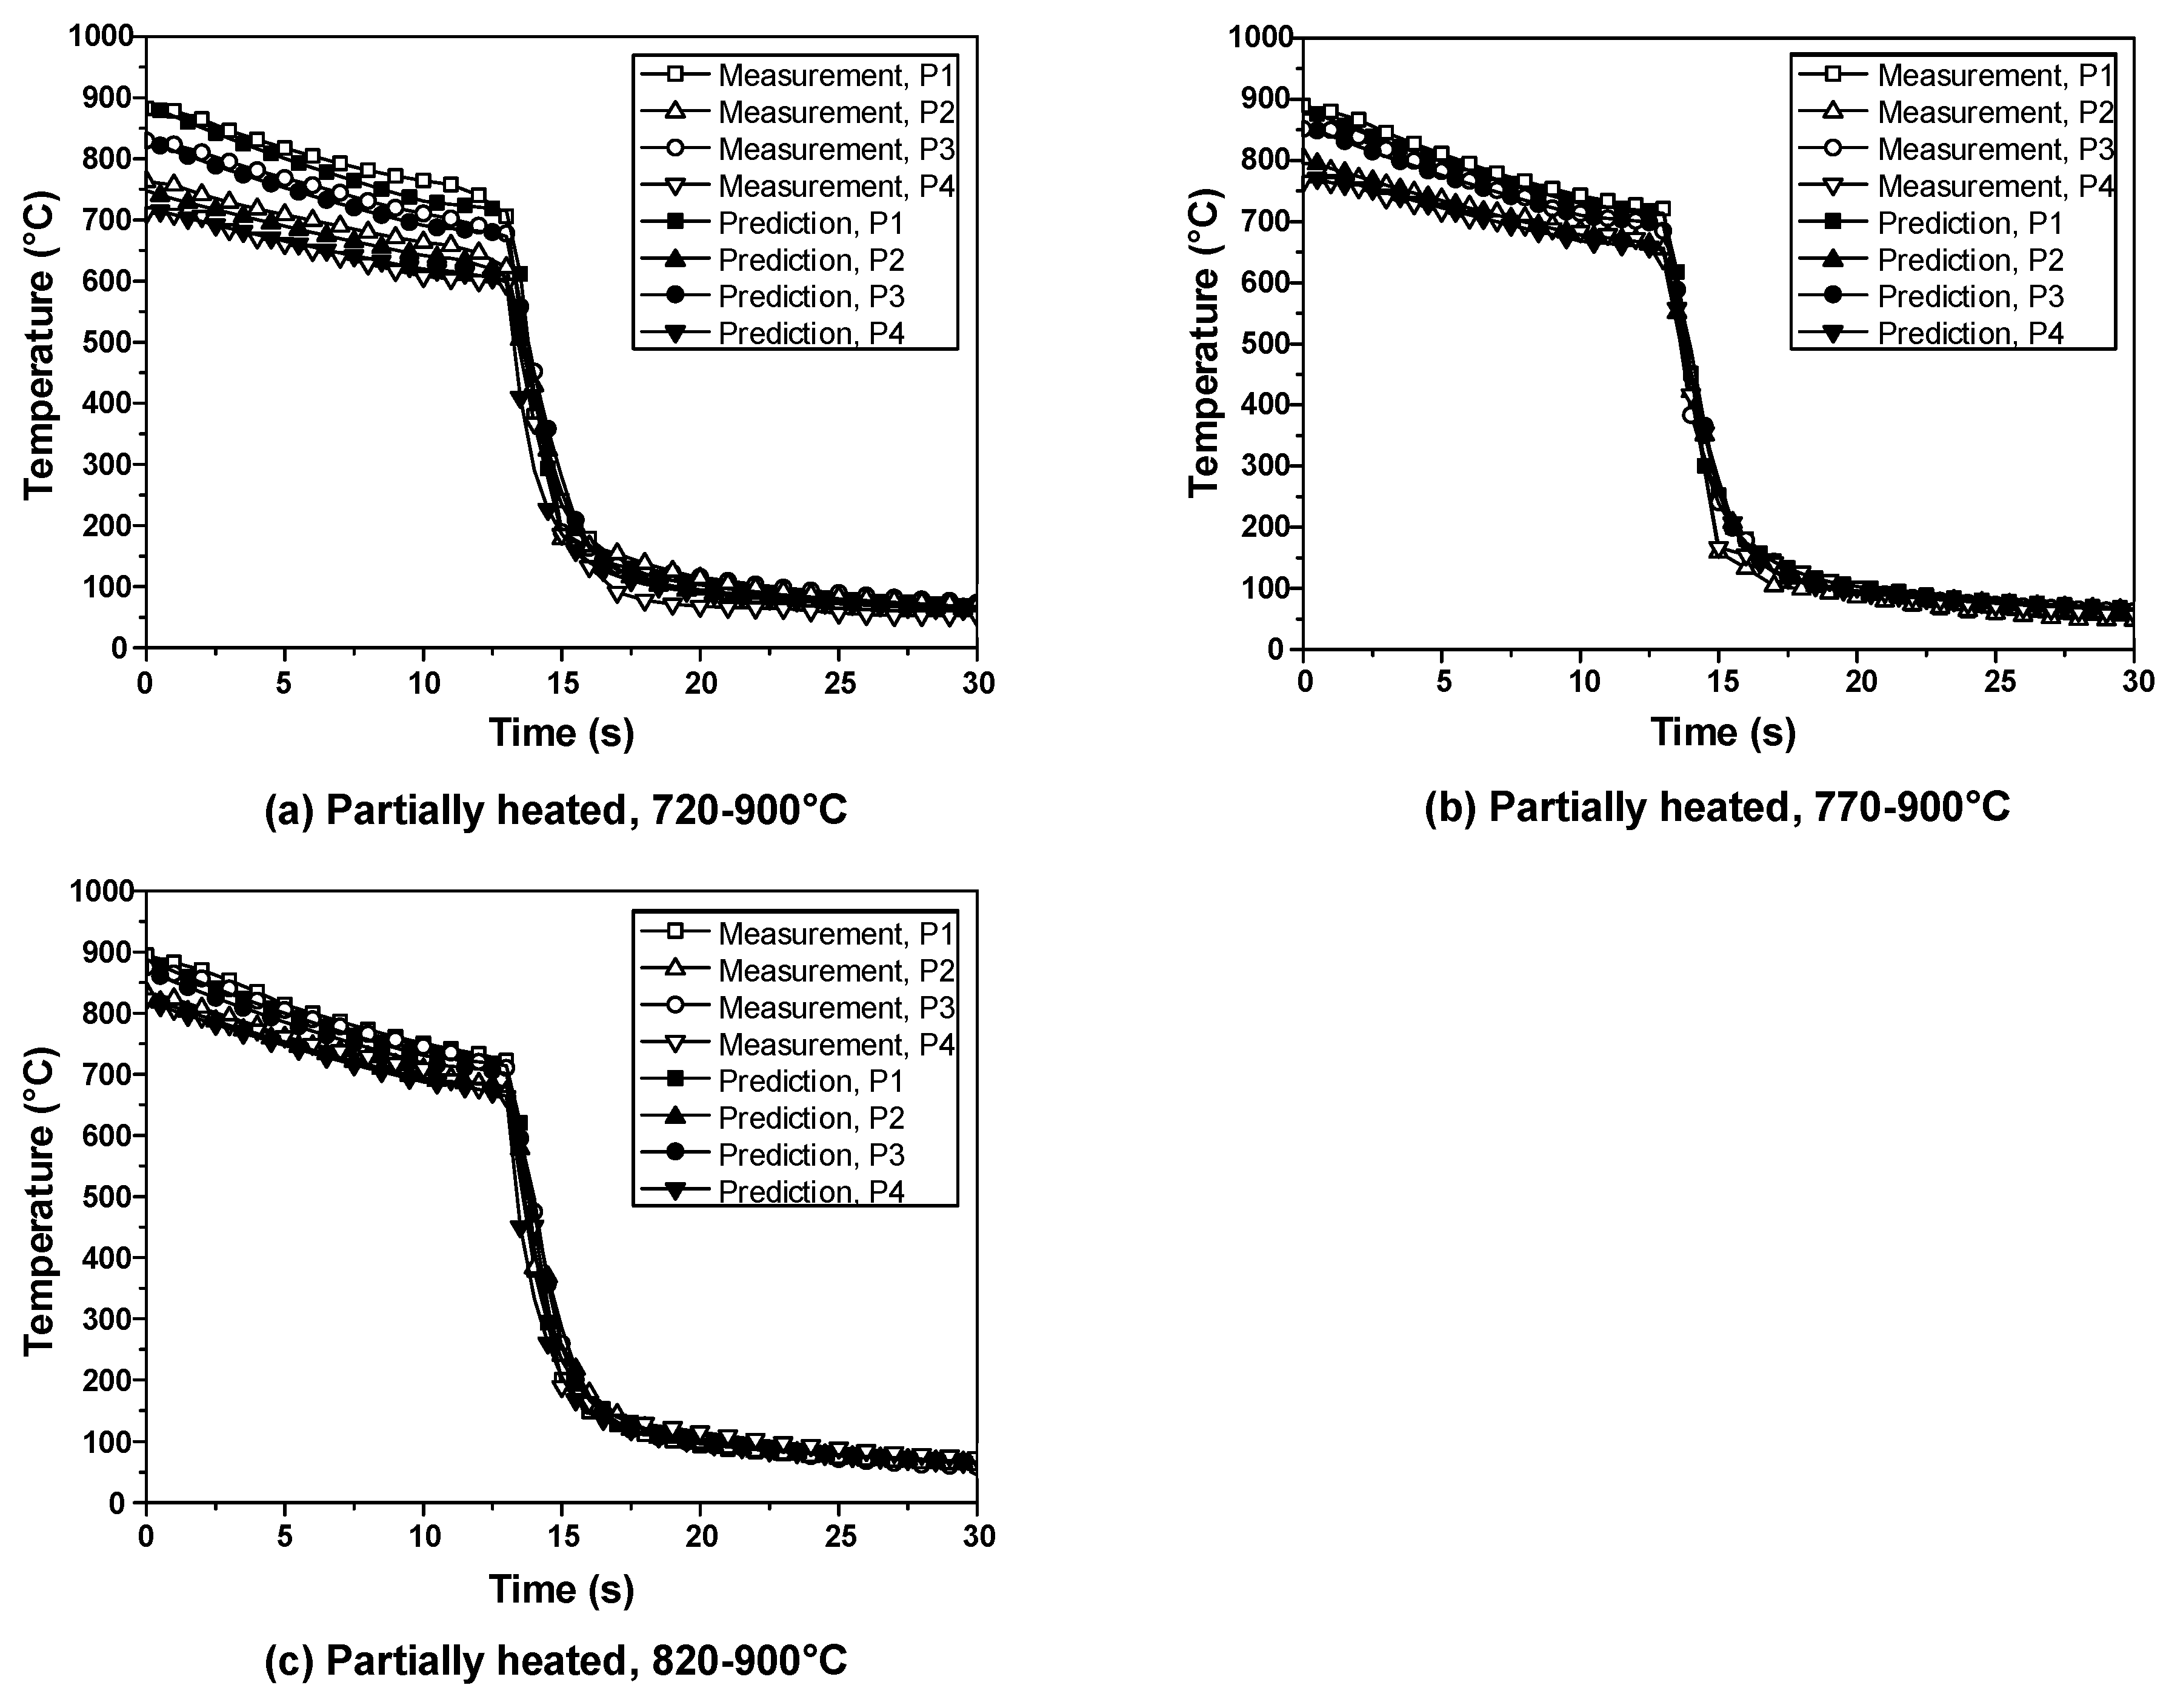
4.2. Experimental Results

Figure 12 shows the results of the FE simulation and experimental measurement for the temperature histories at the heating stage. In this study, the measurement interval for the temperature was 0.5 s. These results are similar to each other, confirming the reliability of the FE simulation for the heating stage. Figure 13 shows the results of the microstructure observation for the hot stamped parts. Martensite and a mixed phase of ferrite and pearlite were observed for the parts, because the austenite of the heated boron steel was transformed into martensite owing to the high cooling efficiency between the blank and the tools. For a heating temperature of 720 °C, most of the microstructure in the low-strength region comprised a mixed phase of ferrite because of the suppression of the austenite creation by the low heating temperature.
In all areas of the high-strength region, the volume fraction of martensite was 96.9%, owing to the short holding time at the heating stage. The volume fraction of martensite in the low-strength region increased from 1.2% to 67.2% as the heating temperature increased, and that in the transition zone increased as the measuring point moved closer to the high-strength region. The predicted volume fractions were compared with the experimental values, revealing good agreement, with an error rate of <4.52%, according to Equation (9).
E r r o r    r a t e ( % ) = X exp X JMAK X exp × 100
Figure 14 shows the results of the FE simulation and the experimental measurement for the temperature histories in the transferring, forming, and quenching stages. These results are similar to each other, confirming the reliability of the FE simulation for these stages. Figure 15 shows the results of the comparison of the hardness between the prediction and the measurement for the low- and high-strength regions. The hardness in the high-strength region was 446.7 HV, whereas that in the low-strength region increased from 170.0 HV to 340.4 HV as the heating temperature increased. Figure 16 shows the results of the comparison of the hardness between the prediction and the measurement for the transition zone. The prediction results exhibited good agreement with the experimentally measured ones, with an error rate of <9.62%. Therefore, the proposed prediction method is useful for hardness prediction and process design in the hot-stamping process involving local blank heating.

5. Conclusions

The hardness was predicted for the hot-stamping process involving local blank heating. A hardness prediction method considering the volume fraction of austenite and the cooling temperature histories, which were predicted using the JMAK equation and QFA, respectively, was proposed. The volume fraction of austenite was measured using heating and dilatometry tests, which were conducted with different cooling rates. The results were used to determine the material constants of the JMAK equation and QFA. According to the experimental and analytical results, the following conclusions can be drawn.
(1)
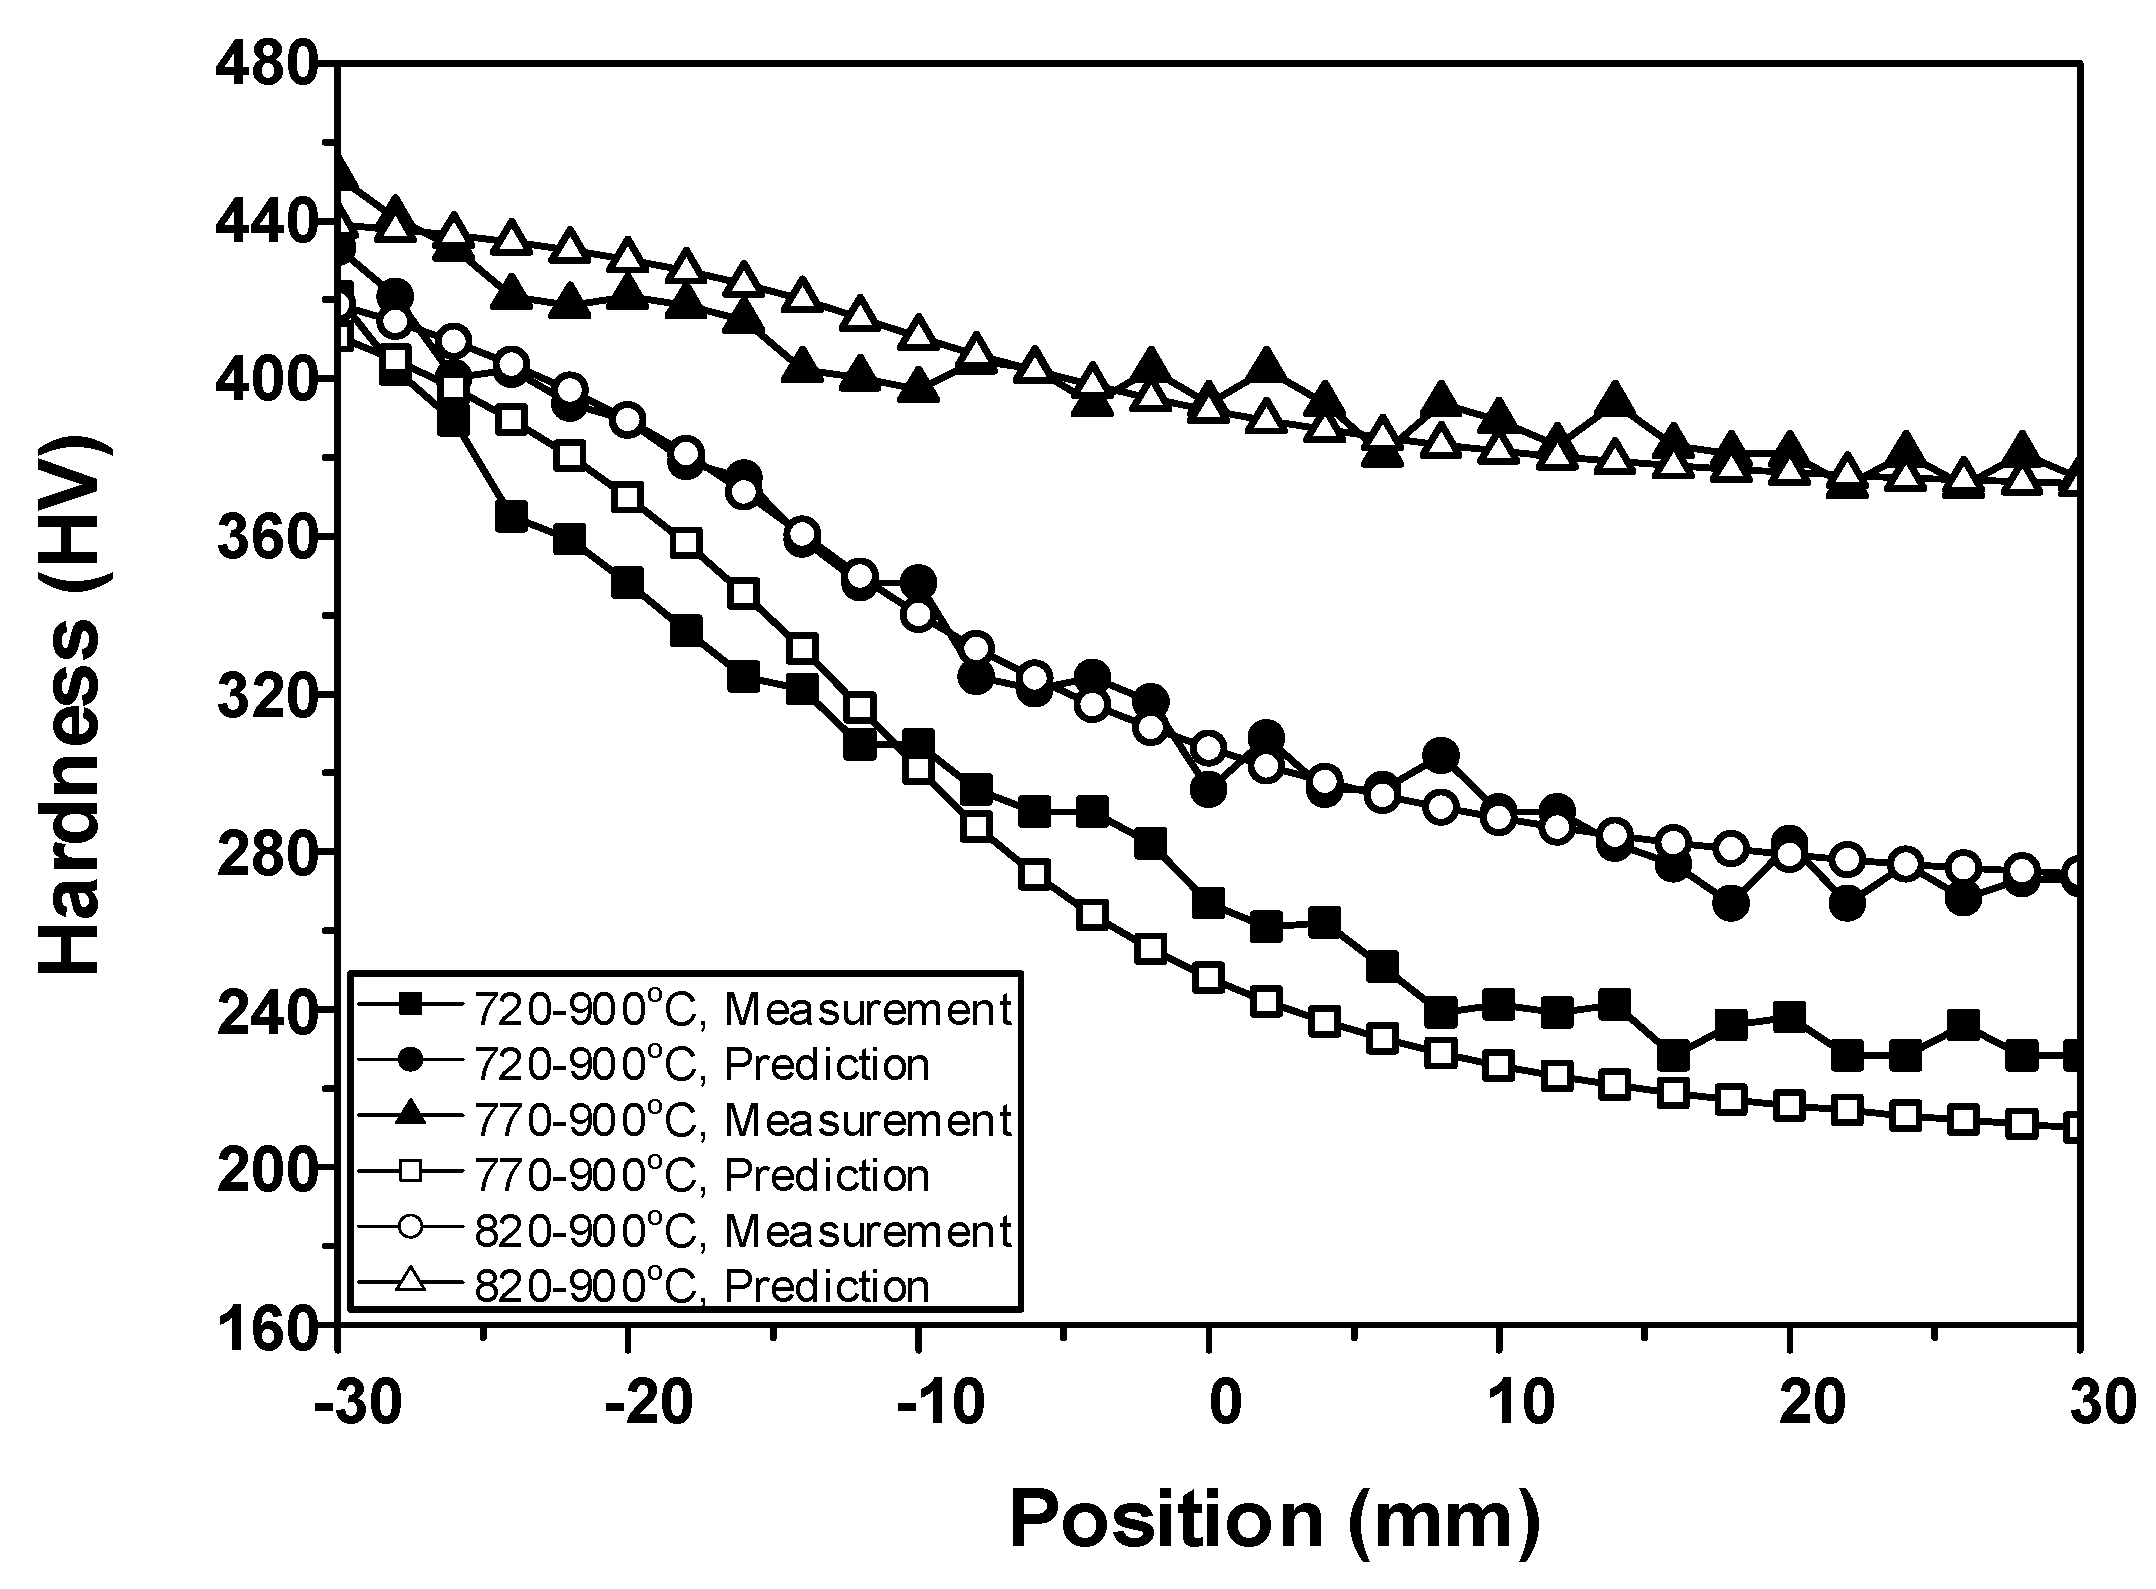
The hardness of the hot stamped part was predicted using the proposed method and FE simulation. The hardness of the low-strength part increased as the heating temperature increased, and the hardness in the transition zone increased as the measuring point moved closer to the high-strength region. In all areas of the hot stamped part, the hardness was proportional to the volume fraction of austenite.
(2)
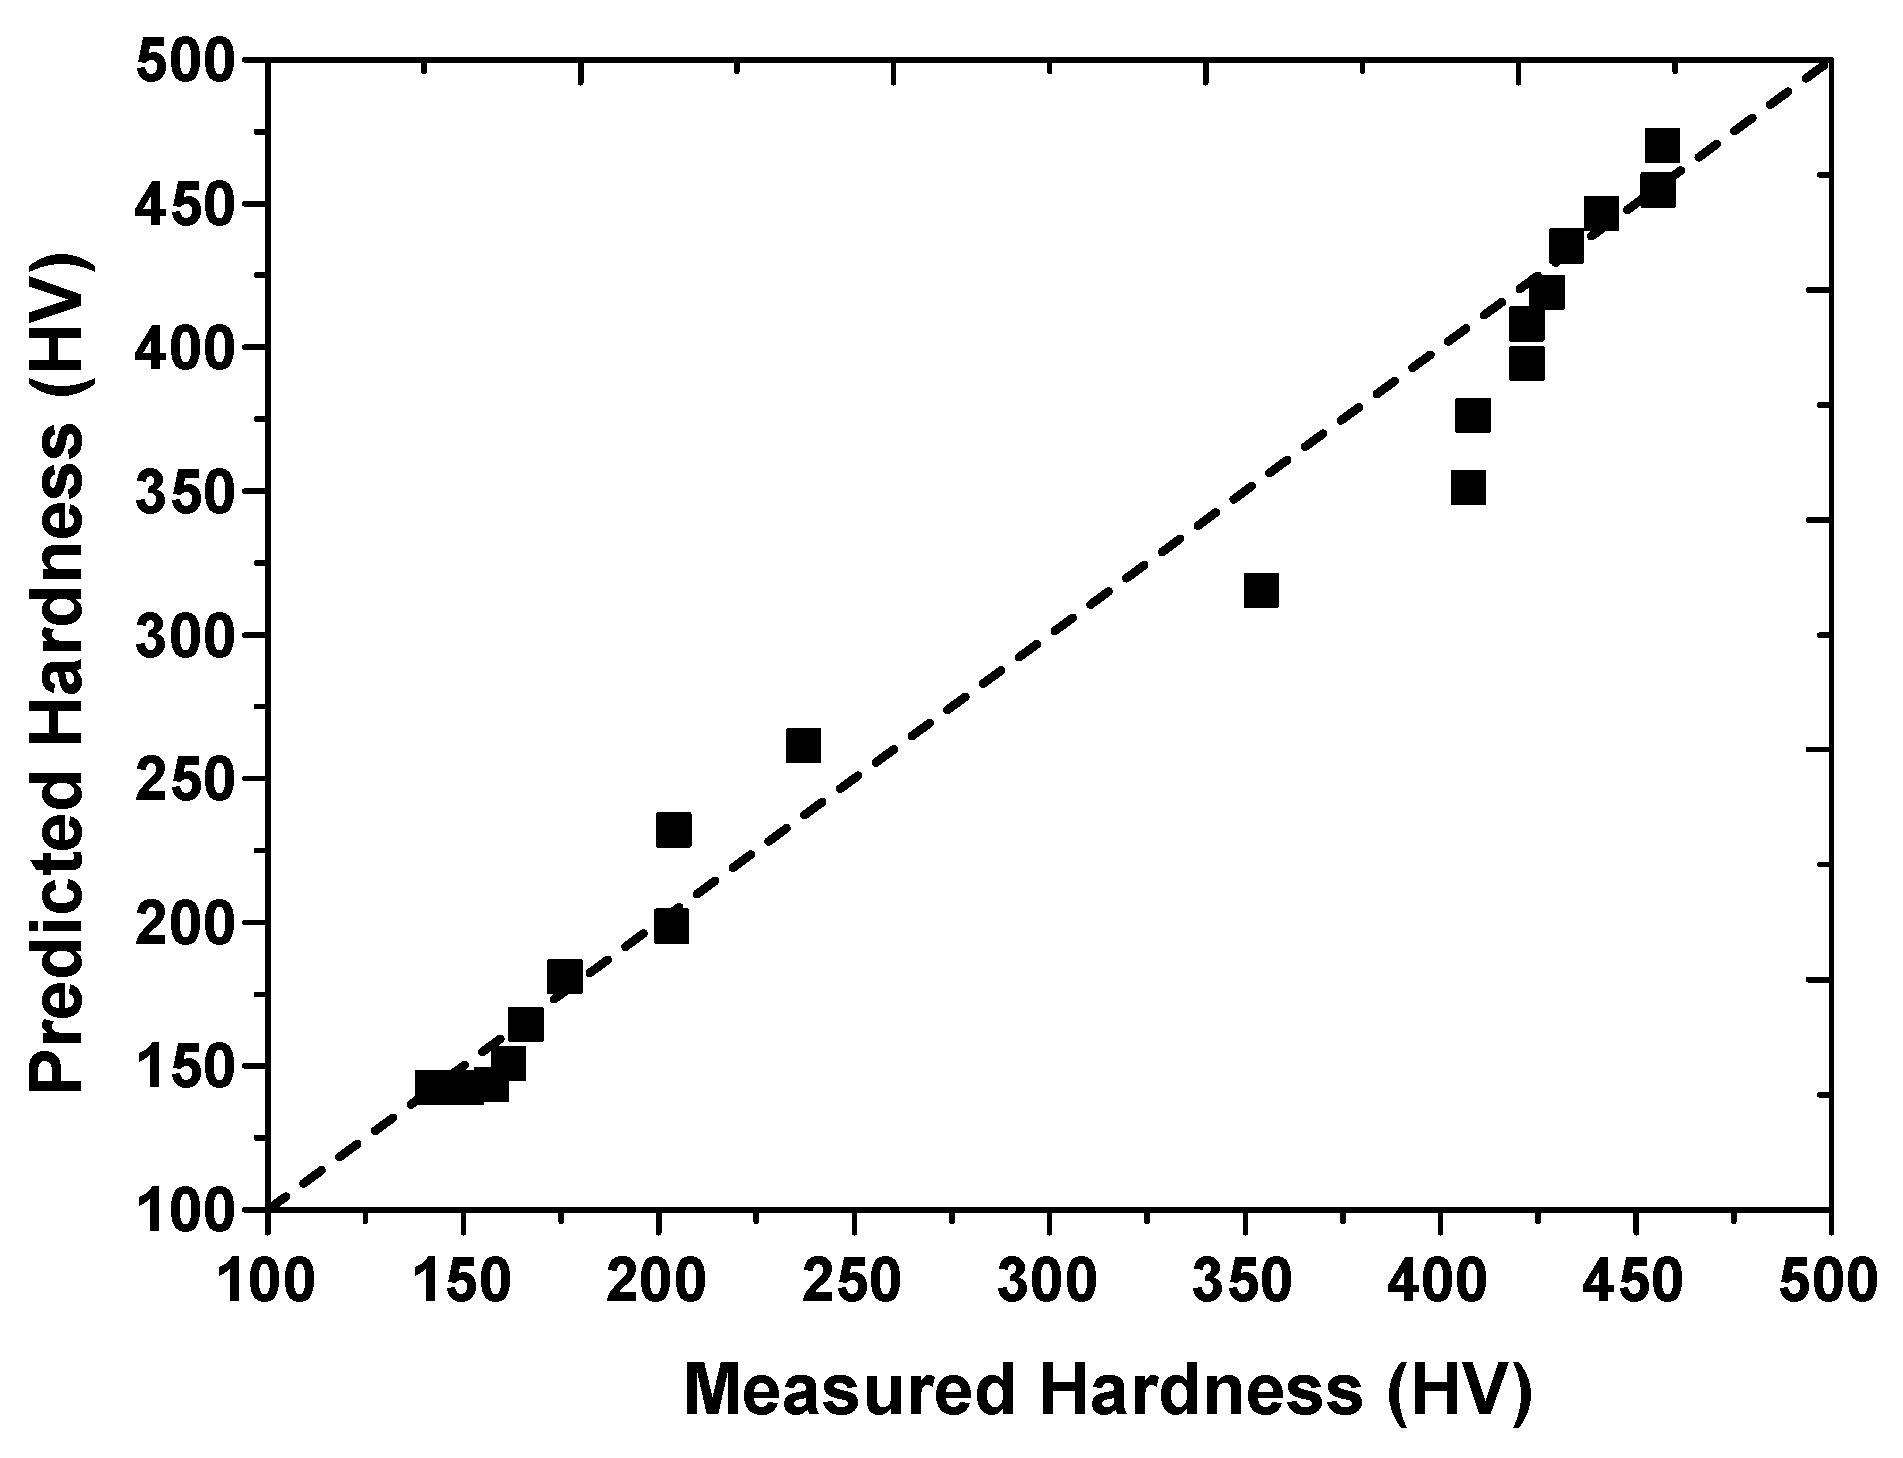
An experiment involving hot stamping with local blank heating was performed to validate the proposed prediction method for the hardness and the volume fraction of austenite. The predicted hardness was compared with the experimental value, revealing good agreement, with an error rate of <9.62%.
(3)
The proposed prediction method using the JMAK equation and QFA is effective for hardness prediction and process design in the hot stamping process involving local blank heating.

Author Contributions

J.-H.K. and B.-M.K. conceived and designed the experiments and FE simulation; D.-C.K. and S.-B.L. interpreted results; J.-H.K. wrote and revised the manuscript.

Funding

This research was funded by the National Research Foundation of Korea (NRF) grant number (No. 2012R1A5A1048294) and Small and Medium Business Administration of Korea (SMBA) grant number (No. S2522059).

Acknowledgments

This work was supported by the National Research Foundation of Korea (NRF) grant funded by the Korea government (MSIT) (No. 2012R1A5A1048294) and the Small and Medium Business Administration of Korea (SMBA) grant funded by the Korea government (MOTIE) (No. S2522059).

Conflicts of Interest

The authors declare no conflict of interest.

References

  1. Merklein, M.; Johannes, M.; Lechner, M.; Kuppert, A. A Review on Tailored Blanks-Production, Applications and Evaluation. J. Mater. Process. Technol. 2014, 214, 151–164. [Google Scholar] [CrossRef]
  2. Turetta, A.; Bruschi, S.; Ghiotti, A. Investigation of 22MnB5 Formability in Hot Stamping Operations. J. Mater. Process. Technol. 2006, 177, 396–400. [Google Scholar] [CrossRef]
  3. Karbasian, H.; Tekkaya, A.E. A Review on Hot Stamping. J. Mater. Process. Technol. 2010, 210, 2103–2118. [Google Scholar] [CrossRef]
  4. Abdulhay, B.; Bourouga, B.; Dessain, C. Experimental and Theoretical Study of Thermal Aspects of the Hot Stamping Process. Appl. Therm. Eng. 2011, 31, 674–685. [Google Scholar] [CrossRef]
  5. Merklein, M.; Svec, T. Hot Stamping: Manufacturing Functional Optimized Components. Prod. Eng. 2013, 7, 141–151. [Google Scholar] [CrossRef]
  6. Stöhr, T.; Lechler, J.; Merklein, M. Investigations on Different Strategies for Influencing the Microstructural Properties with Respect to Partial Hot Stamping. In Proceedings of the 2nd International Conference on Hot Sheet Metal Forming of High Performance Steels, Luleå, Sweden, 15–17 June 2009; pp. 273–281. [Google Scholar]
  7. Li, M.V.; Neibuhr, D.V.; Meekisho, L.L.; Atteridge, D.G. A Computational Model for the Prediction of Steel Hardenability. Metall. Mater. Trans. B 1998, 29, 661–672. [Google Scholar] [CrossRef]
  8. Åkerström, P.; Oldenburg, M. Austenite decomposition during Press Hardening of a Boron Steel—Computer Simulation and Test. J. Mater. Process. Technol. 2006, 174, 399–406. [Google Scholar] [CrossRef]
  9. George, R.; Bardelcik, A.; Worswick, M.J. Hot Forming of Boron Steels Using Heated and Cooled Tooling for Tailored Properties. J. Mater. Process. Technol. 2012, 212, 2386–2399. [Google Scholar] [CrossRef]
  10. Tang, B.T.; Bruschi, S.; Ghiotti, A.; Bariani, P.F. Numerical Modelling of the Tailored Tempering Process Applied to 22MnB5 Sheets. Finite Elem. Anal. Des. 2014, 81, 69–81. [Google Scholar] [CrossRef]
  11. Hippchen, P.; Lipp, A.; Grass, H.; Craighero, P.; Fleischer, M.; Merklein, M. Modelling kinetics of phase transformation for the indirect hot stamping process to focus on car body parts with tailored properties. J. Mater. Process. Technol. 2016, 228, 59–67. [Google Scholar] [CrossRef]
  12. Wilsius, J.; Tavernier, B.; Abou-Khalil, D. Experimental and Numerical Investigation of Various Hot Stamped B-pillar Concepts Based on Usibor® 1500P. In Proceedings of the 3rd International Conference on Hot Sheet Metal Forming of High Performance Steels, Kassel, Germany, 13–17 June 2011; pp. 427–435. [Google Scholar]
  13. Yazdi, A.Z.; Sajjadi, S.A.; Zebarjad, S.M.; Nezhad, S.M.M. Prediction of Hardness at Different Points of Jominy Specimen Using Quench Factor Analysis Method. J. Mater. Process. Technol. 2008, 199, 124–129. [Google Scholar] [CrossRef]
  14. Shapiro, A.B. Using LS-Dyna for Hot Stamping. In Proceedings of the 7th European LS-Dyna Conference, Salzburg, Austria, 14–15 May 2009. [Google Scholar]
  15. Geiger, M.; Merklein, M.; Lechler, J. Determination of Tribological Conditions within Hot Stamping. Prod. Eng. 2008, 2, 269–276. [Google Scholar] [CrossRef]
Figure 1. Measured volume fraction of austenite according to the heating temperature and time.
Metals 09 00029 g001
Figure 2. Comparison of the austenite fraction between the measurement and prediction.
Metals 09 00029 g002
Figure 3. Measured hardness data for various cooling rates obtained using the dilatometer test.
Metals 09 00029 g003
Figure 4. Comparison of hardness between measurement and prediction on the dilatometer test.
Metals 09 00029 g004
Figure 5. Flow chart for the prediction of the hardness coupled with finite-element (FE)-simulation.
Metals 09 00029 g005
Figure 6. FE-simulation model for hot stamping of the lab-scale center pillar.
Metals 09 00029 g006
Figure 7. Strain–stress curves at the quasi-static state for boron steel.
Metals 09 00029 g007
Figure 8. Predicted fraction of austenite according to the heating temperature.
Metals 09 00029 g008
Figure 9. Predicted hardness distribution of the lab-scale center pillar.
Metals 09 00029 g009
Figure 10. Experimental setup for hot stamping using local blank heating.
Metals 09 00029 g010
Figure 11. Measurement points for verification of the suggested prediction model.
Metals 09 00029 g011
Figure 12. Comparison of the heating histories between the measurement and prediction.
Metals 09 00029 g012
Figure 13. Measurement results for the volume fraction.
Metals 09 00029 g013
Figure 14. Comparison of the cooling histories between the measurement and prediction.
Metals 09 00029 g014
Figure 15. Comparison of the hardness between the measurement and prediction for the low- and high-strength regions.
Metals 09 00029 g015
Figure 16. Comparison of the hardness between the measurement and prediction for the transition zone.
Metals 09 00029 g016
Table 1. Chemical composition of boron steel used in this study.
MaterialChemical Compositions (wt.%)
Boron SteelCSiMnCrAlTiBFe
0.2200.2601.1800.1480.0570.0280.003Bal.
Table 2. Material constants of boron steel in the Johnson–Mehl–Avrami–Kolmogorov (JMAK) equation.
nAE (J/mol)
0.582.19 × 108202.47 × 103
Table 3. Material constants of boron steel in the quench factor analysis (QFA).
K1K2K3 (J/mol)K4 (K)K5 (J/mol)Pmax (HV)Pmin (HV)Pi (HV)
−0.005010.0494331.32117340000509142170
Table 4. Material constants of boron steel in the Cowper–Symonds model.
Material ConstantsTemperature (°C)
850700550
C55.3865.2680.54
p3.73.843.89
Table 5. Material constants of boron steel in the FE-simulation.
ConditionsValues
Young’s modulus (GPa)As a function of pressure [3]
Poisson’s ratio0.3
Thermal expansion (1/K)1.44 × 10−5
Heat conductivity (W/m·K)32
Convective heat transfer coefficient (W/m2·K)20
Interfacial heat transfer coefficient (W/m2·K)As a function of pressure [3]
Friction coefficient (μ)0.4 [15]

