Article

Large Eddy Simulation of Multi-Phase Flow and Slag Entrapment in a Continuous Casting Mold

1
School of Metallurgy, Northeastern University, Wenhua Road, Heping District, Shenyang 110819, China
2
Department of Mechanical and Power Engineering, Yingkou Institute of Technology, No. 46, Bowen Road, Xishi District, Yingkou 115014, China
3
Department of Steelmaking, Shougang Jingtang United Iron and Steel Co., Ltd., Tangshan 063200, China
*
Author to whom correspondence should be addressed.
Metals 2019, 9(1), 7; https://doi.org/10.3390/met9010007
Submission received: 18 November 2018 / Revised: 15 December 2018 / Accepted: 17 December 2018 / Published: 21 December 2018

Abstract

:
A transient, three-dimensional mathematical model has been developed to study the slag entrapment in a continuous casting mold. The unsteady turbulent flow is computed using the large eddy simulation (LES). The sub-grid scale structure is modeled by the Smagorinsky–Lilly model. The movements of discrete bubbles, as well as three continuous phases (air–slag–steel), are described by solving the coupled discrete particle model and volume of fraction (DPM+VOF) approach. The bubble transport inside different phases (steel and slag) and the escape near the air–slag interface are well studied. Good agreement is obtained by comparing with the plant observation of the slag eyes on the top surface of the mold. Three main mechanisms of slag entrapment are identified; vortex formation, shear-layer instability, and meniscus fluctuation. Four stages are observed for a slag entrapment: deformation, necking, breaking, and dragging in the mold. The model is helpful for understanding the formation of slag entrapment during continuous casting.

1. Introduction

Mold slag entrapment is characterized by mold powder being drawn into the molten steel pool inside a continuous casting mold [1]. Mold slag entrapment can cause both surface and internal defects in the final roll product and greatly affect the mechanical properties of steel. Thus, the slags must be seriously controlled in the continuous casting process.
In past decades, many researchers have focused on the reduction of slag entrapment, resulting in some proposed formation mechanisms. Generally, the mechanisms of slag entrapment can be classified into nine categories [2,3,4]; top surface-level fluctuations, meniscus freezing, vortexing, shear-layer instability, narrow face spout impingement upon the top surface, argon bubble interactions, slag crawling down the submerged entry nozzle (SEN), instability of the top surface standing wave, and top-surface balding. In tandem, Zheng and Zhu [5] found three mechanisms of slag entrapment caused by the shear stress, vortex, and a special mixture of “shear stress and vortex”. No matter which mechanism occurs, the slag-source inclusions are likely to be entrapped into the solidified shell [6], downgrading the quality of the final product. Therefore, the process of slag entrapment should be well controlled. However, due to technical limits, the formation of slag drop and its entrapment into the molten steel is still not fully modeled.
To study the slag entrapment in detail, many transparent physical models were established to visualize the turbulent behavior of the slag layer, usually employing water and silicon oil as surrogate fluids for the molten steel and slag. Among these studies, Savolainen et al. [7] studied the slag properties’ influence on the formation of slag drop and size distribution. Iguchi et al. [8] developed laboratory tests to study the length of the wave caused by shear flow instability at the silicone oil/salt water interface. Hagemann et al. [9], as well as Scheller and Hagemann [10], mentioned the view of finger-like protrusions of liquid oil into water before an oil drop forms. Yoshida et al. [11] presented the unsteady mold slag entrapment caused by a pressure difference in the longitudinal direction of the submerged entry nozzle. Similarly, Kasai and Iguchi [12] also observed oil droplet entrapment near SEN; however, this was caused by vortex formation. Recently, Bielnicki and Jowsa [13] compared the existence of slag powder’s effect on the slag entrapment, showing that the presence of mold powder influenced the critical casting speed. All these works are beneficial for understanding the slag entrapment in steel. However, due to practical limits, some similarity criteria such as Weber number, Prandtle number, and Grashof number etc., are unable to simultaneously meet in the lab vessel, resulting in some of the essential details in the casting mold being overlooked.
In addition, numerical studies are conducted to reproduce additional details for the experiment model. Saeedipour et al. [14] developed a large eddy simulation (LES) model to investigate the phase interactions between air, slag, and liquid steel. Chaudhary et. al [15] developed a model to study the turbulent behavior under the effect of an electromagnetic brake (EMBr); In a series of works by Liu et al. [16,17,18,19], LES models for two-phase (molten steel and argon gas), three-phase (air, slag, and molten steel), and even quasi-four phase (air, slag, molten steel, and discrete particles) flow are successfully founded for predicting the turbulent flow and naked steel in the mold. Recently, the transient free-surface behavior in a model mold was studied by Asad et al. [20] using a RANS-VOF approach. In this work, the impact of inlet velocity and nozzle depth on the free-surface behavior and flow pattern was investigated, and different flow regimes in the mold were observed. All these works are helpful for understanding the interface flow in slag. However, these models still face difficulties when predicting the detailed formation of slag droplets and their separation from the slag–metal interface. Additionally, the understanding with regard to the movements of injection bubbles, as well as their relationship with slag entrapment, still remains to be improved. A comprehensive model to describe the bubbly multi-phase flow inside the continuous casting mold is still needed.
In this work, the process of slag entrapment is identified and discussed in detail. The main innovations of our work consist of three parts: (1) to build a mathematical model to study the three-phase (air–slag–metal) flow under the effect of injection bubbles; (2) to predict the formation of slag droplets and the mechanisms of slag entrapment when injecting bubbles; (3) to study the bubbles’ effect on the deformation of two interfaces (air–slag interface and slag–metal interface). The results are helpful for understanding the slag entrapment during the slab casting process.

2. Mathematical Modeling

2.1. Assumptions

The basic simplifications for this numerical model are as follows:
(1)
The molten steel is considered to be Newtonian. The material properties such as density and viscosity are assumed to be constant.
(2)
The discrete bubbles generally take the shape of a sphere. The breakage and coalescence of bubbles and the interactions between them are neglected. The bubbles have no expansion.
(3)
The mold taper is neglected because it does not influence the flow behavior in the mold.
(4)
The heat transfer between the melt and cooling zone is neglected.

2.2. Governing Equations

2.2.1. LES Model

In this work, the volume of fluid (VOF) model is employed to track the interfaces between air–slag and slag–steel. The tracking of the interfaces is accomplished by solving the continuity of the volume fraction of each phase. For the k (k = l (steel); k = s (slag); k = g (air)) phase, the continuity equation is written as:
( α k ρ k ) t + ( α k ρ k u ¯ m ) = 0
where ρ k is the density of k-phase, u ¯ m is mixture velocity, and α k is the volume fraction constrained by the equation α l + α s + α g = 1 .
The unsteady large eddy simulation (LES) model is adopted to solve the filtered time-dependent Navier–Stokes (N–S) equations:
( ρ m u ¯ m ) t + ( ρ m u ¯ m u ¯ m ) = P ¯ + [ μ e f f e c t ( u ¯ m + u ¯ m T ) ] τ i j + ρ m g + 6 π d p 3 F + F T
Here, the term ρ m is mixture density, P ¯ is the static pressure, F is the particle force acted on steel, F T is the surface tension at the interface [21], and the μ e f f e c t = μ m + μ t is the effective viscosity of mixture phase. The term μ m is the molecular viscosity of the mixture phase and μ t is the turbulent viscosity of mixture phase. They are all averaged over the volume fraction of each phase in the VOF approach.
The sub-grid scale stress τ i j is written as:
τ i j = 1 3 τ k k δ i j 2 μ t S ¯ i j
where τ k k is the isotropic part of sub-grid scale stress; δ i j is Kronecker delta; S ¯ i j is strain rate. The turbulent viscosity is μ t = ρ L s 2 | S ¯ | and | S ¯ | = 2 S ¯ i j S ¯ i j .
In this work, the mixing length L s is calculated by:
L s = min ( κ d , C s Δ )
where κ is a von Kármán constant equal to 0.4, d is the distance to the closest wall, C s is the Smagorinsky constant of 0.2, and Δ is calculated based on the volume of the structured cell using Δ = V 1 / 3 .

2.2.2. Bubble Transport Model

The transient transport of particles is simulated based on the flow fields of LES inside the liquid pool. Due to the low volume fraction of particles, the Lagrangian approach is used to calculate the transport of argon bubbles. The interactions between these phases were two-way couplings. The motion of particles can be simulated by integrating the force balance equation for each particle, which can be written as:
m p d u ¯ p d t = F
where u ¯ p and m ¯ p represent the velocity and mass of every bubble, and F represents the total forces acted on bubble, which can be expressed as:
F = F g + F b + F p + F d + F l + F v m
The terms on the right-hand side of Equation (6) are the gravitational force, buoyancy force, pressure gradient force, drag force, lift force, and virtual mass force. The detailed expressions for the terms on right-hand of the equations can be found in [22].

2.3. Boundary Condition and Numerical Details

The computational domain includes the SEN, entire mold, foot zone, and secondary zone, shown in Figure 1a. A fixed velocity is applied at the SEN inlet based on the casting speed (1.7 m/min), and the outlet boundary of the domain is defined as the outflow. Three phases are considered in the mold; air, slag, and steel. In addition to the phases stated above, the discrete bubbles, which are injected from the inlet of the SEN with the flux of 16 L/min, are tracked by the discrete particle model (DPM). To reveal the differences in different positions of the slag layer, the whole layer thickness can be divided into four zones: 1/4 zone, 2/4 zone, 3/4 zone, and 4/4 zone, as shown in Figure 1b. To capture the flow characteristics in detail, the mesh size is refined near the two interfaces (slag–metal interface and air–slag interface), and coarsened in the low-gradient velocities below the mold. The whole domain is divided to be 2.1 × 10⁶ finite volumes and the time step size is 0.01 s. The total calculation time is 125 s. Other parameters for this simulation are summarized in Table 1.

2.4. Movements of Argon Bubbles in the Mold

In this work, the bubble movements in multi-phases, as well as the breakage near the air–slag interface, are described by our numerical model that is solved through commercial software of Fluent 19.0 (ANSYS Inc., Canonsburg, PA, USA) with user-defined functions (UDFs). The bubble trajectories can be separated into four stages; (1) injecting through the SEN, and (2) transported in the mold; (3) floating into the slag layer and (4) escaped from the slag top, as shown in Figure 2. It should be noted that the escape position of the argon bubbles is generally below the air–slag interface in the powder layer of slag. For simplification, we defined that once the bubbles reach the boundary of air fraction 0.9, the bubbles are assumed to have escaped from the calculated domain.

2.5. Validation of Mathematical Model

The operating conditions, especially the injection rate of bubbles, significantly affect the flow field in the mold [23,24]. An excessive rate of argon bubbles may cause naked steel on the top surface of the slag layer, resulting in slag entrapment in steel. For the validation of our mathematical model, the on-site observations of the free-surface of the slag layer were recorded during the real casting process, shown in Figure 3a. The picture is taken through a Digital Video (Type: Sony N50, Tokyo, Japan) applied on the left side of the mold top through an anti-shake camera crane, to avoid the downgrading of the picture resolutions due to mold oscillation. It is evident that the two slag eyes are observed near the boundary of SEN, indicating that the argon bubbles tend to float up near the SEN. A similar phenomenon is also found in our simulation result of Figure 3b, indicating that the predictions of the naked steel are in reasonably good agreement with the on-site result.
From the on-site results, it is easy to show the balding eyes in steel but there are disadvantages with regard to visualizing the phenomenon inside the mold. Therefore, in addition to the observations stated above, we put forward another simulation work to compare with the experimental result reported by Bielnicki et. al [13] using our three-phase model. It can be seen from Figure 4a that due to the up-recirculation of the water stream, the slag is accumulated near the center of the wide face, thus leading to the fact that the slag layer is rather thin near the narrow wall of the mold. What’s more, the slag thickness is also thin near the nozzle; however, it is much thicker than that near the narrow wall of the mold. These phenomena are vividly reproduced through our simulation work in Figure 4b, indicating that our mathematical model is confirmed to be reliable.

2.6. Behavior of Bubbly Flow in the Mold

Figure 5 illustrates the bubble distribution calculated with the model vs. time. It is obvious that the argon distribution in the mold is quite asymmetric and non-uniform. Due to the effect of buoyancy force, most of the bubbles are gathered near the upper zone of the mold and are rarely found below the mold. In the slag layer, the bubbles, especially the bigger ones, tend to aggregate near the SEN and decay with distance from the SEN to the narrow wall of the mold. In the area near the SEN, the small bubbles are easier to coalesce into bigger ones and breakages occur near the top surface of the slag layer, causing naked steel in the mold. This may lead to serious inner defects, such as reoxidation and slag entrapment of the steel. Additionally, due to the drag effect of surface tension between different phases, the bubbles are gathered near the two interfaces (the slag–metal interface and the air–slag interface). All these phenomena can be evidenced using our LES model.

2.7. Characteristics of Multi-Phase Flow

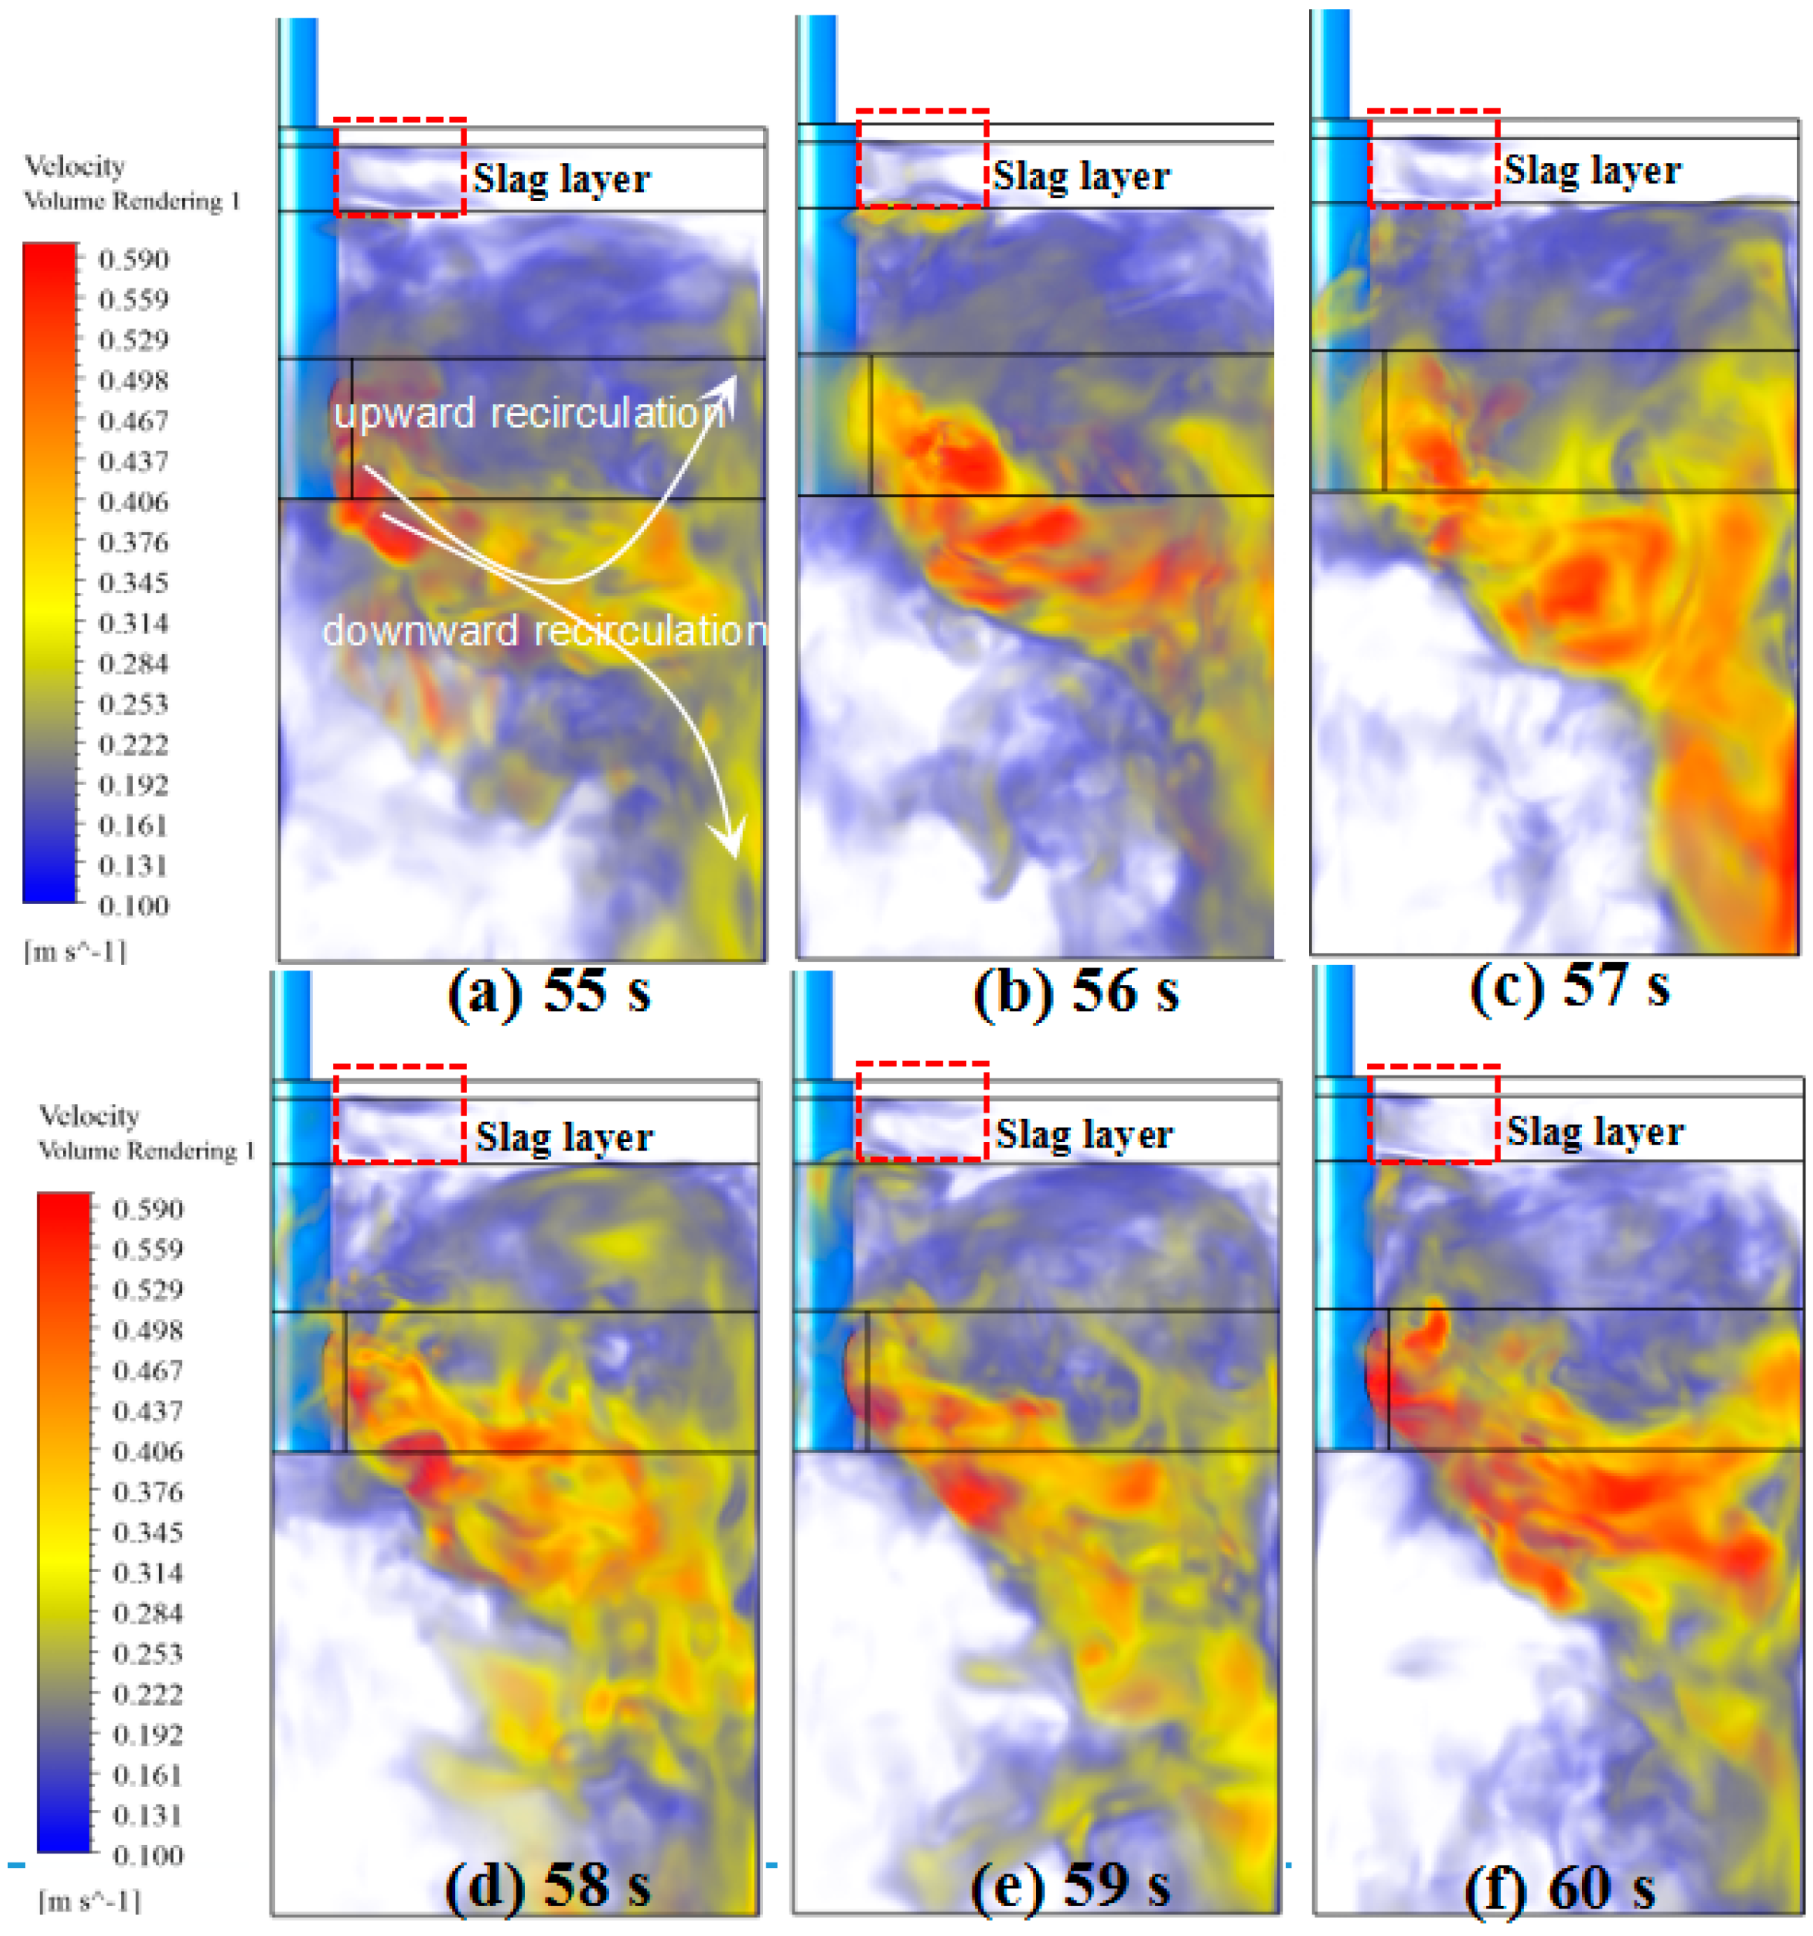
2.7.1. Typical Flow Pattern

Figure 6 represents the typical flow pattern in the mold. It can be seen from Figure 6 that the flow field is obviously instantaneous and unsteady, with multiple vortexes inside the slab strand. Two big vortexes are formed after impinging the narrow wall of the mold, showing a typical “double roll” flow pattern in the slab. As stated above, the bubbles are aggregated near the SEN and two interfaces (slag–metal interface and air–slag interface). Therefore, the velocity near the SEN, especially near the two interfaces, is higher than any other places in the slag layer. This explains the fact that the slag eyes are usually found near the SEN, as shown in Figure 3.

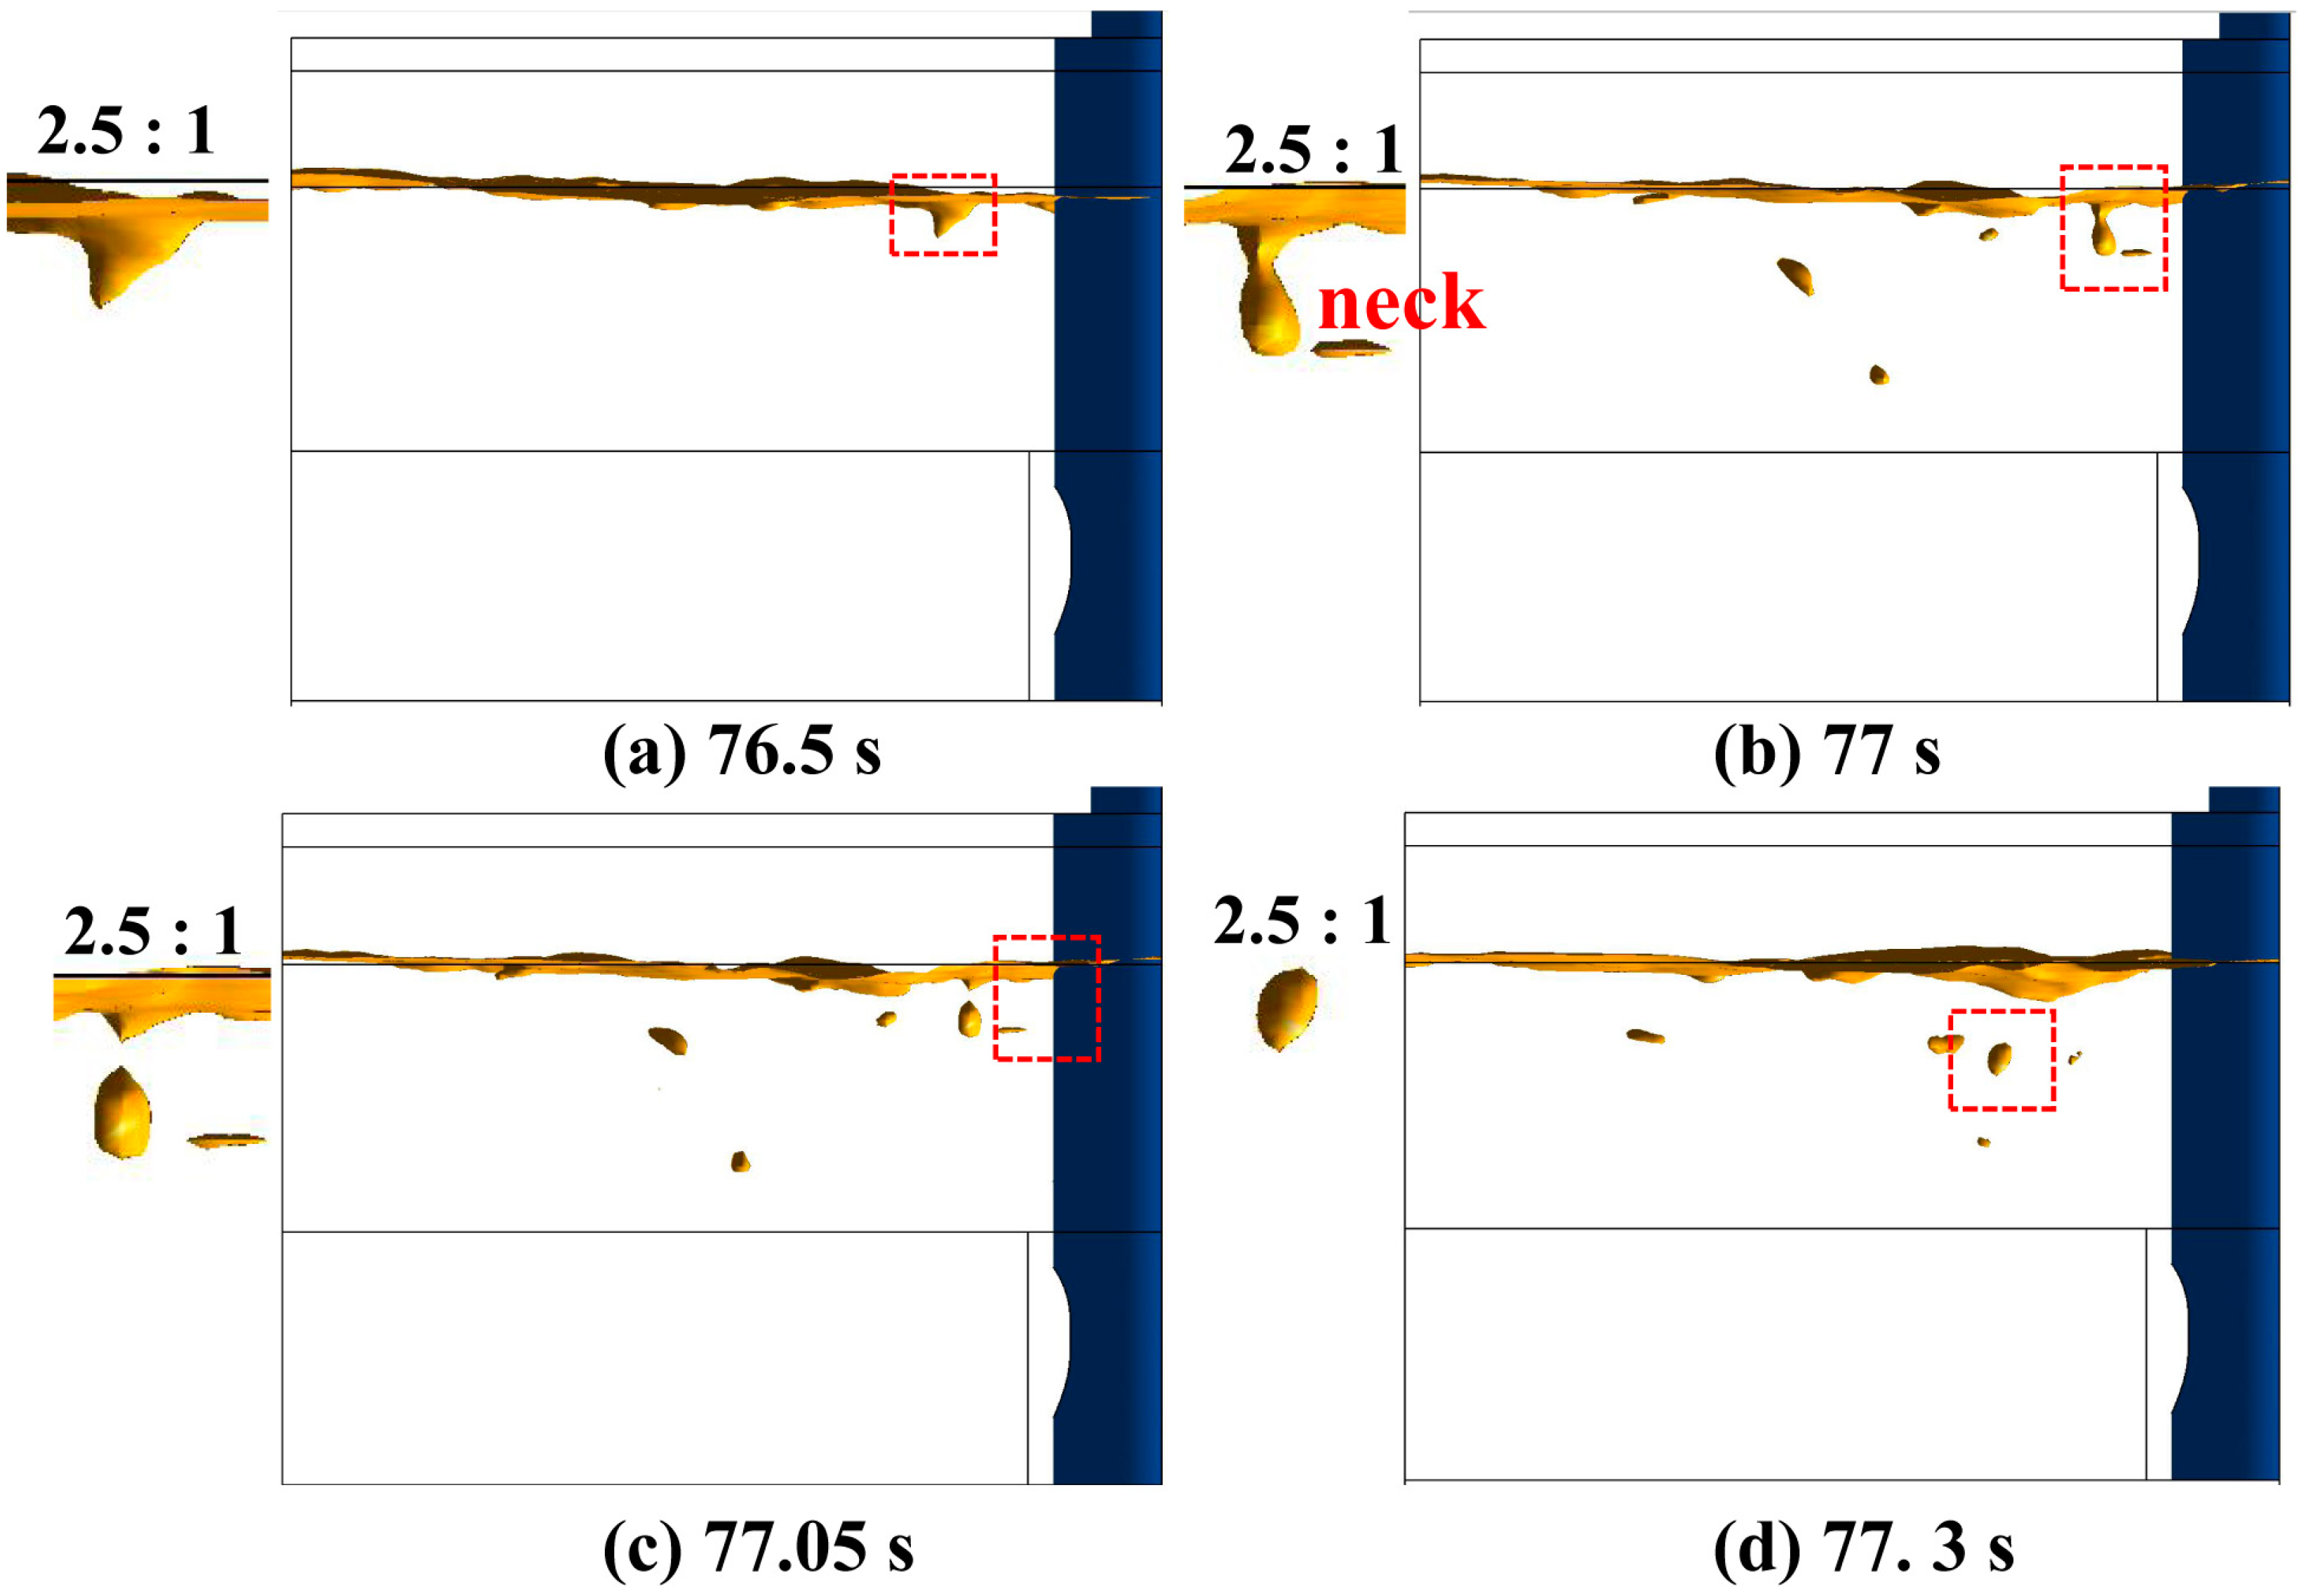
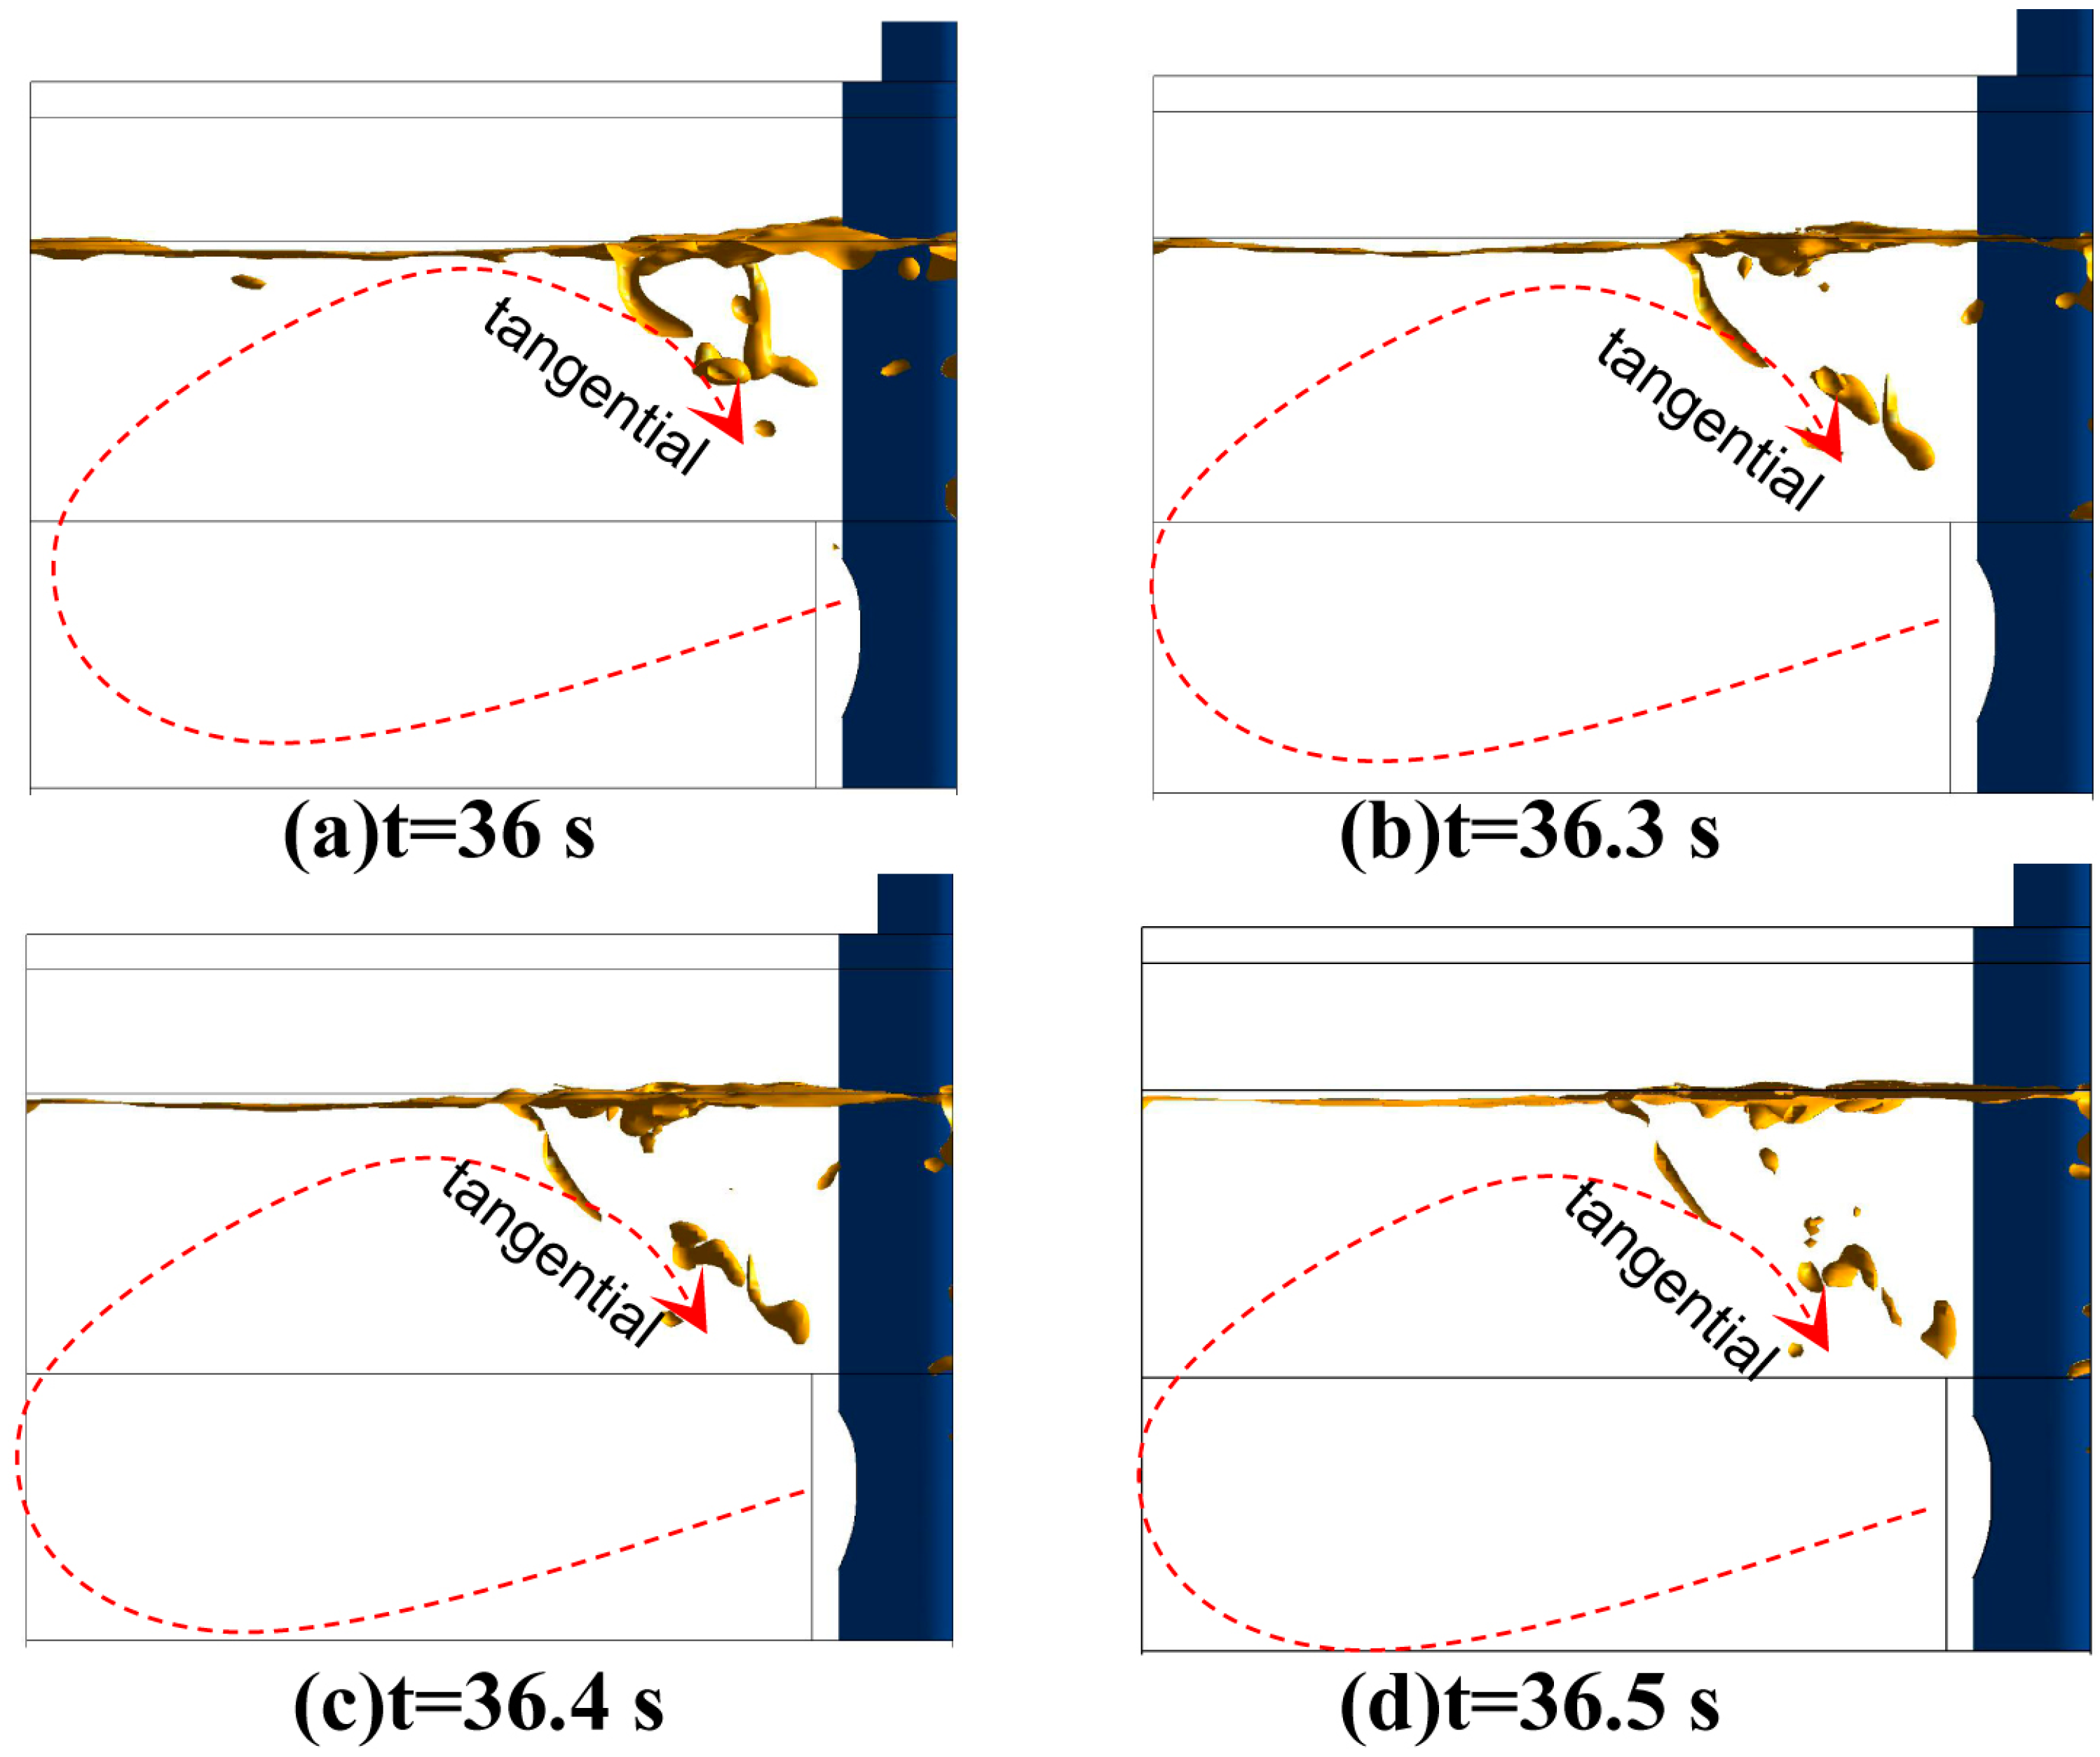
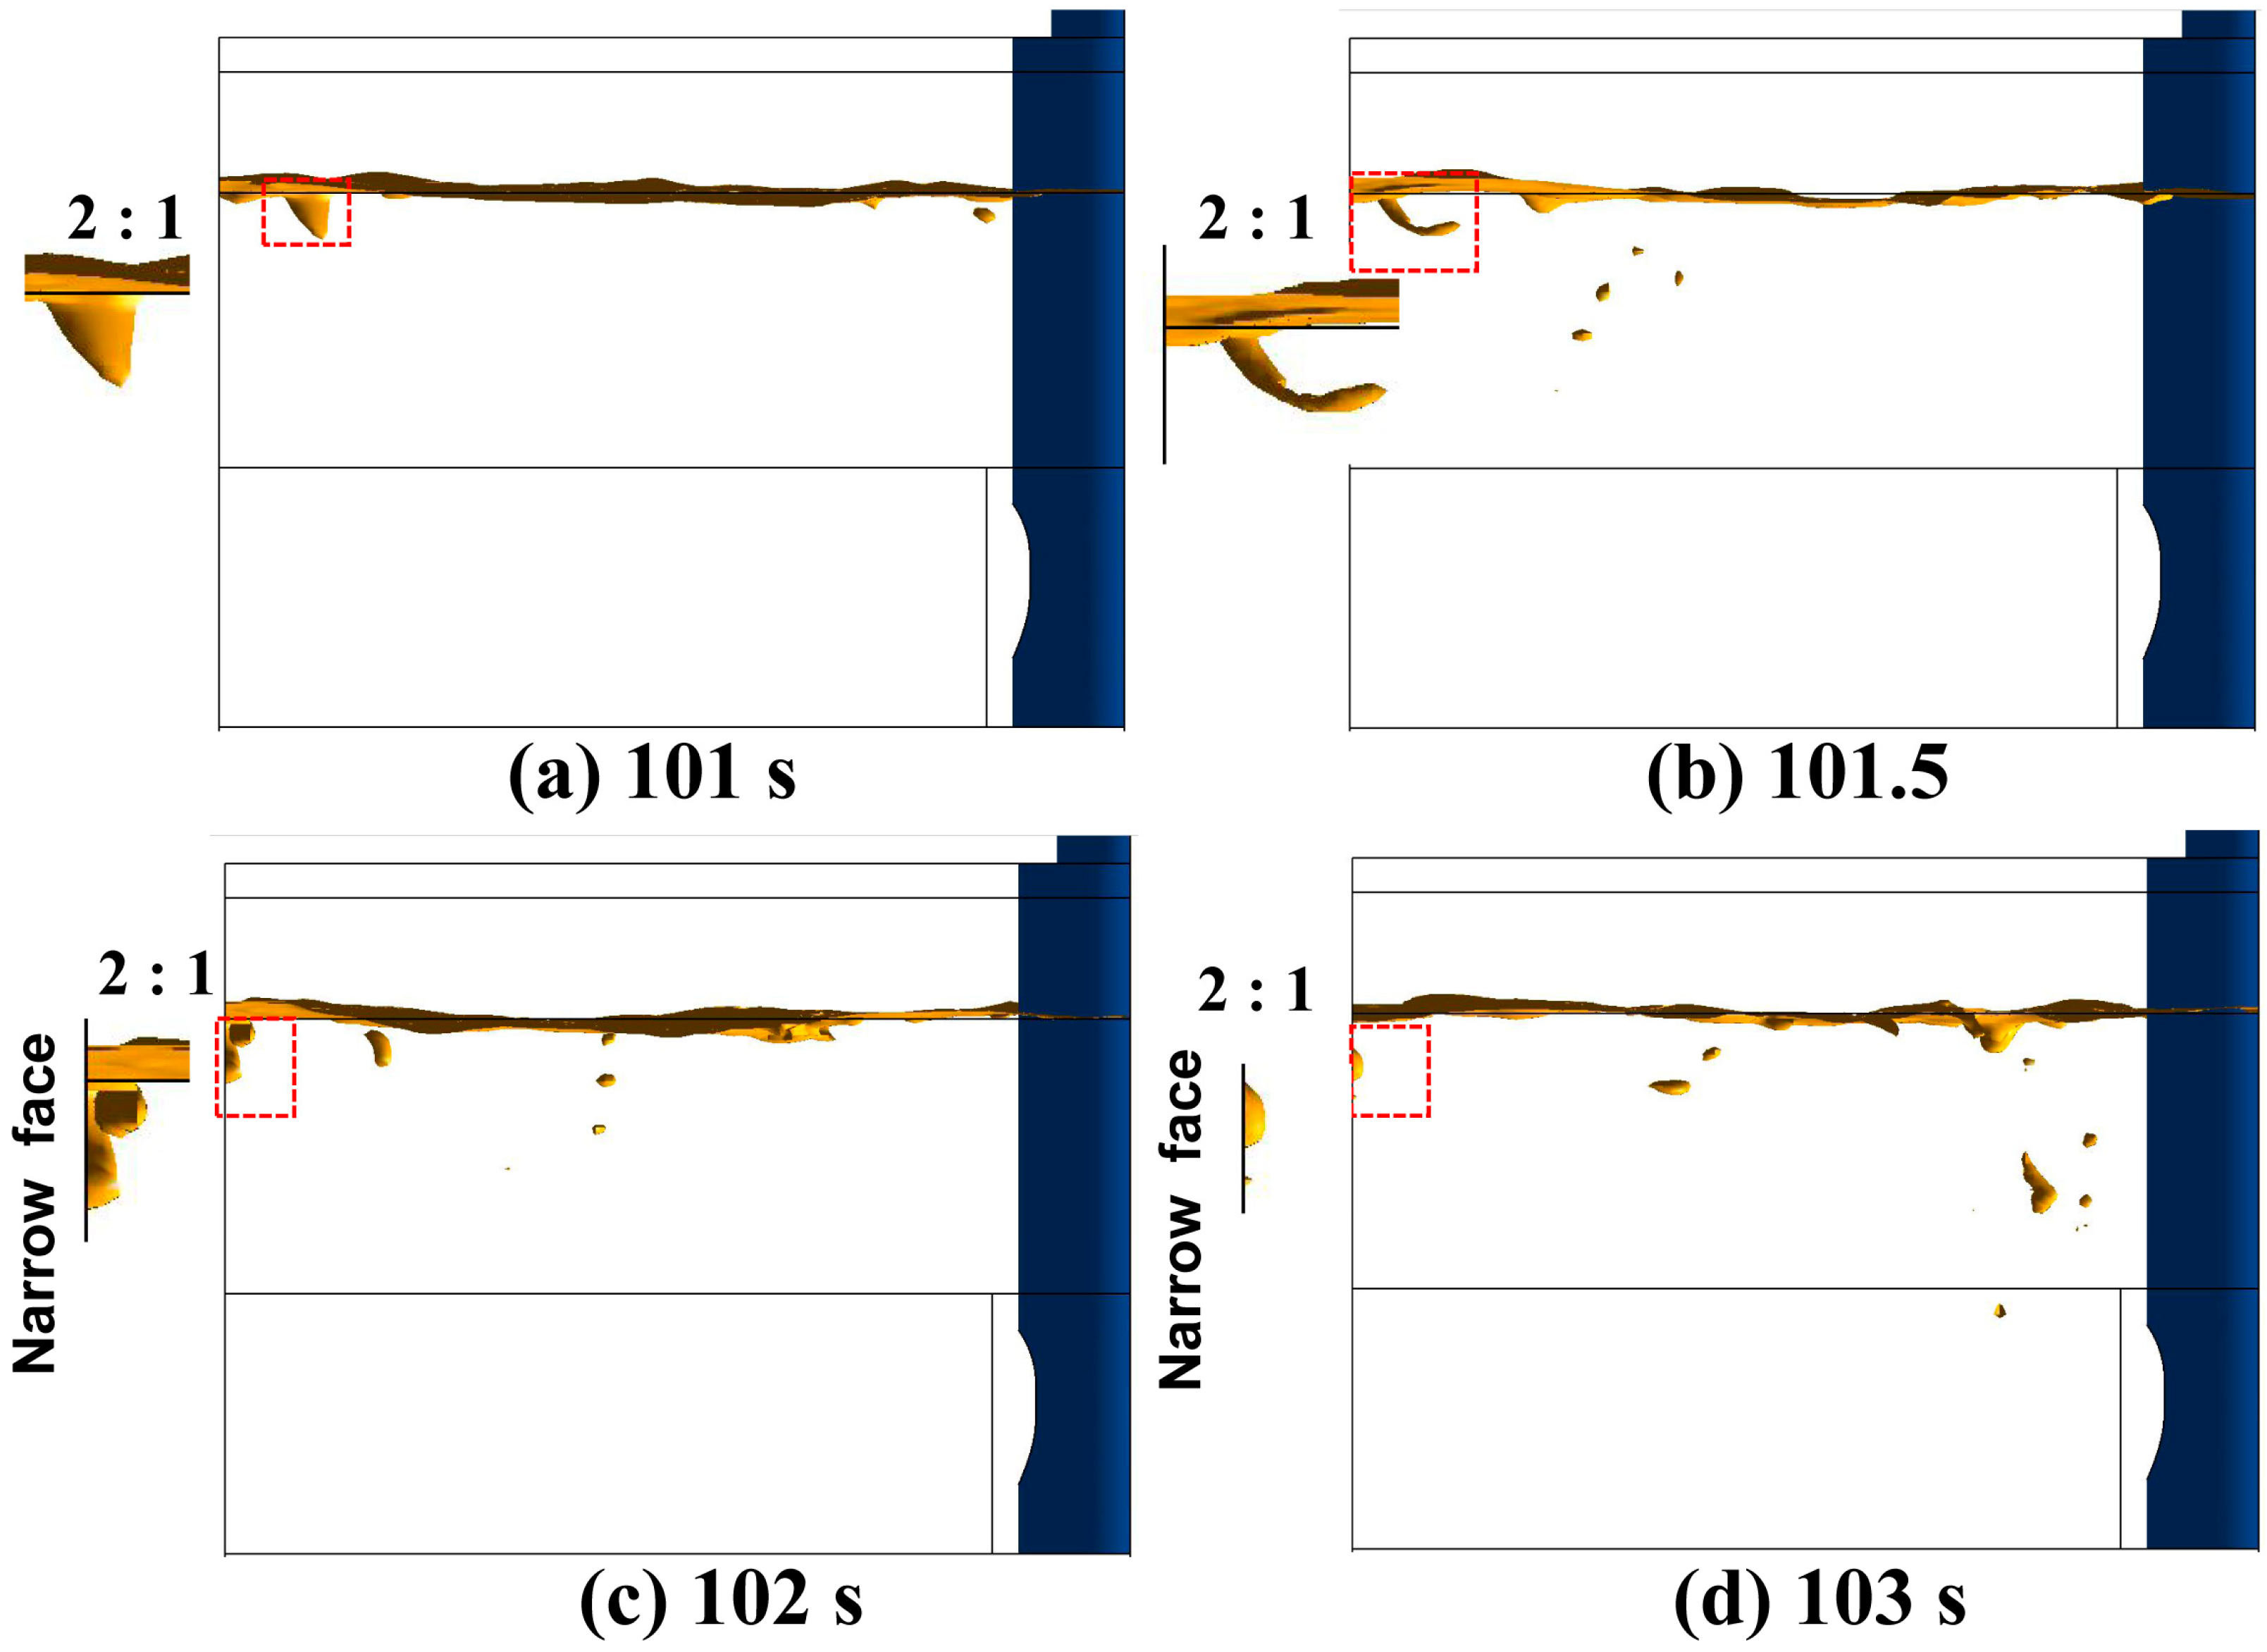
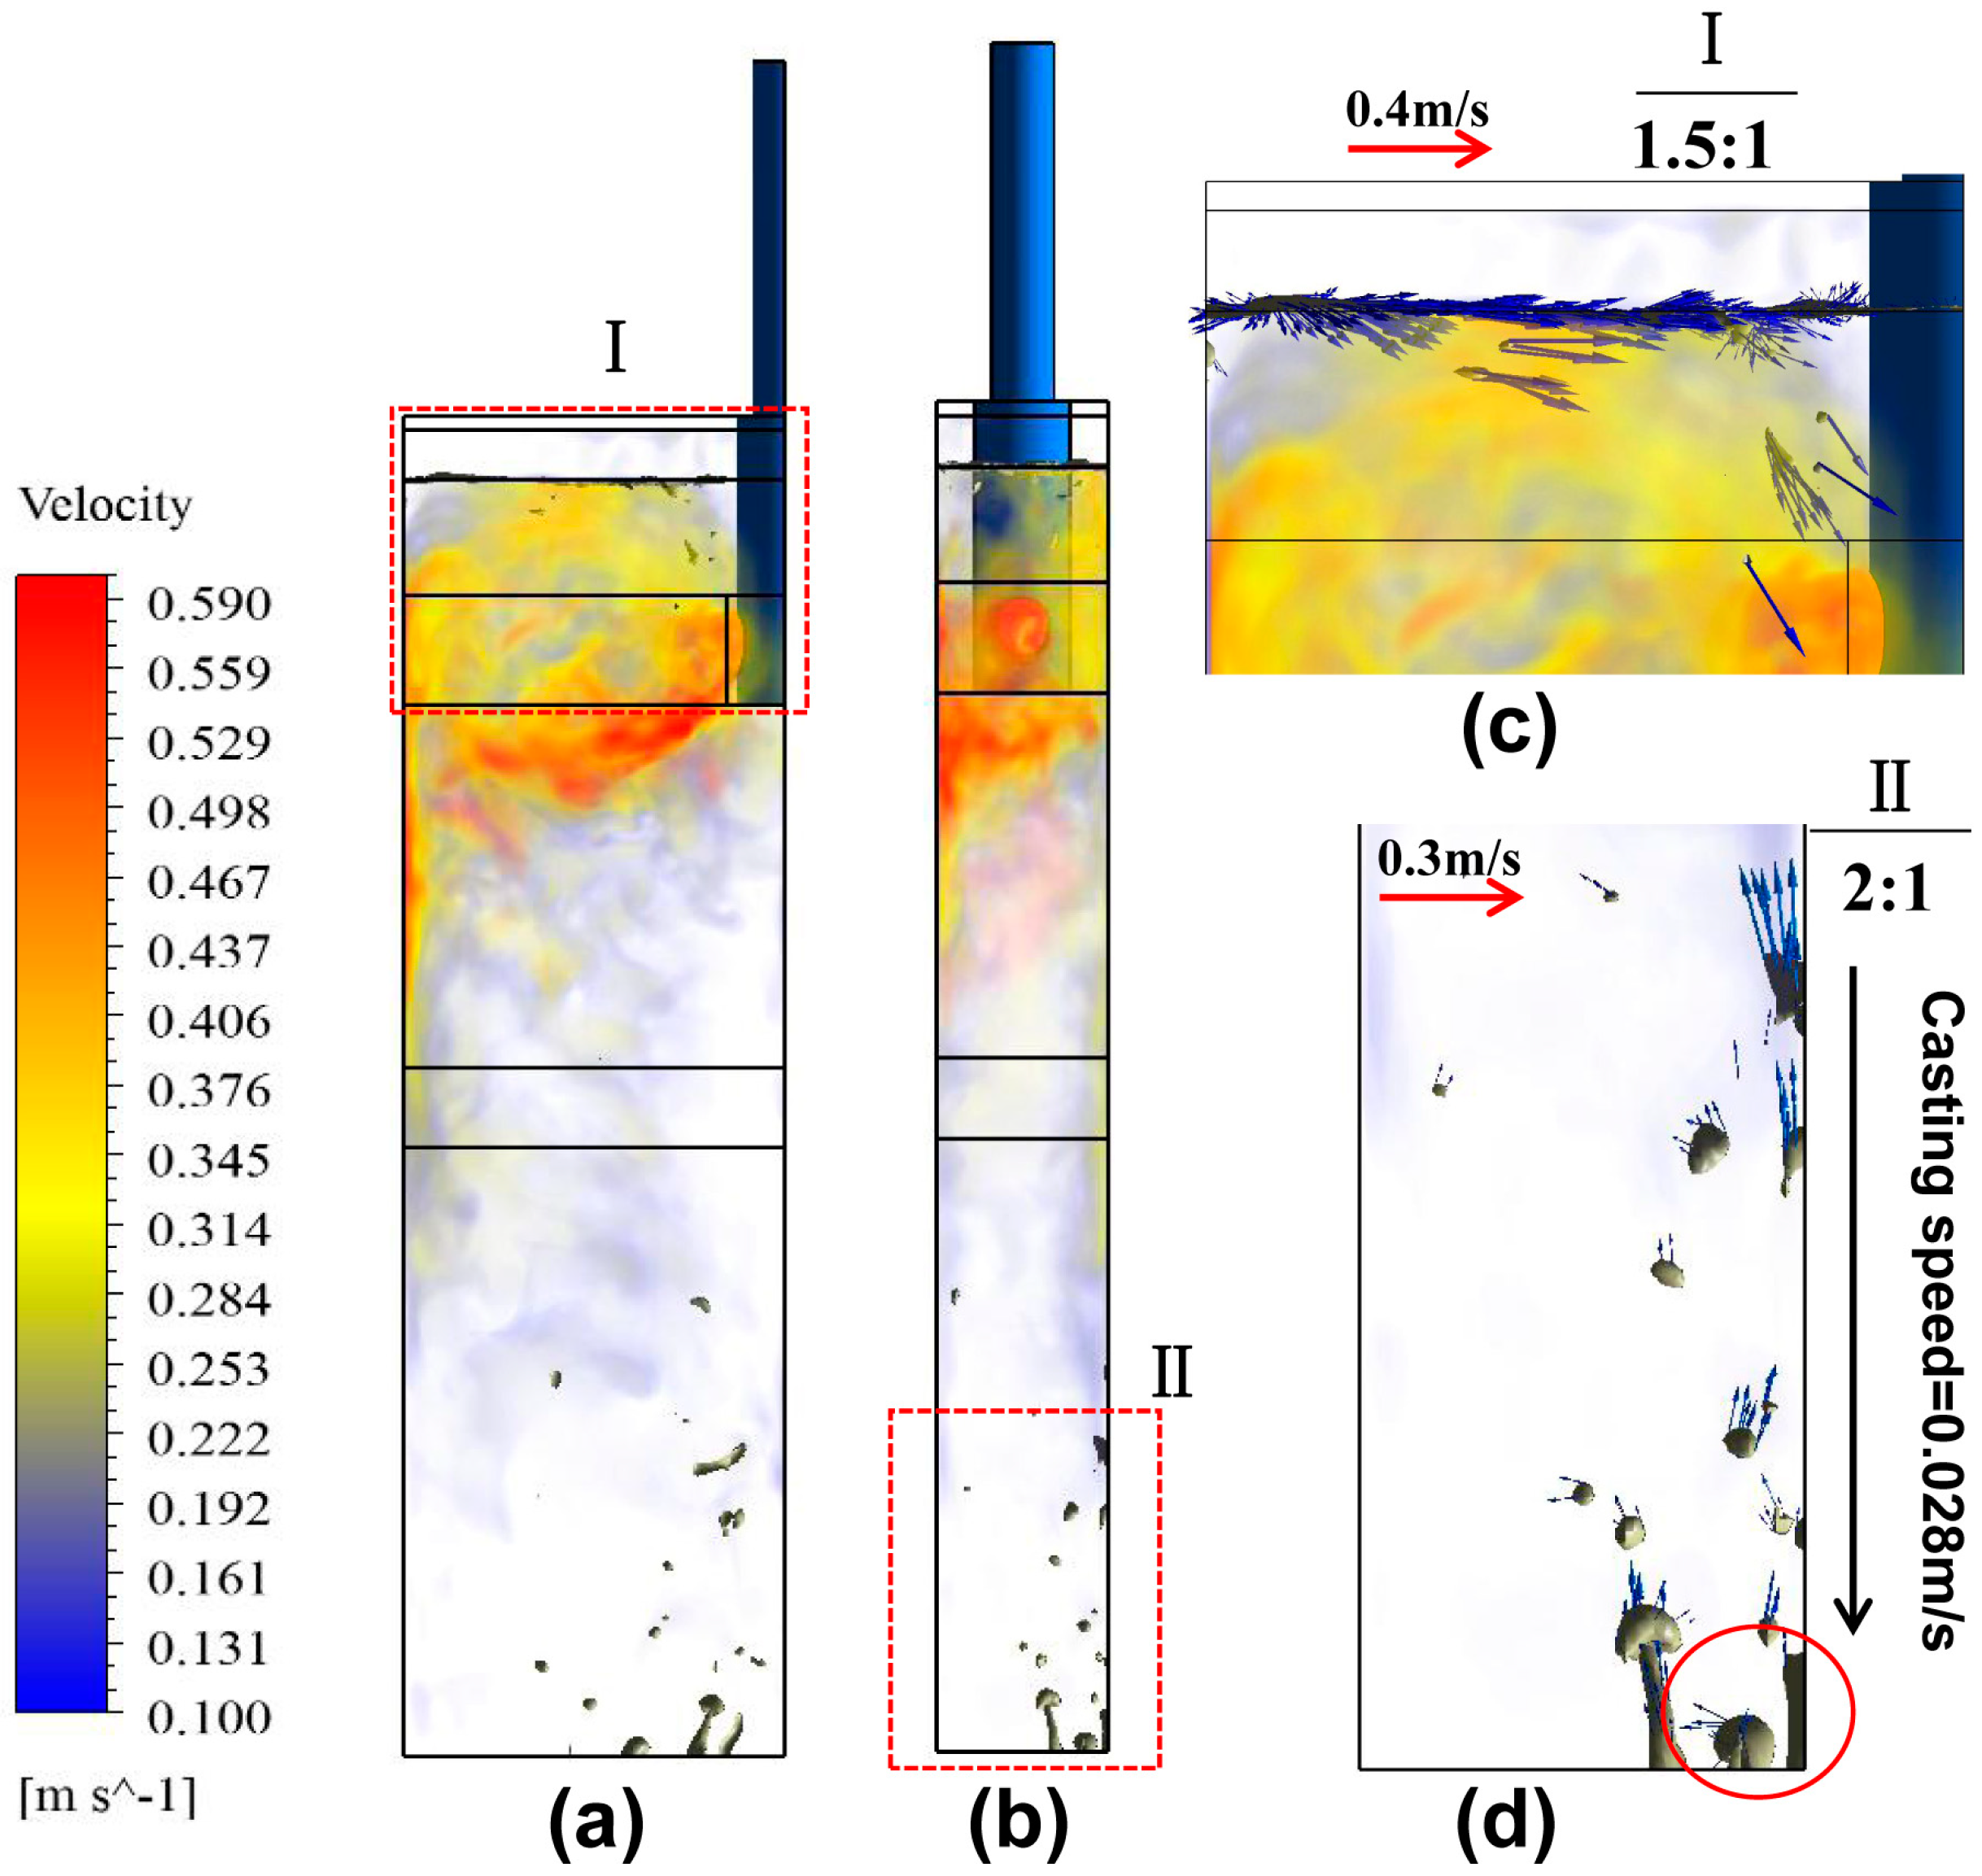
2.7.2. Mechanisms of Slag Entrapment

Figure 7 illustrates the morphology of the slag–metal interface and slag entrapment in the mold. Due to the up-flow towards the slag–metal interface, as shown in Figure 7a, the interface rises near the narrow wall of the mold and drops with distance from the narrow wall to the SEN. However, a small rise is observed near the boundary of the SEN, which may be due to the aggregation of bubbles near the SEN, see Figure 5. The entrapment of slag may experience four stages; (1) The slag–metal interface deforms, producing a small bump, as shown in Figure 7a, into the mold. (2) The interface continues to deform, and forms a “bottle neck”, as shown in Figure 7b, between the slag and the interface. (3) The neck is separated from the slag–metal interface due to the vortexes formed near the interface, then a slag drop forms, see Figure 7c. (4) The slag drop is transported and dragged deep into the mold, see Figure 7d, and is then finally entrapped by the solidified shell. This entrapment is caused by the vortexing formation in steel, which is usually found near the SEN. A similar phenomenon is also found in Saeedipour’s experiment in reference [13], which can also give support to our predicted results. This type of slag entrapment is commonly seen during the injection of steel, indicating that the 1/4 zone, see Figure 1b, is the most likely area where slag entrapment in steel occurs.
Another mechanism of slag entrapment is shown in Figure 8. A long slag drop is observed near the 2/4 zone, see Figure 8b, of the slag–metal interface. Due to the up-flow towards the slag–metal interface, shown in Figure 8a, the movement of the slag drop is quite tangential to the up-recirculation vortex in the mold. However, this entrapment is not very commonly evident compared to the previous one and usually occurred near the center of the slag–metal interface. This is called the shearing entrapment. A similar phenomenon is also found in Saeedipour’s experiment in reference [25], which can also support our mathematical model.
Additionally, Figure 9 shows another mechanism of slag entrapment in the mold. It is evident that the slag–metal interface fluctuates up and down near the meniscus region and a slag drop forms beside the narrow face of the mold, shown in Figure 9a,b. In some particular cases, the slag drops may adhere to the narrow wall of the mold, see Figure 9a,b, and are dragged downwards by the permanent casting speed, see Figure 9d. This phenomenon occurs less frequently than the vortex entrapment in Figure 7; however, it may affect the steel quality because the slag can be immediately entrapped by the shell once it is formed, as shown in Figure 9c,d. This is called the meniscus slag entrapment.
Figure 10a displays the positions of slag entrapment in the slab. As stated above, the slag drop is usually formed near the slag–metal interface and flows downwards with the fluid flow, as shown in Figure 10a. Many of the slag drops are entrapped near the wide face of slag, seen from a lateral view in Figure 10b. The velocity near the interface is usually tangential to the up-recirculation flow near the slag–metal interface and with a downwards direction, as shown in Figure 10c. As a result, the slag points toward the tangential flow field and flows downwards. However, when the slag is entrapped deep below the mold, the velocity is oriented upwards, as shown in Figure 10d. Therefore, bubbles are floating up to the mold top because their velocity is pointing upwards. However, once the floating velocity is lower than the casting speed, they can be entrapped by the shell, forming surface defects in the final slab.

2.8. Turbulent Behavior of Two Interfaces in the Mold

Many researchers have investigated the fluctuations of the slag–metal interface in the mold [17,20,21]. However, the interface fluctuations are monitored only on some limited points. Different from their works, a new indicator H i is defined to give information on the slag entrapment occurrence in the mold, which can be described as H i = M a x ( f i ( α = 0.5 ) < 0.3 ) . In this equation, the function f i ( α = 0.5 ) is defined as the Z-coordinates of the line i (i = 1, 2, 3, 4) at the slag–metal or air–slag interface (iso-surface of α = 0.5 ), along the gravity direction (positive Z-coordinate). The term i represents the sequence number for each line. Typically, these four lines (i = 1~4) are located at 1/4, 2/4, ¾, and 4/4 (nearby) of the distance from SEN to the narrow wall of the mold, shown in Figure 11. It should be noted that the Z-coordinate is confined within the maximum of 0.3 m, the distance of which is 0.1 m below the initial position of the slag–metal interface. The advantage of this indicator is that it can reflect the fluctuations of the interfaces in a wider area comparing with that the fluctuations are just monitored on some limited points.
Figure 12 shows the time series of the air–slag interface fluctuations on the four typical lines stated above. Obviously, the most turbulent position is located near the SEN, with the time-averaged value of 0.1686 m, as shown in Figure 12a. The reason for this phenomenon may be due to the bubble aggregation along the SEN, shown in Figure 5. With so many peaks and hollows along this curve, it can be said that the 1/4 zone of this slab is the most predominant area for the “slag eyes” in the mold, and thus requires serious concern. With the increasing distance from the SEN to the narrow wall of mold, the free surface fluctuation is greatly weakened near the 2/4 zone of air–slag interface, as shown in Figure 12b. However, affected by the up-recirculation flow in the mold, the slag entrapment can also be occasionally found around this line (2/4 zone) due to shear-layer instability [2]. This can also be found in Figure 8. Similarly, the interface fluctuations are very low in the positions of lines 3 and 4, just as shown in Figure 12c,d, respectively. However, the turbulent behaviors in these two regions are quite similar, and the maximum turbulence occurrence was found to be between 70 and 80 s. Overall, the height of the air–slag interface decreases with distance from the SEN to the narrow wall of the mold because the bubbles tend to float near the SEN and decay with distance from the SEN to the narrow wall of the mold, as shown in Figure 5.
In addition, Figure 13 illustrates the time series of the slag–metal interface fluctuations on the four typical lines stated above. Similarly, the most turbulent position is also located near the SEN, as shown in Figure 13a. However, different from the air–slag interface, the height of the slag–metal interface increases with the distance from the SEN to the narrow face. The reason for this phenomenon is because of the up-recirculation flow, rising from the slag–metal interface near the narrow face of the mold, as shown in Figure 8. This phenomenon can also be fairly well observed in Figure 7, Figure 8 and Figure 9. What’s more, it’s interesting to find that a similar trend is found along Lines 3 and 4, indicating that the flow characteristics near the two positions are quite similar.

3. Conclusions

In this work, a transient multi-phase (air, slag, and steel) LES model is developed to study the slag entrapment in a bubbly continuous casting mold. The mathematical model was used to predict the plant observations and water model results, and good agreements were obtained. The main conclusions are summarized as follows:
(1)
The process of slag entrapment may experience four stages; deformation, necking, breaking, and transported in the mold. What’s more, three main mechanisms of slag entrapment were identified by our mathematical model; vortex formation, shearing flow, and top surface fluctuation.
(2)
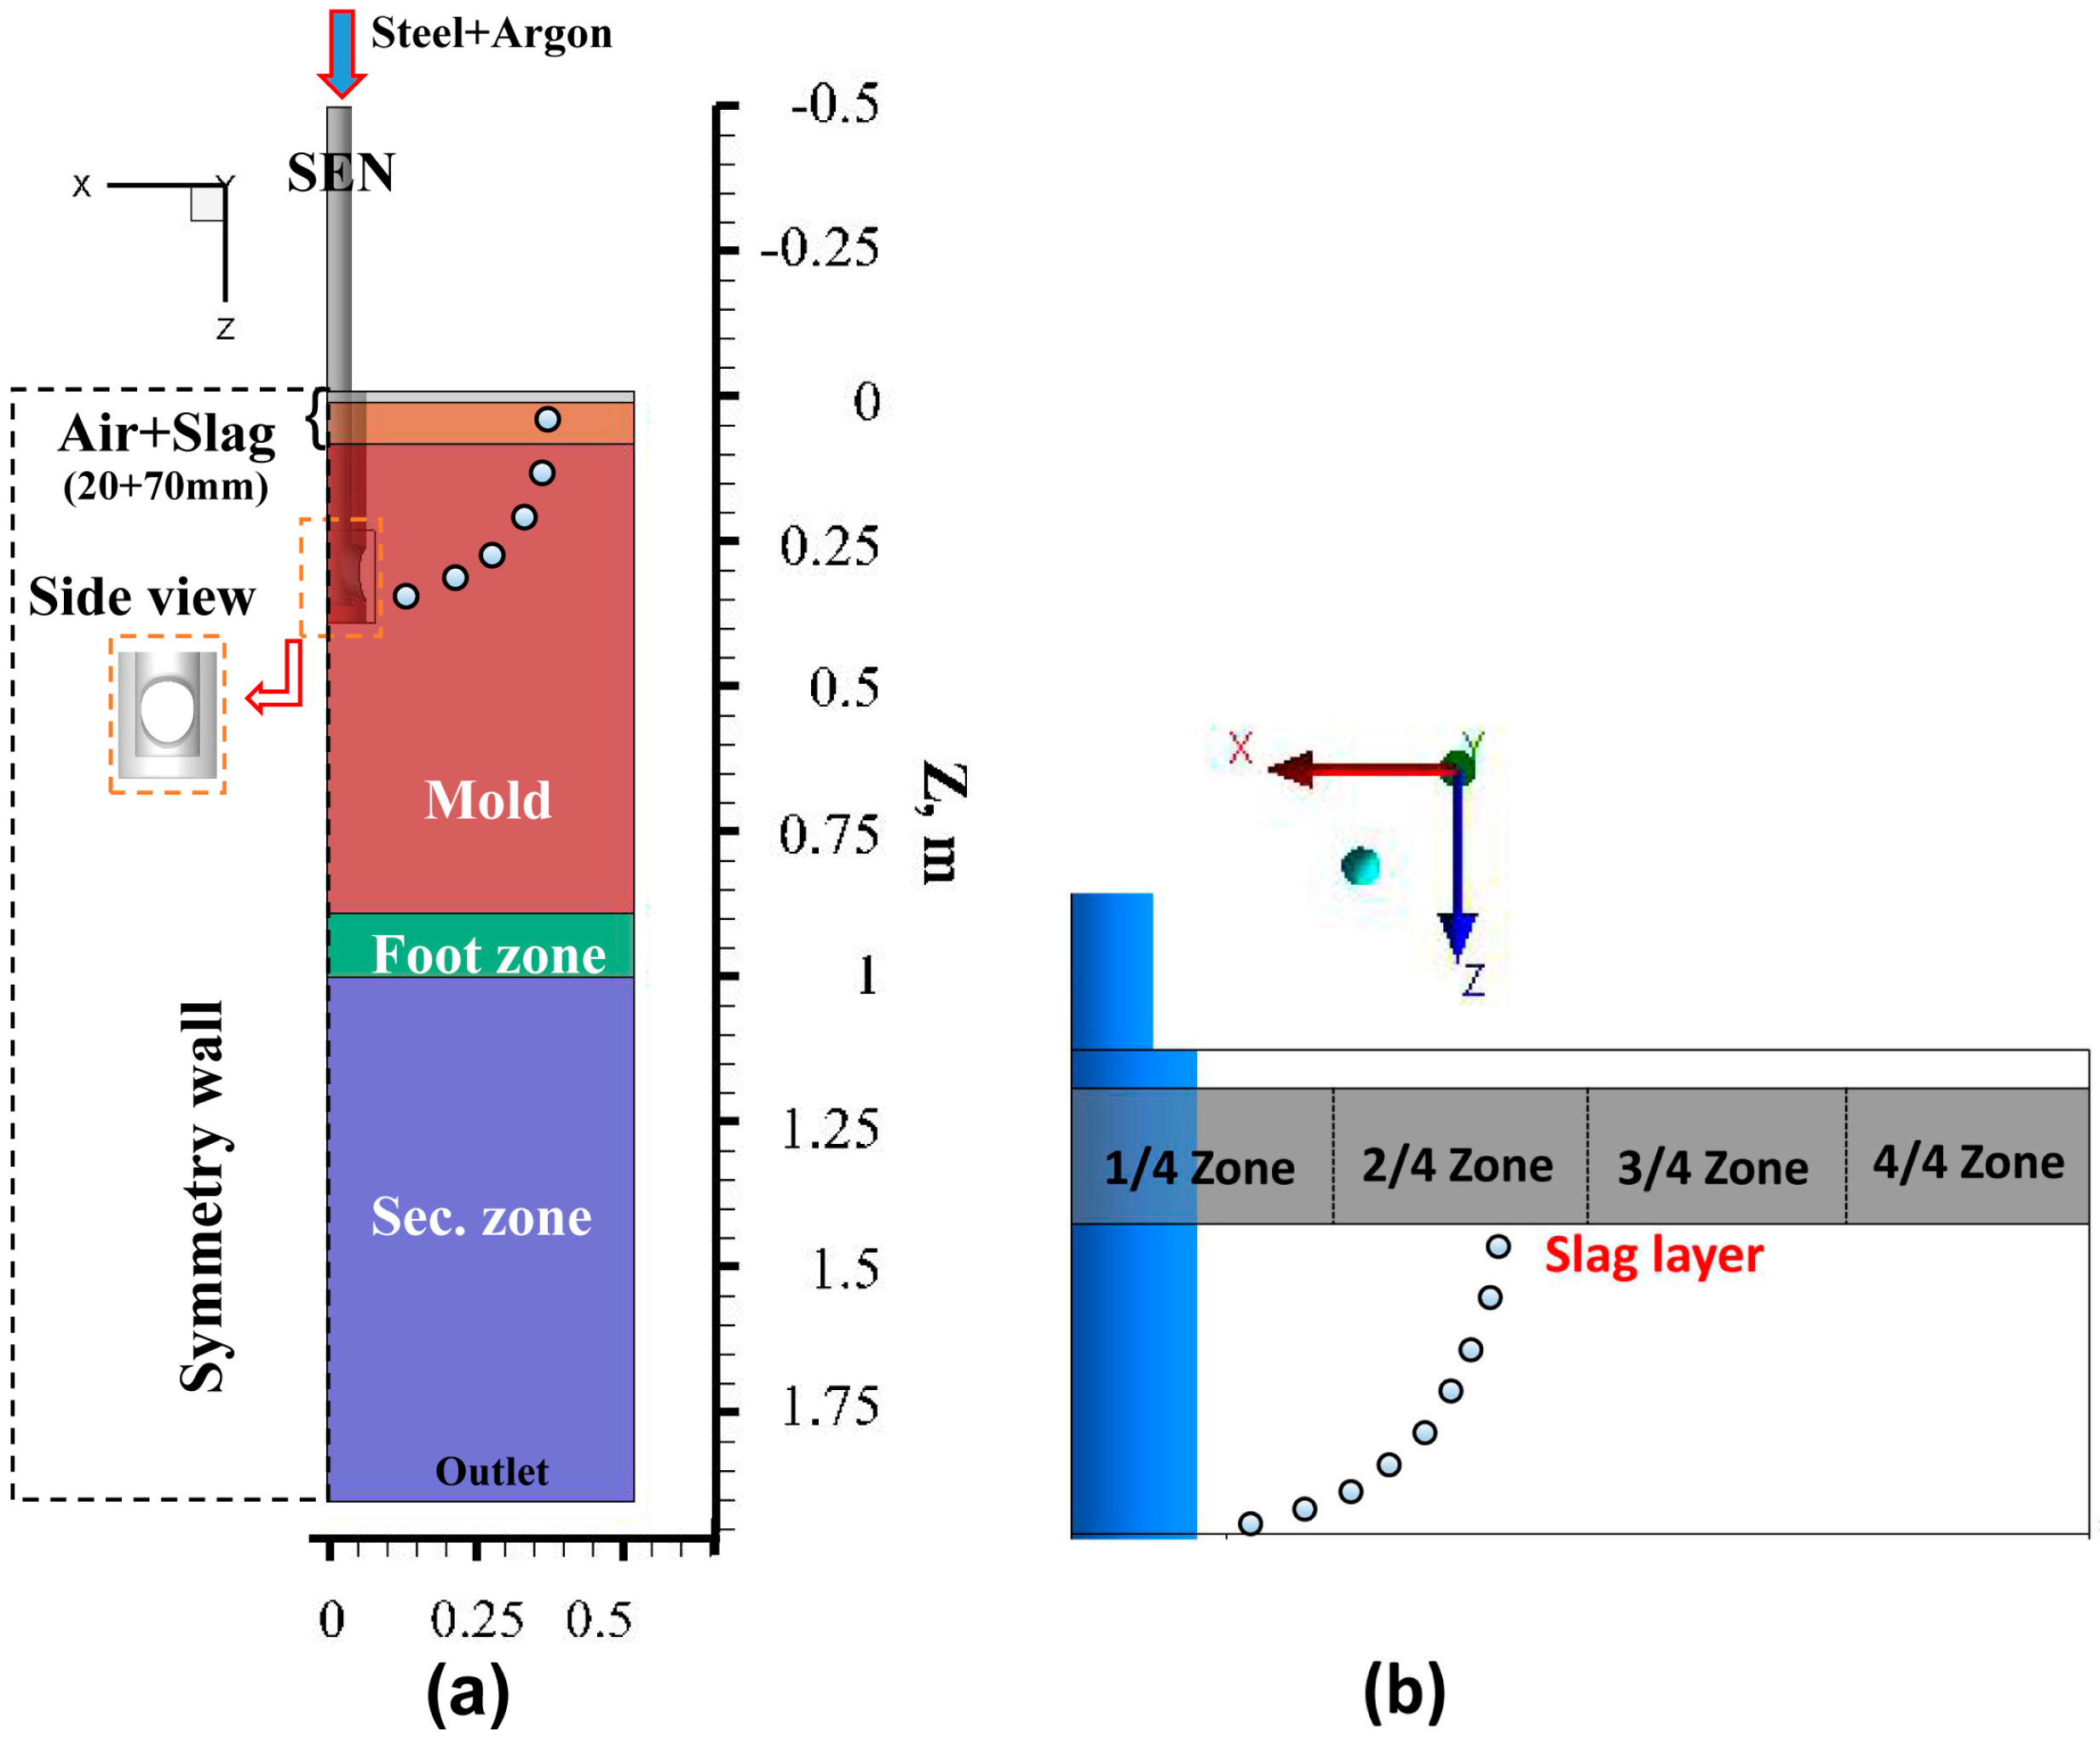
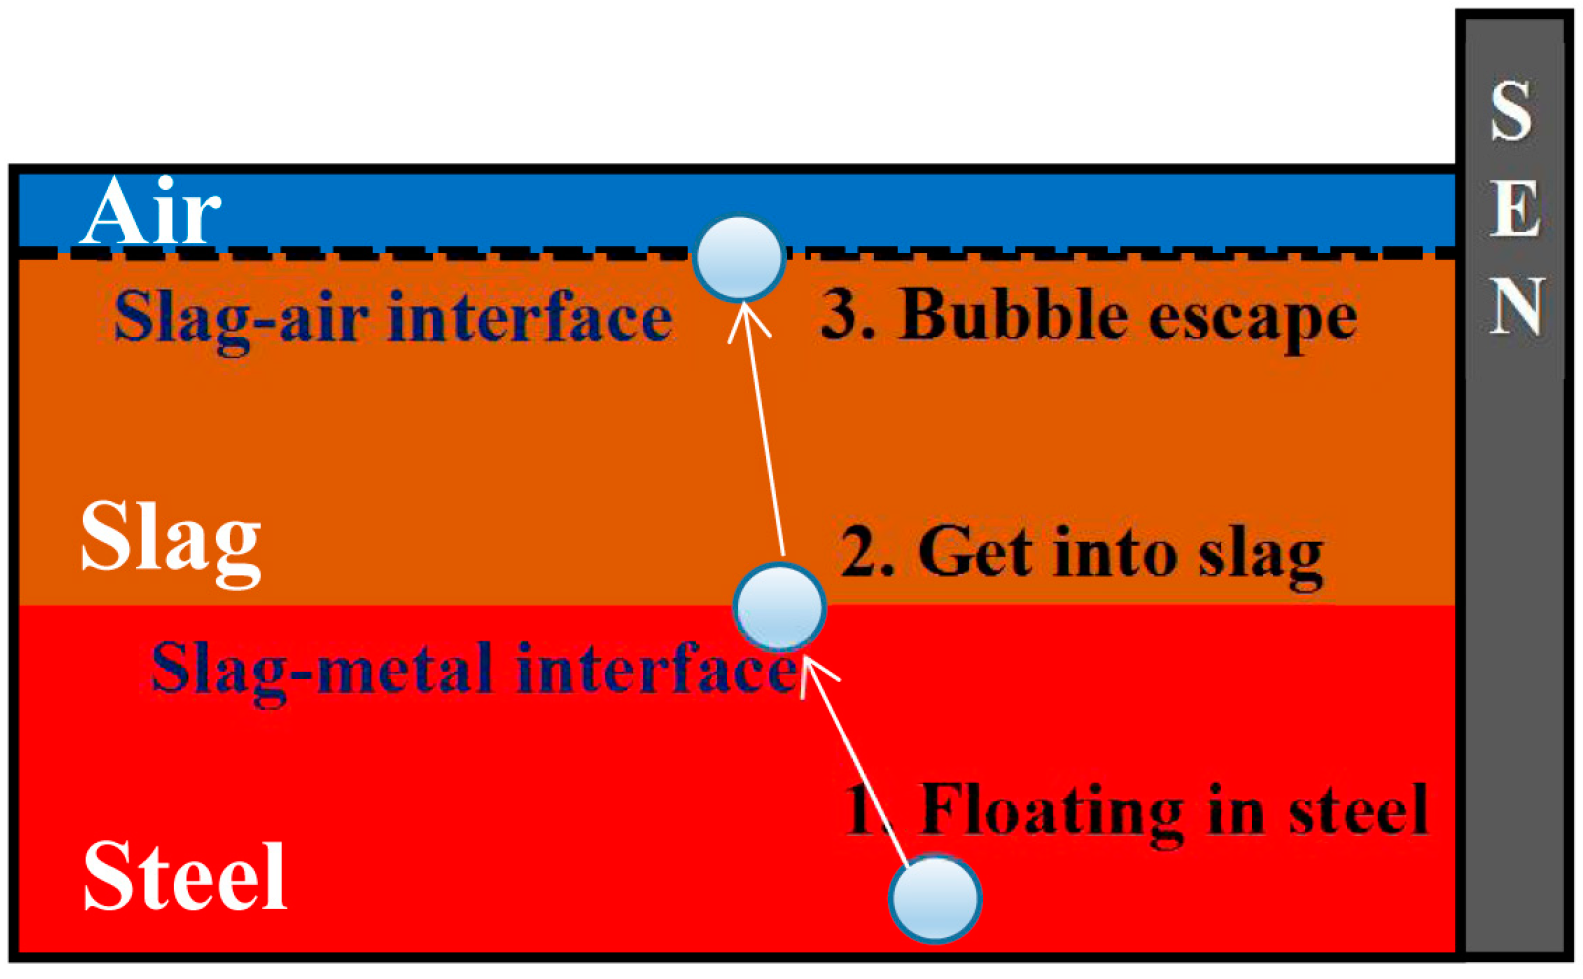
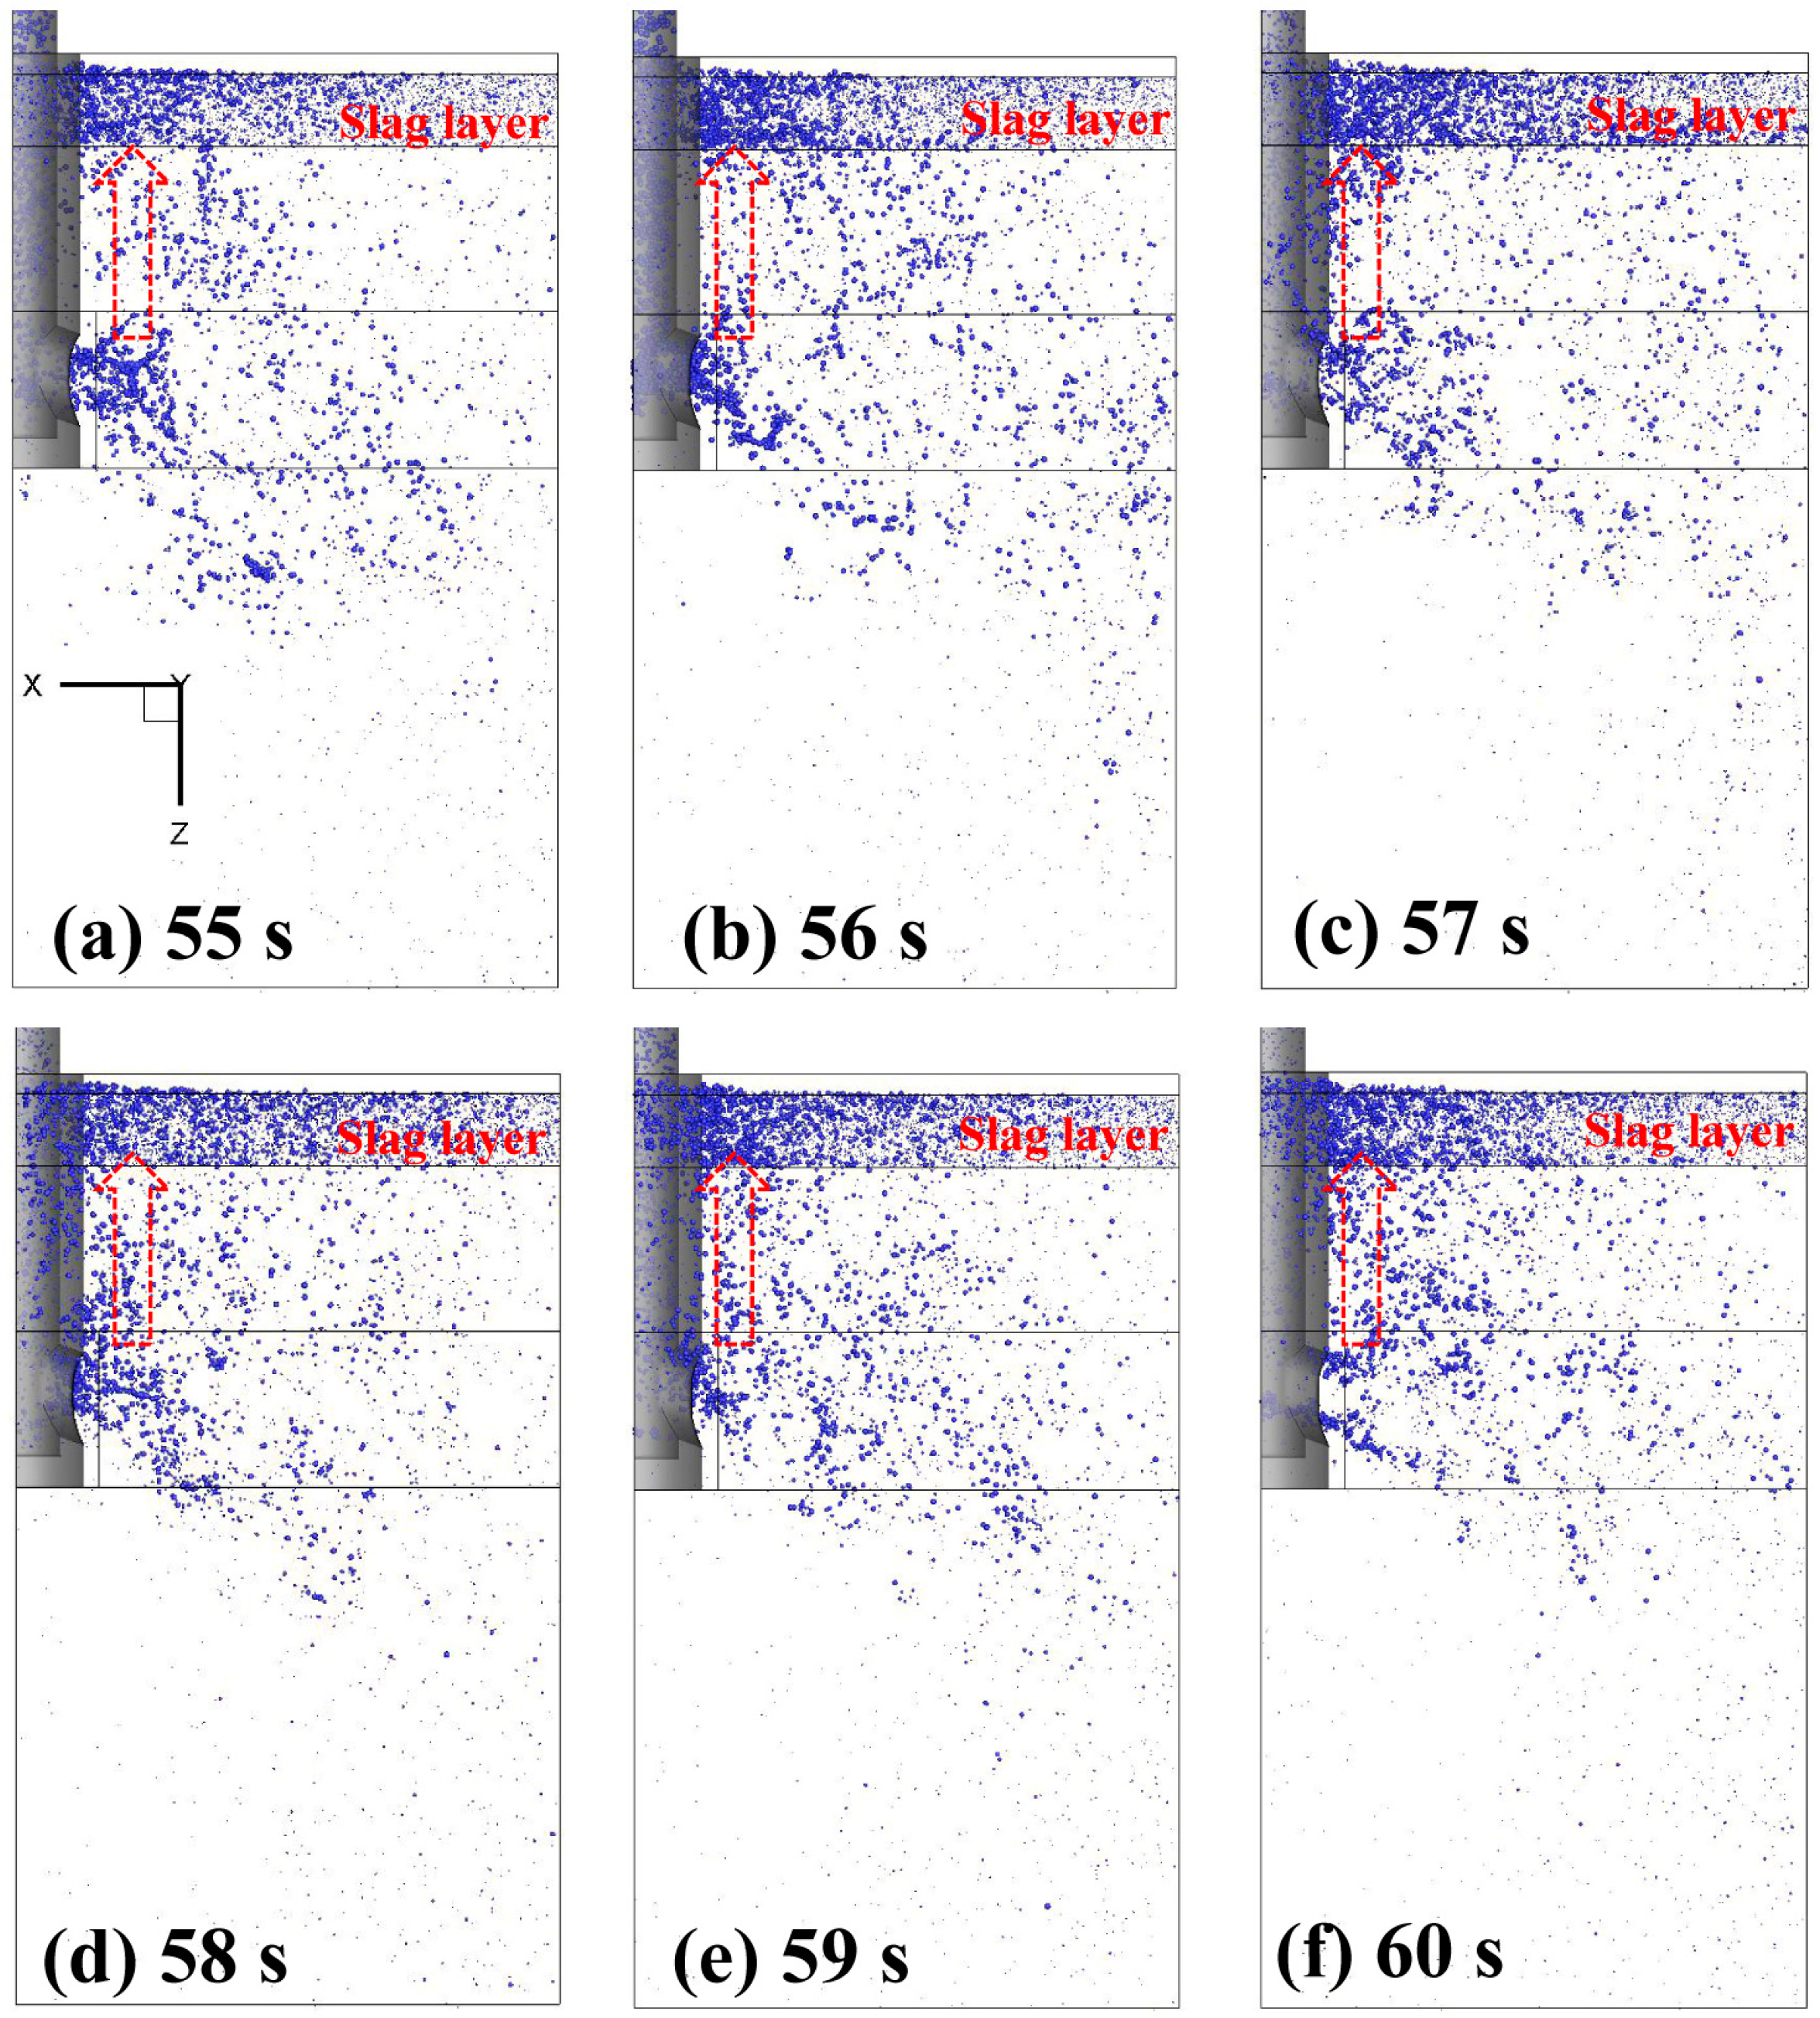
The characteristics of bubble movements among three continuous phases were elaborated. The injection bubbles, especially the big ones, tend to move up near the SEN, leading to the fact that the interface level is rather high and turbulent around the SEN (1/4 zone of the slag layer, shown in Figure 7). This led to the slag eyes being typically found near the SEN from our on-situ observations.
(3)
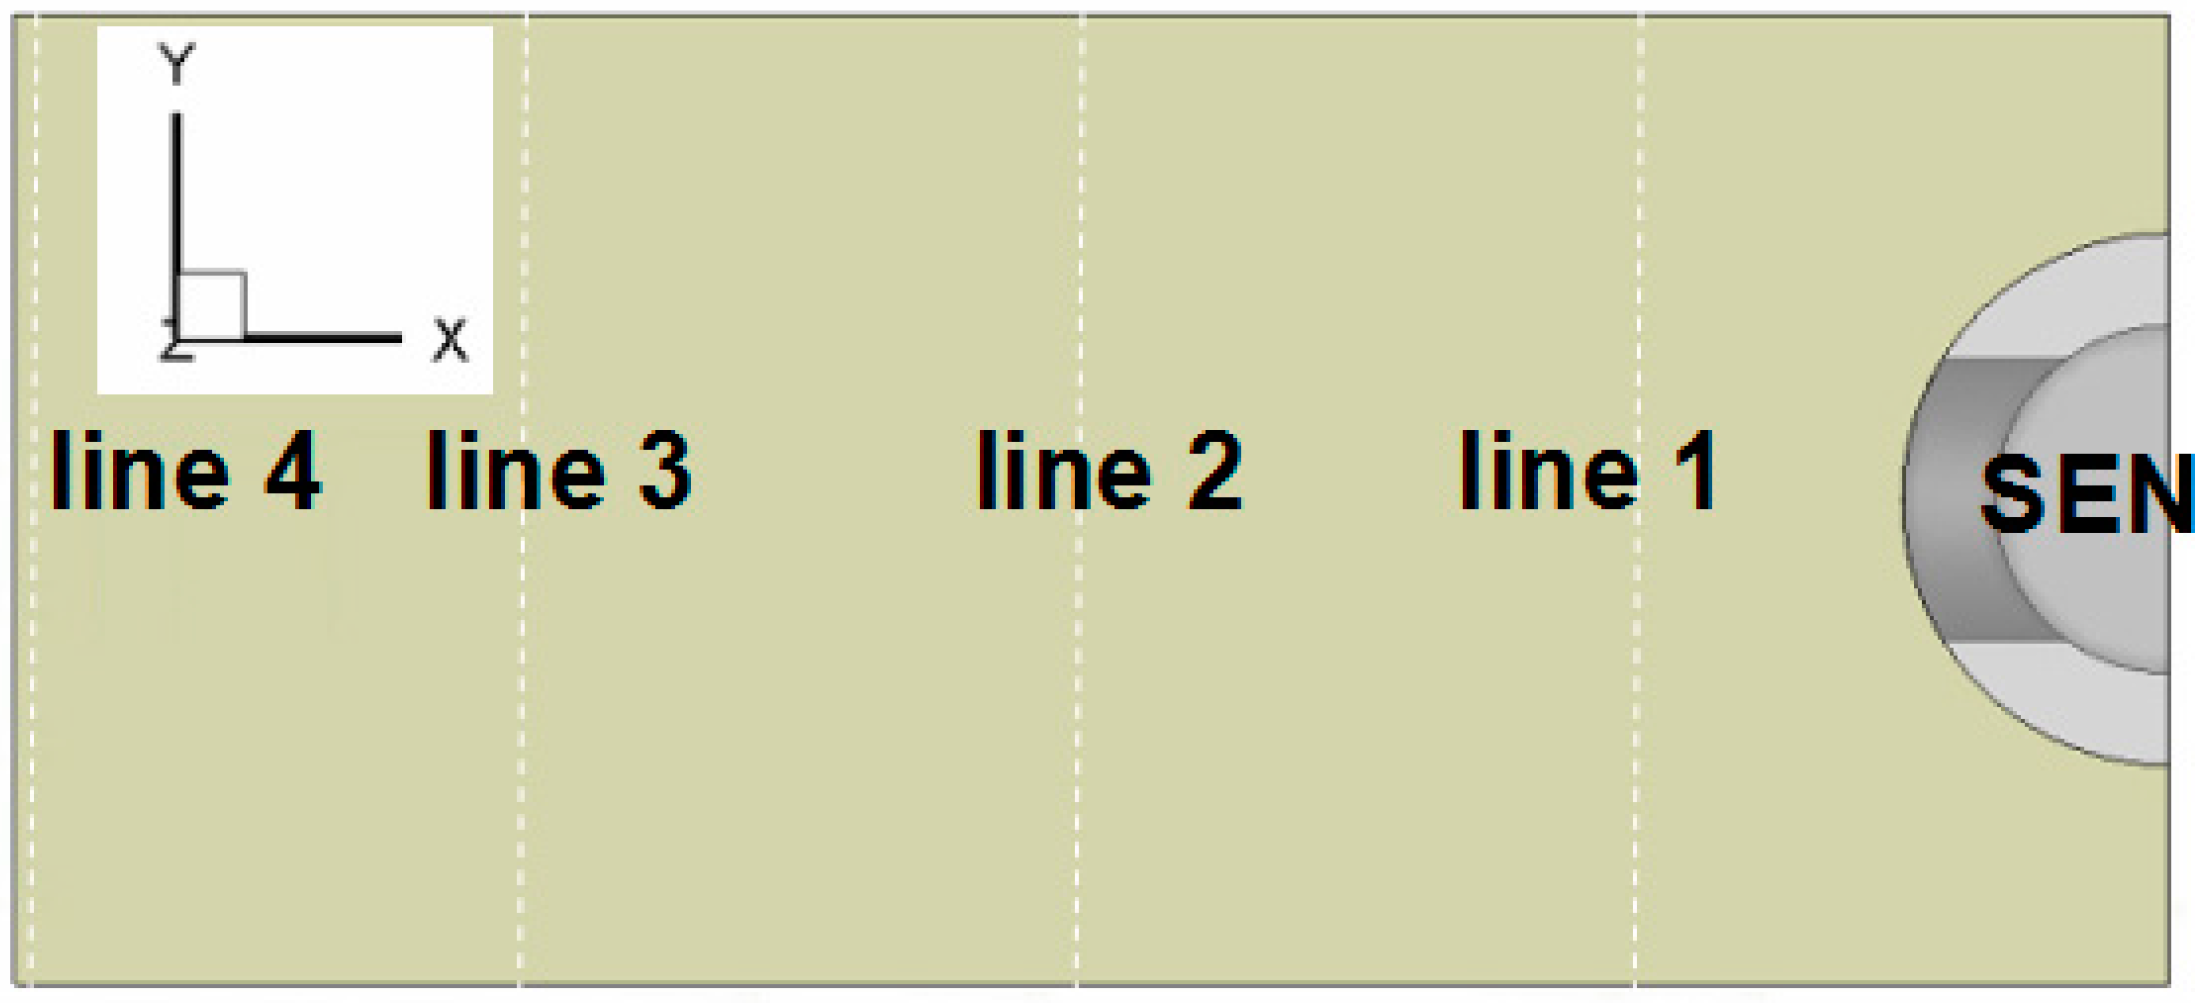
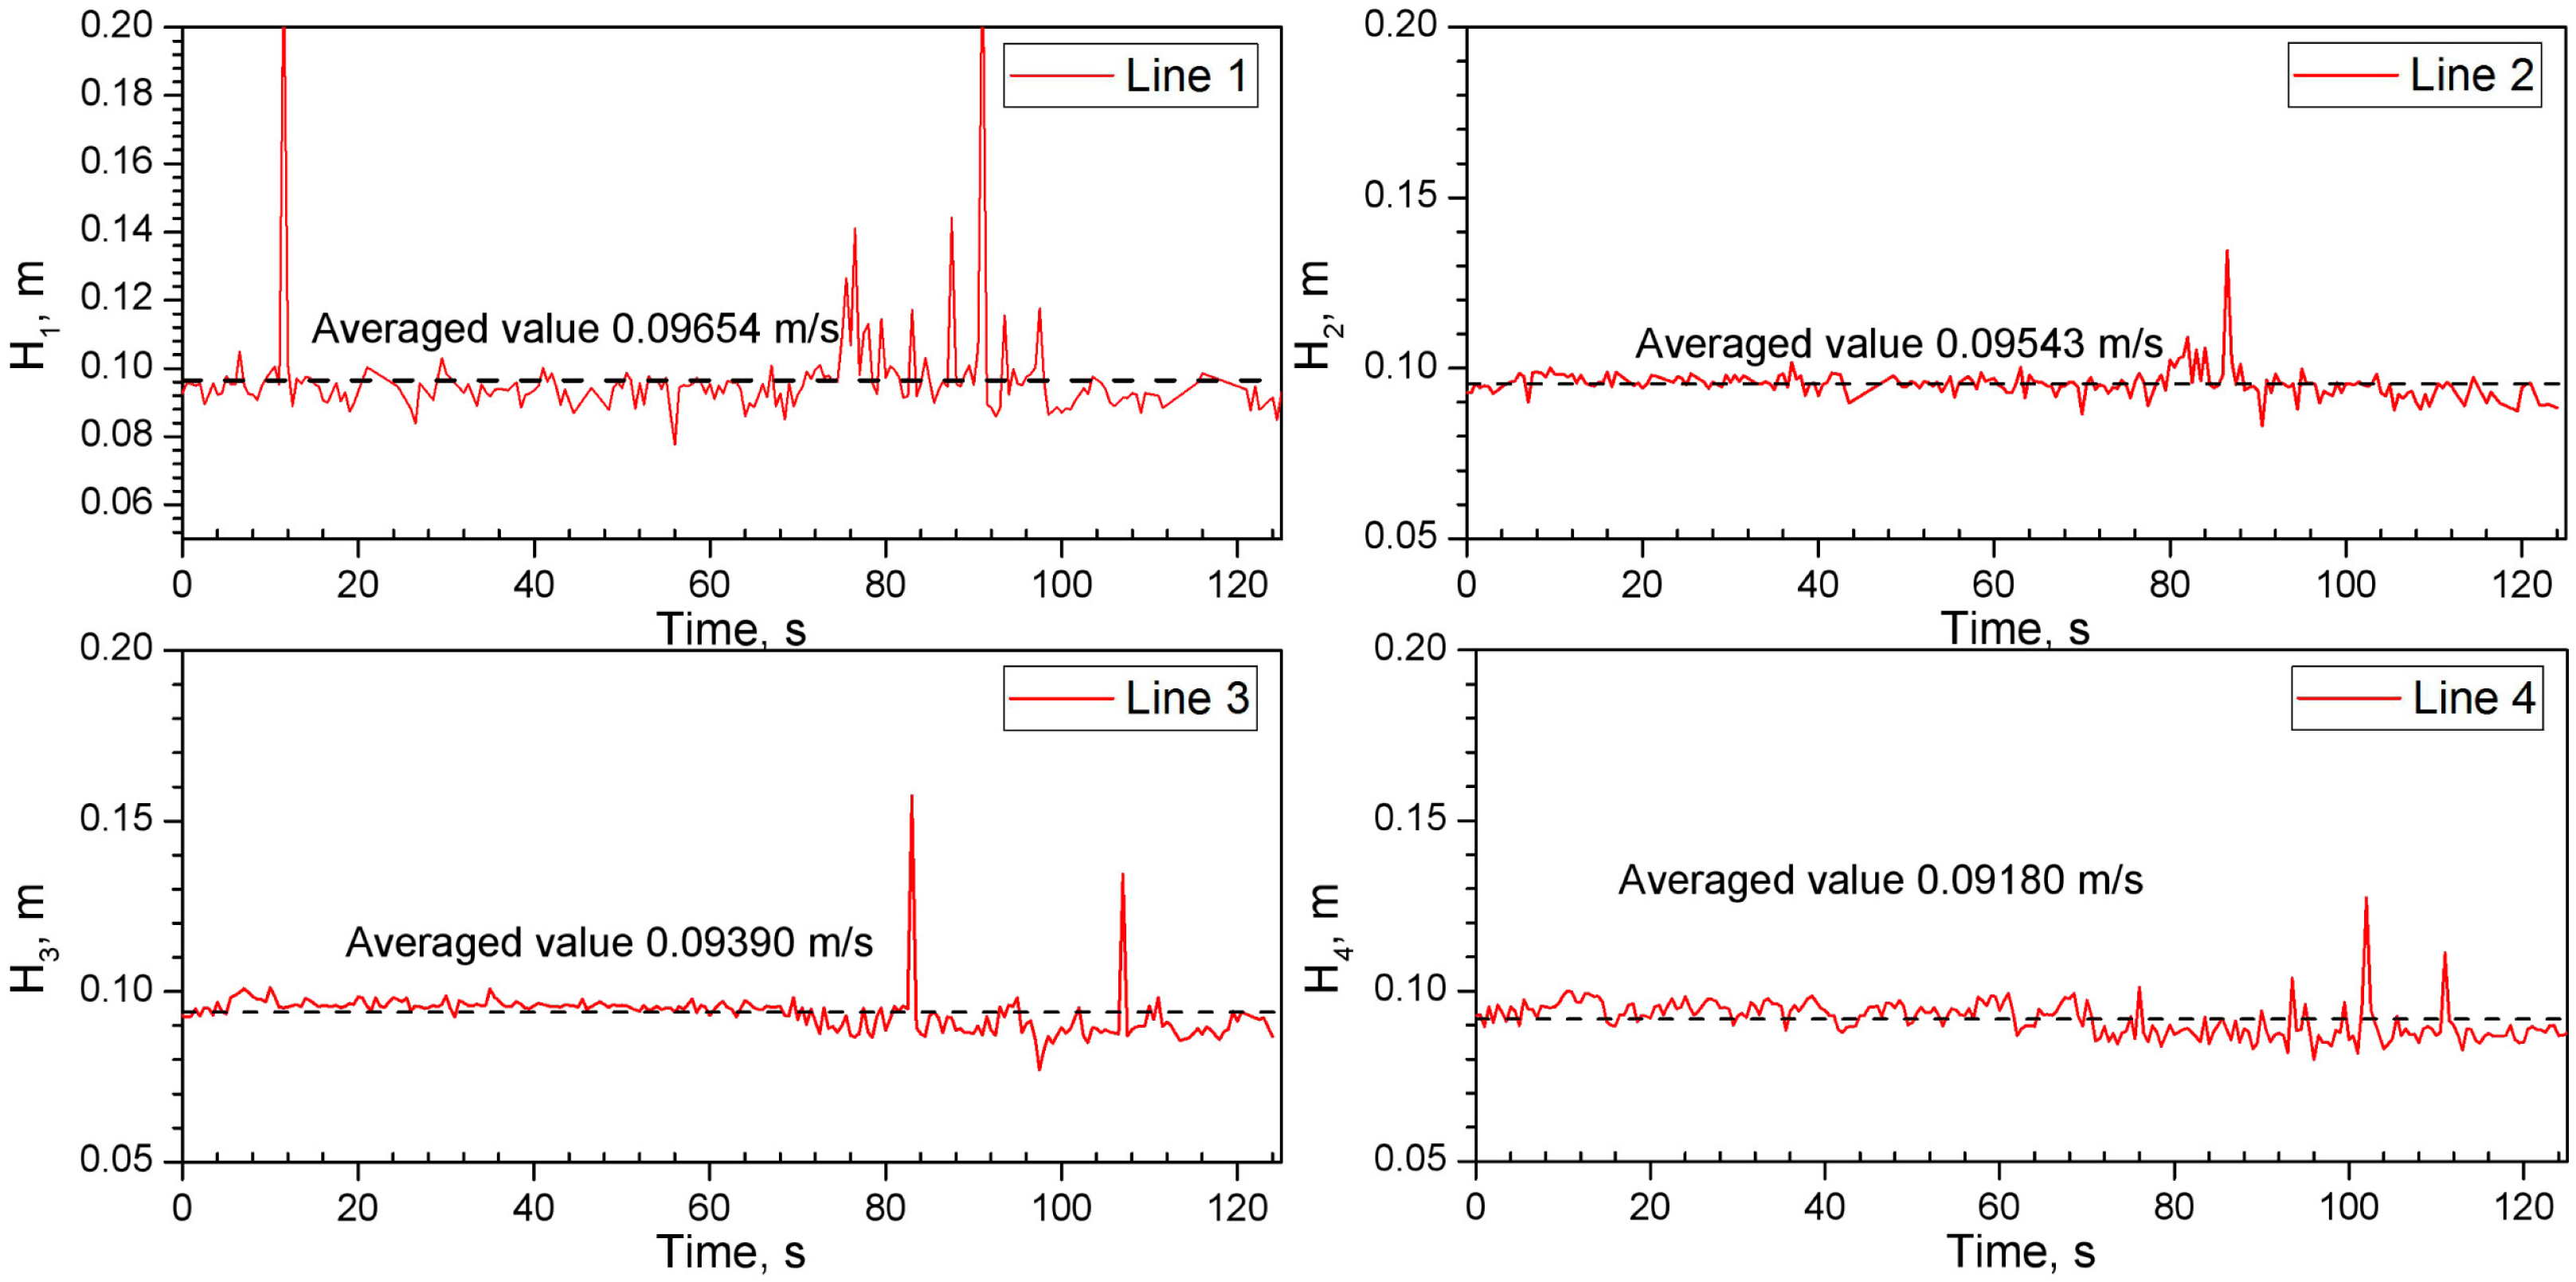
A new indicator Hi is defined to evaluate the slag entrapment in the mold. The area where slag entrapment is most likely to occur is within 1/4 of the wide face (named as 1/4 zone, near the nozzle) due to vortex formation. Then, it is the 2/4 zone, caused by shear-layer instability. The slag entrapment in the 4/4 zone have similar is caused by the meniscus fluctuation, and have similar fluctuation characteristics with the 3/4 zone.

Author Contributions

X.L. and B.L. conceived and designed the study; Z.L. helped to polish English language for this work; R.N. helped to give suggestions on modeling; Y.L., C.Z. and C.H. conducted the continuous casting process; H.Q. and T.Y. helped to capture the slag eyes in the steel plant, and gave suggestions on the structures of this work.

Funding

The authors are grateful for the support from National Natural Science Foundation of China (No. 51574068 and 51604070) and Young Elite Scientists Sponsorship Program by China Association for Science and Technology (CAST).

Conflicts of Interest

The authors declare no conflict of interest.

References

  1. Jowsa, J.; Bielnicki, M.; Cwudziński, A. Physical and numerical investigations of mould flux entrainment into Liquid Steel. Arch. Metall. Mater. 2017, 61, 2043–2050. [Google Scholar] [CrossRef]
  2. Hibbeler, L.C.; Thomas, B.G. Mold slag entrainment mechanisms in continuous casting molds. In Proceedings of the Iron and Steel Technology Conference (AIST), Pittsburgh, PA, USA, 6–9 May 2013. [Google Scholar]
  3. Zhang, L.F.; Yang, S.B.; Cai, K.K.; Li, J.Y.; Wan, X.G.; Thomas, B.G. Investigation of fluid flow and steel cleanliness in the continuous casting strand. Metal. Mater. Trans. B 2007, 38, 63–83. [Google Scholar] [CrossRef]
  4. Li, B.K.; Tsukihashi, F. Vortexing flow patterns in a water model of slab continuous casting mold. ISIJ Int. 2005, 45, 30–36. [Google Scholar] [CrossRef]
  5. Zheng, S.G.; Zhu, M. Study on mechanism of mould powder entrapment in funnel type mould of flexible thin slab casting machine. Ironmak. Steelmak. 2014, 41, 507–513. [Google Scholar] [CrossRef]
  6. Yamashita, S.; Iguchi, M. Mechanism of mold powder entrapment caused by large argon bubble in continuous casting mold. ISIJ Int. 2001, 41, 1529–1531. [Google Scholar] [CrossRef]
  7. Savolainen, J.; Fabritius, T.; Mattila, O. Effect of fluid physical properties on the emulsification. ISIJ Int. 2009, 49, 29–36. [Google Scholar] [CrossRef]
  8. Iguchi, M.; Yoshida, J.; Shimizu, T.; Mizuno, Y. Model study on the entrapment of mold powder into molten steel. ISIJ Int. 2000, 40, 685–691. [Google Scholar] [CrossRef]
  9. Hagemann, R.; Schwarze, R.; Heller, H.P.; Scheller, P.R. Model investigations on the stability of the steel-slag interface in continuous-casting process. Metall. Mater. Trans. B 2013, 44B, 80–90. [Google Scholar] [CrossRef]
  10. Scheller, P.R.; Hagemann, R. Model investigation on slag entrainment in continuous casting. Arch. Metall. Mater. 2012, 57, 283–289. [Google Scholar] [CrossRef]
  11. Yoshida, J.; Ohmi, T.; Iguchi, M. Cold model study of the effects of density difference and blockage factor on mold powder entrainment. ISIJ Int. 2006, 45, 1160–1164. [Google Scholar] [CrossRef]
  12. Kasai, N.; Iguchi, M. Water-model experiment on melting powder trapping by vortex in the continuous casting mold. ISIJ Int. 2007, 47, 982–987. [Google Scholar] [CrossRef]
  13. Bielnicki, M.; Jowsa, J. Physical modeling of mold slag entrainment in continuous steel casting mold with consideration the impact of mold powder layer. Steel Res. Int. 2018, 89, 1800110. [Google Scholar] [CrossRef]
  14. Saeedipour, M.; Puttinger, S.; Doppelhammer, N.; Pirker, S. Modelling slag entrainment in the continuous casting mold with LES-VOF simulations and comparison to a water/oil benchmark experiment. In Proceedings of the 9th European Continuous Casting Conference, Vienna, Austria, 26–29 June 2017. [Google Scholar]
  15. Chaudhary, R.; Thomas, B.G.; Vanka, S.P. Effect of electromagnetic ruler braking (EMBr) on transient turbulent flow in continuous slab casting using large eddy simulations. Metal. Mater. Trans. B 2012, 43B, 532–553. [Google Scholar] [CrossRef]
  16. Liu, Z.Q.; Li, B.K.; Jiang, M.F.; Tsukihashi, F. Modeling of transient two-phase flow in a continuous casting mold using Euler-Euler large eddy simulation scheme. ISIJ Int. 2013, 53, 484–492. [Google Scholar] [CrossRef]
  17. Liu, Z.Q.; Li, B.K.; Jiang, M.F.; Tsukihashi, F. Euler-Euler-Lagrangian modeling for two-phase flow and particle transport in continuous casting mold. ISIJ Int. 2014, 54, 1314–1323. [Google Scholar] [CrossRef]
  18. Liu, Z.Q.; Sun, Z.B.; Li, B.K. Modeling of quasi-four-phase flow in continuous casting mold using hybrid Eulerian and Lagrangian approach. Metal. Mater. Trans. B 2017, 48, 1248–1267. [Google Scholar] [CrossRef]
  19. Liu, Z.Q.; Li, B.K.; Vakhrushev, A.; Wu, M.H.; Ludwig, A. Physical and numerical modeling of exposed slag eye in continuous casting mold using Euler-Euler approach. Steel Res. Int. 2018. [Google Scholar] [CrossRef]
  20. Asad, A.; Kratzsch, C.; Schwarze, R. Numerical investigation of the free surface in a model mold. Steel Res. Int. 2016, 87, 181–190. [Google Scholar] [CrossRef]
  21. Li, X.L.; Li, B.K.; Liu, Z.Q.; Niu, R. Large eddy simulation of electromagnetic three-phase flow in a round bloom considering solidified shell. Steel Res. Int. 2018. [Google Scholar] [CrossRef]
  22. Li, X.L.; Li, B.K.; Liu, Z.Q.; Niu, R.; Liu, Q. In-situ analysis and numerical study of inclusion distribution in a vertical-bending caster. ISIJ Int. 2018, 58, 2052–2061. [Google Scholar] [CrossRef]
  23. Thomas, B.G.; Huang, X.; Sussman, R.C. Simulation of argon gas flow effects in a continuous slab caster. Metall. Mater. Trans. B 1994, 25B, 527–547. [Google Scholar] [CrossRef]
  24. Li, Y.; Cheng, C.G.; Yang, M.L.; Dong, Z.X.; Xue, Z.L. Behavior characteristics of argon bubbles on inner surface of upper tundish nozzle during argon blowing process. Metals 2018, 8, 590. [Google Scholar] [CrossRef]
  25. Saeedipour, M.; Puttinger, S.; Pirker, S. LES-VOF simulation of turbulent interfacial flow in the continuous casting mold. In Proceedings of the International Conference on Computational Fluid Dynamics in the Oil & Gas, Trondheim, Norway, 30 May–1 June 2017. [Google Scholar]
Figure 1. Geometry model and boundary conditions.
Metals 09 00007 g001
Figure 2. Bubble movements among different phases.
Metals 09 00007 g002
Figure 3. The slag eye on top surface: (a) on-site observations and (b) predicted results.
Metals 09 00007 g003
Figure 4. The morphology of the slag layer: (a) experimental observation [13], and (b) predicted result.
Metals 09 00007 g004
Figure 5. Predicted bubble distributions after (a) 55 s, (b) 56 s, (c) 57 s, (d) 58 s, (e) 59 s, and (f) 60 s.
Metals 09 00007 g005
Figure 6. The instantaneous flow field after (a) 55 s, (b) 56 s, (c) 57 s, (d) 58 s, (e) 59 s, and (f) 60 s.
Metals 09 00007 g006
Figure 7. Transient deformation of slag layer after (a) 76.5 s, (b) 77 s, (c) 77.05 s, and (d) 77.3 s.
Metals 09 00007 g007
Figure 8. Transient deformation of slag layer after (a) 36 s, (b) 36.3 s, (c) 36.4 s, and (d) 36.5 s.
Metals 09 00007 g008
Figure 9. Transient deformation of after (a) 101 s, (b) 101.5 s, (c) 102 s, and (d) 103 s.
Metals 09 00007 g009
Figure 10. The rendered 3-D flow field with streamlines after (a) 1364 s, (b) 1796 s, (c) 1820 s, (d) 2420 s, and (e) 3212 s.
Metals 09 00007 g010
Figure 11. Locations of four monitored lines.
Metals 09 00007 g011
Figure 12. The time series of the air–slag interface fluctuations at four typical positions of (a) line 1, (b) line 2, (c) line 3, and (d) line 4.
Metals 09 00007 g012
Figure 13. The time series of the slag–metal interface fluctuations at four typical positions of (a) line 1, (b) line 2, (c) line 3, and (d) line 4.
Metals 09 00007 g013
Table 1. Geometry and material properties for simulation.
ParametersValues
Cross-section of half slab (Width × Thickness), mm2525 × 237
Immersion depth of submerged entry nozzle, mm180
Mold height, mm900
Lengths of foot cooling and part of secondary cooling zone No. 1, mm110, 740
Thickness of air phase, mm20
Thickness of slag layer, mm70
Casting speed, m/min1.7
Opening angle °20°downward
Dynamic viscosity of steel, slag and the air, kg/(m·s)0.0051, 0.239, 1.7894e-05
Density of molten steel, slag, and argon bubbles, kg/m37100, 3000, 1.78
Interfacial tension force, N/m1.2

