Article

Nitrogen Solubility in Liquid Ni-V, Ni-Ta, Ni-Cr-V, and Ni-Cr-Ta Alloys

1
Institute of Metal Research, Chinese Academy of Sciences, Shenyang 110016, China
2
School of Materials Science and Engineering, University of Science and Technology of China, Hefei 230026, China
*
Authors to whom correspondence should be addressed.
Metals 2019, 9(11), 1184; https://doi.org/10.3390/met9111184
Submission received: 13 October 2019 / Revised: 25 October 2019 / Accepted: 31 October 2019 / Published: 2 November 2019

Abstract

:
An investigation has been made concerning the solubility of nitrogen in liquid binary alloys (Ni-V and Ni-Ta) and ternary alloys (Ni-Cr-V and Ni-Cr-Ta) by sampling method. The experiments were carried out in the temperature range from 1773 K to 1873 K and under the nitrogen partial pressure up to 1.0 bar. A technique involving induction melting and a rapid quench device has been used in this study. It has been found that Sieverts’ law successfully describes the nitrogen dissolution in all these liquid alloys up to 1.0 bar of nitrogen gas partial pressure. The additions of vanadium, tantalum and chromium significantly increase the nitrogen solubility, especially vanadium-alloying addition. Furthermore, we have determined the interaction parameters, enthalpies and entropies of nitrogen dissolution in these liquid alloys.

1. Introduction

Nitrogen has consistently emerged as one of typical gaseous impurity elements in nickel-based super-alloys that generally imparts negative influences on mechanical properties of these alloys [1,2,3,4]. In particular, small amounts of nitrogen can be very deleterious [5]. For instance, the dissolved nitrogen can segregate with the decrease of the nitrogen solubility during the solidification, subsequently, nitride inclusions and nitrogen bubbles may be produced, which are harmful to the creep and fatigue properties. Therefore, residual concentration of this element should be accurately controlled in the smelting process. It is of significant importance for both research and industry to get the information on the extent of the nitrogen solubility over specific ranges of gas pressure and temperature [6]. In addition, the activity coefficients and interaction parameters of nitrogen in liquid metal are highly indispensable to thermodynamic analysis of the relevant metallurgical reactions. So far, the method of investigating the solubility of a non-metallic impurity element (i.e., nitrogen, oxygen, sulfur, etc.) in metal melt in presence of a third element has been widely applied to determine the interaction parameters [7,8].
Extensive investigations have been made on the effects of alloying elements on the solubility of nitrogen in liquid iron and iron-based alloys, and a considerable background of knowledge has been built up [9,10,11,12,13]. Nevertheless, a small number of studies have been performed on the nitrogen solubility in liquid nickel [14,15,16,17]. Particularly, less investigations were concerned with measurements of the solubility of nitrogen in liquid nickel-based alloys. There have been only a few researches on the binary Ni-X alloys (X = Ti, Cr, Mn, Fe, Co, Mo, W, Si, Al), and ternary alloy (Ni-Cr-Co, Ni-Cr-Mo, Ni-Cr-Mn, Ni-Cr-Si) [18,19,20]. However, up to date no high-temperature solubility values of nitrogen in liquid nickel containing tantalum and vanadium are available in literature. In addition, very few studies have reported the solubility of nitrogen in liquid cobalt-based and chromium-based alloys, especially in chromium-based alloys [11]. The chromium-based alloys have attracted much attention because of their great potential in applications of high-temperature structural materials [21], and chromium-based alloys are more significantly impacted by nitrogen compared to nickel-based alloys [22,23].
Vanadium and tantalum are group VB elements which are both essential components of some nickel-based super-alloys. Vanadium is usually added to nickel-based super-alloys to improve physical properties such as notch ductility and hot workability. Moreover, tantalum is becoming increasingly important as the strengthening element for nickel-based super-alloys, especially for single crystal super-alloys. Experimental results showed that tantalum segregates in γ’ phase, which can improve the solvus temperature and strength of the γ’ phase, and tantalum addition not only enhances hot corrosion resistance but also improves thermal fatigue property [24,25]. Furthermore, it is to be noted that vanadium and tantalum are both strong nitride formers [26,27].
In view of the substantial requirements of thermodynamic data, it is necessary to investigate the effects of alloying elements (V and Ta) on the nitrogen solubility in liquid nickel. As stated earlier, the mechanical properties of nickel-based super-alloys are particularly sensitive to the presence of nitrogen. It is therefore important to evaluate quantitatively the affinity of the metal for nitrogen. Thermodynamic data concerning the dissolution of nitrogen in the liquid phase would help define the conditions where the gaseous impurities can be removed. Although the thermodynamics of the equilibrium between tantalum, vanadium and nitrogen in liquid nickel is especially important, few direct investigations have been conducted at different pressures and temperatures. The present work seeks to provide such data by studying the equilibrium reactions of vanadium, and tantalum with nitrogen in liquid nickel.
The object of this study is to determine the effects of vanadium and tantalum on the nitrogen solubility in liquid nickel, to study Sieverts’ law behavior for liquid Ni-V, Ni-Ta, Ni-Cr-V, and Ni-Cr-Ta alloys, and to determine the effects of vanadium and tantalum additions on the activity coefficients of nitrogen and the interaction parameters in these alloys. It is expected that the obtained thermodynamic data would form a base for building a thermodynamic model serving for the determination of the nitrogen solubility in nickel-based super-alloys. Meanwhile, this study provides a reference for other alloy systems, especially those considered for future technology as beyond nickel-based supper-alloys, such as chromium-based alloys.

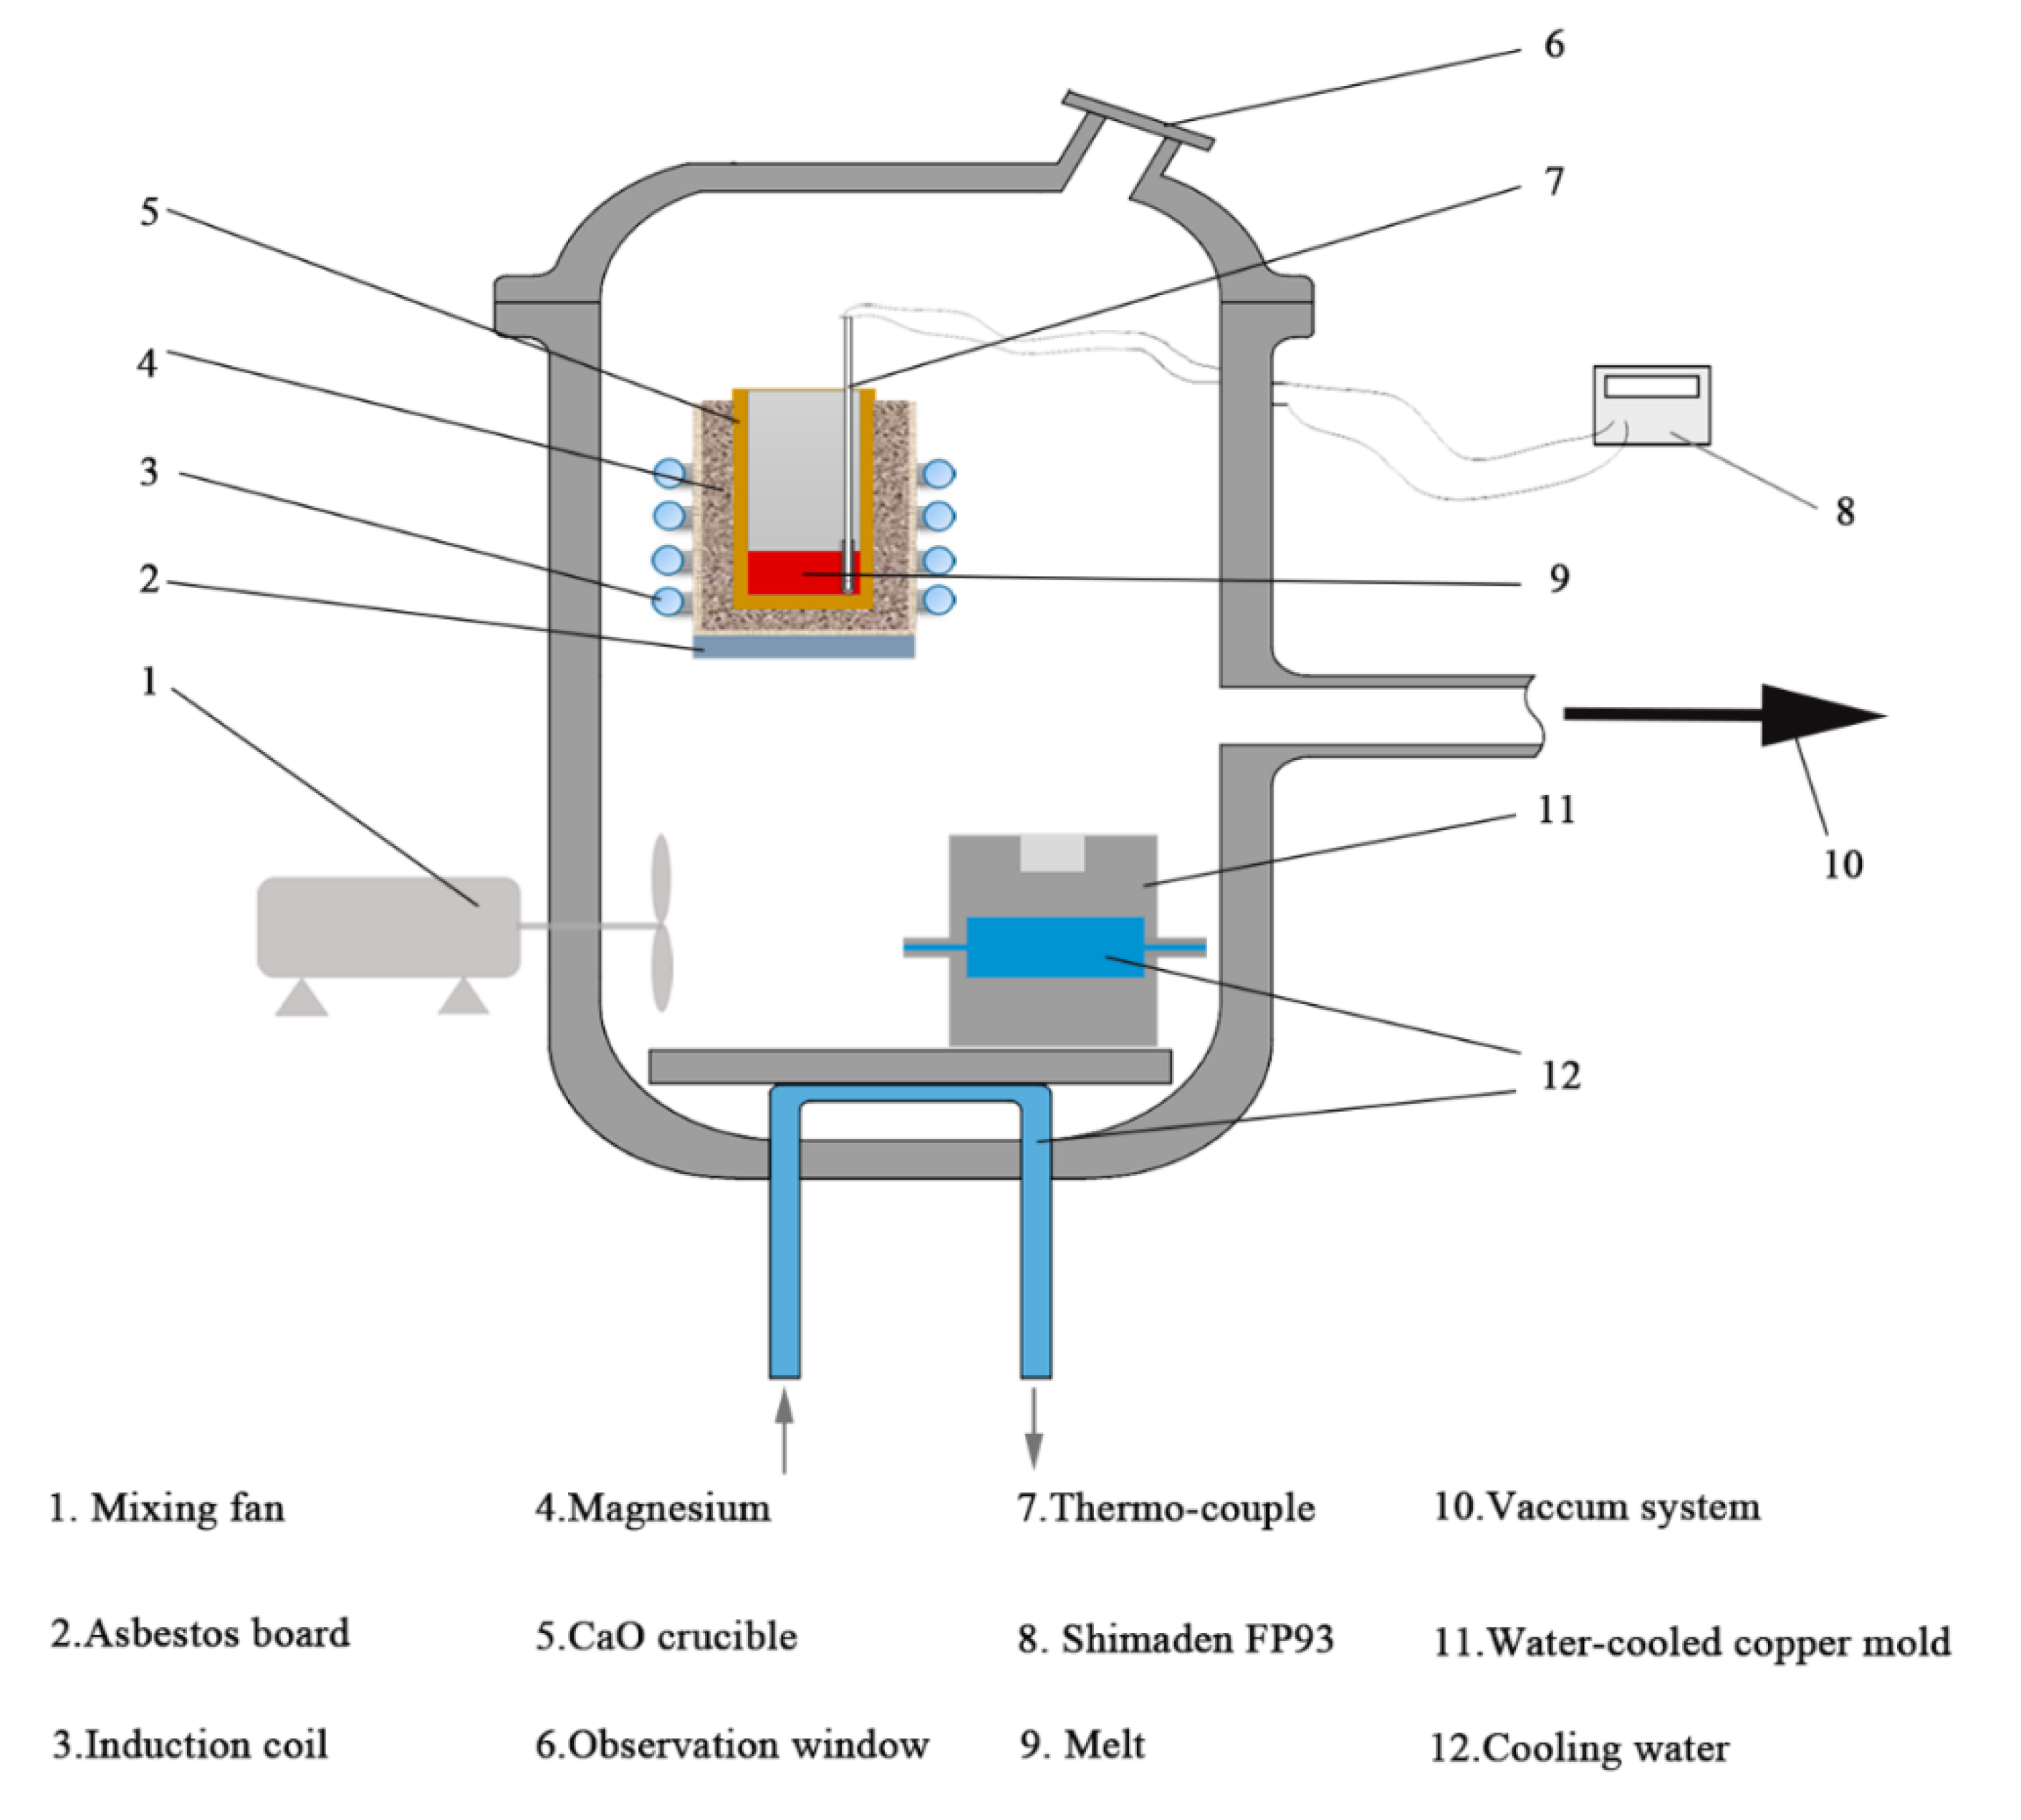
2. Materials and Methods

This investigation was conducted by means of sampling methods, and the equilibrate-quench-analyze technique has been used to measure the nitrogen solubility in nickel-based alloys over the temperature range from 1773 K to 1873 K. On the basis of previous investigations of the nitrogen solubility in liquid Ni, Ni-Cr and iron-based alloys, we have developed a special induction furnace at our laboratory, as shown in Figure 1.
Master alloys were prepared in a vacuum induction melting furnace (Sante vacuum technology Co., Ltd, Shenyang, China) to reduce the burning loss of alloy elements and the initial amount of dissolved gas. The raw materials were electrolytic nickel, electrolytic chromium, electrolytic vanadium, and electron beam tantalum (CTTIC Jinzhou Metal. Co., Ltd, Jinzhou, China), Table 1 compiles the purity of metallic raw materials used in this study. Moreover, high-purity purity argon (99.999 wt pct pure) and nitrogen gases (99.999 wt pct pure) (Dalian Special Gases Co., Ltd, Dalian, China) were used to minimize any contamination risk.
In each experiment, 100 g of specimen was contained in a CaO (ϕ 50 mm × 40 mm × 60 mmH) (Shenyang Kejin Special Material Co., Ltd, Shenyang, China) ceramic crucible and melted using a 200 kHz and up to 35 kW induction power supply (Shenzhen Shuangpin Technology Co., Ltd., Shenzhen, China). Before each run the furnace was evacuated to 0.05 Pa. Then, the specimen was heated slowly and held under vacuum conditions to remove adsorbed gases. However, in order to avoid evaporation of vanadium and tantalum, no vacuum degassing was done in the molten state. Therefore, the furnace would be filled with high-purity nitrogen and argon so as to give the desired pressure after melting the charge. The pressure in the system was measured and controlled by an IFM PG2453 pressure sensor (Ifm Electronic gmbh, Essen, Germany), and the total pressure of the mixture was always 1.0 bar. In addition, the gas proportion was controlled by two mass flow controllers, and the gases in the reaction chamber were well mixed by a stirring fan (Twin City Fan Co., Ltd., Minneapolis, MN, USA).
CaO crucibles were used throughout the whole experiment with no signs of crucible-melt reaction. Melt temperatures were measured by immersing a thermocouple (Pt–30%Rh/Pt–6%Rh) (OMEGA Engineering inc., Shanghai, China) contained in a protective zirconia sheath into the melt. After reaching the target temperature, the temperature was controlled by a Shimaden FP93 PID brainpower temperature controller (Shimaden Co., Ltd., Tokyo, Japan), which offered more accurate temperature controller. At the end of a run, the melt was quenched in a water-cooled copper mould. Specimens from all the experiments were observed to be free from blowholes, which indicated that the melts were cooling with a satisfactory cooling rate.
Moreover, a series of preliminary experiments were performed in order to determine the optimum time required, for the specimen to reach equilibrium with the nitrogen atmosphere. The starting time (t = 0) was defined as the time point where the metallic charge was completely molten, and sampling was performed at the six holding times: 0, 15, 30, 45, 60, 90, and 120 min.
Specimens were processed into ϕ 4 mm × 30 mm bars, and the chemical analysis for nitrogen concentration was carried out by a LECO TCH-600T oxygen-nitrogen-hydrogen analysis instrument (LECO Corporation, Joseph, MI, USA) with a precision of 0.025 ppm or 0.3% RSD. Each specimen was analyzed three times, and the reproducibility of the chemical analyses was good. Table 2 shows the chemical composition of the alloys used in this study, where Ni-7.01V means the alloy contains 7.01 wt pct vanadium.

3. Results

Nitrides have not been observed in liquid nickel-based alloys over nitrogen range from 0.1 to 1.0 bar during melting processes. The dissolution of nitrogen in molten nickel and nickel-based alloy can be expressed as follows [28]:
1 2 N 2 ( g ) = [ N ]
From Equation (1), the equilibrium constant K of the dissolution reaction can be further expressed as:
K = a N p N 2 = f N ( w t   p c t   N ) p N 2
where a N and f N are the activity and the activity coefficient of nitrogen in the melt, respectively, wt pct N is nitrogen dissolution in weight percent, and p N 2 is the partial pressure of nitrogen in the gas phase.
According to Sieverts’ Law, the solubility of the diatomic nitrogen gas in liquid melts is proportional to the square root of its partial pressure, which can be expressed as [29,30]:
w t   p c t   N = K S p N 2
where KS is the Sieverts’ constant that represents the nitrogen concentration at 1.0 bar nitrogen pressure [16].

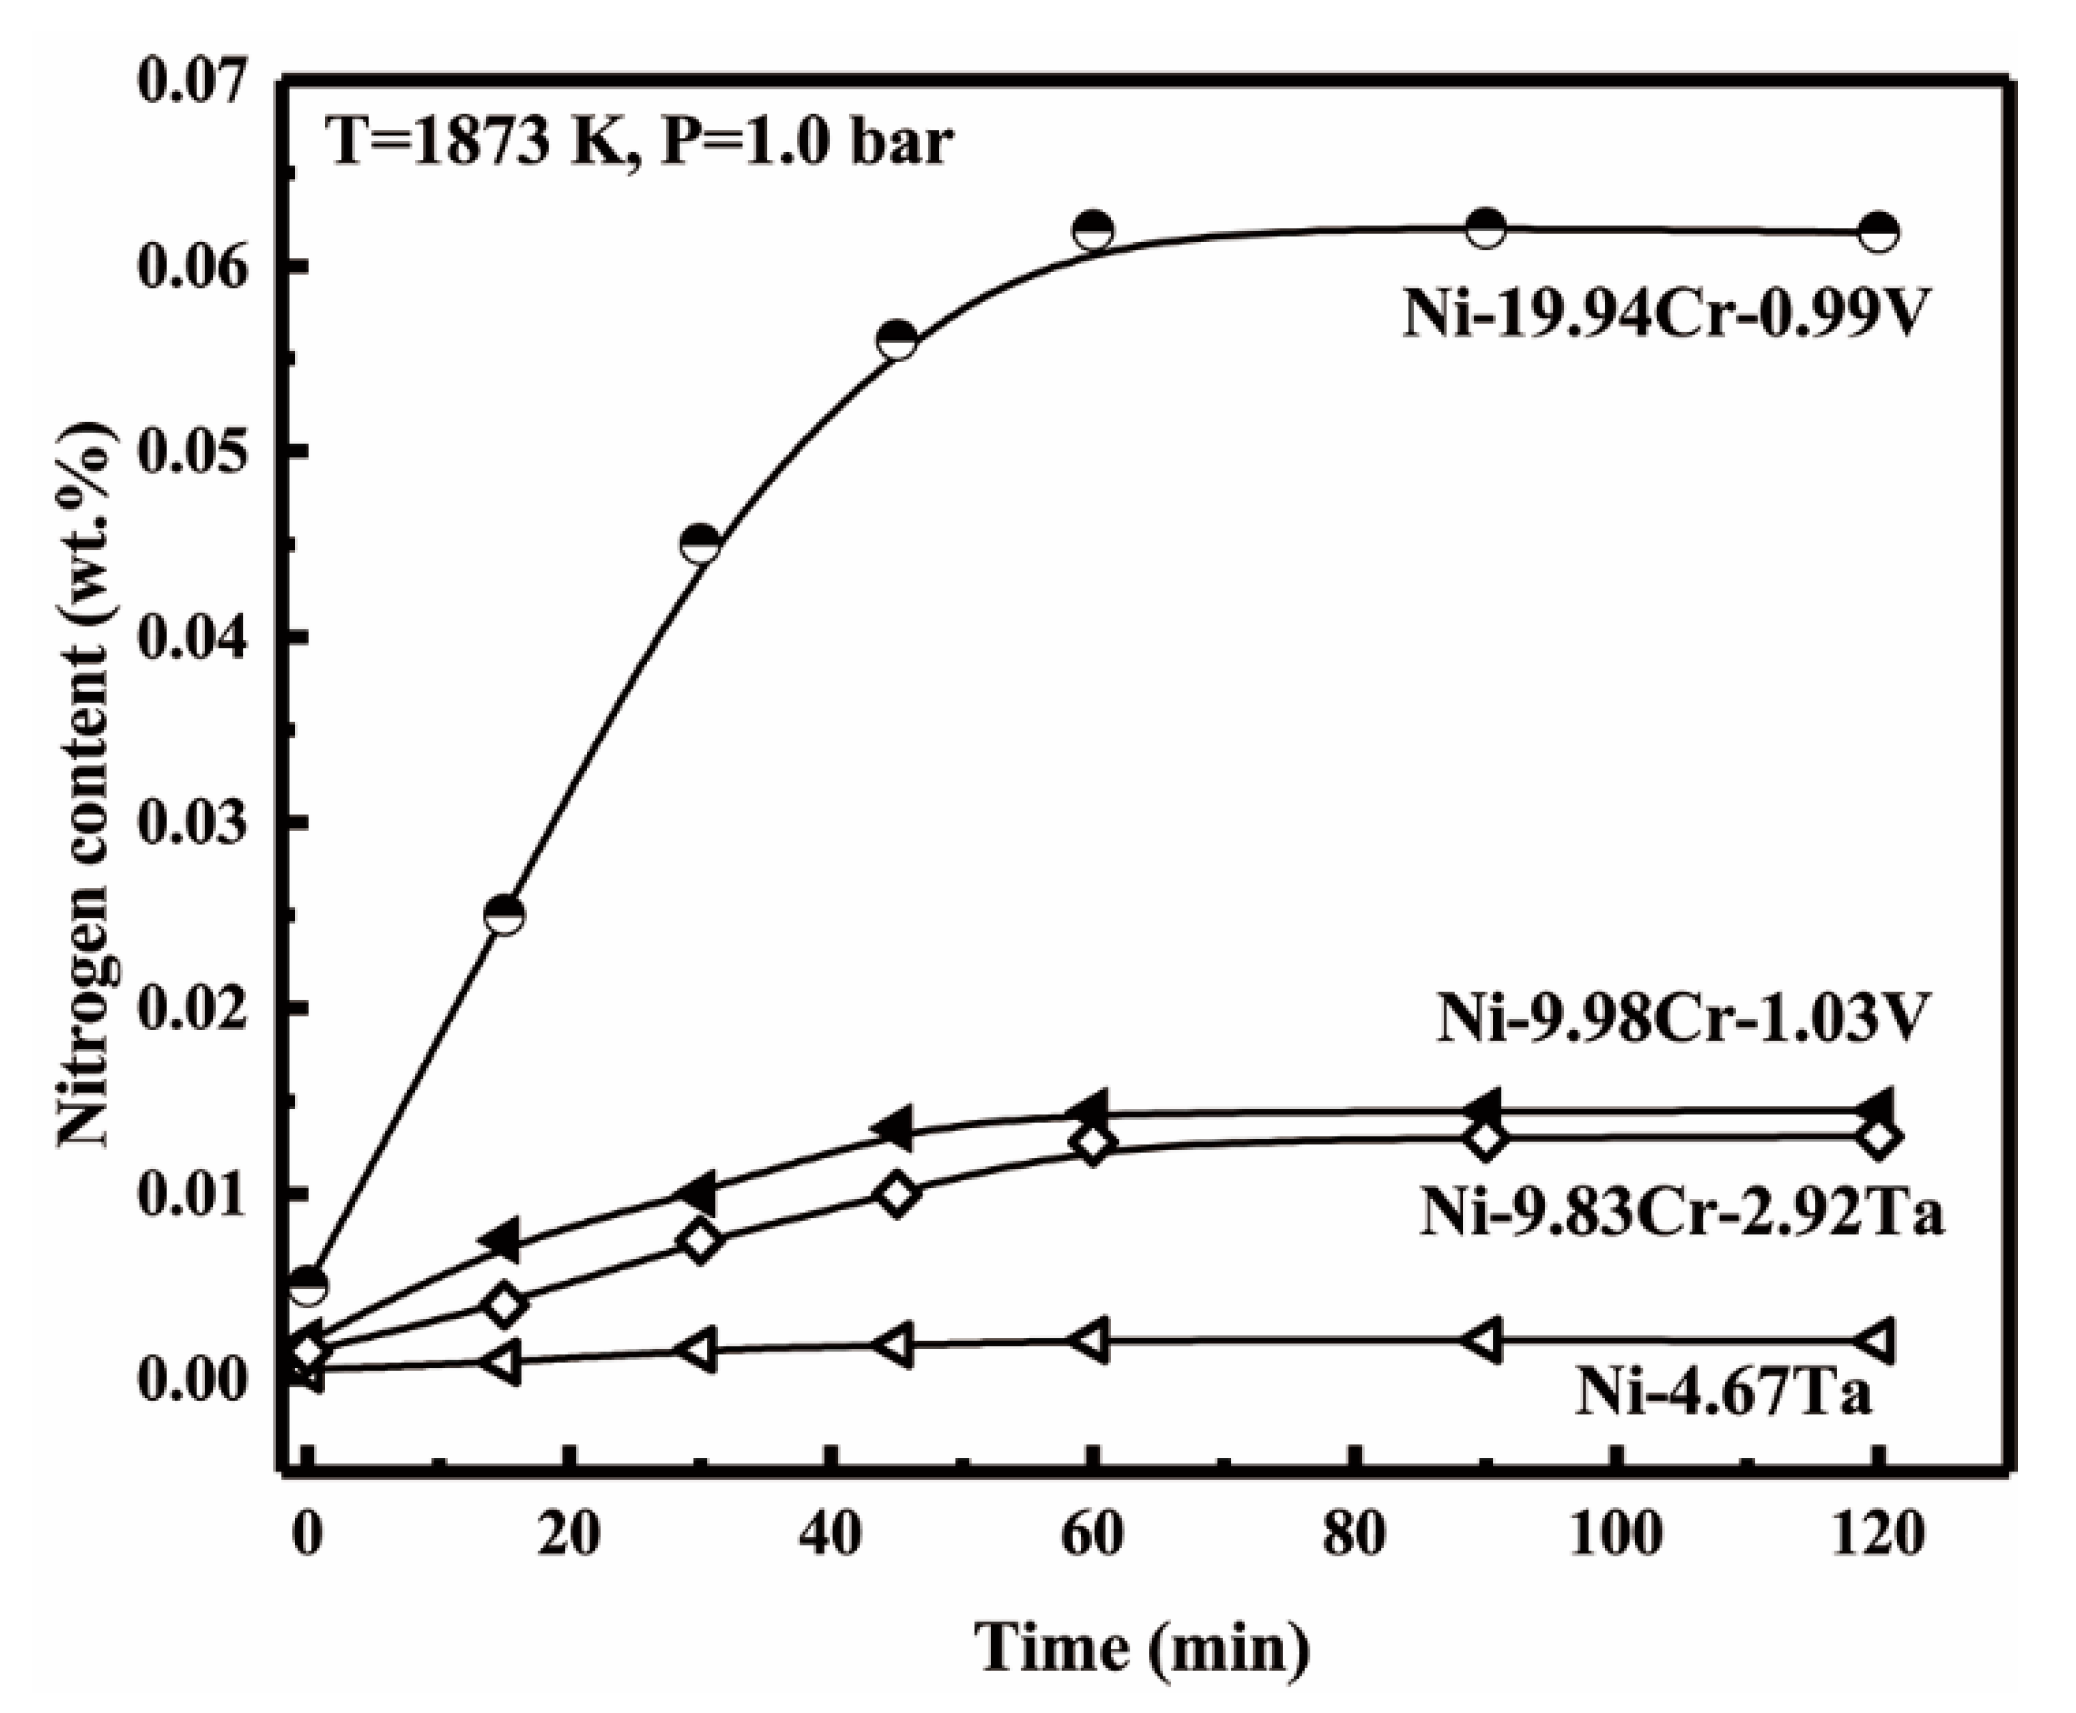
3.1. Equilibrium Time

Figure 2 shows the results for the variation of nitrogen content with holding time. It is clear that nitrogen contents increase with time and rapidly increase within the first 30 min, and reach the saturated value after 60 min in all composition conditions. For this reason, during an actual experiment, melts generally were equilibrated with the gas phase for 90 min and then quenched.

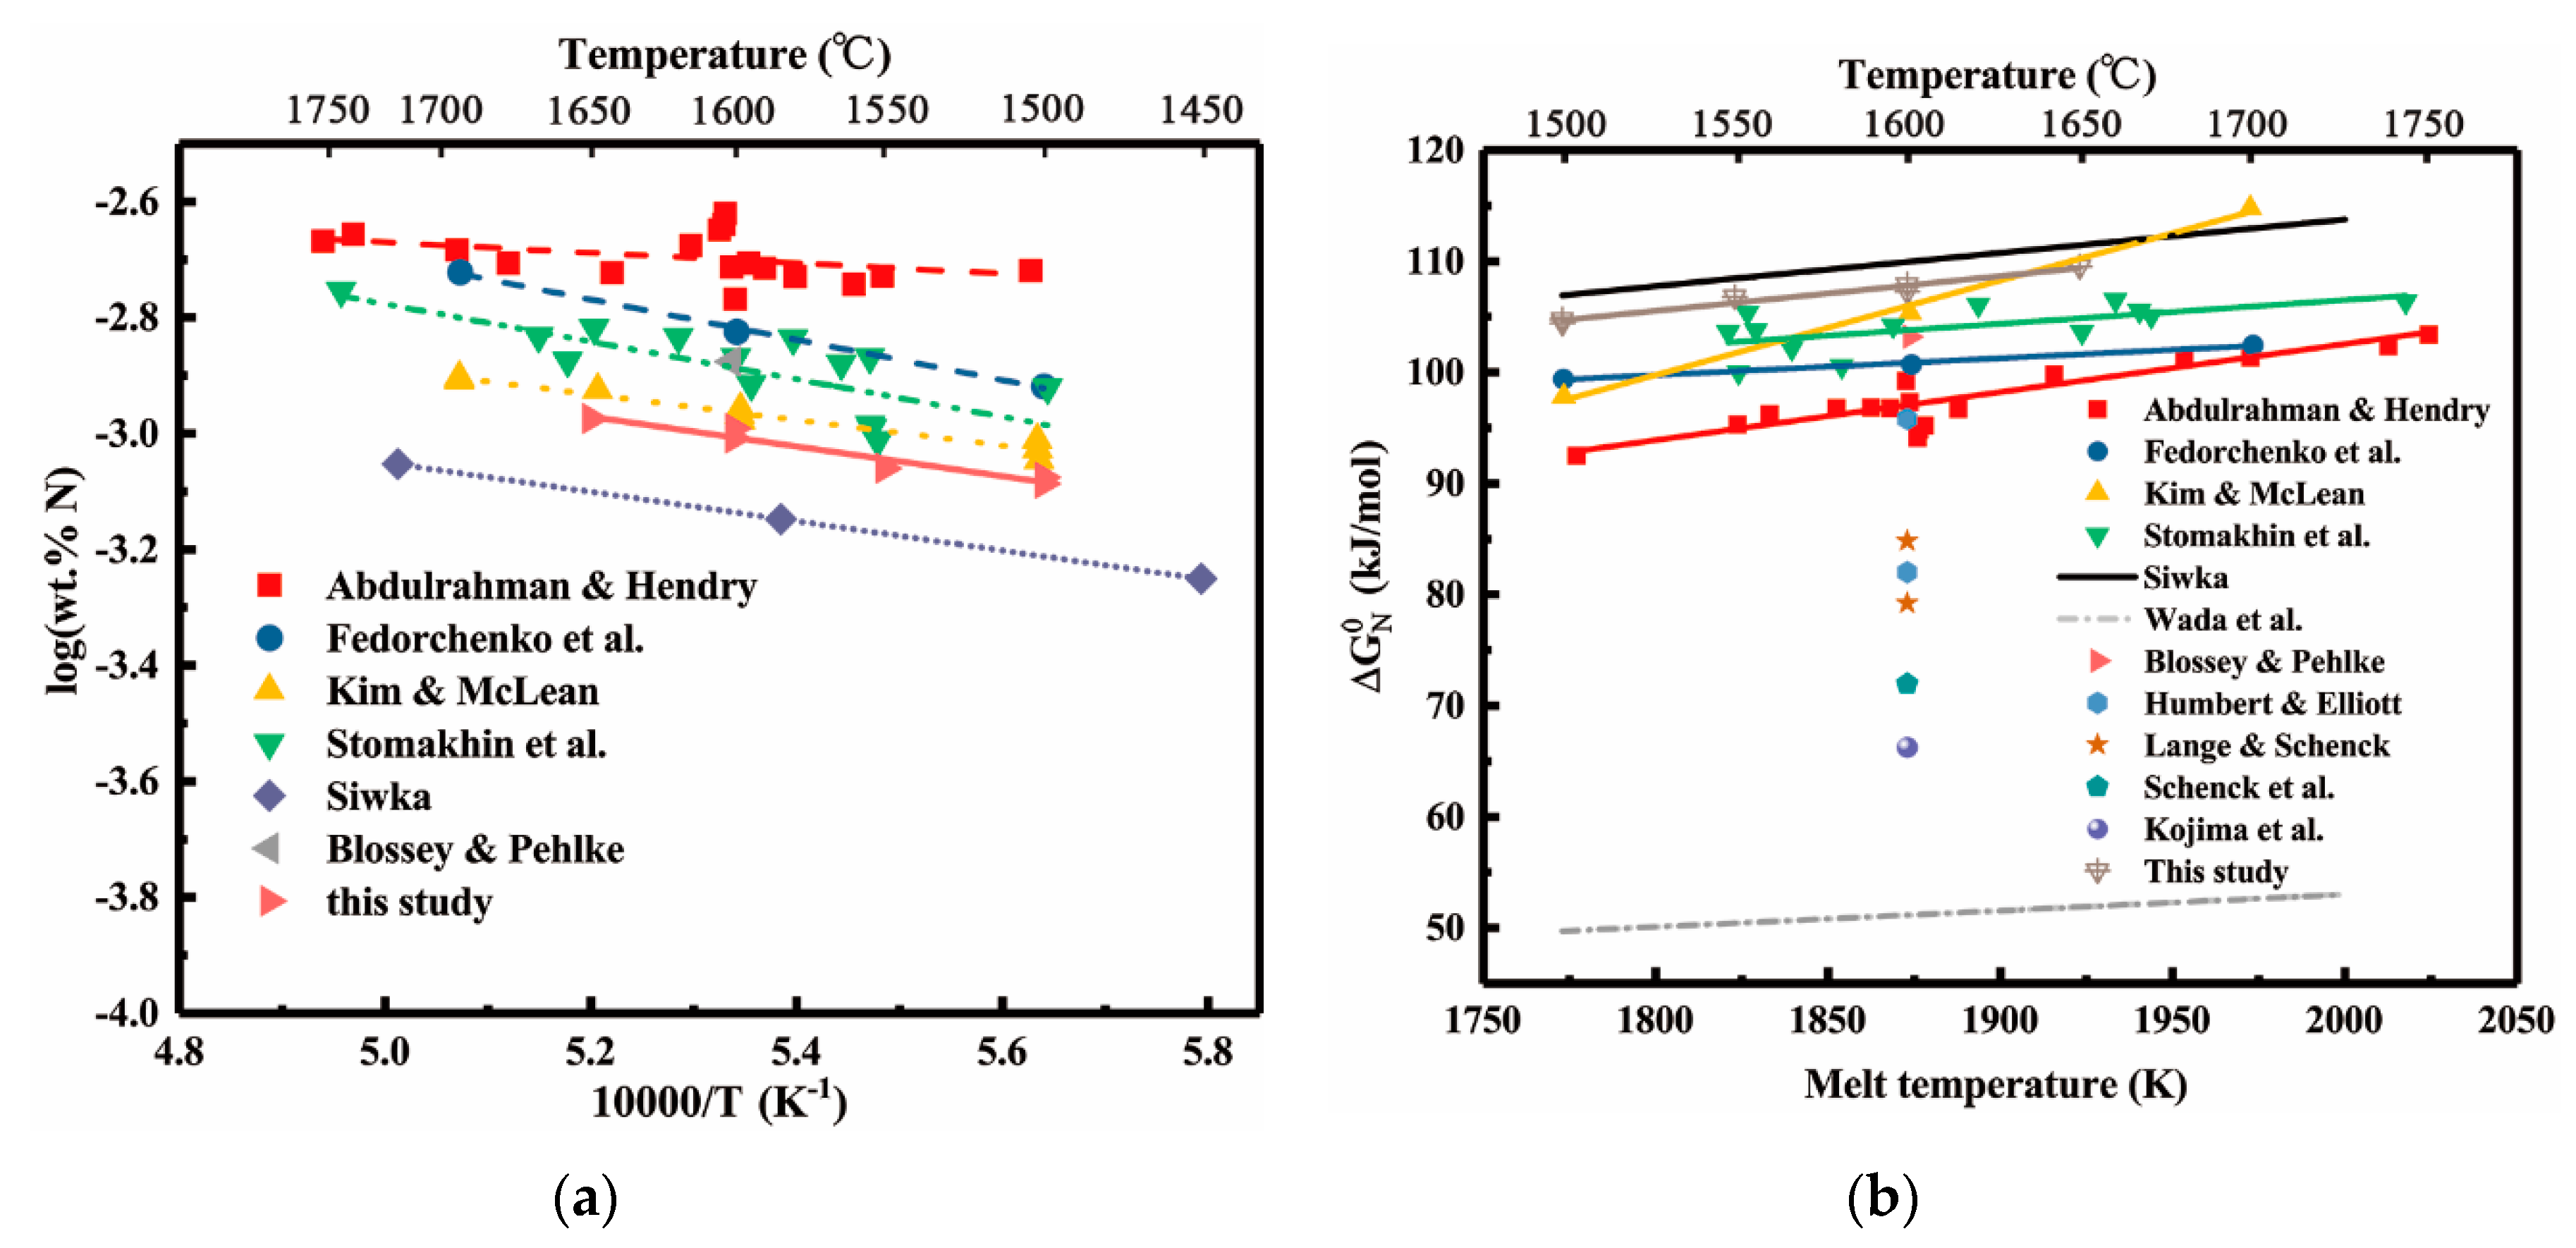
3.2. Nitrogen Dissolution in Liquid Pure Nickel

There are two types of basic methods for investigating the nitrogen solubility in liquid metal melts, which are the Sieverts’ and sampling method. In most of the reported literature, the works were carried out by employing variations of these two basic methods. The Sieverts’ method, in which the amount of nitrogen required to saturate a given mass of liquid metal at a particular temperature or pressure is measured volumetrically, and the sampling method, in which the melt is equilibrated with a nitrogen atmosphere, and samples drawn from the melt are quenched and analyzed. Compared with the latter, the former has many disadvantages [31]. In addition, with great progress in the analysis devices, sampling method is getting more common where the samples are taken from the molten alloys after attaining solubility and nitrogen content is measured by an inert gas fusion method.
The method and apparatus for this study were checked by measuring the solubility of nitrogen in pure nickel over the temperature range from 1773 to 1923 K. Therefore, the nitrogen solubility in liquid pure nickel was determined, which is the basis for further research. The standard Gibbs free energy of nitrogen dissolution in liquid pure nickel is:
Δ G N 0 = Δ H N 0 T Δ S N 0
and also:
Δ H N 0 T Δ S N 0 = R T ln K
where Δ G N 0 , Δ H N 0 and Δ S N 0 are the standard Gibbs free energy, enthalpy and entropy of nitrogen dissolution in liquid nickel, respectively. With converting the natural logarithms into common logarithms and taking a specific value of the gas constant (R = 8.3145 J/(K mol)), Equation (5) can be further expressed in the particular form, as follows:
log K = Δ H N 0 19.145 × 1 T + Δ S N 0 19.145
Figure 3a illustrates the effect of temperatures on the solubility of nitrogen in liquid pure nickel which was determined by a number of investigators [14,15,32,33,34,35]. It turned out that the nitrogen content did not change significantly with increasing temperature. Meanwhile, it can be observed that the data of the nitrogen solubility in liquid pure nickel is a relatively concentrated distribution. The experimental results of this study for the nitrogen solubility in liquid nickel were determined by a regression analysis of the data as:
log ( w t   p c t   N ) N i = 2566 / T 1.64
The Gibbs free energy of dissolution of nitrogen in liquid pure nickel is then:
Δ G N ( N i ) 0 = 49.1 + 31.4 × 10 3 T   kJ / mol
As stated earlier, the solubility of nitrogen in liquid nickel has been measured by a number of groups. Their results expressed in terms of Δ G N ( N i ) 0 are summarized in Figure 3b. It shows that the reported values at 1873 K range from 55 kJ /mol to 110 kJ/mol. In our current studies, the value of Δ G N 0 has been determined to be 108 kJ/mol at 1873 K, which is in good agreement with these reported by Abdulrahman et al. [14], Fedorchenko et al. [32], Kim et al. [33], Stomakhin et al. [34], Siwka [15] and Blossey et al. [35]. However, the data of Kojima et al. [36], Lang et al. [37], Wada et al. [38] and Schenck et al. [17] at 1873 K are much lower than our reported value. Meanwhile, the solubility of nitrogen in liquid pure nickel is very low and the temperature dependencies of solubility are all positive. The solubility data corrected to 1.0 bar nitrogen partial pressure are summarized in Table 3.
The nitrogen solubility in liquid nickel at 1873 K ranges from 0.0009 wt pct to 0.0025 wt pct upon different experimental measurements. The nitrogen content of nickel at 1873 K and 1.0 bar nitrogen partial pressure is determined to be 0.0010 wt pct in this study, which is in reasonable agreement with those reported by other investigators using sampling and levitation methods, and slightly smaller than those reported by other authors using Sieverts’ method. It has been found that the solubility values are lower in the measurements by the sampling method than those by the Sieverts’ method as summarized in Table 3, especially recently reported data. The rationality of this experimental method was proved. Therefore, this investigation was undertaken using the sampling method to get more reliable data of the nitrogen solubility in liquid pure nickel and nickel-based alloys.

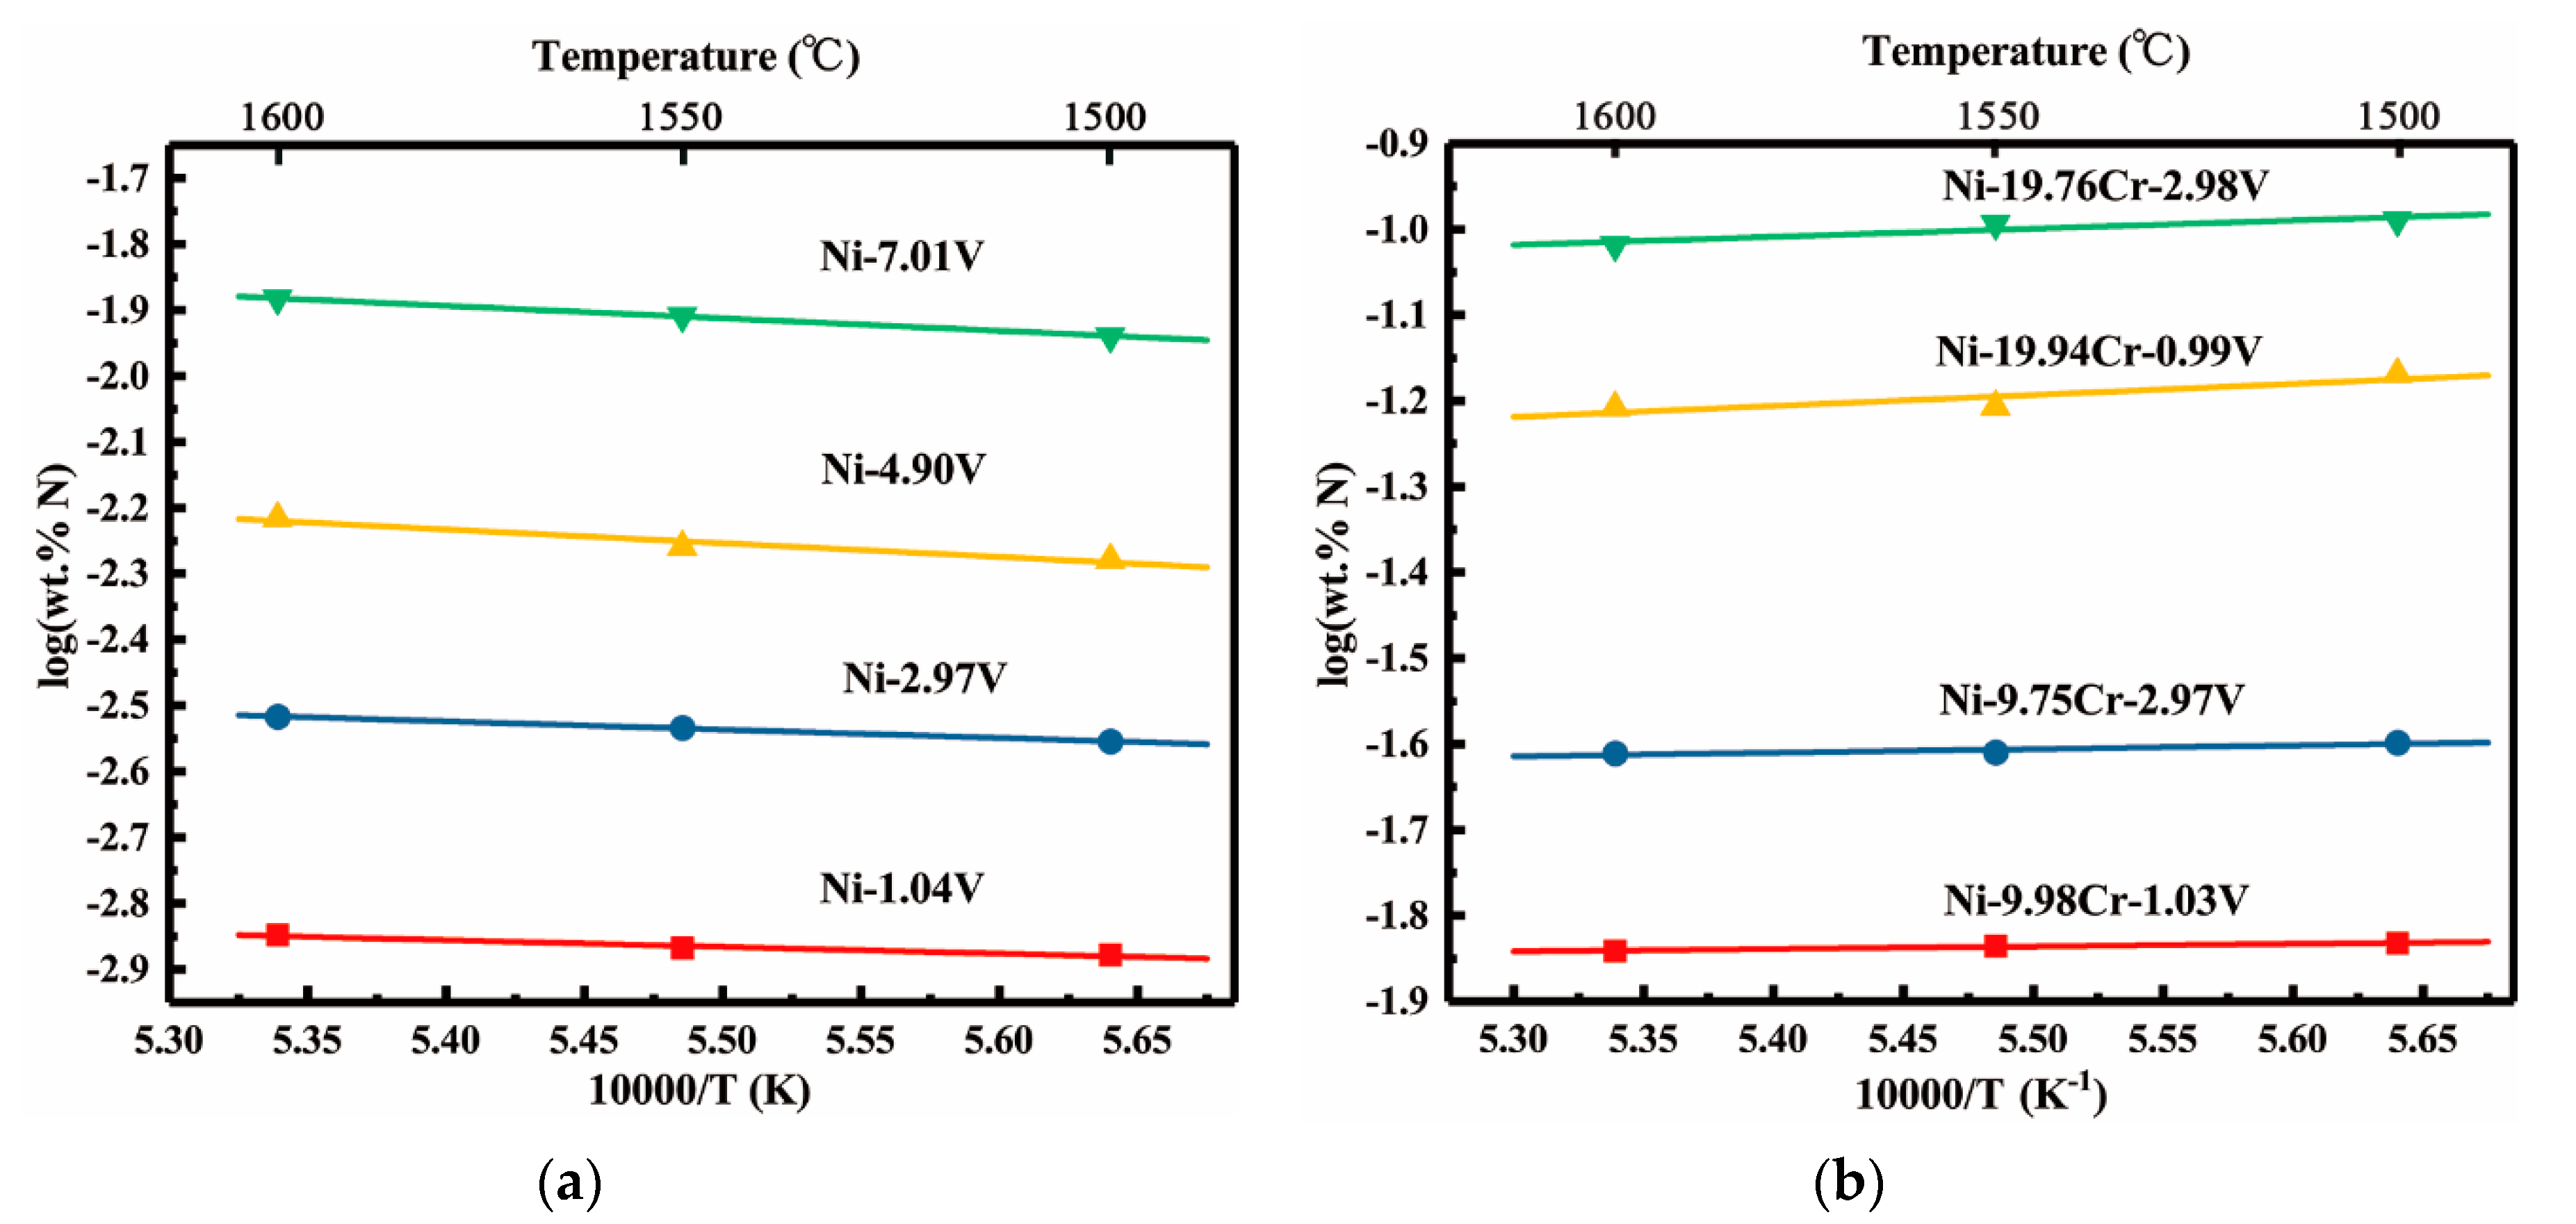
3.3. Solubility of Nitrogen in Liquid Ni-V, Ni-Cr-V Alloys

The solubility of nitrogen in liquid Ni-V alloys was measured by a sampling method at nitrogen partial pressures over a range from 0.1 to 1.0 bar. The results are shown in Figure 4a. The validity of Sieverts’ law is confirmed by means of linear regression analysis using the square of the Pearson’s correlation coefficient r2. The validity of Sieverts’ law is approved, if +0.97 ≤ r2 ≤ +1.00 in Table 4 [16]. It can also be observed that the nitrogen solubility significantly increases with the increase of vanadium content.
Figure 4b shows the results for the effect of nitrogen partial pressure on the solubility of nitrogen in Ni-Cr-V alloys. The solubility of nitrogen in liquid Ni-Cr-V alloys at 1873 K has been found to increase linearly with the square root of nitrogen partial pressure in the experimental pressure range, so the validity of Sieverts’ law is demonstrated. In addition, the solubility of nitrogen increases with the increase of chromium and vanadium content.
Figure 5 shows the results of nitrogen solubility obtained at 1.0 bar nitrogen partial pressure for the Ni-V and Ni-Cr-V alloys, respectively. For Ni-V alloys, the solubility of nitrogen markedly increases with the increase of vanadium content, and increases with the rise of temperature, especially at higher concentration of vanadium, which illustrates that nitrogen dissolution is an endothermic process in Ni-V alloys. In addition, this trend increases with increasing vanadium concentration. With respect to Ni-Cr-V alloys, the nitrogen solubility rapidly increases with increasing of vanadium and chromium content. Meanwhile, the temperature coefficients for the chromium-containing alloys are all negative, which is in contrast with earlier observations for Ni-V alloys. Also, the coefficients become larger in absolute magnitude with increasing chromium content. It needs to be emphasized that Wada et al. [41] and Abdulrahman et al. [18] observed that the nitrogen solubility decreases with the rise of temperature in liquid pure Cr and Ni-Cr alloys, respectively. This fact further reveals that the chromium addition changes the temperature dependency of nitrogen solubility in Ni-Cr-V alloys.

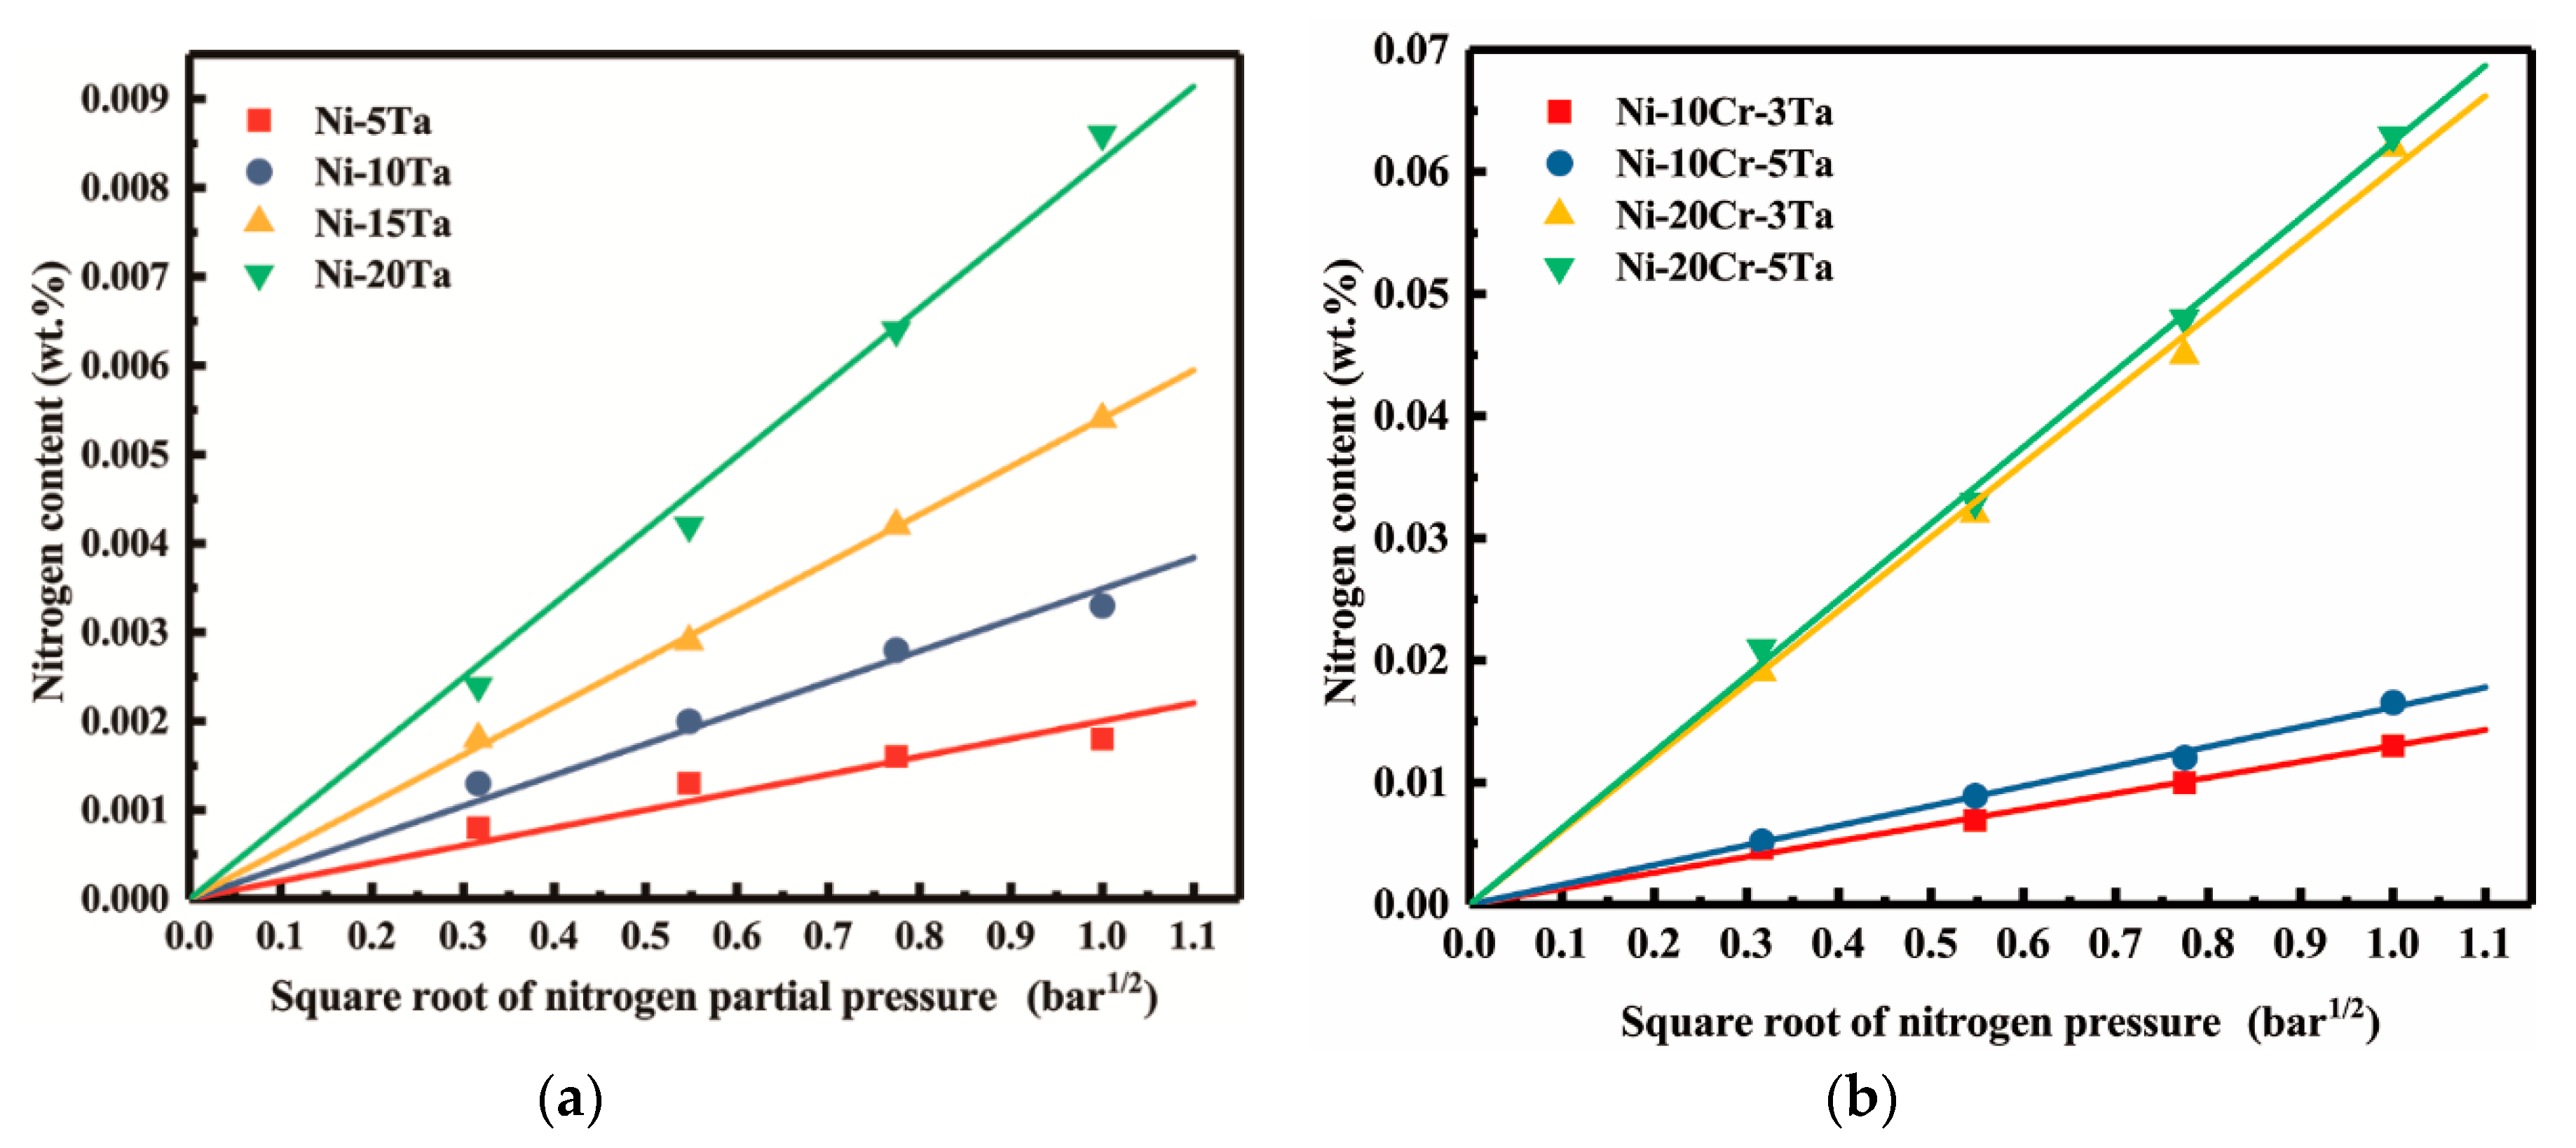
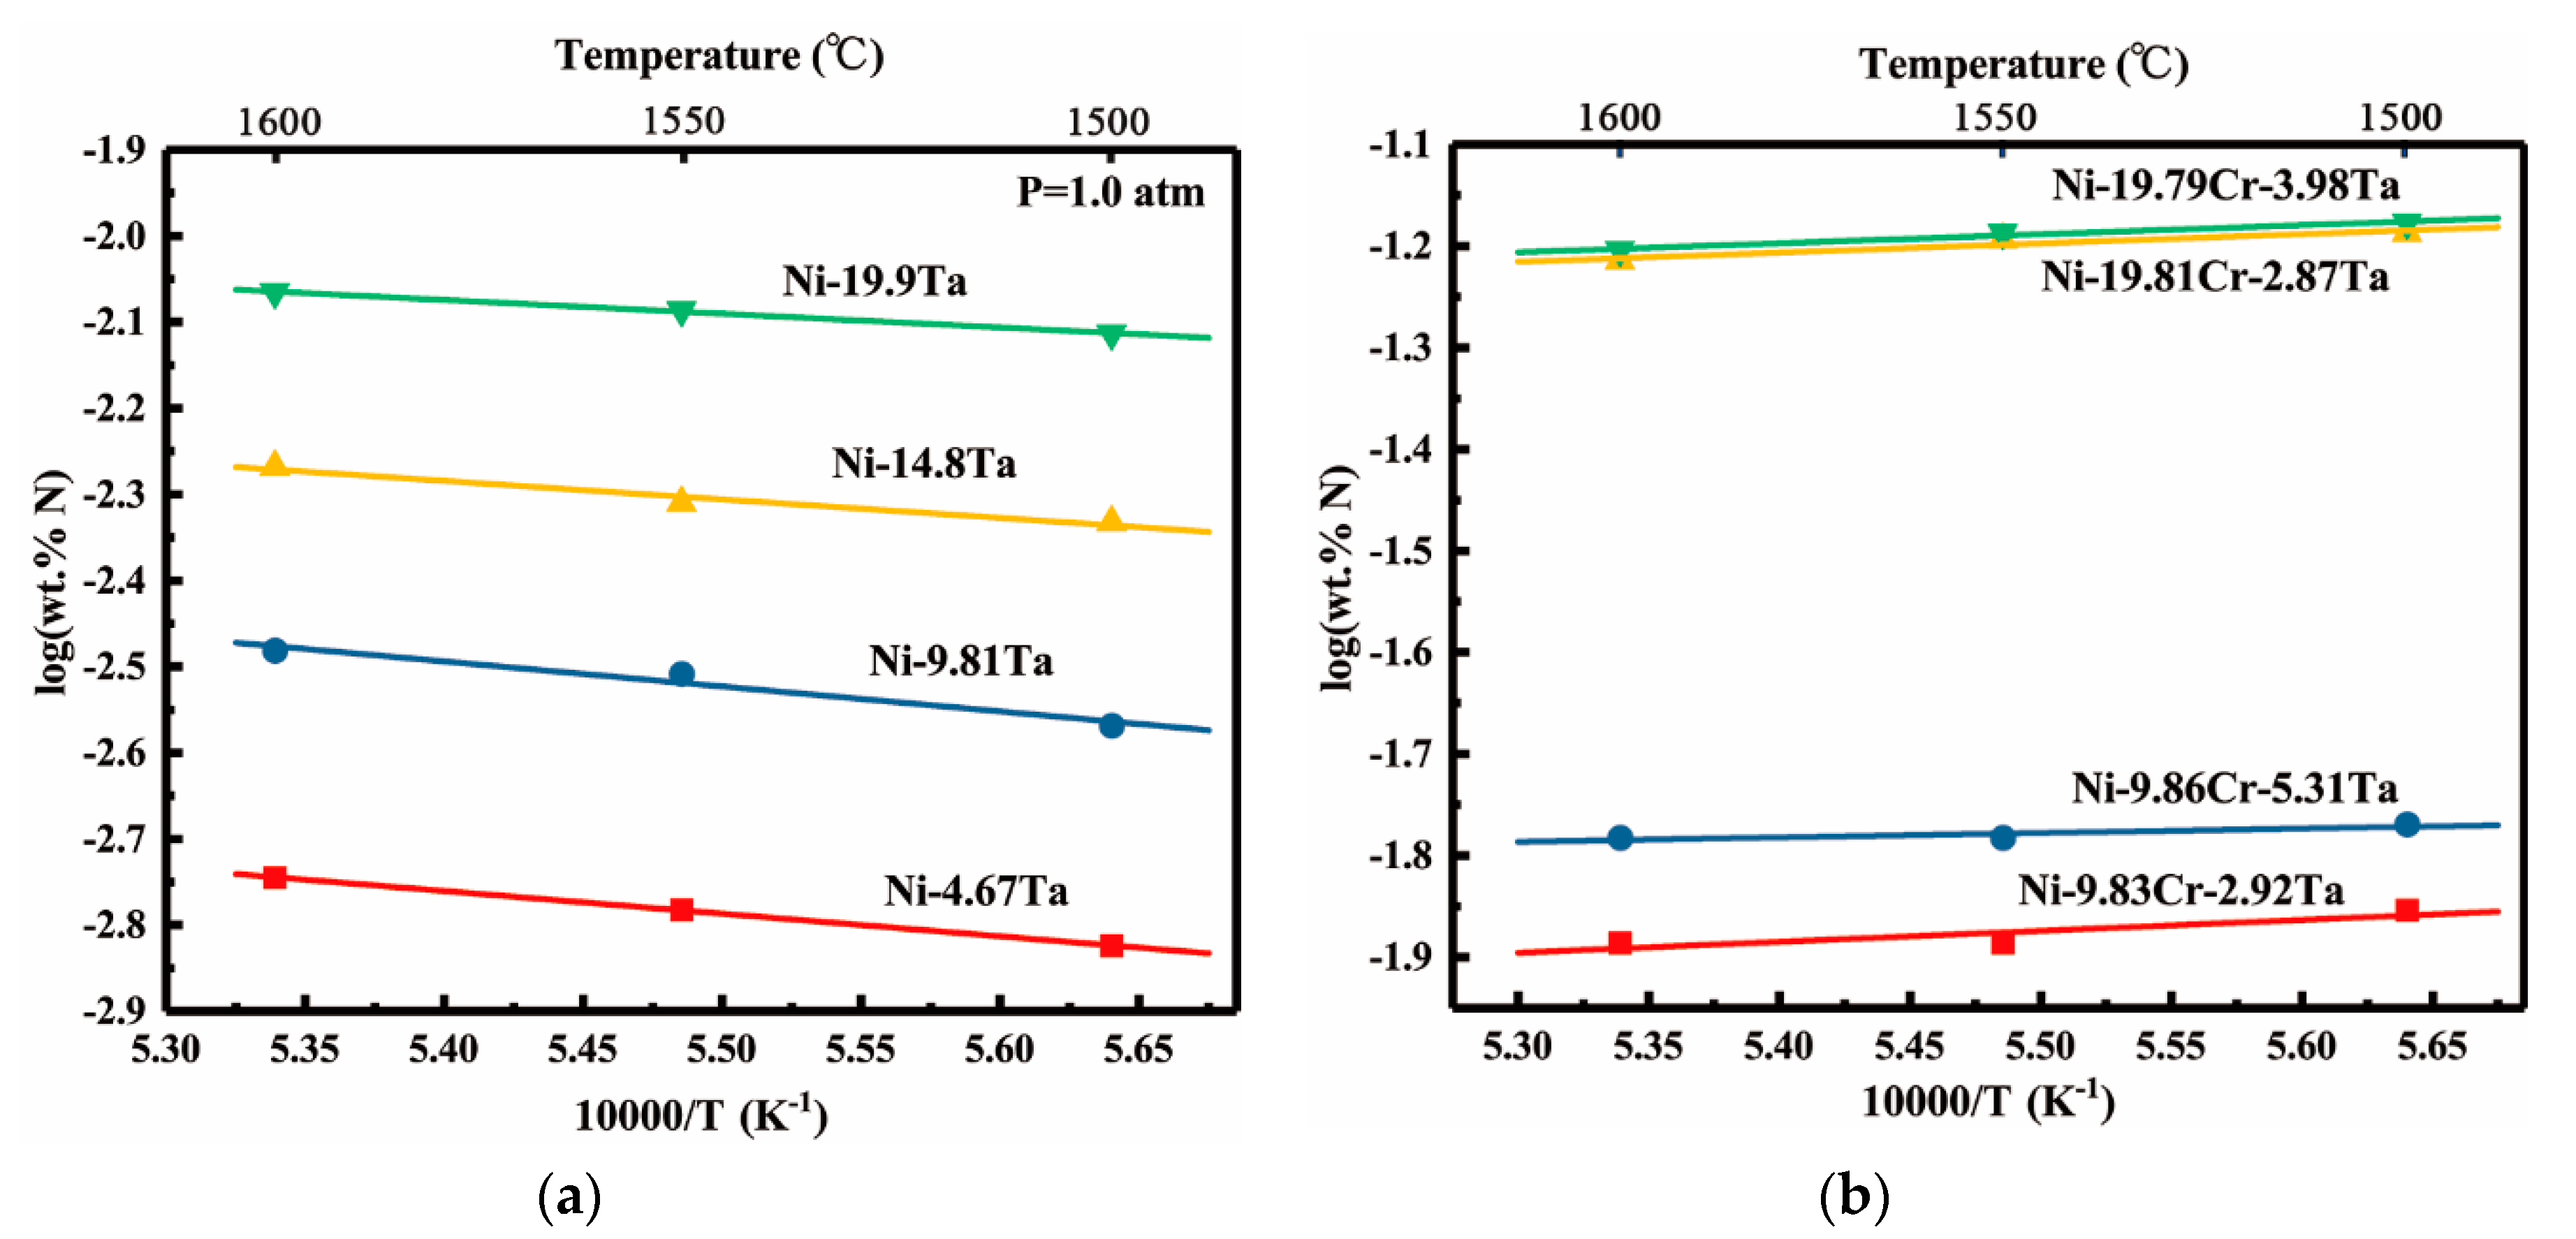
3.4. Solubility of Nitrogen in Liquid Ni-Ta, Ni-Cr-Ta Alloys

Figure 6a shows the results of the nitrogen solubility in liquid nickel containing tantalum up to 19.9 wt pct under nitrogen partial pressures of 0.1, 0.3, 0.6 and 1.0 bar at 1873 K. It can be found that nitrogen dissolution reaction obeys Sieverts’ law from the linear relationship between nitrogen contents in molten alloys of Ni-Ta systems and the values of square root of the partial pressure of nitrogen gas. Furthermore, the results show that the liquid alloys in contact with one atmospheric pressure of nitrogen do not form nitrides.
Figure 6b shows the nitrogen solubility versus square root of nitrogen partial pressure curves in Ni-9.83Cr-2.92Ta, Ni-9.86Cr-5.31Ta, Ni-19.81Cr-2.87Ta, and Ni-19.79Cr-3.98Ta alloys, respectively. It can be observed that nitrogen dissolution also obeys Sieverts’ law over the whole range of concentrations and pressures. Meanwhile, the solubility of nitrogen increases with the increasing of chromium and tantalum content.
Figure 7 shows the results of the nitrogen solubility as a function of temperature at 1 bar nitrogen partial pressure in Ni-Ta and Ni-Cr-Ta alloys, respectively. For binary Ni-Ta alloys, the nitrogen solubility increases with the increase of melt temperature and tantalum content. For the alloys under present study (up to 19.9 wt pct tantalum), continuation of both of these effects into the temperature range 1773 to 1873 K is apparent. This influence of tantalum parallels the observed effect of vanadium addition in increasing the nitrogen solubility in liquid nickel.
As for ternary Ni-Cr-Ta alloys, the solubility lines were determined by regression analysis for each Ta and Cr composition. An illustration of the solubility results from this study is given in Figure 7b as a function of temperature. For all alloys, it is evident that there is a diminution in the nitrogen solubility with the rise of temperature. These results are in a sharp contrast to the small, positive temperature coefficient for the nitrogen solubility in Ni-Ta alloys. Likewise, it is the addition of chromium that makes a difference. By comparing Ni-9.83Cr-2.92Ta with Ni-9.86Cr-5.31Ta, it can also be seen that the positive temperature tendency of the solubility of nitrogen impairs with increasing tantalum content. This fact further reveals that the additions of chromium and tantalum have the opposite effect on the temperature dependency of the nitrogen solubility in Ni-Cr-Ta alloys.

4. Discussion

More information can be extracted from nitrogen solubility measurements than just the knowledge of solubility values [37]. The most valuable information is interaction parameters, which can describe the compositional variation of the activity coefficients of nitrogen in dilute binary liquid alloys [42]. Moreover, it should be stressed that the value of the interaction parameter for any binary alloy system must be acquired from experimental data in the particular alloy system [43].
The free Gibbs energy of dissolution of half mole of nitrogen in the hypothetical 1 wt pct solution of nitrogen is:
Δ G N alloy = Δ H N alloy T Δ S N alloy = R T ln ( w t   p c t   N ) alloy P N 2
where Δ H N alloy and Δ S N alloy are the enthalpy and the entropy of nitrogen dissolution in liquid alloys, respectively. Δ H N alloy can be calculated from the temperature coefficient of nitrogen dissolution by the following equation:
d ( Δ G N a lloy / T ) d ( 1 / T ) = Δ H N a lloy = R [ d ( ln ( w t   p c t   N ) ) a l l o y d ( 1 / T ) ]
According to the experimental results as shown in Figure 4a,b and Figure 6a,b, the solubility of nitrogen obeys Sieverts’ law, so wt pct N is proportional to P N 2 , and the activity coefficient of nitrogen due to the presence of the alloying elements is [42,44]:
log f N = 1 19.155 T ( Δ G N a lloy Δ G N 0 ) = 1 19.155 T × ( ( Δ H N a alloy Δ H N 0 ) T ( Δ S N a lloy Δ S N 0 ) ) = e N i ( w t   p c t   i ) + r N i ( w t   p c t   i ) 2 + i j r N i j ( w t   p c t   i ) ( w t   p c t   j )
where e N i and r N i represent the first and second order interaction parameter of a component i, r N i j represents the second order cross-interaction parameter, respectively. The activity coefficient of nitrogen in nickel-based alloys, f N , is [45]:
f N = ( w t   p c t   N ( in   pure   nickel ) w t   p c t   N ( in   alloy )   ) P N 2 , T
log f N = log ( w t   p c t   N ) pure   nickel log ( w t   p c t   N ) a l l o y
For the conditions of 1873 K and 1.0 bar nitrogen partial pressure, values of enthalpy and entropy of nitrogen dissolution and logarithm of activity coefficient of nitrogen for Ni-V, Ni-Cr-V, Ni-Ta, and Ni-Cr-Ta alloys have been calculated and are given in Table 5.

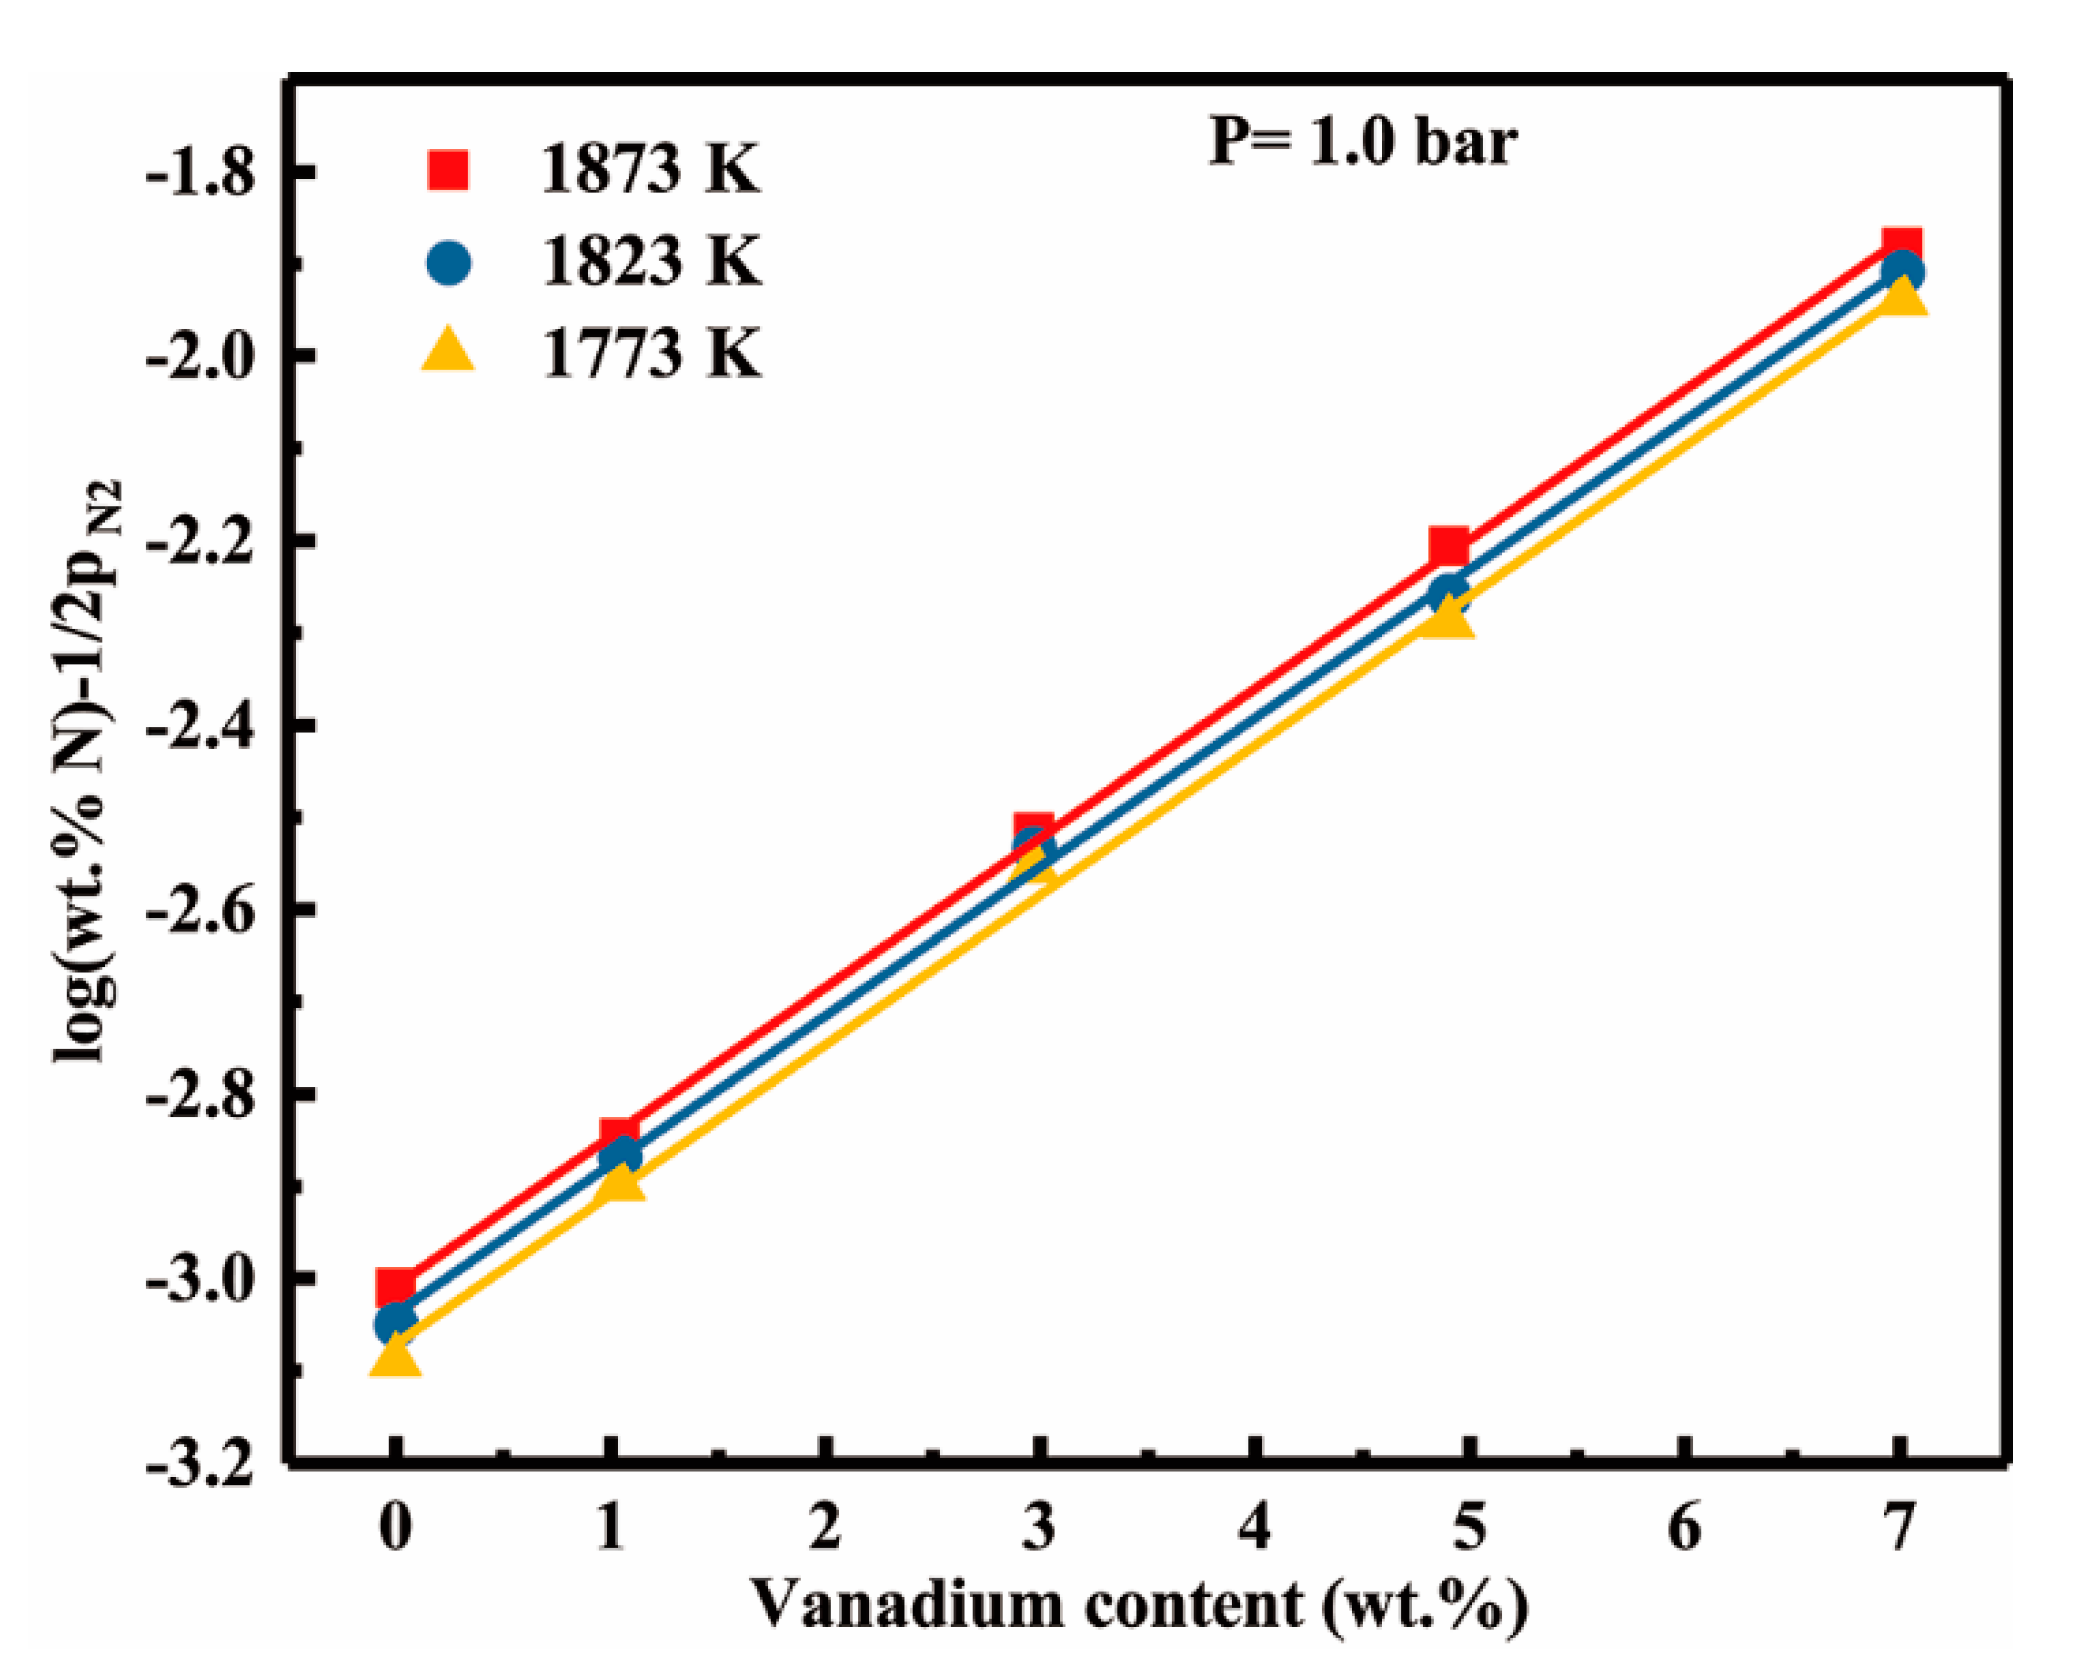
4.1. Vanadium-nitrogen Interactions in Liquid Nickel

Note that the logarithm of Equation (2) can be expressed as:
log K = log f N ( w t   p c t   N ) p N 2 = log f N + log ( w t   p c t   N ) 1 2 log p N 2
Thus:
log ( w t   p c t   N ) 1 2 log p N 2 = log K log f N
log K log ( w t   p c t   N ) + 1 2 log p N 2 = e N ( N i ) i ( w t   p c t   i ) + r N ( N i ) i ( w t   p c t   i ) 2
The logK value is always constant at a certain temperature, because it was already determined by the nitrogen solubility data in liquid nickel in Section 3.2. So the Equation (15) can be further expressed as Equation (16). The interaction parameters can be determined from the slope of the values calculated using know value under the experimental condition. Figure 8 compiles the resulting log ( w t   p c t   N ) 1 / 2 log p N 2 vs. wt pct V curves, obtained from the results of analyses on the binary Ni-V alloys.
The first order interaction parameters are determined by means of regression analysis of the curves according to the Equation (16). It can be observed that the effect of the second order term is not obvious due to the low vanadium content. The slope of each line gives the interaction parameter. The result of regression analysis indicates that the first order interaction parameters are determined as:
e N ( N i ,   1873 K ) V = 0.1622
e N ( N i ,   1823 K ) V = 0.1619
e N ( N i ,   1773 K ) V = 0.1613
The negative values of interaction parameters mean that vanadium is the attractive element to nitrogen. Meanwhile, the temperature dependence of e N ( N i ) V is also negative, which is in reasonable agreement with the experimental results. Generally, the interaction parameters are determined for only one temperature. Therefore, it is hard to calculate exactly the temperature dependences of nitrogen solubility for many multi-alloy systems [46]. Therefore, the interaction parameters for nitrogen and vanadium are ascertained as a function of temperature from the resulting values of interaction parameters:
e N ( N i ) V = 30.0 T 0.1783
The first order interaction parameter e V ( N i ) N can be calculated from the value of e N ( N i ) V using the following relationship [47]:
e V ( N i ) N = e N ( N i ) V M V M N + 0.434 × 10 2 × M N M V M N = 109.1 T 0.6898
where both M V and M N are the atomic masses of vanadium and nitrogen, respectively.

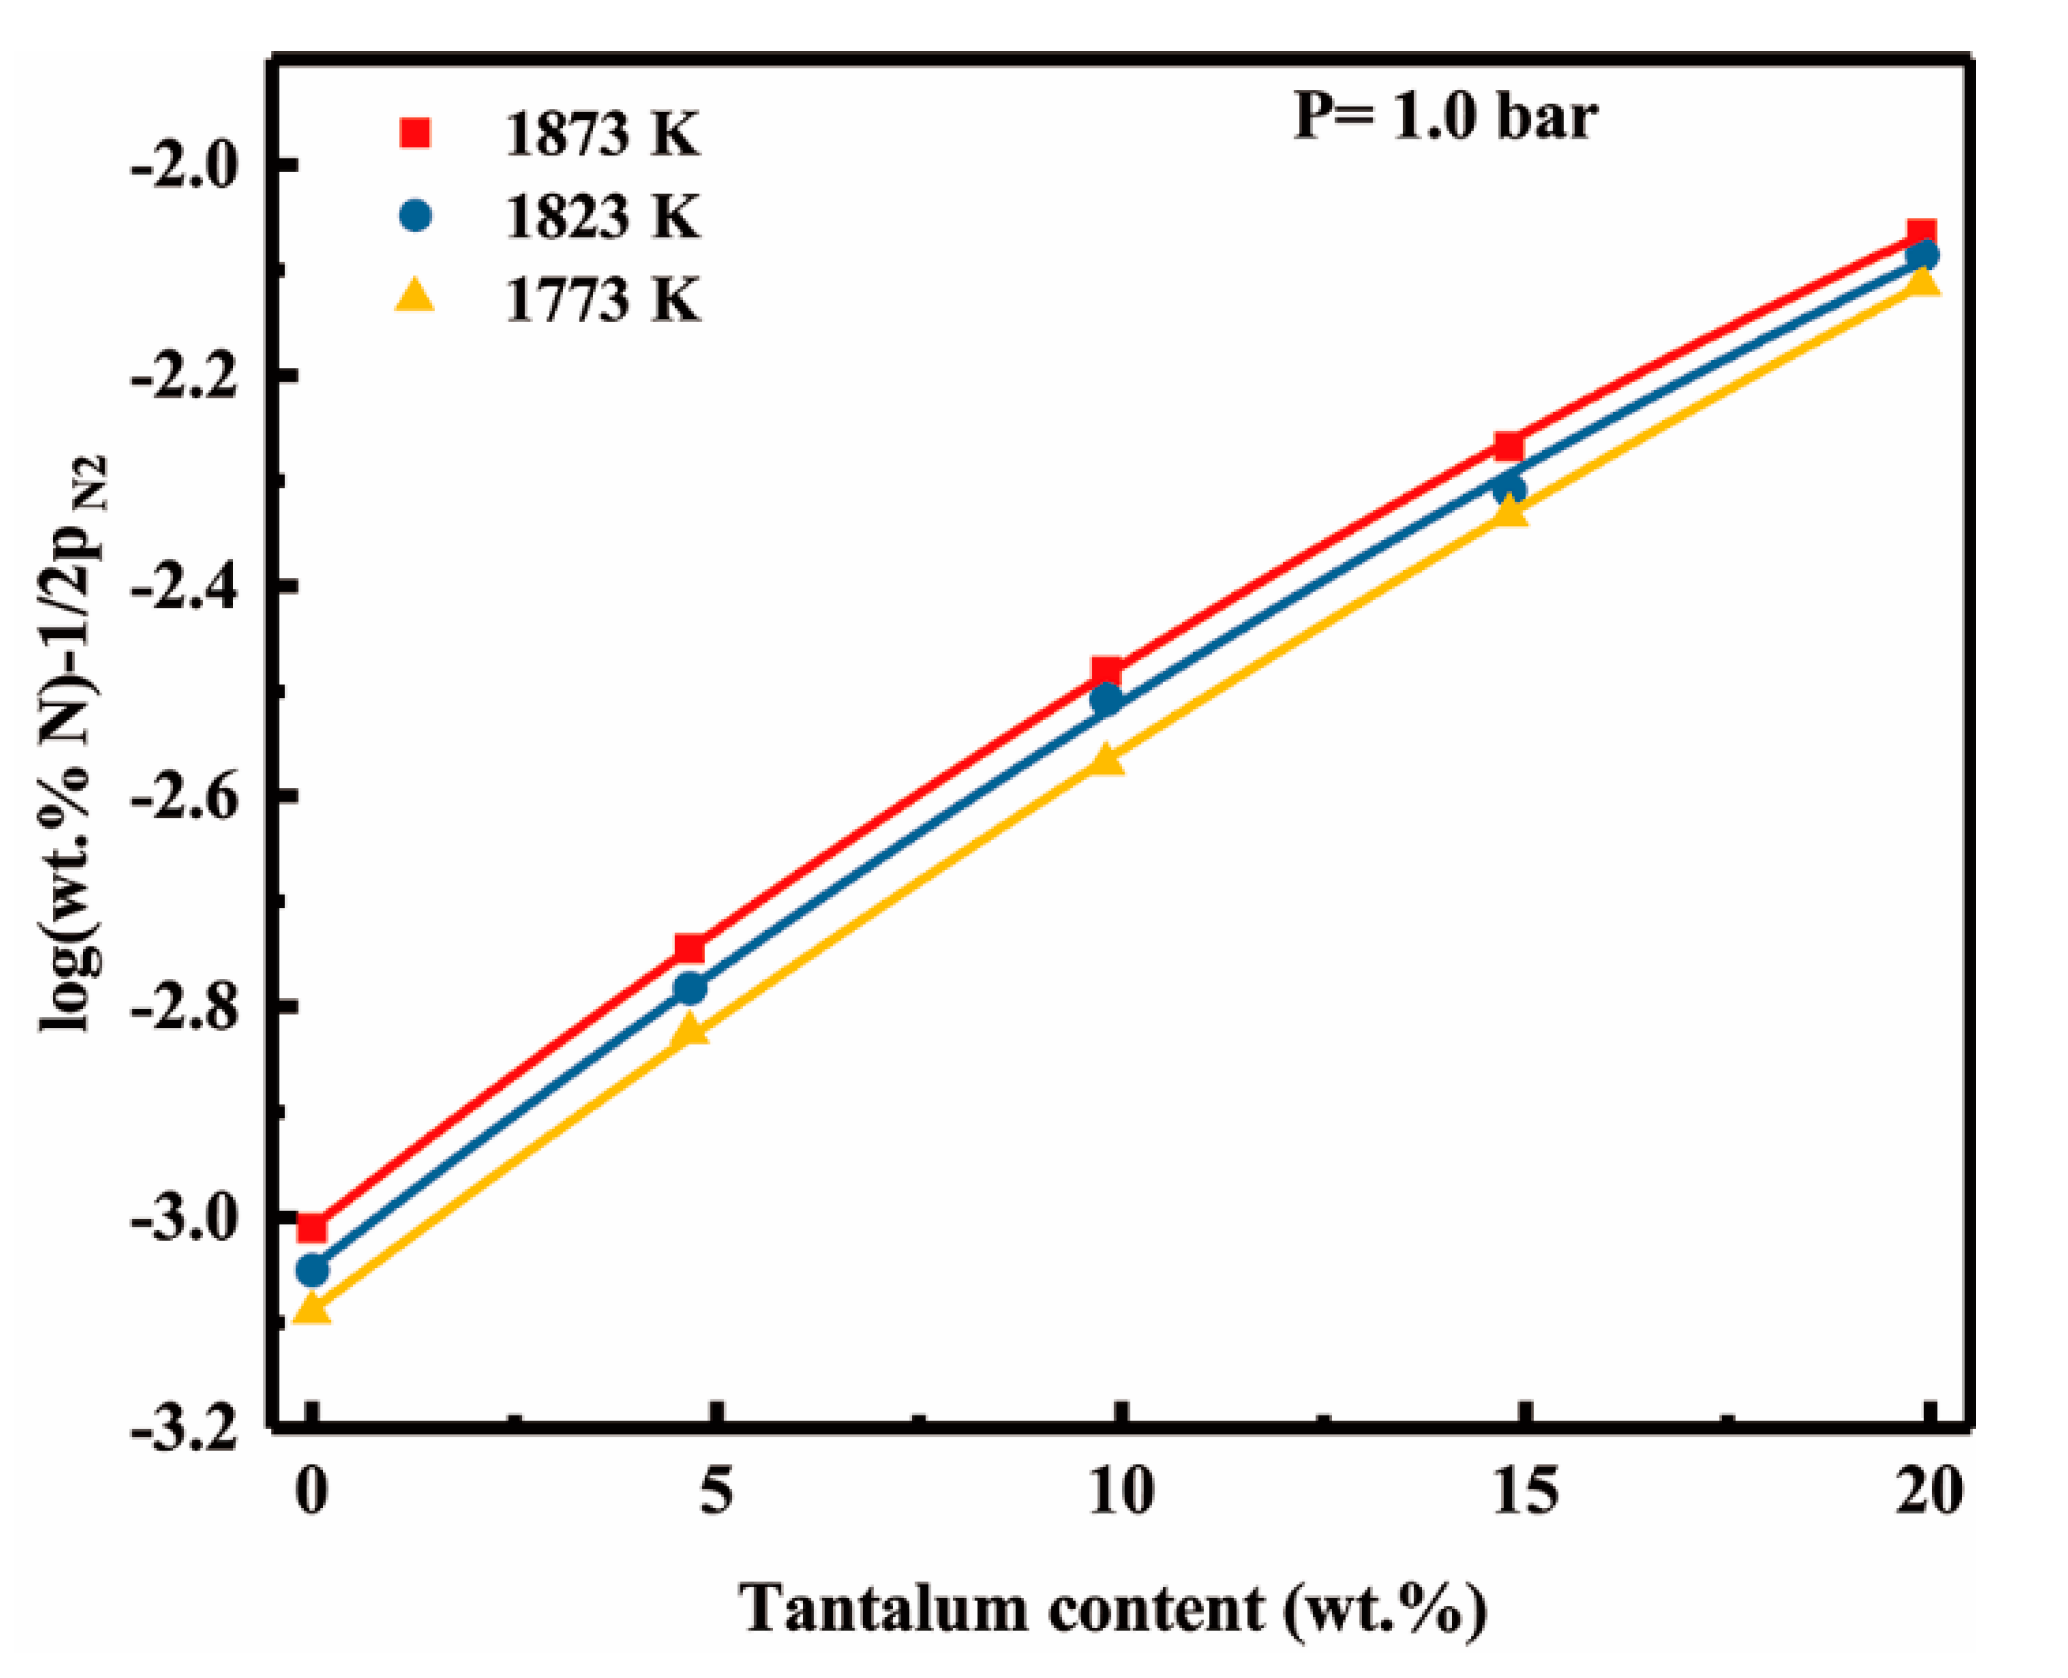
4.2. Tantalum-Nitrogen Interactions in Liquid Nickel

The experimental data plotted according to Equation (16) are shown in Figure 9, where it is seen that curves are obtained within the scatter of the results.
The result of regression analysis indicates that the first and second order interaction parameters are determined as:
e N ( N i ,   1873 K ) T a = 0.0594 ,   r N ( ( N i ,   1873 K ) ) T a = 0.0006
e N ( N i ,   1823 K ) T a = 0.0589 ,   r N ( N i ,   1823 K ) T a = 0.0005
e N ( N i ,   1773 K ) T a = 0.0574 ,   r N ( N i ,   1773 K ) T a = 0.0004
By the same token, the interaction parameters for nitrogen and tantalum are determined as a function of temperature from the values of interaction parameters:
e N ( N i ) T a = 66.7 T 0.0952
r N ( N i ) T a = 6.6 T 0.0042
The second-order interaction parameters are all positive and small, and the effect of the first-order interaction term is partially offset by the second order term, especially at higher tantalum contents. The first order interaction parameter e T a ( N i ) N can be calculated from the value of e N ( N i ) T a using the following relationship [47]:
e T a ( N i ) N = e N ( N i ) T a M T a M N + 0.434 × 10 2 × M N M T a M N = 861.9 T 1.2819
where both M T a and M N are the atomic masses of tantalum and nitrogen, respectively.

4.3. The Second Order Cross-Interaction Parameters

From Equation (12), the activity coefficients of nitrogen in Ni-Cr-V and Ni-Cr-Ta alloys can be expressed as follows:
For Ni-Cr-V alloys:
log f N ( N i C r V ) = log f N ( N i C r ) + e N V ( w t   p c t   V ) + r N C r ,   V ( w t   p c t   C r ) ( w t   p c t   V )
For Ni-Cr-Ta alloys:
log f N ( N i C r T a ) = log f N ( N i C r ) + e N T a ( w t   p c t   T a ) + r N T a ( w t   p c t   T a ) 2 + r N C r ,   T a ( w t   p c t C r ) ( w t   p c t   T a )
The effect of chromium on nitrogen solubility in liquid nickel can be expressed in terms of its influence on the corresponding activity coefficients. According to Equation (12), the logarithm of the activity coefficients log f N ( N i C r ) can be given by:
log f N ( N i C r ) = e N ( N i ) C r ( w t   p c t   C r ) + r N ( N i ) C r ( w t   p c t   C r ) 2
Based on relative data [20], the logarithm of the activity coefficient of nitrogen in liquid Ni-Cr alloys, log f N ( N i C r ) is:
log f N ( N i C r ) = 0.0856 × ( w t   p c t   C r ) + 5 × 10 4 × ( w t   p c t   C r ) 2
The logarithm of the activity coefficients of nitrogen in liquid Ni-Cr-V and Ni-Cr-Ta alloys at 1873 K can be represented by the following equations, respectively:
log f N ( N i C r V , 1873 K ) = 0.0856 × ( w t   p c t   C r ) + 5 × 10 4 × ( w t   p c t   C r ) 2 0.1622 × ( w t   p c t   V ) + r N ( N i ) C r ,   N b ( w t   p c t   C r ) ( w t   p c t   V )
log f N ( N i C r T a , 1873 K ) = 0.0856 × ( w t   p c t   C r ) + 5 × 10 4 × ( w t   p c t   C r ) 2 0.0594 × ( w t   p c t   T a ) + 6 × 10 4 × ( w t   p c t   T a ) 2 + r N ( N i ) C r ,   T a ( w t   p c t   C r ) ( w t   p c t   T a )
Through regression analysis of the experiment results for the activity coefficient of nitrogen, the second order cross-interaction parameters between nitrogen, and chromium with vanadium (or tantalum) can be determined as:
r N ( N i , 1873   K ) C r ,   V = 0.0017   ±   0.0016
r N ( N i , 1873   K ) C r ,   T a = 0.0022   ±   0.0007
The impacts of these second order cross-interaction terms are small at lower Cr, V, or Ta contents in the alloys, but become noticeable with the increase of Cr, V, or Ta contents [42]. Moreover, the negative values of the cross-interaction parameters mean that the mutual promotion exists between Cr and V (or Cr and Ta) for the effects of the nitrogen solubility.

4.4. Discussion of the Effect of Alloying Elements on the Nitrogen Solubility

A comparison between the nitrogen solubility data of this investigation and already published nitrogen solubility data in binary Ni-Nb, Ni-Cr, Ni-Fe, and Ni-Co melts is given in Figure 10a. In these binary Ni-X systems (X = V, Nb, Ta, Cr, Fe, Co), the effects of the alloying elements on the nitrogen solubility can be evaluated by the nitrogen content vs. the alloying element content (in wt pct) at 1873 K and 1.0 bar nitrogen partial pressure. It can be seen that the solubility of nitrogen nonlinearly increases with increasing the contents of vanadium, niobium, tantalum and chromium. It is obvious that the addition of V, Cr, Nb and Ta apparently increases the nitrogen solubility, and vanadium exhibits the highest increase of nitrogen. Meanwhile, the effect of Ta is smaller than that of Cr and Nb [20], but greater than that of another metallic elements, Fe and Co [18,33]. In addition, the similar results can be obtained through a comparison of their interaction parameters.
Figure 10b compiles the relevant data of e N ( N i ) X , but there are only available values of Cu, Si, and Mn at 1823 K [18,19,20,48]. It is to be emphasized that the values of e N ( N i ) X in liquid Ni-X binary system were derived by thermodynamic surveying calculation and found a tendency to be more negative for the smaller atomic number elements in groups VB and VIB. Meanwhile, it can easily be seen that the effect of alloying elements on the nitrogen solubility significantly decreases from left to right in the same period. All these indicate that the affecting degree rank of alloying elements has a close relation with their positions in the periodic table. The electron structure of elements depends upon their position in the periodic system. The same period, from left to right, elemental extranuclear electron number of the same, the outermost electron number are increased, the atomic radius decreasing. In a group, from top to bottom, all the elements have the same number of valence electrons, the atomic radius increasing. The volume of reception or discharge of electrons by an alloying element, is directly combined with the transition of electrons between the gaseous component and the solvent and can be promotive (increasing the solubility of the gaseous component) or hindering (decreasing this solubility) [49]. Therefore, many investigators have proposed some theories attempting to find a relation between the position of element in the periodic table and its effect on the nitrogen solubility [50,51,52]. Summarizing the results of a series of experiments, the sequence of the effects on the solubility of nitrogen can be determined as: Ti > V > Cr > Nb > Ta > Mo > W > Fe > Co > Al.

5. Conclusions

The solubility of nitrogen in liquid Ni-V, Ni-Ta, Ni-Cr-V, and Ni-Cr-Ta alloys has been studied by the sampling method in the temperature range from 1773 K to 1873 K under the nitrogen partial pressure range of 0.1–1.0 bar. The following conclusions can be drawn:
(1)
Both vanadium and tantalum increase the nitrogen solubility in liquid nickel-based alloys, and vanadium has larger effects on nitrogen solubility than tantalum.
(2)
It was confirmed that nitrogen dissolution obeys Sieverts’ law in each alloys at 1873 K and partial pressures of nitrogen in range from 0.1 to 1.0 bar.
(3)
Nitrogen solubility in liquid Ni-V and Ni-Ta alloys increases with increasing temperature, this fact can be attributed to the endothermic reaction of nitrogen dissolution. However, the rising of temperature decreases the solubility of nitrogen in liquid Ni-Cr-Ta and Ni-Cr-V alloys in which the temperature dependency of the nitrogen solubility shows a transfer from positive to negative with the addition of chromium. Moreover, the enthalpies and entropies of dissolution of nitrogen in liquid pure Ni, Ni-V, Ni-Ta, Ni-Cr-V, and Ni-Cr-Ta alloys were determined at 1873 K.
(4)
The effect of vanadium content up to 7.01 wt pct on dissolution behavior of nitrogen can be described by the first order interaction parameters, e N ( N i ) V = 30/T − 0.1783. In addition, we have determined the second order cross-interaction parameters between nitrogen, and chromium with vanadium at 1873 K as r N ( N i , 1873   K ) C r ,   T a = −0.0017 ± 0.0016.
(5)
The effect of tantalum addition (up to 19.9 wt pct) on the nitrogen solubility in liquid nickel can be expressed in terms of the interaction parameters. The first and second order interaction parameters, e N T a and r N T a , have been determined as a function of temperature, e N ( N i ) T a = 66.7/T − 0.0952 and r N ( N i ) T a = 6.6/T − 0.0042. The second order cross-interaction parameters between nitrogen, and chromium with tantalum was also determined at 1873 K as r N ( N i , 1873   K ) C r ,   T a = −0.0022 ± 0.0007.
(6)
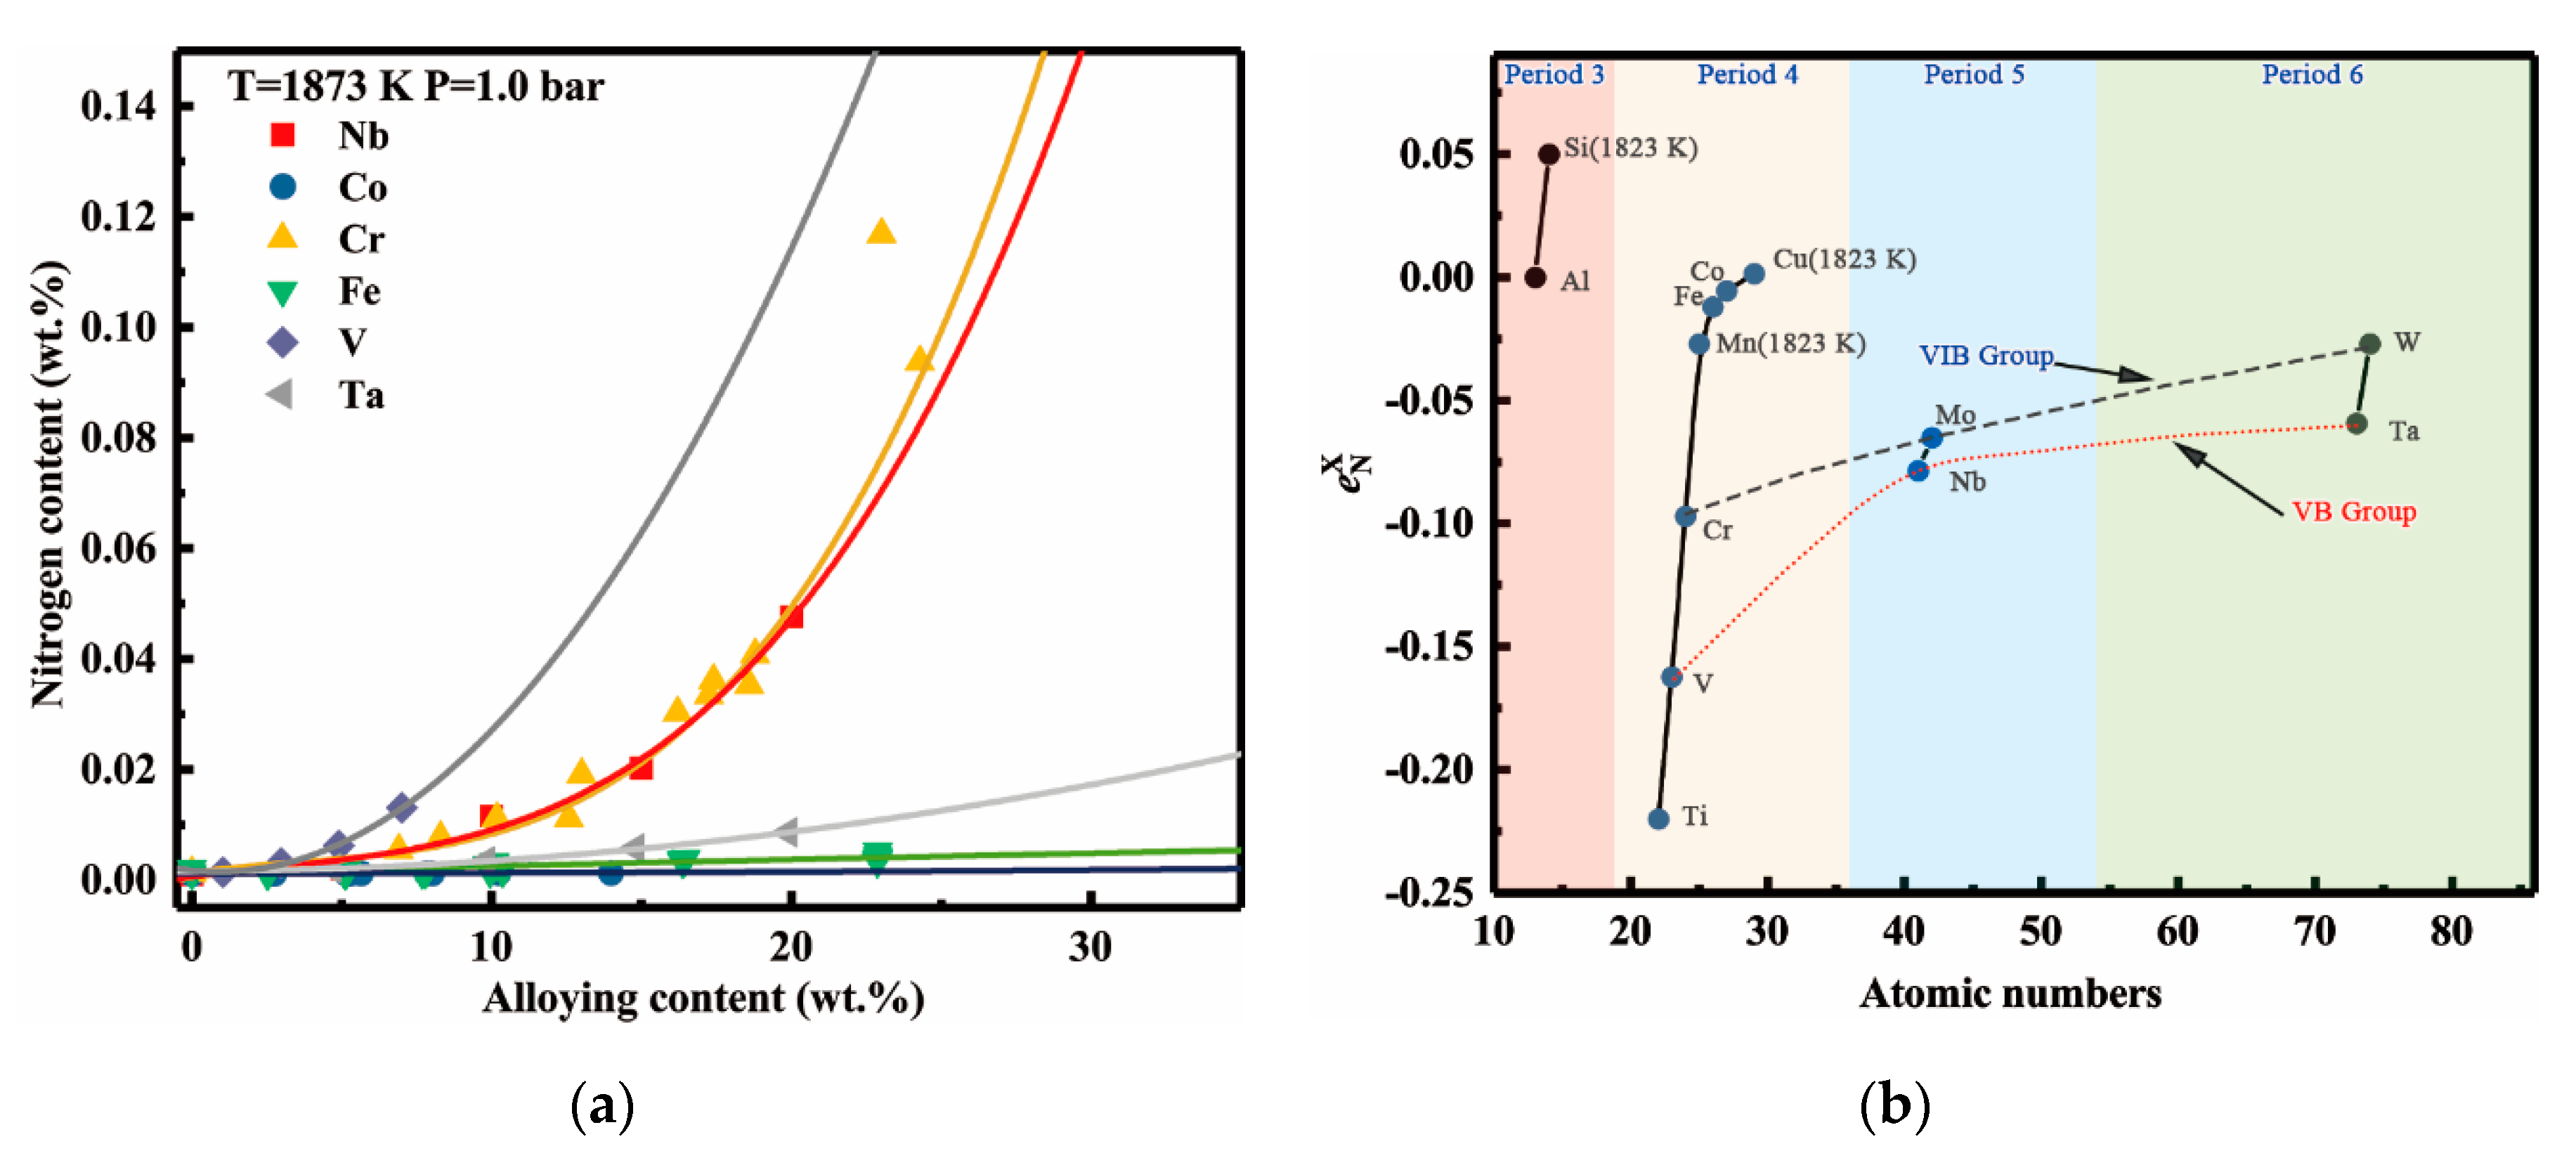
Vanadium addition apparently increases the nitrogen solubility and its effect is only lower than that of titanium, but clearly stronger than that of tantalum. In the binary Ni-X systems (X = Ti, V, Cr, Nb, Ta, Mo, W, Fe, Co), the sequence of the increasing effects on the nitrogen solubility can be specified as Ti > V > Cr > Nb > Ta > Mo > W > Fe > Co.
(7)
The results obtained in this paper do not only enrich the thermodynamic data of nitrogen in liquid nickel-based alloys. The similar approach can also be extended to chromium-based alloys, which would provide a basis for chromium-based alloys as structural materials used at high temperatures.

Author Contributions

Conceptualization, B.C. and K.L.; formal analysis, K.Q.; investigation, K.Q.; resources, L.S.; writing—original draft preparation, K.Q.; writing—review and editing, B.C.; visualization, K.Q.; project administration, B.C.; funding acquisition, K.L.

Funding

This research received no external funding.

Conflicts of Interest

The authors declare no conflict of interest.

References

  1. Mitchell, A. Progress in understanding clean metal production for IN718. Superalloys 1994, 718, 109–123. [Google Scholar]
  2. Cockcroft, S.L.; Degawa, T.; Mitchell, A.; Tripp, D.W.; Schmalz, A. Inclusion precipitation in superalloys. Superalloys 1992, 1992, 577–586. [Google Scholar]
  3. Huang, X.; Zhang, Y.; Hu, Z. Effect of small amounts of nitrogen on properties of a Ni-based superalloy. Metall. Mater. Trans. A 1999, 30, 1755–1761. [Google Scholar] [CrossRef]
  4. Guo, X.L.; Yu, J.B.; Li, X.F.; Hou, Y.; Ren, Z.M. Effect of nitrogen content on the microstructure and mechanical properties of a cast nickel-base superalloy. Ironmak. Steelmak. 2018, 45, 215–223. [Google Scholar] [CrossRef]
  5. Harris, K.; Wahl, J.B. Developments in superalloy castability and new applications for advanced superalloys. Mater. Sci. Tech. 2009, 25, 147–153. [Google Scholar] [CrossRef]
  6. Shahapurkar, D.S.; Small, W.M. Effect of titanium on the nitrogen solubility in complex liquid Fe−Cr−Ni alloys. Metall. Trans. B 1987, 182, 31–235. [Google Scholar] [CrossRef]
  7. Wei, S. Thermodynamic study of interaction coefficients in multicomponent metallic solutions by the solubility method. Steel Res. 1992, 63, 159–165. [Google Scholar] [CrossRef]
  8. Suzuki, K.; Ban-Ya, S.; Hino, M. Deoxidation equilibrium of chromium stainless steel with Si at the temperatures from 1823 to 1923 K. ISIJ Int. 2001, 41, 813–817. [Google Scholar] [CrossRef]
  9. Turnock, P.H.; Pehlke, R.D. The solubility of nitrogen in multicomponent liquid iron alloys. TMS-AIME 1966, 236, 1540–1547. [Google Scholar]
  10. Rašev, Z.; Ivanov, R. Die Stickstofflöslichkeit in eisen-chrom-mangan-schmelzen bei 1600 °C und Gasdrücken bis zu 25 bar. Arch. Eisenhütten. 1979, 50, 369–371. [Google Scholar] [CrossRef]
  11. Chang, Y.; Fitzner, K.; Zhang, M.X. The solubility of gases in liquid metals and alloys. Pro. Mater. Sci. 1988, 32, 97–259. [Google Scholar] [CrossRef]
  12. Mukai, K. Interaction Parameters in ternary liquid alloys. Trans. Jpn. Ins. Met. 1975, 16, 141–150. [Google Scholar] [CrossRef]
  13. Ishll, F.; Fuwa, T. Effect of alloying element on the solubility of nitrogen in liquid iron. Tetsu-to-Hagané 1982, 68, 1560–1568. [Google Scholar]
  14. Abdulrahman, R.F.; Hendry, A. The solubility of nitrogen in liquid pure nickel. Metall. Mater. Trans. B 2001, 32, 1095–1101. [Google Scholar] [CrossRef]
  15. Siwka, J. Experimental measurements of nitrogen solubility in liquid nickel and cobalt. In Proceedings of the International Conference on High Nitrogen Steels, Jiuzhaigou Valley, China, 29–31 August 2006; Metallurgy Industry Press: Beijing, China. [Google Scholar]
  16. Kowanda, C.; Speidel, M.O. Solubility of nitrogen in liquid nickel and binary Ni–Xi alloys (Xi = Cr, Mo, W, Mn, Fe, Co) under elevated pressure. Scr. Mater. 2003, 48, 1073–1078. [Google Scholar] [CrossRef]
  17. Schenck, H.; Frohberg, M.G.; Graf, H. Untersuchung über die beeinflussung der gleichgewichte von stickstoff mit flüssigen eisenlösungen durch den zusatz weiterer Elemente (I). Arch. Eisenhütten. 1958, 29, 673–676. [Google Scholar] [CrossRef]
  18. Abdulrahman, R.F.; Hendry, A. Solubility of nitrogen in liquid nickel-based alloys. Metall. Mater. Trans. B. 2001, 32, 1103–1112. [Google Scholar] [CrossRef]
  19. Kowanda, C. Stickstofflöslichkeit in nickel und nickelbasislegierungen im schmelzflüssigen zustand unter erhöhtem Stickstoffpartialdruck. Ph.D. Thesis, ETH Zurich, Zurich, Switzerland, September 2000. [Google Scholar]
  20. Herrera-Trejo, M.; Ablitzer, D. Dissolution of nitrogen in liquid Ni–Cr superalloys. Can. Metall. Quart. 1997, 36, 341–345. [Google Scholar] [CrossRef]
  21. Gu, Y.F.; Harada, H.; Ro, Y. Chromium and chromium-based alloys: Problems and possibilities for high-temperature service. JOM 2004, 56, 28–33. [Google Scholar] [CrossRef]
  22. Soleimani-Dorcheh, A.; Galetz, M.C. Oxidation and nitridation behavior of Cr–Si alloys in air at 1473 K. Oxid. Met. 2015, 84, 73–90. [Google Scholar] [CrossRef]
  23. Dorcheh, A.S.; Galetz, M.C. Challenges in developing oxidation-resistant chromium-based alloys for applications above 900 °C. JOM 2016, 68, 2793–2802. [Google Scholar] [CrossRef]
  24. Fryburg, G.C.; Stearns, C.A.; Kohl, F.J. mechanism of beneficial effect of tantalum in hot corrosion of nickel-base superalloys. J. Electrochem. Soc. 1977, 124, 1147–1148. [Google Scholar] [CrossRef]
  25. Luo, L.; Ru, Y.; Qin, L.; Pei, Y.; Ma, Y.; Li, S.; Zhao, X.; Gong, S. Effects of alloyed aluminum and tantalum on the topological inversion behavior of Ni-based single crystal superalloys at high temperature. Adv. Eng. Mater. 2019, 21, 1800793. [Google Scholar] [CrossRef]
  26. Allen, A.T.; Douglass, D.L. Internal-nitriding behavior of Ni-V and Ni-3Nb alloys. Oxid. Met. 1999, 51, 1–22. [Google Scholar] [CrossRef]
  27. Morita, Z.I.; Iwanaga, Y.; Hamada, S.; Adachi, A. Solubility of nitrogen and equilibrium of Ta-nitride forming reaction in liquid Fe-Ta alloys. Tetsu-to-Hagané 1973, 59, 214–221. [Google Scholar] [CrossRef]
  28. Kunze, H.D.; Schürmann, E.; Parlee, N.A.D. Influence of temperature and equivalent effect of added elements on the solubility, activity, and activity coefficient of nitrogen in liquid iron. Metall. Tran. 1970, 1, 281–290. [Google Scholar]
  29. Rowers, J.C.; Gokcen, N.A. Nitrogen concentration in liquid Fe-Mn alloys at high pressure. J. Phase Equilib. 1993, 14, 179–183. [Google Scholar] [CrossRef]
  30. Roskosz, M.; Bouhifd, M.A.; Jephcoat, A.P.; Marty, B.; Mysen, B.O. Nitrogen solubility in molten metal and silicate at high pressure and temperature. Geochim. Cosmochim. Acta 2013, 121, 15–28. [Google Scholar] [CrossRef]
  31. Gomersall, D.W. Solubility of nitrogen in liquid iron alloys. Ph.D. Thesis, McMaster University, Hamilton, ON, Canada, September 1967. [Google Scholar]
  32. Fedorchenko, V.I.; Averin, V.V.; Samarin, A.M. Solubility of nitrogen in liquid nickel and in nickel-chromium, nickel-molybdenum, and nickel-tungsten melts. Dokl. Akad. Nauk SSSR 1968, 4, 894–896. [Google Scholar]
  33. Kim, C.K.; McLean, A.; Ishii, F.; Ban-Ya, S. Thermodynamic of nitrogen dissolution in liquid nickel alloys. ISS Trans. 1987, 8, 29–35. [Google Scholar]
  34. Stomakhin, A.Y.; Bayer, P.; Polyakov, A.Y. Solubility of nitrogen in liquid nickel and in Ni-Cr, Ni-Mo and Ni-W alloys. Lzvest Akad Nauk.SSSR Metall. 1965, 4, 37–45. [Google Scholar]
  35. Blossey, R.G.; Pehlke, R.D. The solubility of nitrogen in liquid Fe-Ni-Co alloys. TMS-AIME 1966, 236, 566–569. [Google Scholar]
  36. Kojima, Y.; Inouye, M.; Yamada, Y. Solubility and diffusivity of nitrogen in liquid iron-nickel and iron-cobalt alloys at 1600 °C. Trans. Iron Steel Inst. Jpn. 1975, 15, 599–605. [Google Scholar]
  37. Lange, K.W.; Schenck, H. Gas solubility measurements and the derivation of inherent thermodynamic information. Metall. Trans. 1970, 1, 2036–2038. [Google Scholar] [CrossRef]
  38. Wada, H.; Gunji, K.; Wada, T. Solubility of nitrogen in molten Fe-Ni and Fe-Cr alloys. Trans. Iron Steel Inst. Jpn. 1968, 8, 329–336. [Google Scholar]
  39. Humbert, J.C.; Elliott, J.F. The solubility of nitrogen in liquid Fe-Cr-Ni alloys. TMS-AIME 1960, 218, 1076–1087. [Google Scholar]
  40. Wada, H.; Pehlke, R.D. Nitrogen solution and titanium nitride precipitation in liquid Fe-Cr-Ni alloys. Metall. Trans. B 1977, 8, 443–450. [Google Scholar] [CrossRef]
  41. Wada, H.; Gunji, K.; Wada, T. The solubility of nitrogen in liquid Fe-Ni and Fe-Cr alloys. J. Jpn Ins. Met. 1968, 32, 933–938. [Google Scholar] [CrossRef]
  42. Wagner, C. The activity coefficient of oxygen and other nonmetallic elements in binary liquid alloys as a function of alloy composition. Acta Metall. 1973, 21, 1297–1303. [Google Scholar] [CrossRef]
  43. Hu, D.C.; Chang, Y.A. The activity coefficient of nonmetallic solutes in ternary and higher order liquid alloys. Metall. Trans. B 1980, 11, 172–175. [Google Scholar] [CrossRef]
  44. Wada, H.; Pehlke, R.D. Solubility of nitrogen in liquid Fe-Cr-Ni alloys containing manganese and molybdenum. Metall. Trans. B 1977, 8, 675–682. [Google Scholar] [CrossRef]
  45. Wada, H.; Pehlke, R.D. Nitrogen solubility and aluminum nitride precipitation in liquid iron, Fe-Cr, Fe-Cr-Ni, and Fe-Cr-Ni-Mo alloys. Metall. Trans. B 1978, 9, 441–448. [Google Scholar] [CrossRef]
  46. Sokolov, V.M.; Fedorenko, I.V. Estimation of hydrogen solubility in liquid alloys of iron, nickel and copper. Int. J. Hydrogen Energ. 1996, 21, 931–934. [Google Scholar] [CrossRef]
  47. Lupis, C.H.P.; Elliott, J.F. Relationship between interaction coefficients epsilon and e. TMS-AIME 1965, 233, 257–258. [Google Scholar]
  48. Avercn, B.B. Nitrogen in Metals; Chinese Metallurgical Industry Press: Beijing, China, 1981; pp. 73–81. [Google Scholar]
  49. Schürmann, E.; Sittard, M.; Völker, R. Systematic of the equivalent influence of alloying elements on the nitrogen and hydrogen solubility in iron, cobalt, and nickel base alloys. Steel Res. 1986, 57, 546–551. [Google Scholar] [CrossRef]
  50. Pettifor, D.G. Theoretical predictions of structure and related properties of intermetallics. Mater. Sci. Tech. 1992, 8, 345–349. [Google Scholar] [CrossRef]
  51. Morinaga, M.; Yukawa, N.; Adachi, H. Alloying effect on the electronic structure of Ni3Al. J. Phys. Soc. Jpn. 1984, 53, 653–663. [Google Scholar] [CrossRef]
  52. Pettifor, D.G. Structure maps for pseudobinary and ternary phases. Mater.Sci. Tech. 1988, 4, 675–691. [Google Scholar] [CrossRef]
Figure 1. Schematic diagram of the experimental apparatus.
Metals 09 01184 g001
Figure 2. Variation of nitrogen content with time in nitrogen dissolution experiments.
Metals 09 01184 g002
Figure 3. (a) Van’t Hoff relationship for the nitrogen solubility in liquid pure nickel; (b) Gibbs free energy of the nitrogen dissolution reaction in liquid pure nickel.
Metals 09 01184 g003
Figure 4. (a) Nitrogen solubility in liquid Ni-V alloys at 1873 K; (b) Relationship between square root of nitrogen partial pressure and nitrogen content in Ni-Cr-V alloys at 1873 K.
Metals 09 01184 g004
Figure 5. (a) Experimental results of the temperature dependence of the nitrogen solubility in the liquid Ni-V alloys; (b) Experimental results of the temperature dependence of the nitrogen solubility in the Ni-Cr-V alloys.
Metals 09 01184 g005
Figure 6. (a) Effect of pressure on the solubility of nitrogen in liquid Ni-Ta alloys at 1873 K; (b) Effect of pressure on the solubility of nitrogen in liquid Ni-Cr-Ta alloys at 1873 K.
Metals 09 01184 g006
Figure 7. (a) The experimental results of the temperature dependence of the nitrogen solubility in liquid Ni-Ta alloys; (b) Experimental results of the temperature dependence of the nitrogen solubility in liquid Ni-Cr-Ta alloys.
Metals 09 01184 g007
Figure 8. log ( w t   p c t   N ) 1 / 2 log p N 2 vs. the vanadium content in binary Ni-V alloys at different temperatures.
Metals 09 01184 g008
Figure 9. log ( w t   p c t   N ) 1 / 2 log p N 2 vs. the tantalum content in binary Ni-Ta alloys at different temperatures.
Metals 09 01184 g009
Figure 10. (a) Effect of alloying elements content on the nitrogen solubility in liquid nickel at 1873 K; (b) Relation between atomic numbers and values of the interaction parameter e N X in liquid nickel at 1873 K.
Metals 09 01184 g010
Table 1. Purity of raw materials.
MaterialPurity (wt.%)
Electrolytic nickel bead99.99
Electrolytic chromium99.99
Electrolytic vanadium 99.95
Electron beam tantalum99.99
Table 2. The compositions of the investigated alloy systems.
Ni-VNi-TaNi-Cr-VNi-Cr-Ta
Ni-1.04VNi-4.67TaNi-9.98Cr-1.03VNi-9.83Cr-2.92Ta
Ni-2.97VNi-9.81TaNi-9.75Cr-2.97VNi-9.86Cr-5.31Ta
Ni-4.90VNi-14.80TaNi-19.94Cr-0.99VNi-19.81Cr-2.87Ta
Ni-7.01VNi-19.9TaNi-19.76Cr-2.98VNi-19.79Cr-3.98Ta
Table 3. Solubility of nitrogen in liquid nickel at 1873 K and 1.0 bar nitrogen partial pressure.
YearInvestigatorsN × 10−4 (wt.%)Experimental MethodRef.
1959Schenck et al.25CPSM[17]
1960Humbert and Elliott5 to 12.1CPSM[39]
1965Stomakhin et al.12.6CPSM[34]
1966Blossey and Pehlke13CPSM[35]
1968Wada et al.13LMT[38]
1968Fedorchenko et al.15CPSM[32]
1970Lange and Schenck14.4SM[37]
1975Kojima et al.13 to 35SM[36]
1977Wada and Pehlke5.3SM[40]
1987Kim and McLean11.4SM[33]
2001Abdulrahman et al.20CPSM[14]
2003Kowanda et al.12SM[16]
2006Siwka9SM[15]
This study10SM
CPSM: constant pressure Sieverts’ method; LMT: levitation melting technique; SM: sampling method.
Table 4. Sieverts’ constant Ks and the square of Pearsons correlation coefficient r2.
AlloyKsr2AlloyKsr2
Ni-1.04V0.00220.976Ni-9.98Cr-1.03V0.01470.999
Ni-2.97V0.00420.982Ni-9.75Cr-2.97V0.02450.999
Ni-4.90V0.00840.992Ni-19.94Cr-0.99V0.06470.997
Ni-7.01V0.01470.999Ni-19.76Cr-2.98V0.09620.999
Ni-4.67Ta0.00200.993Ni-9.83Cr-2.92Ta0.01300.999
Ni-9.81Ta0.00350.998Ni-9.86Cr-5.31Ta0.01620.999
Ni-14.80Ta0.00540.999Ni-19.81Cr-2.87Ta0.06020.999
Ni-19.9Ta0.00830.999Ni-19.79Cr-3.98Ta0.06250.999
Table 5. Experimental results, enthalpy and entropy of dissolution of nitrogen and logarithm of activity coefficient of nitrogen at 1873 K.
Alloy System−log fN,1873k Δ H N alloy (J/mol) Δ S N alloy (J/mol)
Ni-VNi-1.04V0.1524−366652.56
Ni-2.97V0.4833−453545.76
Ni-4.9V0.7943−683738.58
Ni-7.01V1.1173−752832.02
Ni-Cr-VNi-9.98Cr-1.03V1.1591 107035.81
Ni-9.75Cr-2.97V1.3892 153031.65
Ni-19.94Cr-0.99V1.7924 465925.61
Ni-19.76Cr-2.98V1.9818 344321.33
Ni-TaNi-4.67Ta0.2553 −949647.47
Ni-9.81Ta0.5185 −1048441.91
Ni-14.8Ta0.7324 −776439.27
Ni-19.9Ta0.9345 −576236.46
Ni-Cr-TaNi-9.83Cr-2.92Ta1.1461 389337.57
Ni-9.86Cr-5.31Ta1.2305 156934.71
Ni-19.81Cr-2.87Ta1.8129 329124.48
Ni-19.79Cr-3.98Ta1.8228 322224.26

