2. Experimental Materials and Methods
The chemical composition of H13, which was obtained from the Central Iron and Steel Research Institute (CISRI, Beijing, China), is shown in
Table 1. The Ac
1 temperature (phase transformation γ → α) of this steel is within the range of 1133 K (Ac
1) and 1188 K (Ac
3) [
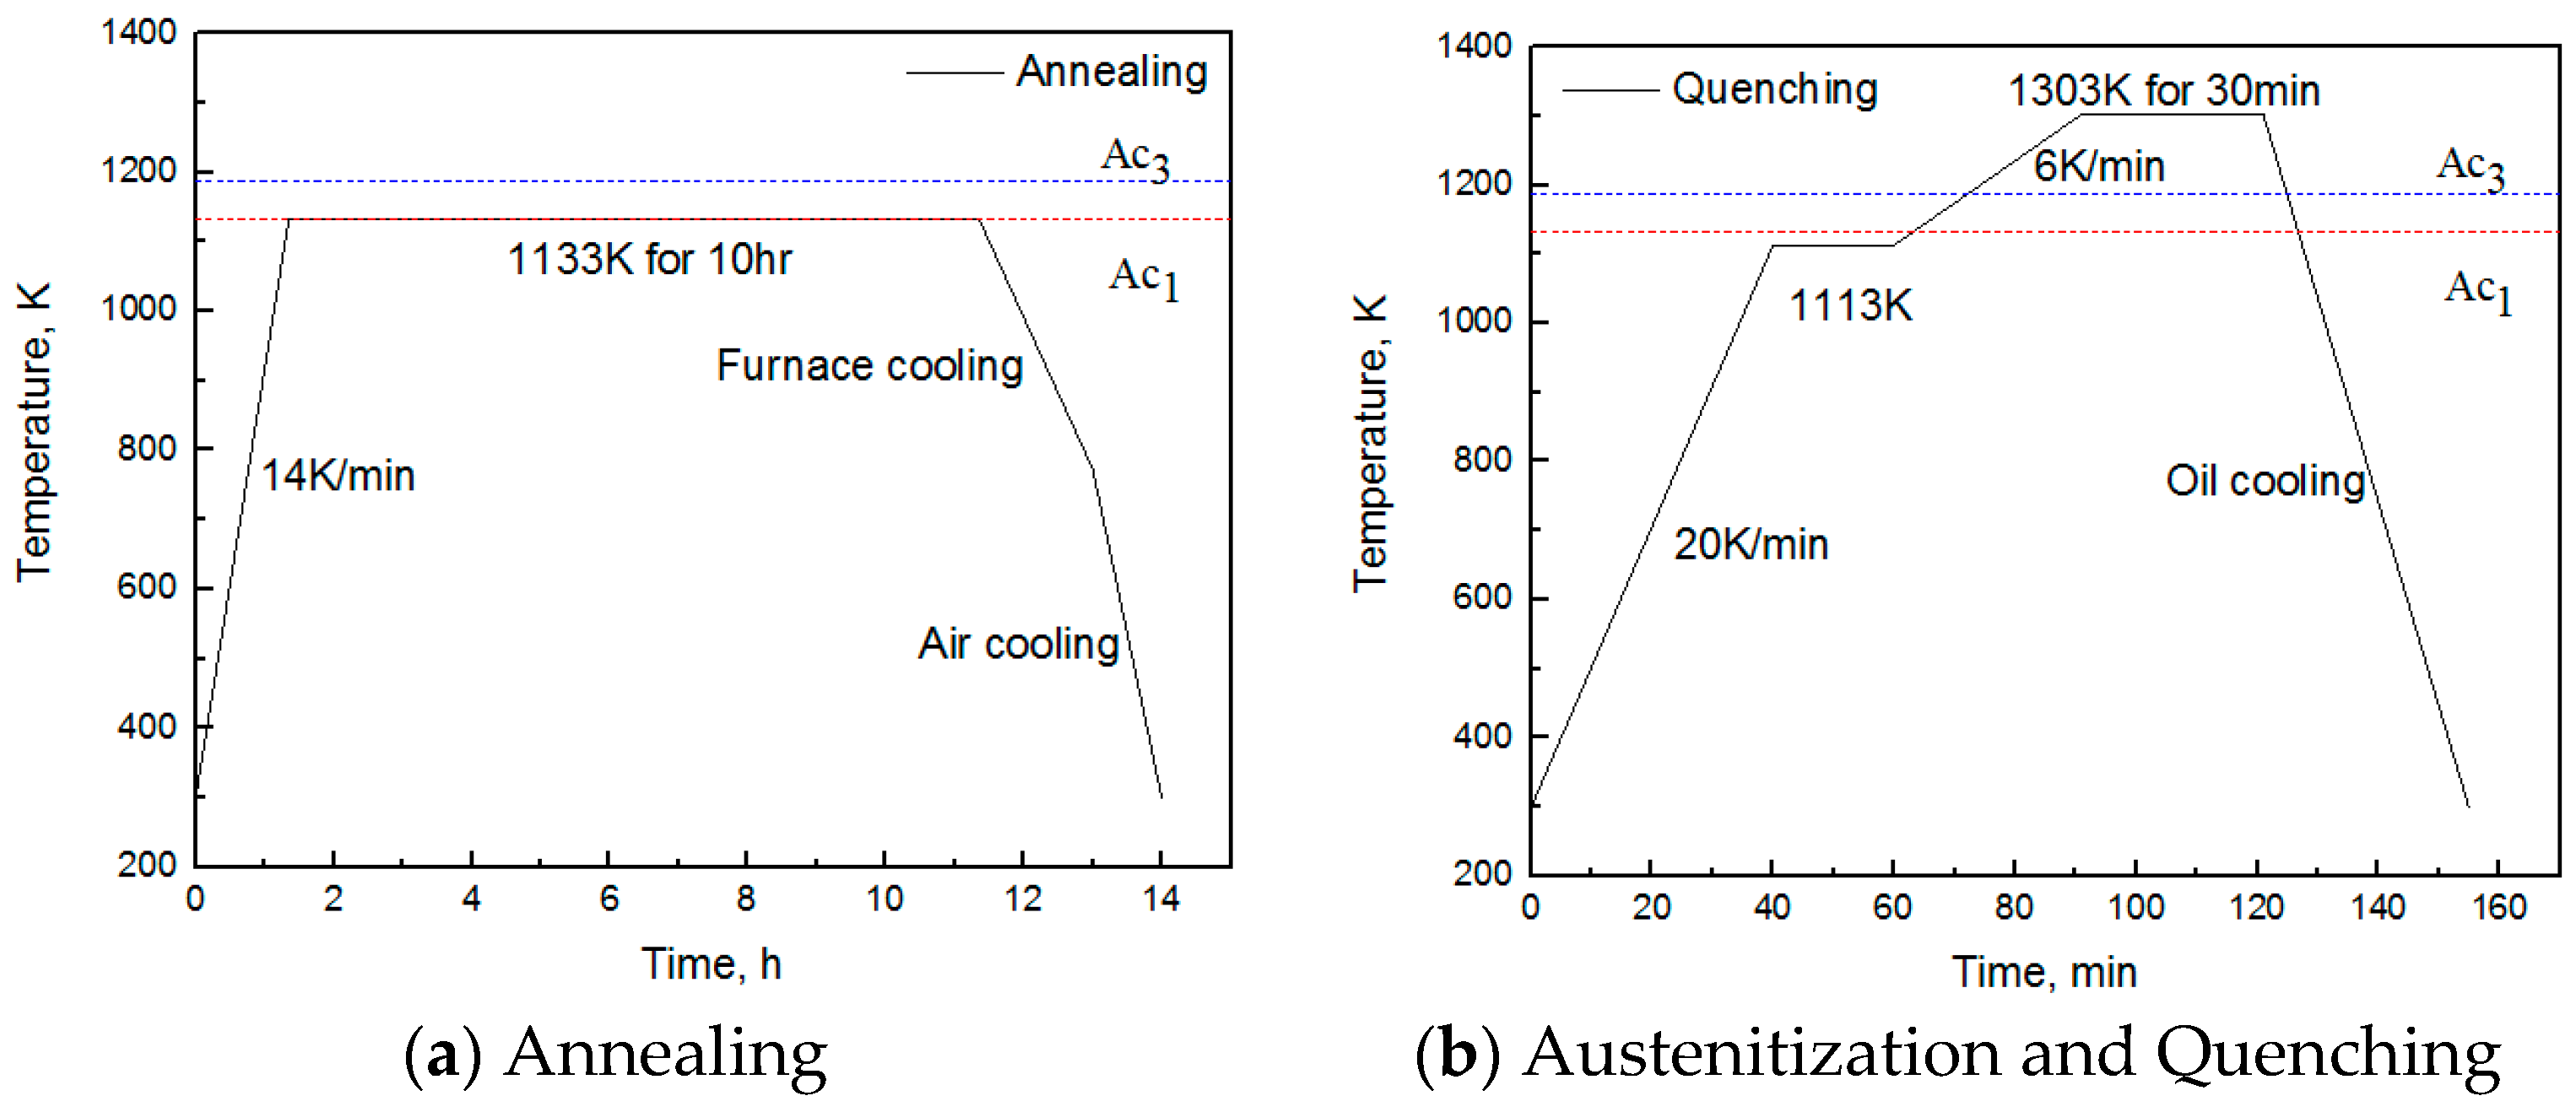
22]. The ingot was forged at 1373 K to bar stock with a diameter of 105 mm. According to CISRI industry practice, the forged ingot was annealed at 1133 K for 10 h, cooled to 773 K in the furnace, and further cooled to room temperature in air, as shown in
Figure 1a. The objective of annealing is to relieve the stress due to forging in order to reduce the risk of cracking, and to reduce the hardness of steel in order to increase its toughness and ductility. Some of the alloy carbides are undissolved to prevent the grain coarsening during annealing [
23]. The microstructure after annealing is composed of pearlite and spherical carbides [
24].
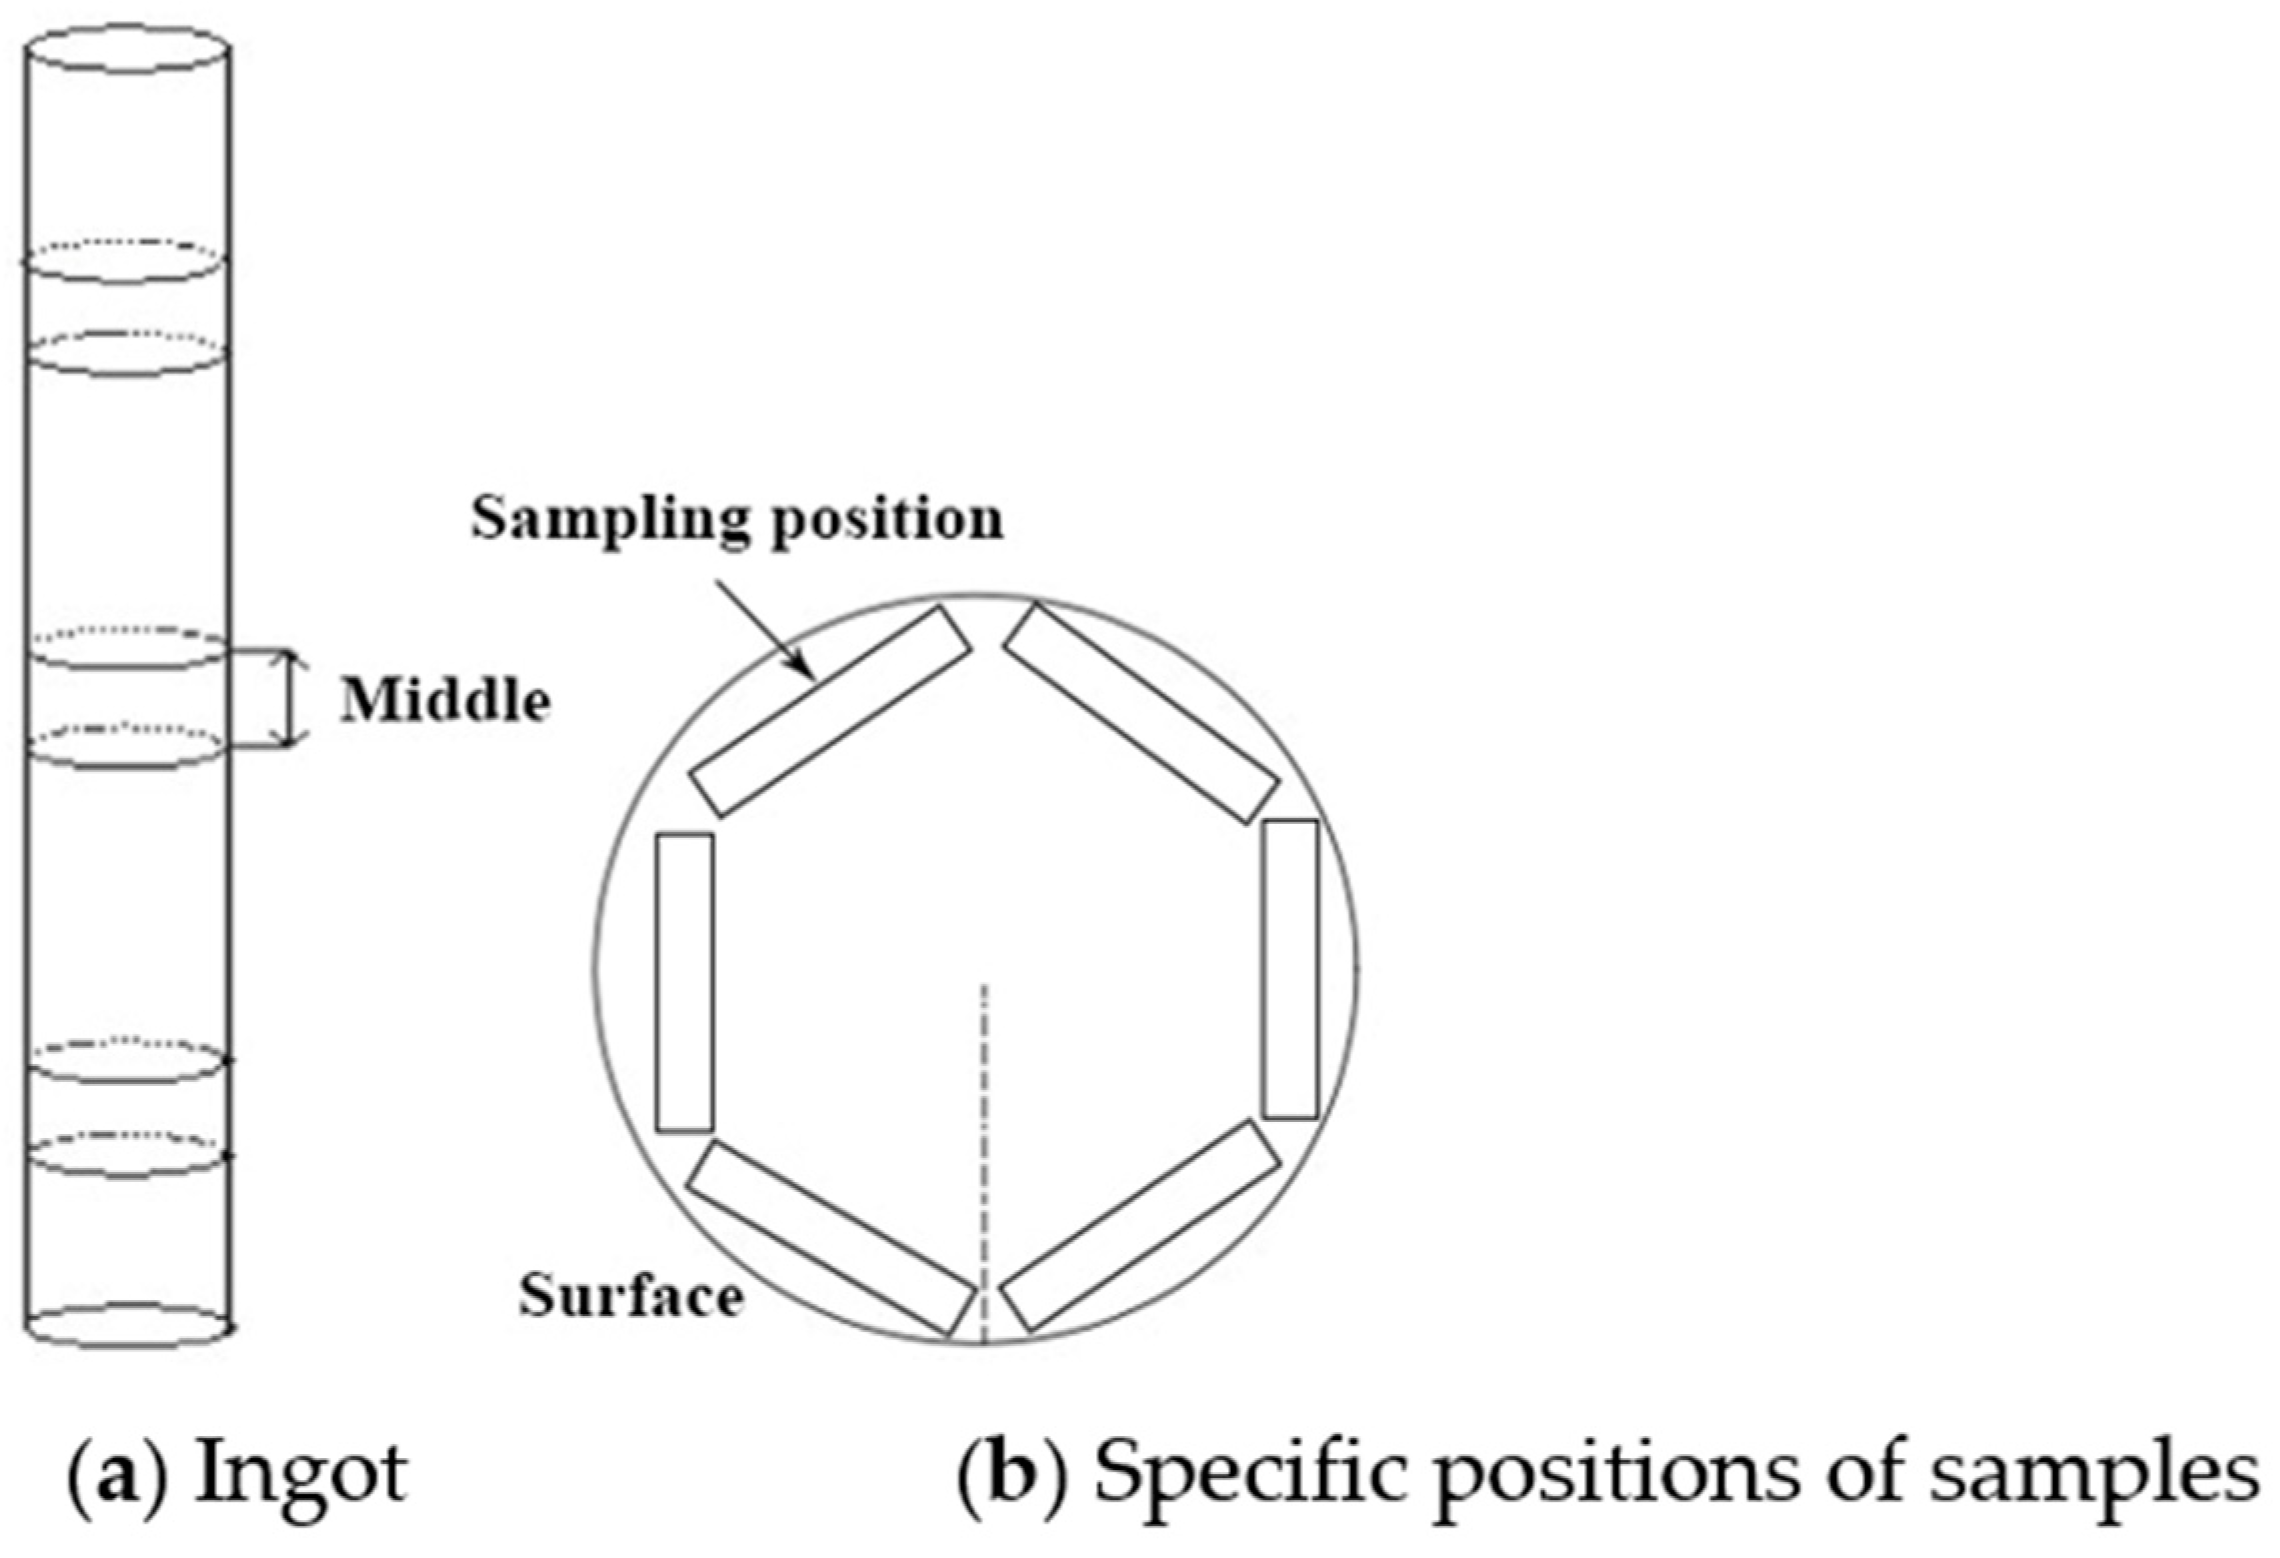
A 60 mm thick sample was cut from the middle of the annealed ingot, as shown in
Figure 2a. This sample was preheated to 1113 K at a rate of 20 K/min, held for 20 min, then heated to 1303 K at a rate of 6 K/min, held for an additional 30 min, and then quenched in oil at a quench rate of approximately 33 K/min, as shown in
Figure 1b.
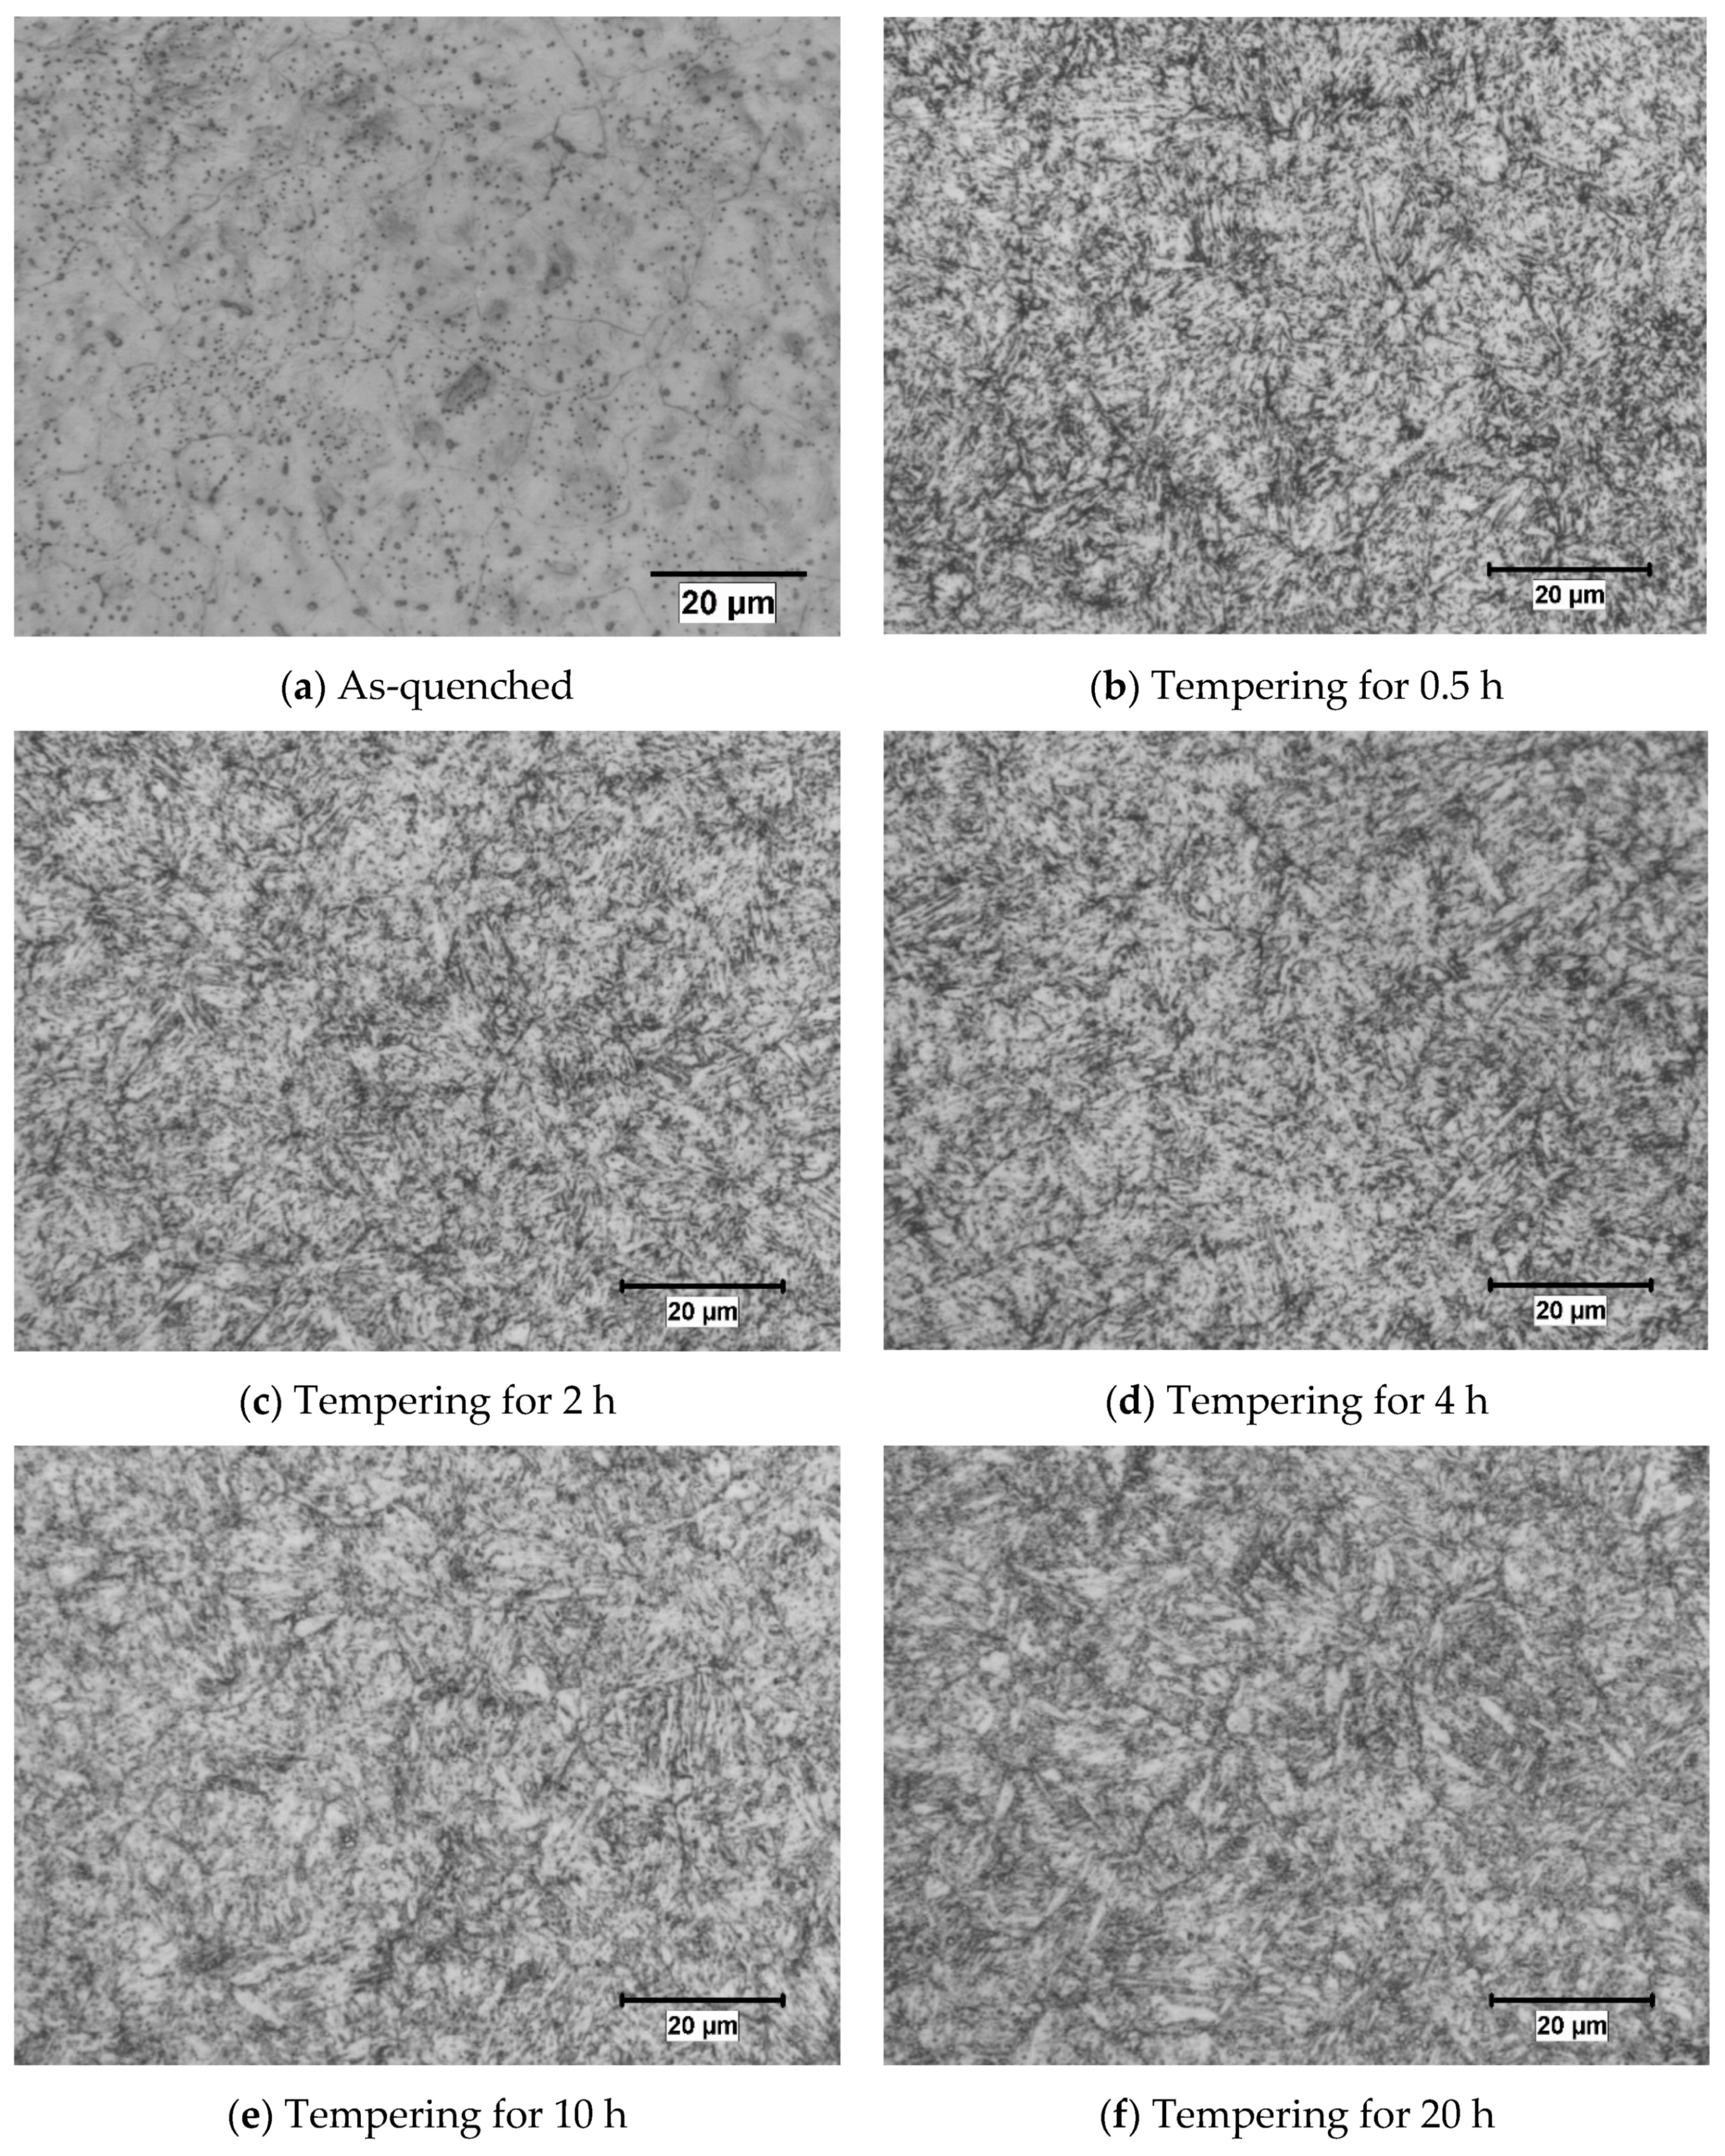
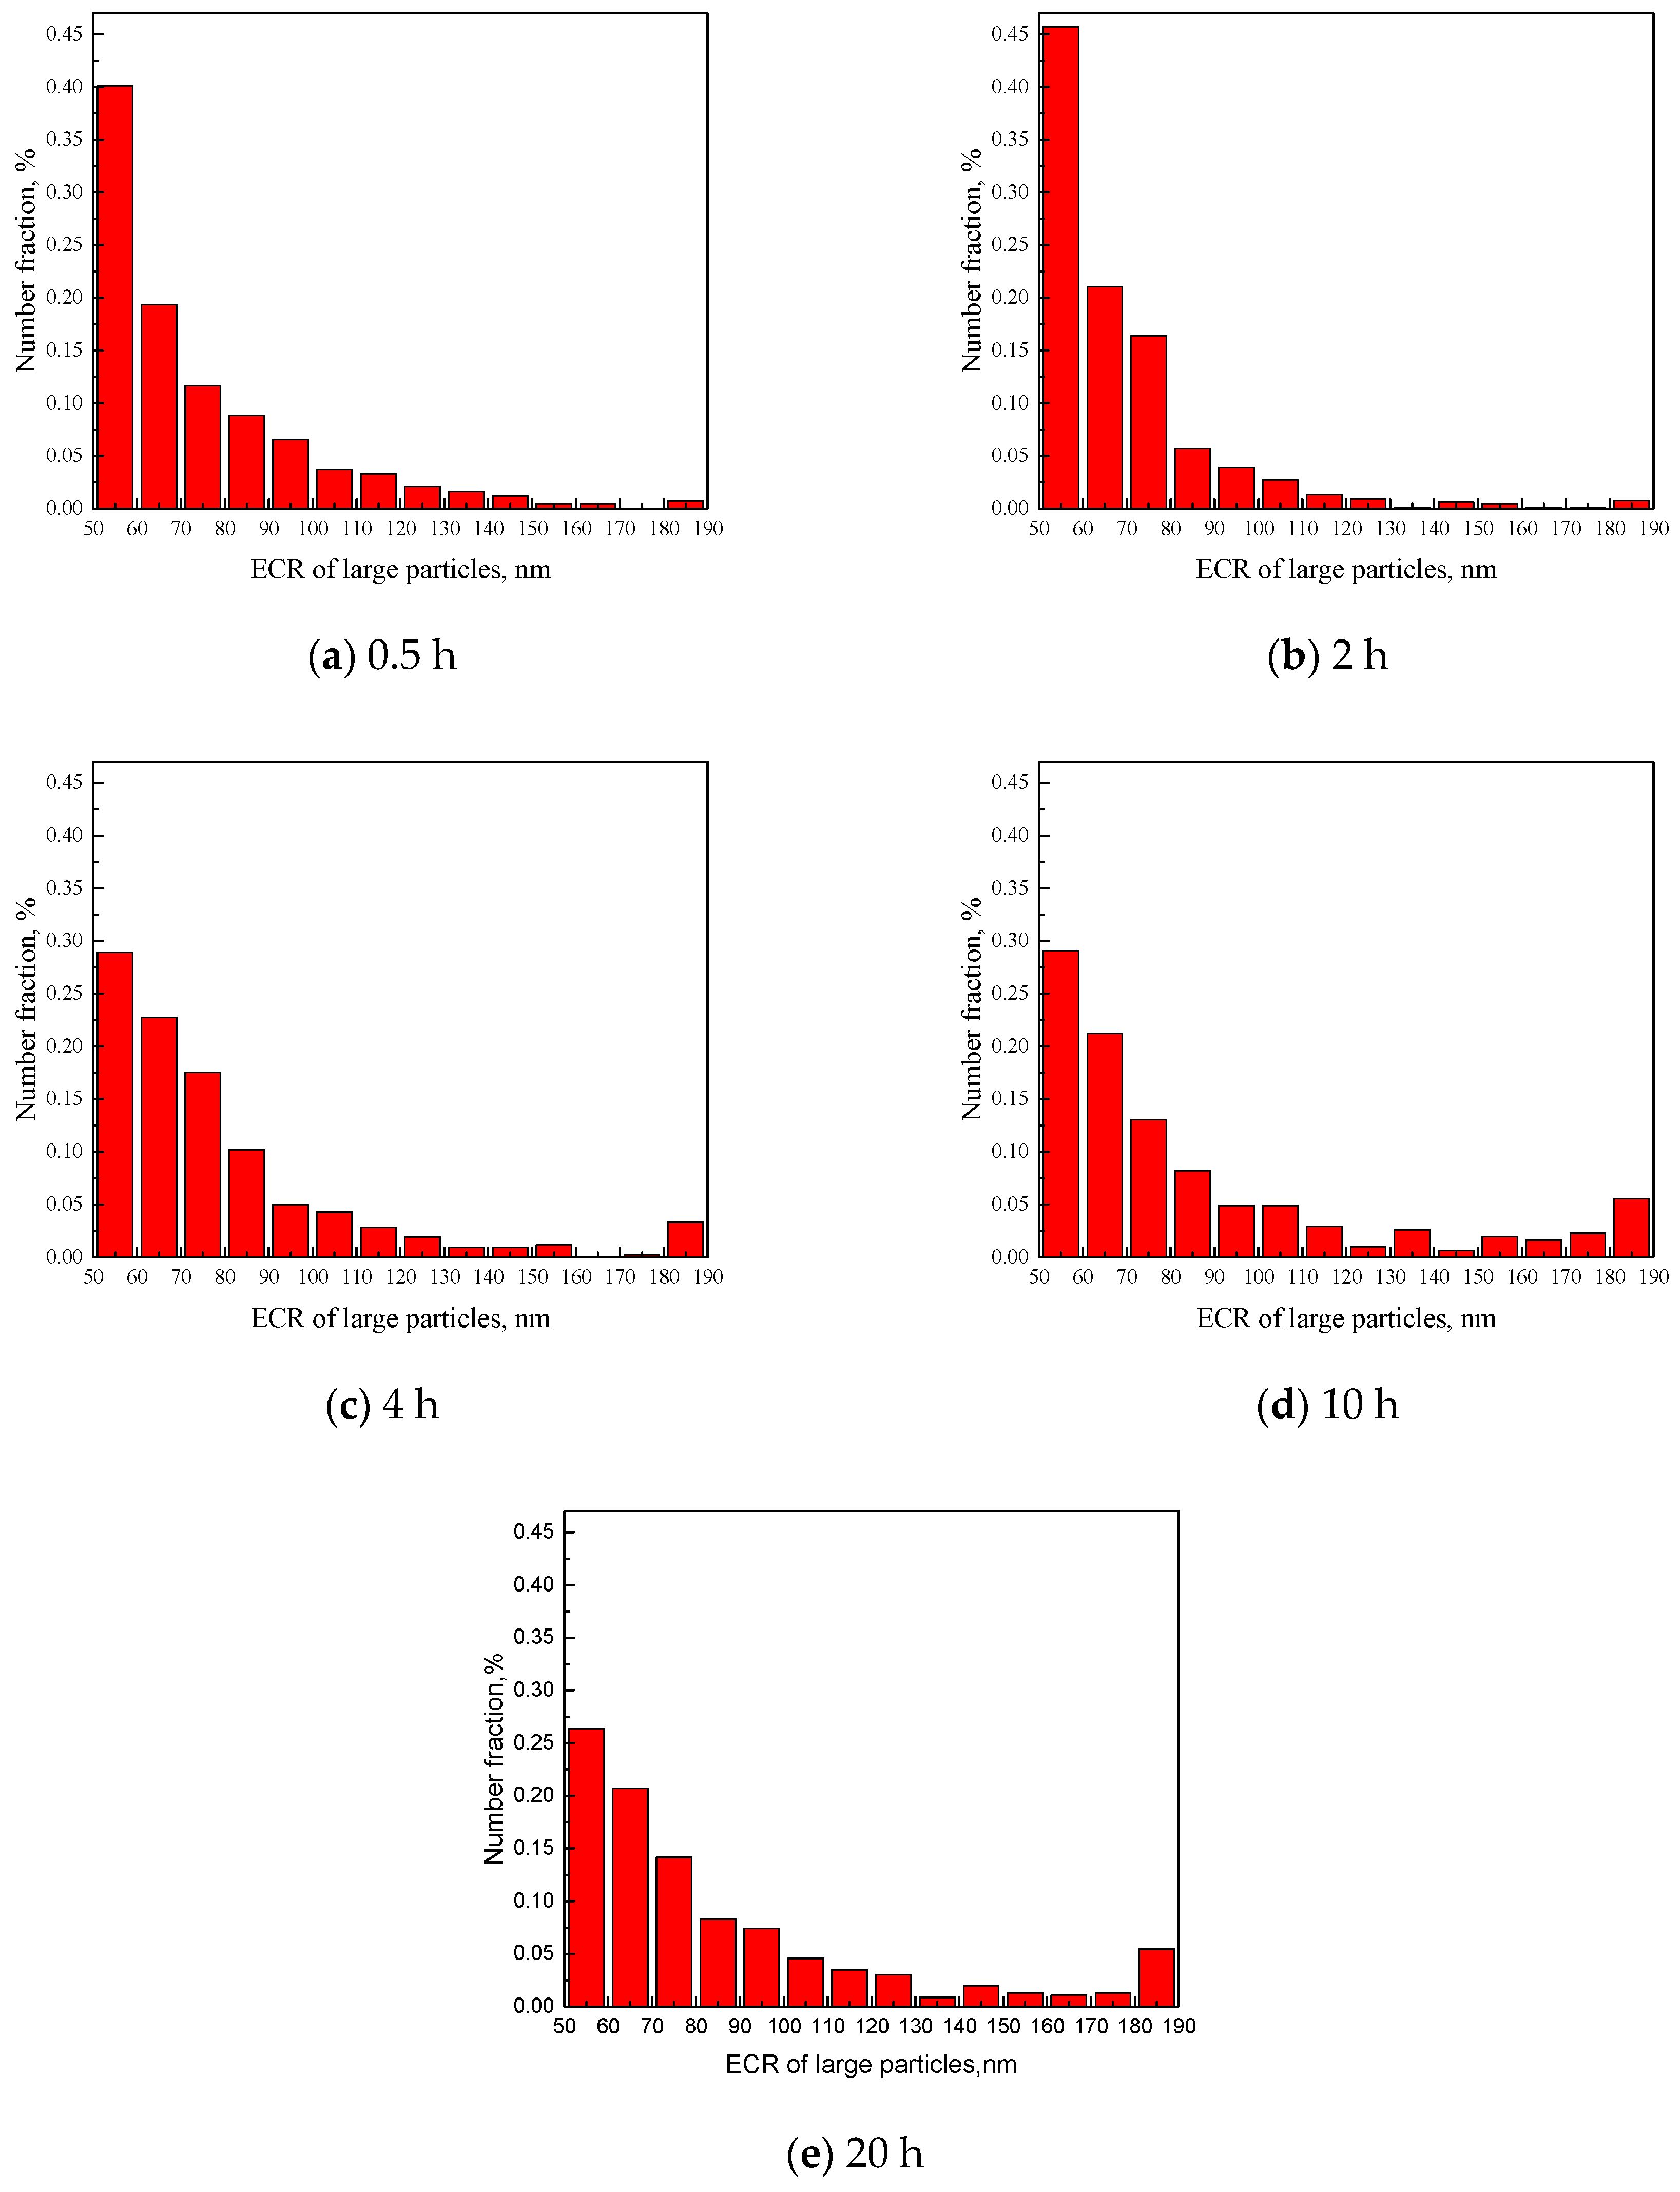
Six samples were cut near the surface of the quenched specimen, as shown in
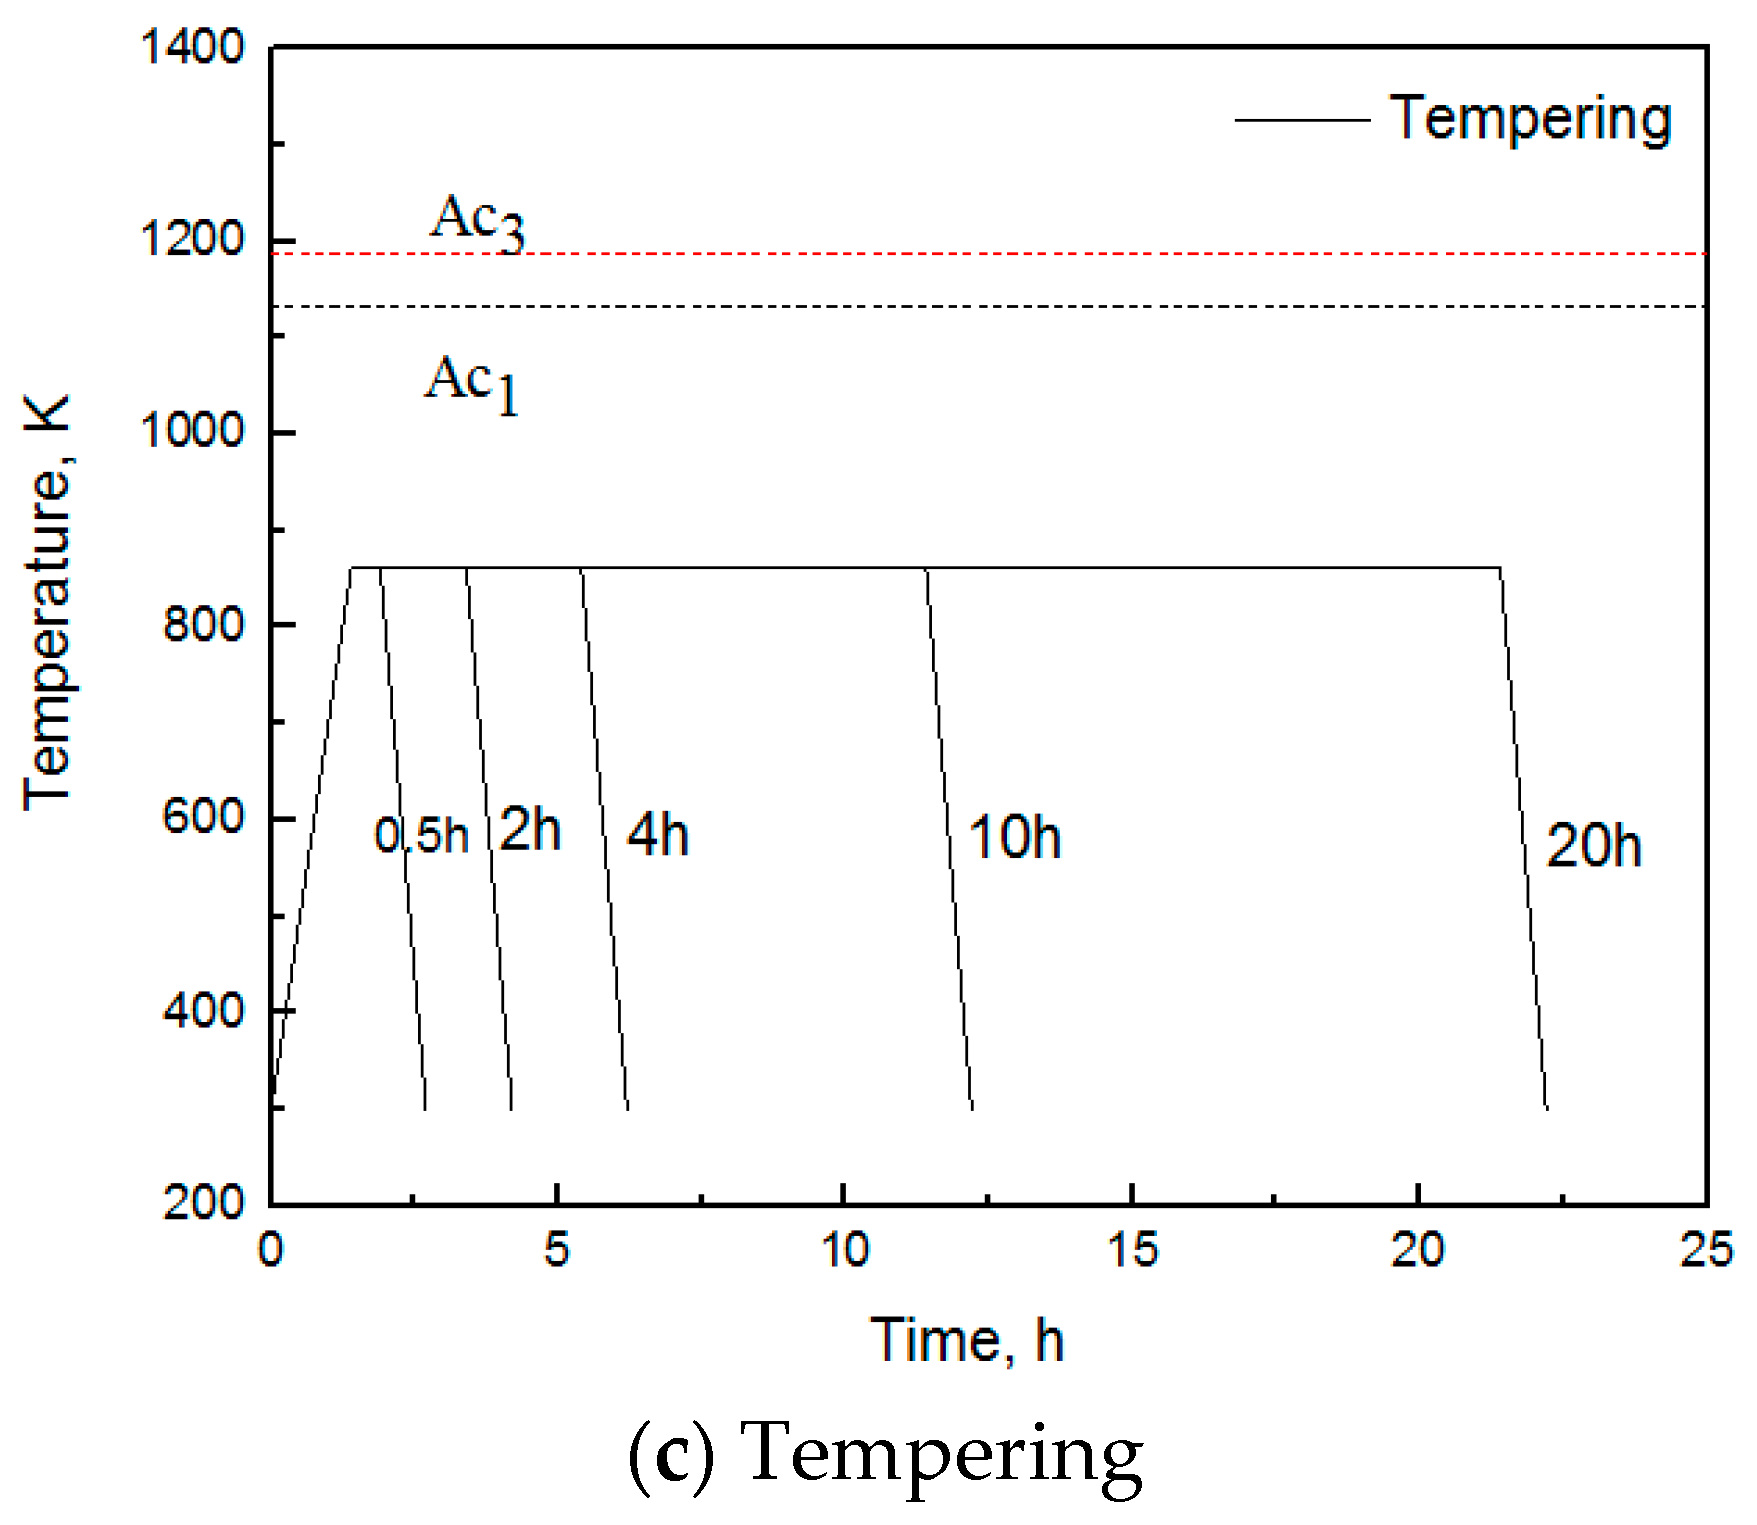
Figure 2b. One was left as-quenched. The others were tempered for 0.5 h, 2 h, 4 h, 10 h and 20 h at 863 K, respectively, and then cooled in air to room temperature, as shown in
Figure 1c.
Smaller samples were then cut from the main samples for transverse impact value (Charpy V-notch) tests, tensile measurements and metallographic studies. The dimensions of the Charpy test samples was 10 × 10 × 55 mm3; the tensile test samples were φ8 × 50 mm (fillet radius is 6 mm and gripping end is φ12 × 25 mm), and the metallographic samples were 10 × 10 × 10 mm3. The electrolysis sample for precipitate extraction was φ10 mm × 80 mm and there was a φ2 mm hole at one end of each sample for bolting copper wire.
The impact values of the six samples were tested by a ZBC2452-B Pendulum impact testing machine (MTS System Corporation, Shenzhen, China). Tensile strength and yield strength were measured with a CMT4105 electronic universal testing machine (MTS System Corporation, Shenzhen, China). A 500MRA Rockwell hardness tester was used to measure the hardness of the samples. The microstructure of the steel was observed with a 9XB-PC optical microscope (Shanghai Optical Instrument Factory, Shanghai, China). Precipitates were extracted by electrolysis using an electrolyte of 1% tetramethylammonium chloride and 10% acetone in methanol solution. The current density I = 0.04–0.06 A/cm
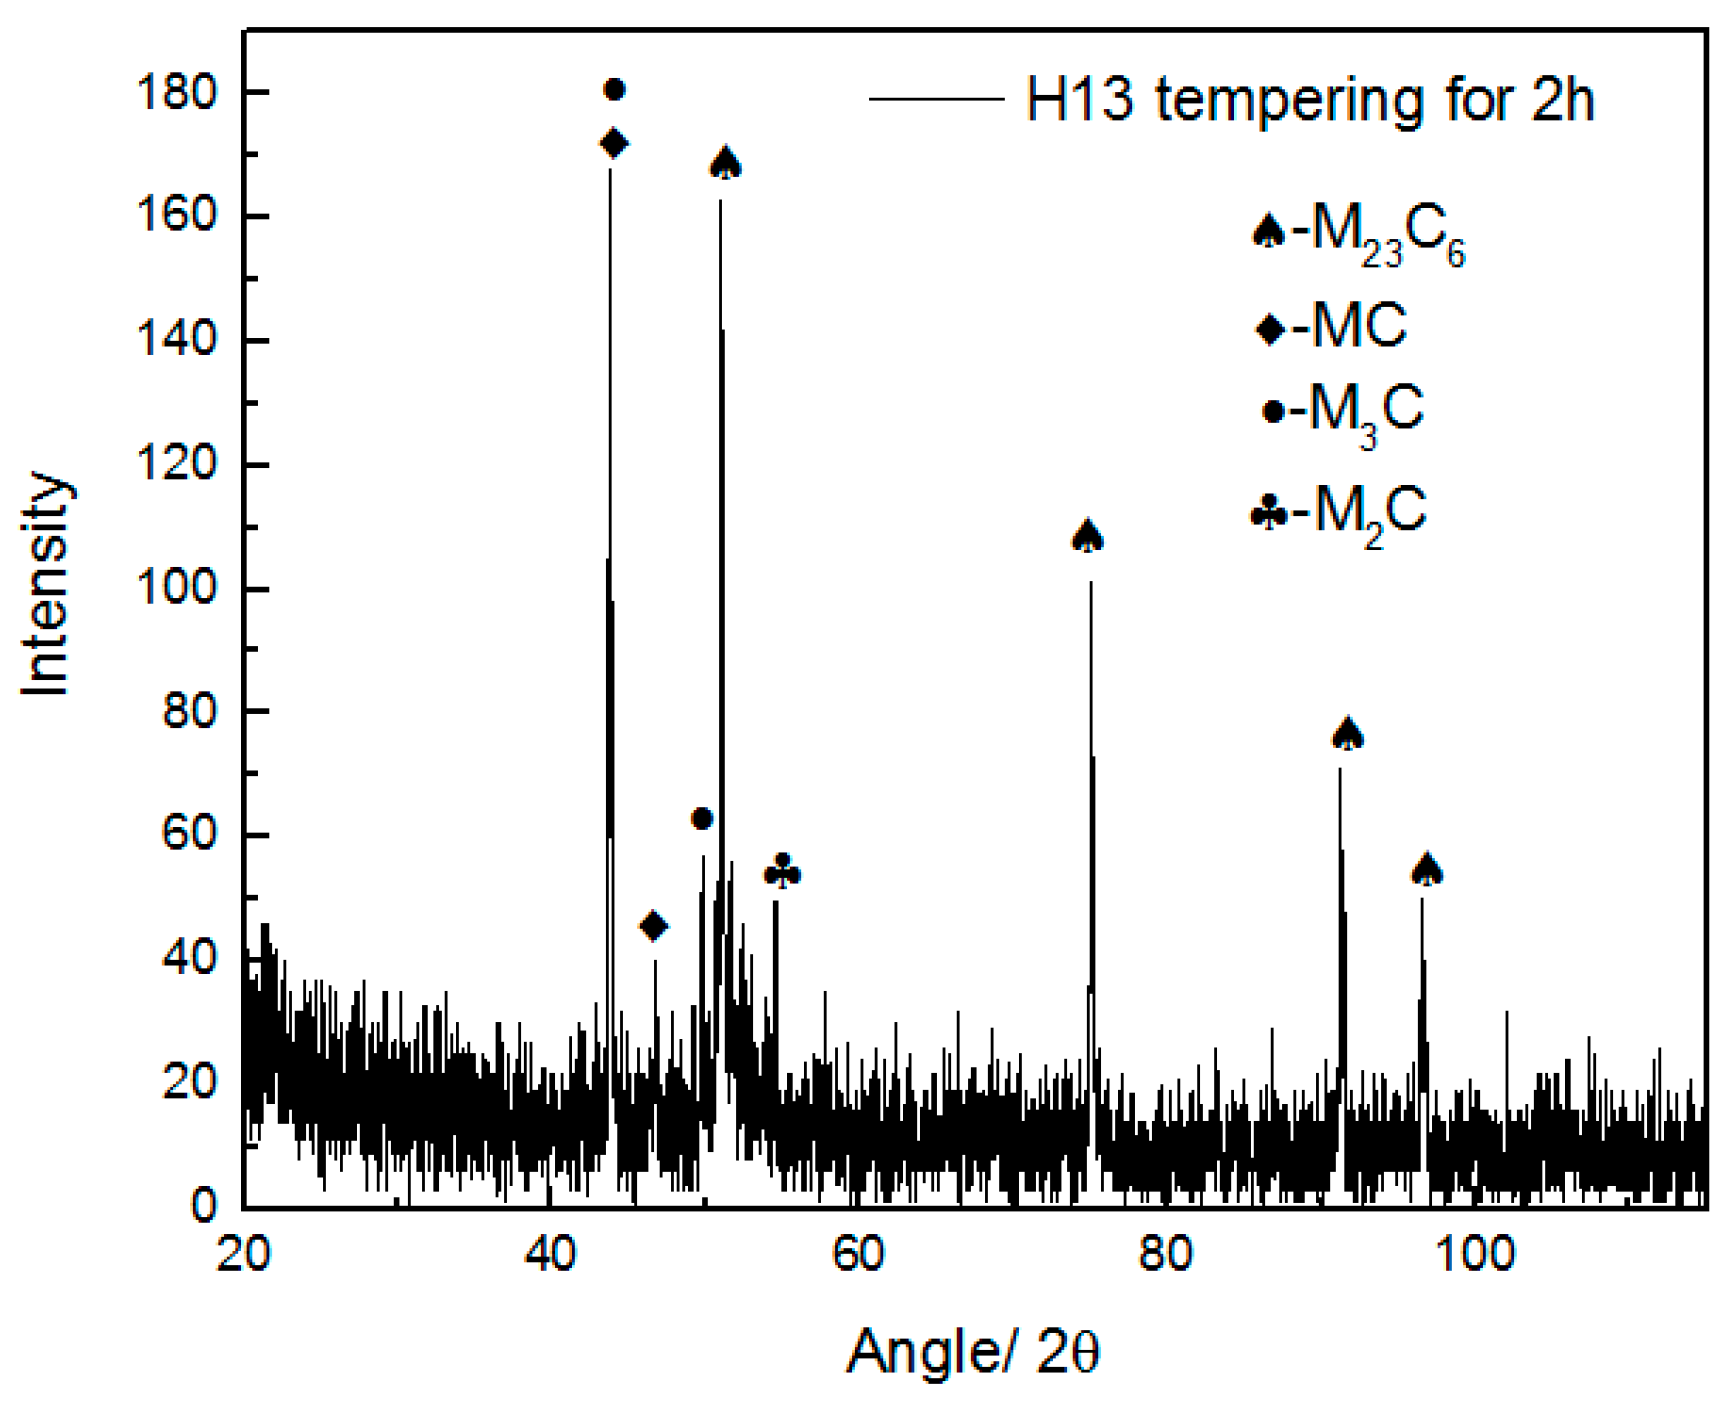
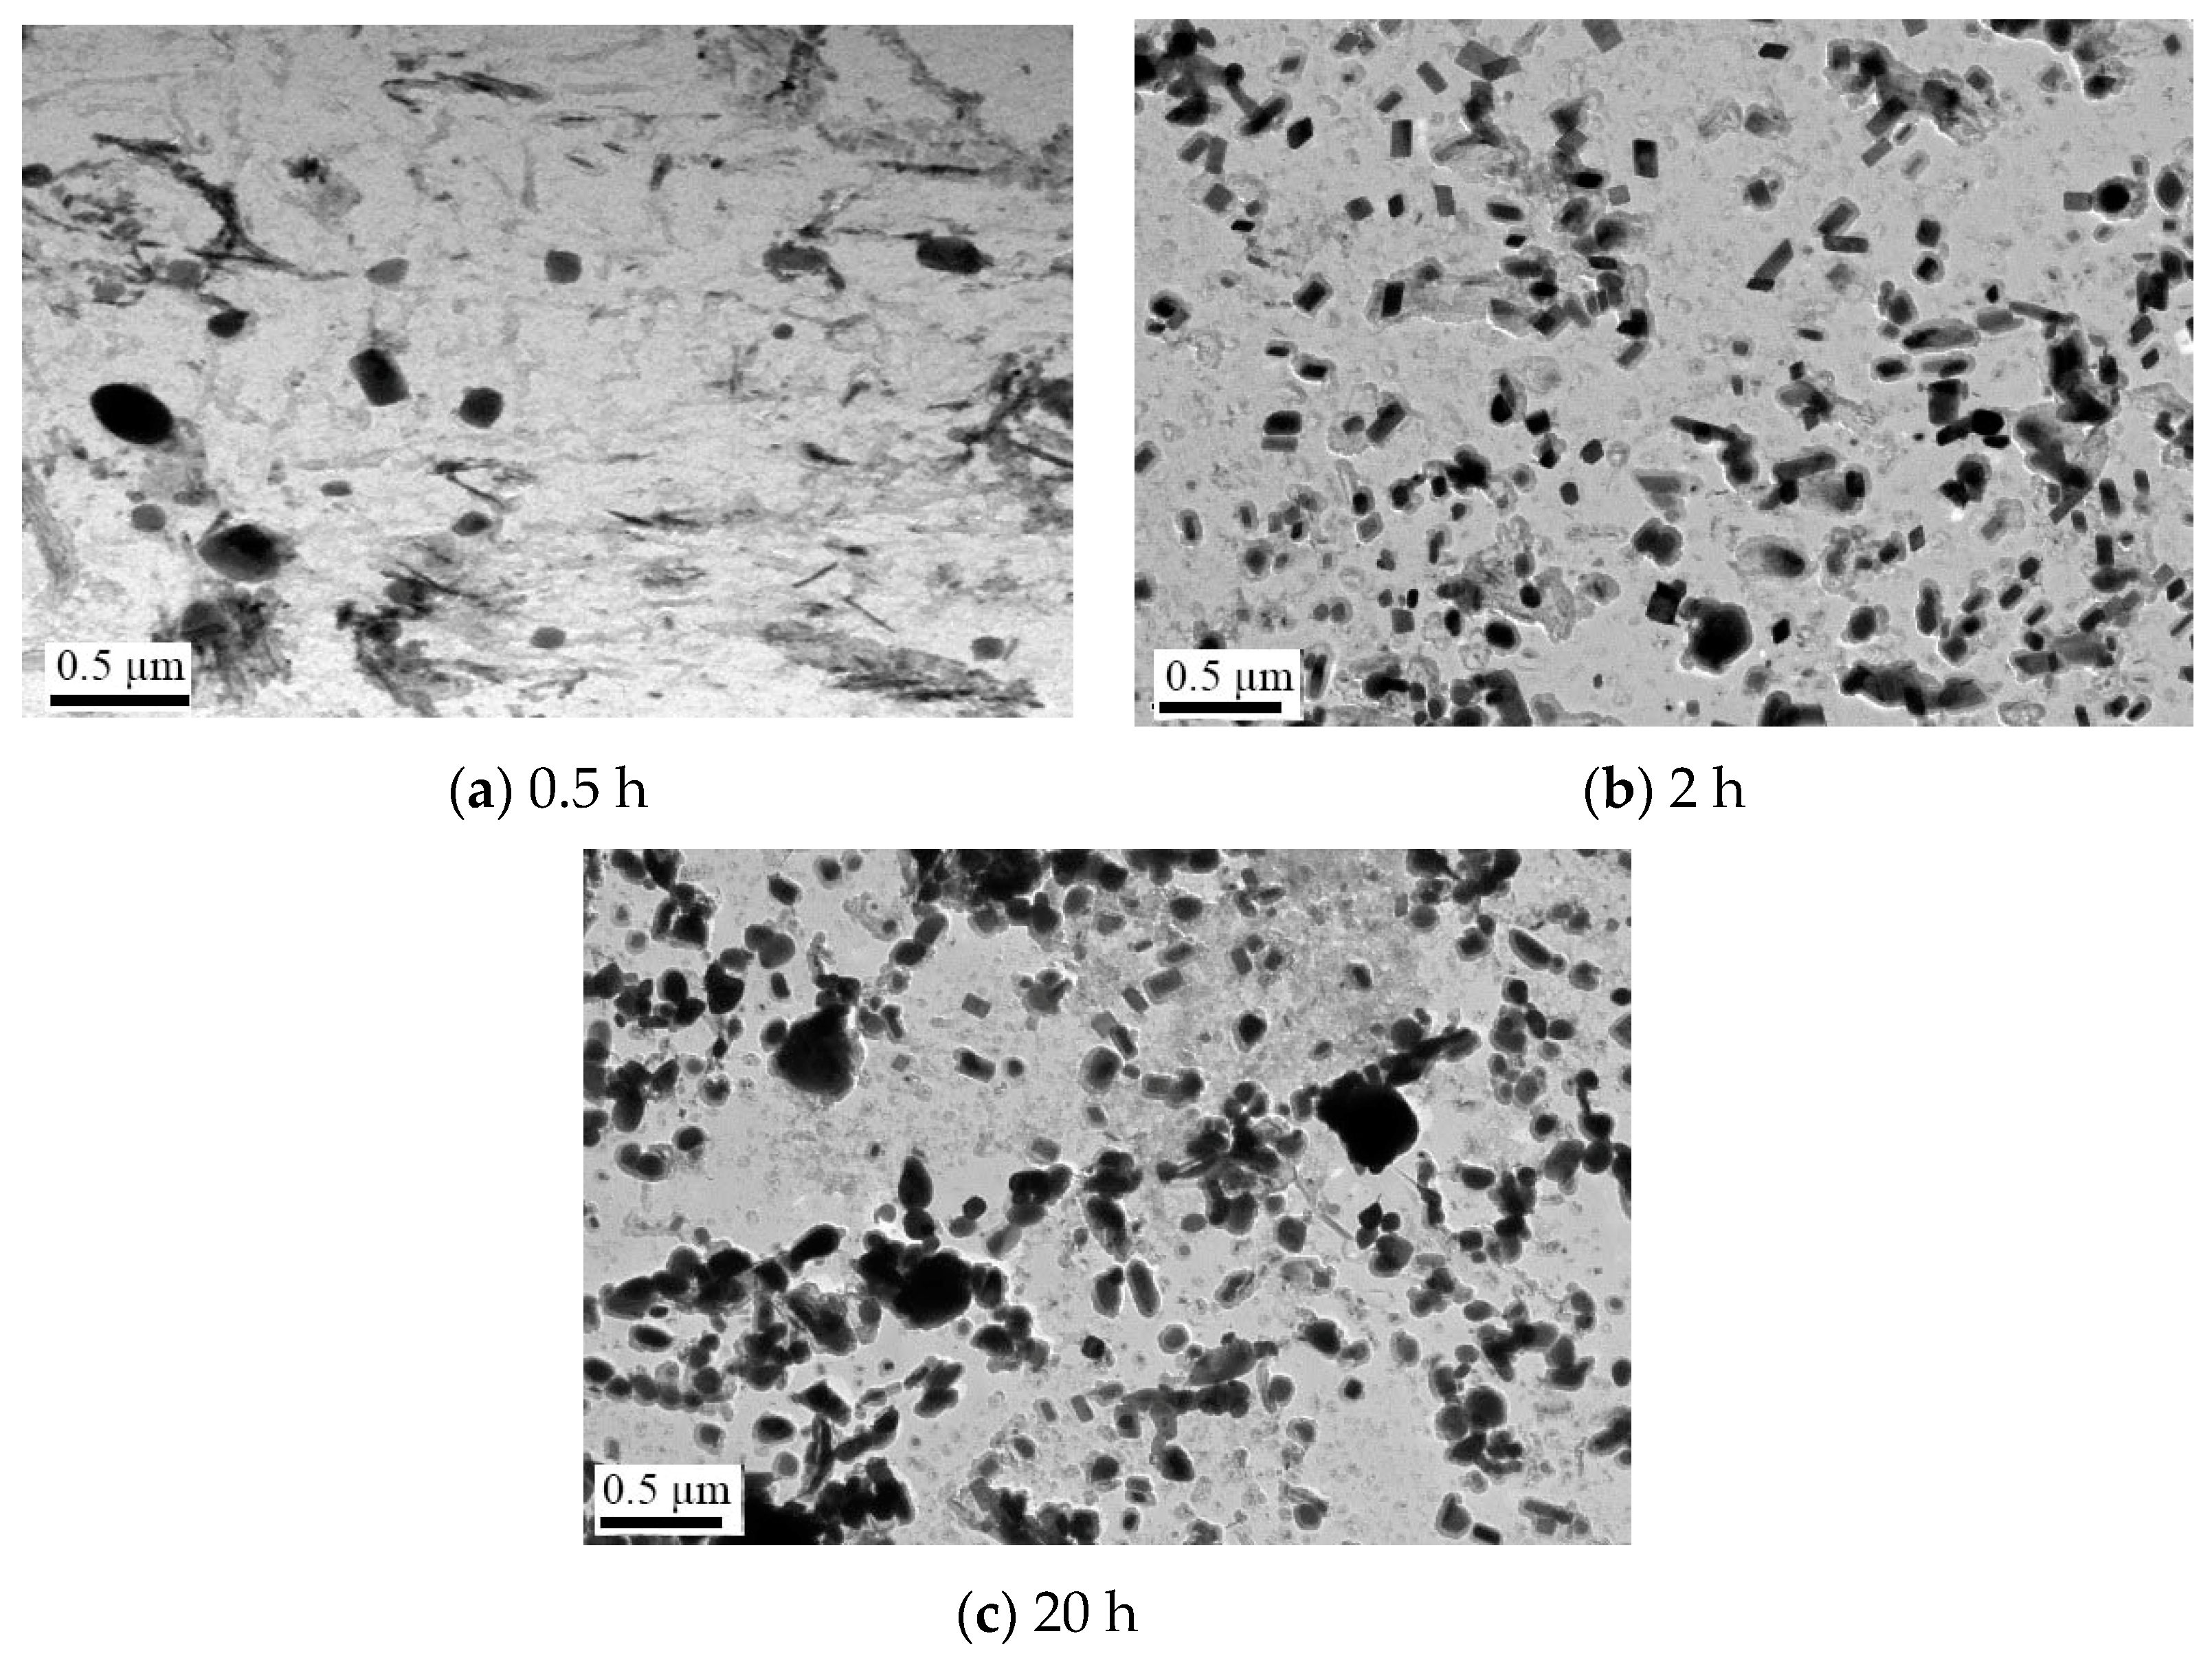
2. After electrolysis, residues were collected, cleaned with water and dried. The phase compositions of collected powders were identified by X-ray diffraction (XRD) (RIGAKU, Tokyo, Japan) with a Cu-Kα characteristic radiation source in the 2θ range of 20–120°. Microstructure of H13 was observed by optic microscopy (Clemex-Nikon system, Tokyo, Japan) and scanning electron microscopy (HITACHI SU3500, Tokyo, Japan) installed with energy dispersive spectrometer (EDS). The morphology and distribution of carbides in the five samples was examined using carbon extraction replicas with an F30 high resolution transmission electron microscope (HR TEM) (FEI Company, Hillsboro, OR, USA). The carbon replicas were prepared by depositing a 20–30 nm thickness carbon film on the sample surface etched with 8% nital after polishing. The carbon films were removed with 10% nital and supported on copper mesh [
25]. Thermodynamic calculations were carried out by using FactSage 7.2 software which was based on FSstel database for steels. This software is produced by Thermfact (Montreal, QC Canada) and GTT-Technology (Aachen, Germany).
4. Calculation of Thermodynamic and Coarsening Kinetics of Precipitates in H13
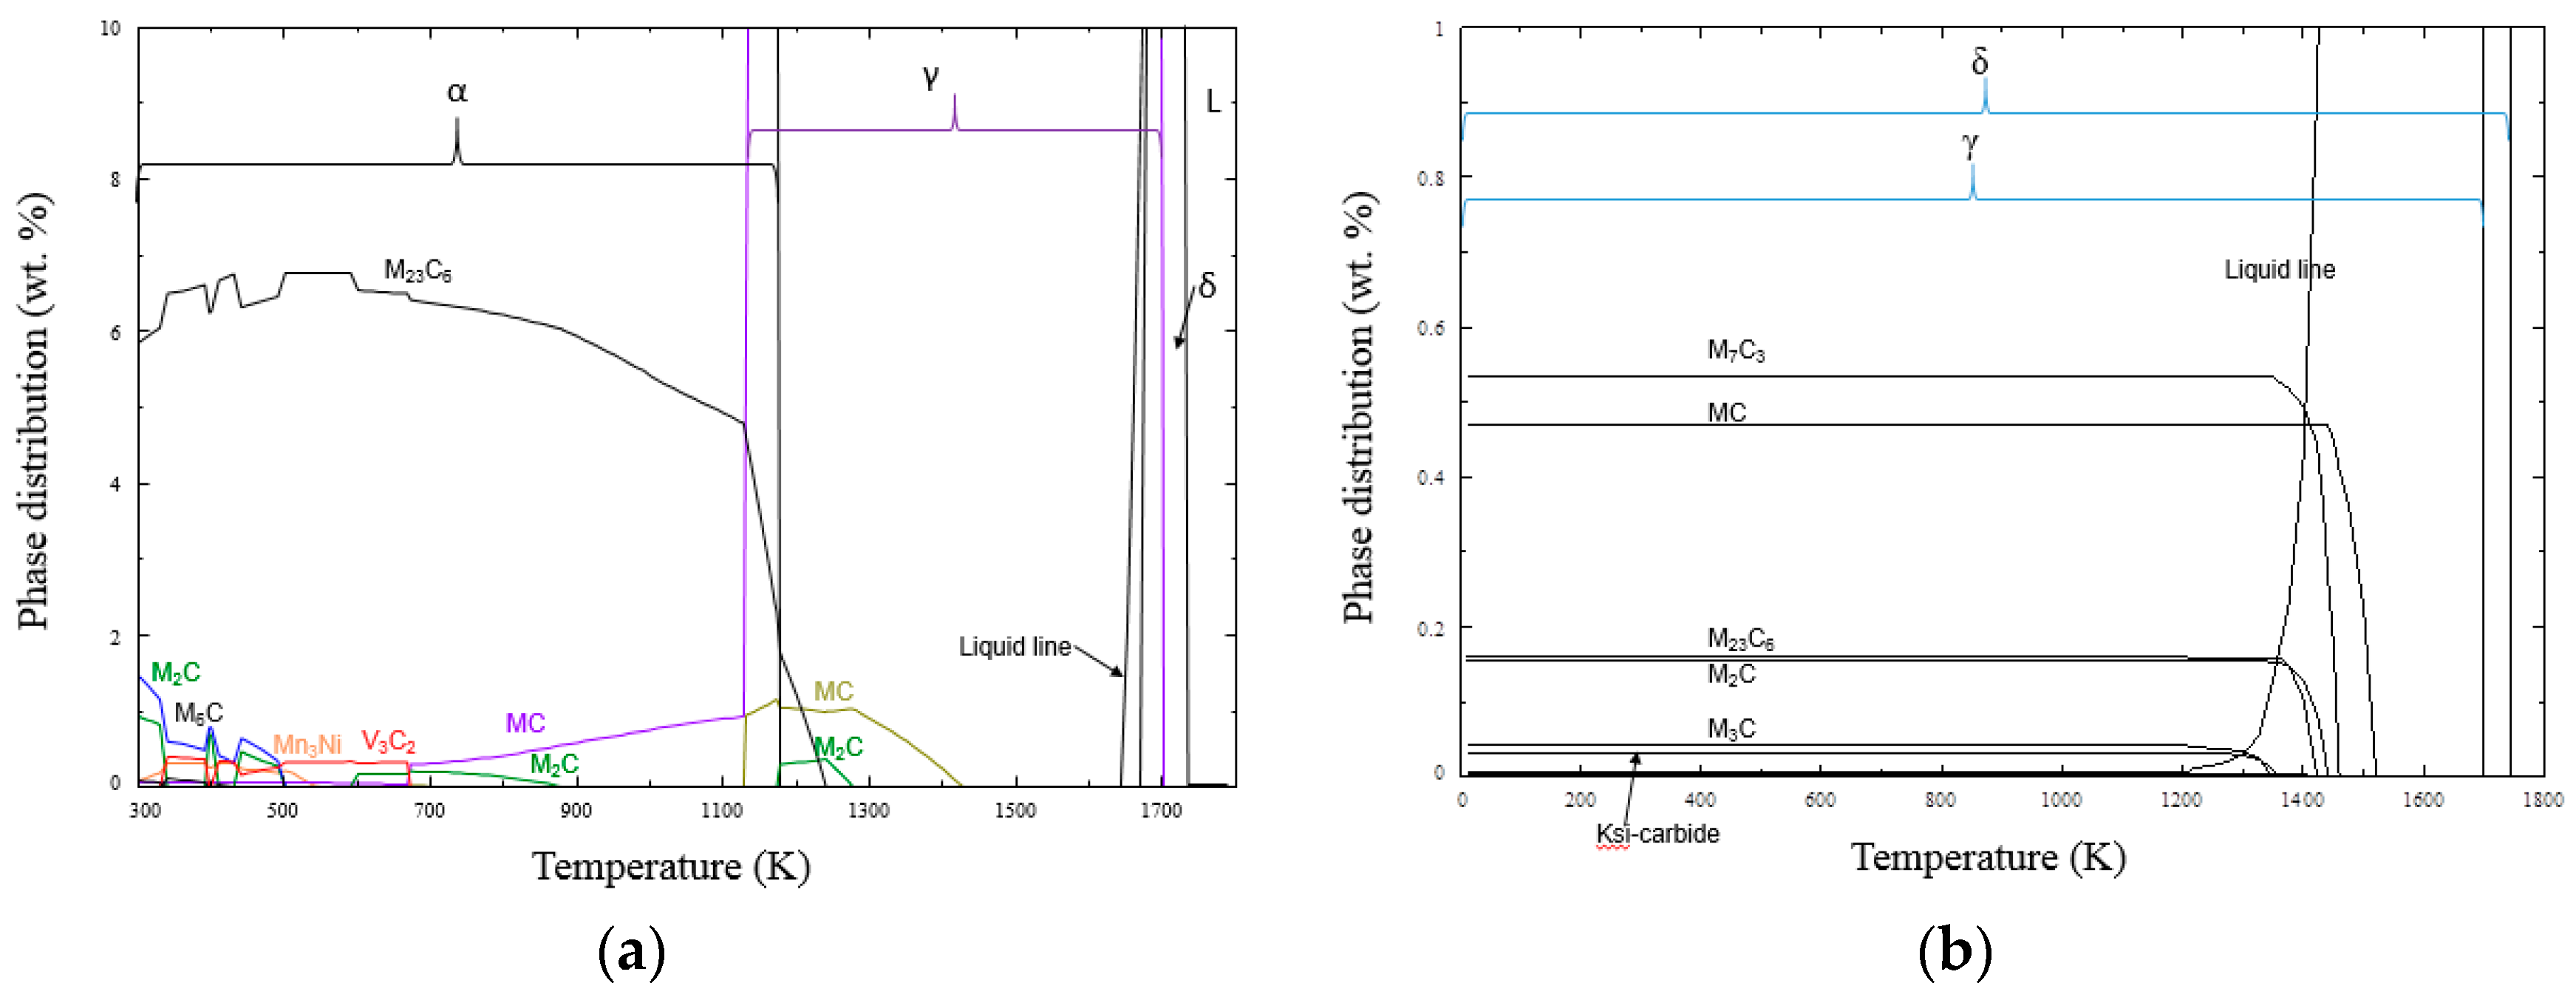
The phase diagrams shown in
Figure 9 were determined with the aid of FactSage based on the chemical compositions listed in
Table 1.
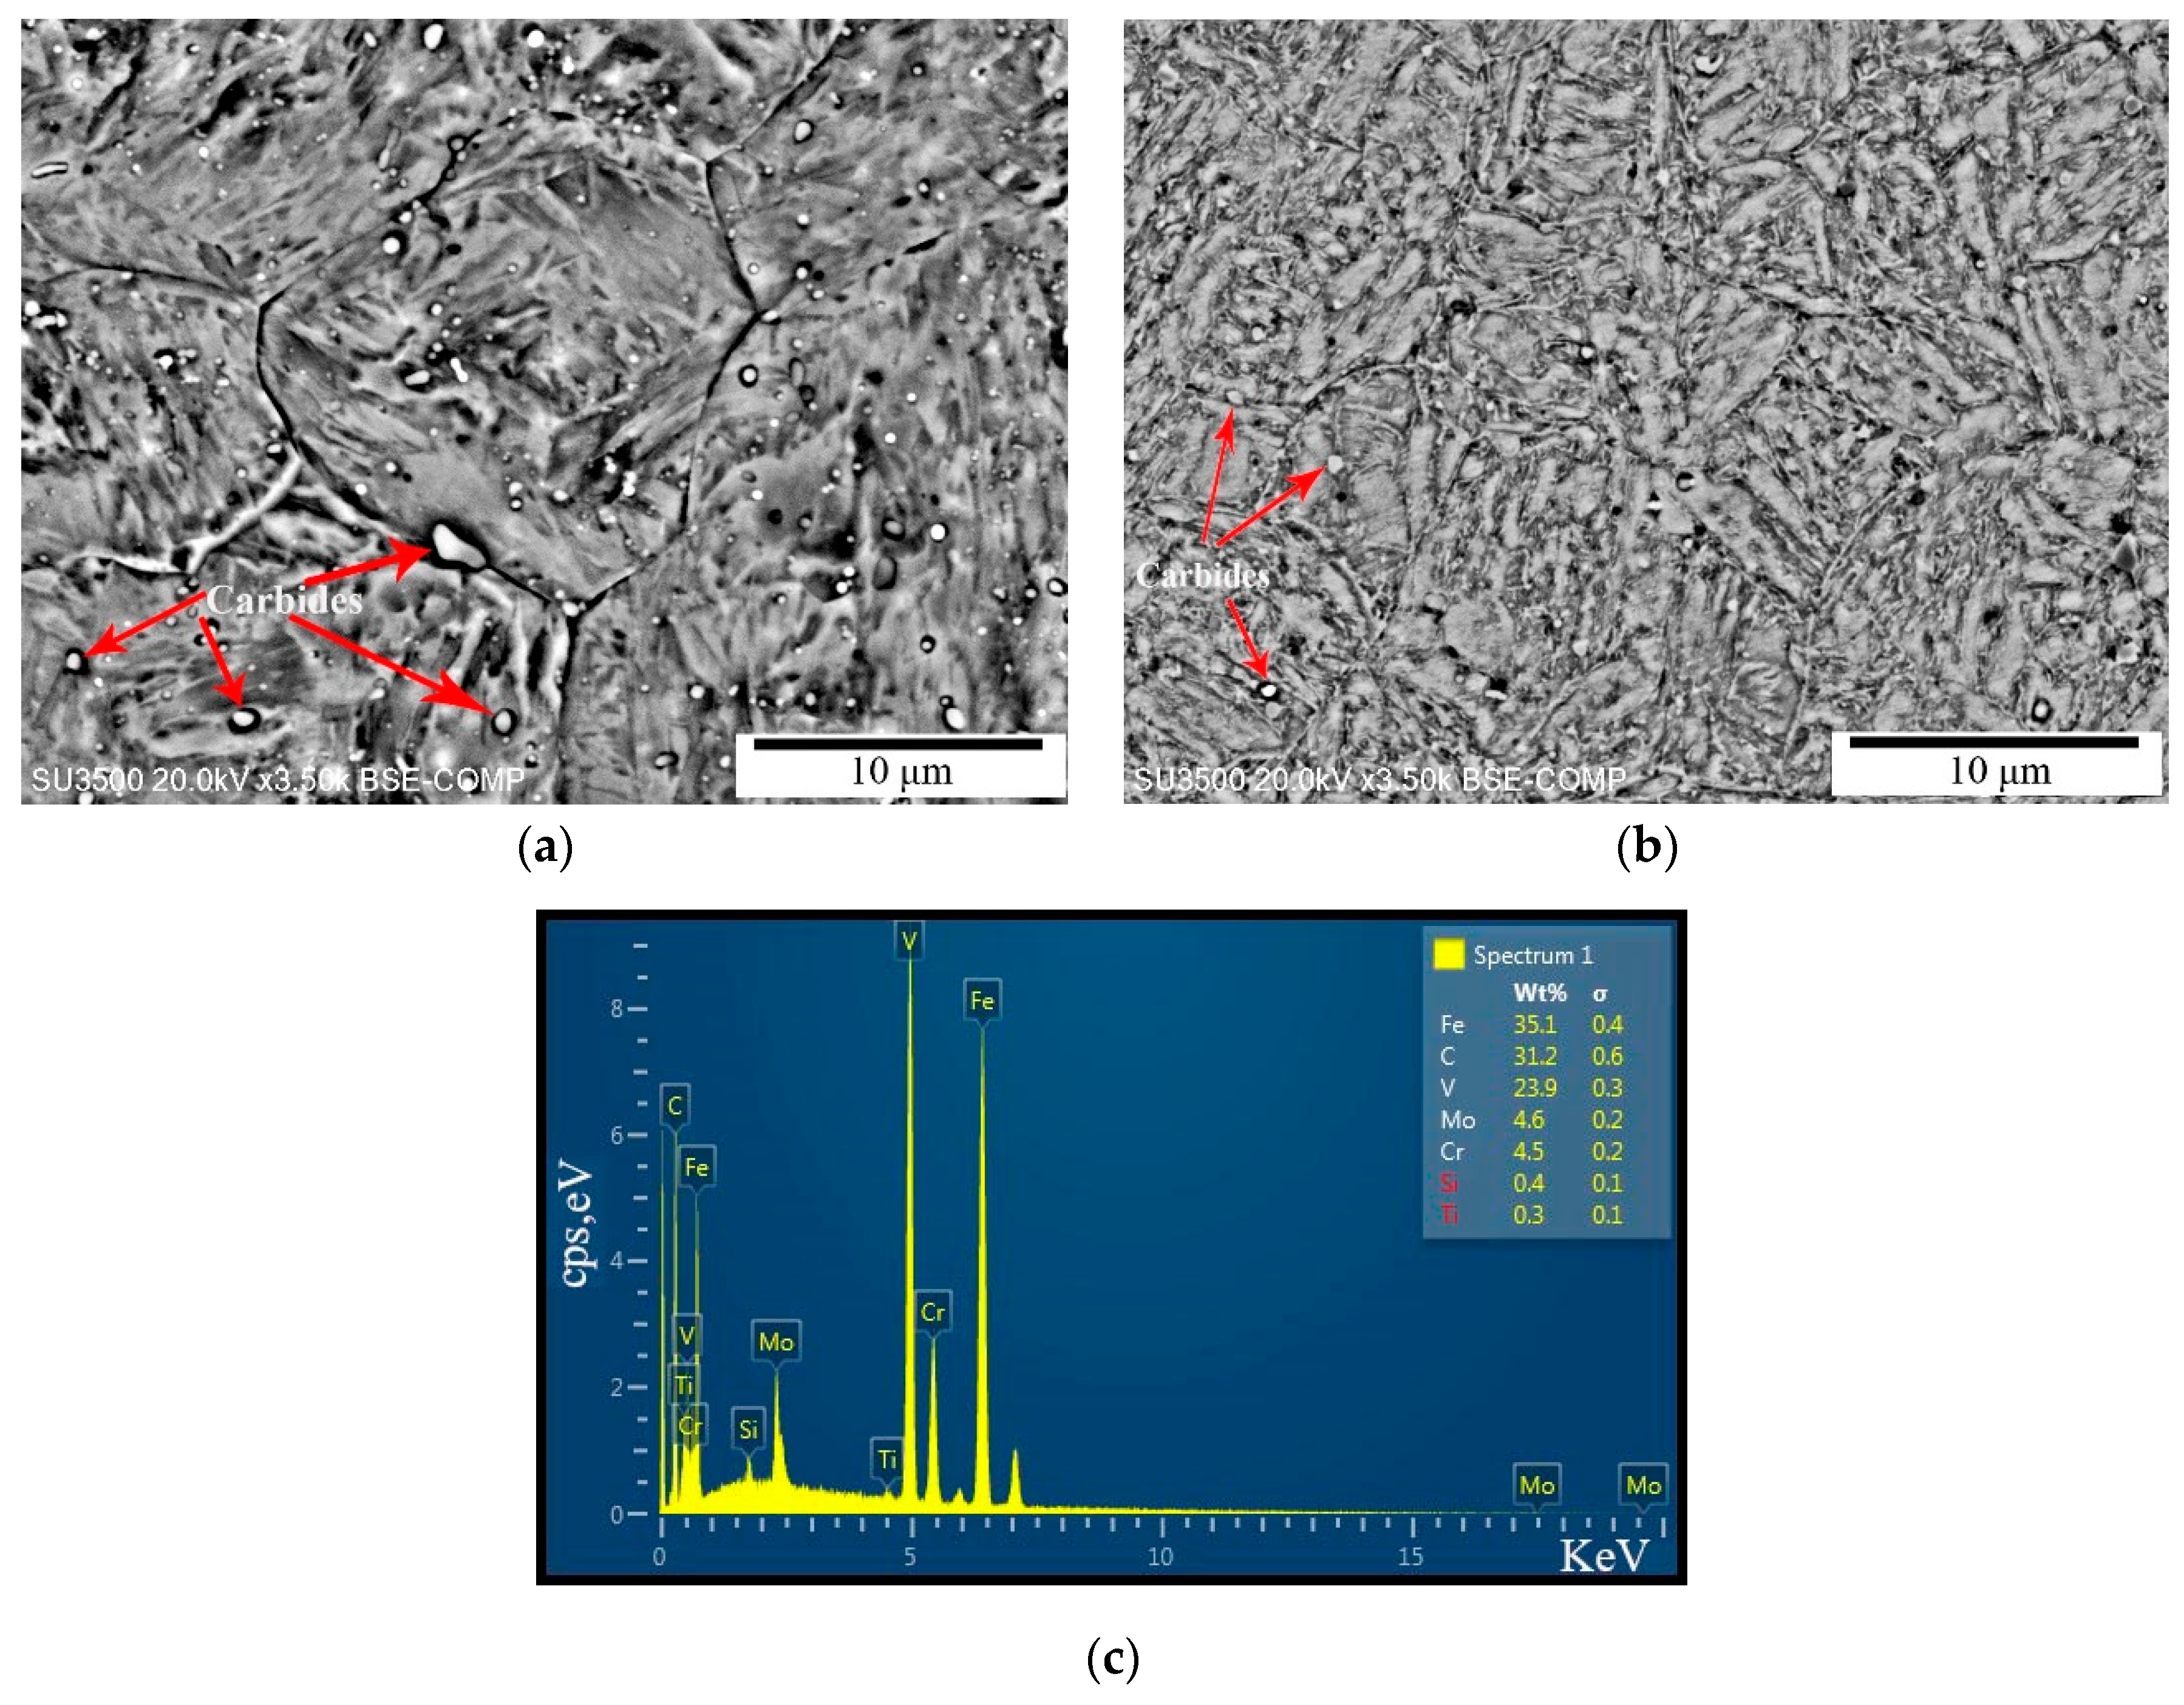
Figure 9a shows the equilibrium prediction. At the tempering temperature of 863 K, main precipitate is M
23C
6, which contains Fe, Cr, Mo and C and is 6.06 wt% of the matrix. In addition, MC mainly contains V and M
2C mainly contains Mo. The calculated precipitation types correspond well with the experimental results.
To account for continuous cooling during processing, the Scheil-Gulliver Model is to calculate the alternative phase diagram shown in
Figure 9b. Precipitation types are basically in accord with the observations of the experiments except M
7C
3. In fact, M
7C
3 tends to aggregate and combine with Fe to form M
23C
6 when the steel is tempered for a long time [
22]. It can be seen that cementite and Ksi-carbides also precipitate and they exist stably in a temperature range of 500 K–1100 K. However, cementite is more stable than Ksi-carbides in high temperature tempering [
26]. The mass fraction of cementite is about 0.041 wt%.
The precipitate coarsening model presented by Lifshitz et al. [
29] and Wagner et al. [
30] are known collectively as the LSW model. The principal assumptions in the LSW model are (i) the volume fraction of the precipitate is very low so that the diffusion fields of the neighboring precipitates do not overlap; (ii) the precipitates are spherical; and (iii) no elastic strains exist between the matrix and the precipitate.
The general formula of Ostwald ripening can be expressed as follows [
29],
where
is the average radius of precipitated phase at time
t;
is initial radius of precipitated phase;
m is the coarsening rate of precipitated phase during Ostwald ripening process.
It is commonly recognized that coarsening rate of carbides is proportional to the mole fraction of rate-controlling element [
35,
36]. For M
3C, it is carbon. However, other elements like Cr, Mn and V will influence the coarsening rate, because they have lower diffusion coefficient than carbon. For M
23C
6, it is Cr. But Mo and Mn will influence the coarsening rate, too.
Bjorklund [
37] reported that when r reaches large values, slow diffusing substitutional alloying elements control the coarsening rate. The rate constant will then be proportional to the quantity
, where
is the partition coefficient of species i between the precipitates (β) and the matrix phase (α),
. Where,
is mole fraction of species i in precipitate, and
is mole fraction of species i in ferrite.
Thus, an accurate coarsening rate can be established as follows [
38,
39,
40],
In Equation (4), σ is surface energy between alloy compounds and ferrite, J/m2; Vp is molar volume of precipitated phases, m3/mol; Di is the diffusion coefficient of species i in ferrite, m2/s; T is thermodynamic temperature, K; R is gas constant; therefore, the unit of m is .
In a generalized multicomponent alloy system, such as H13 steel, the overall coarsening rate constant
m results from the consideration of various solute additions. It can be also expressed as follows in Equation (5),
where
is coarsening rate due to each alloying element. Faranak et al. [
41] deployed this model to predict the coarsening of cementite in medium carbon steels. M
23C
6 coarsening was also estimated by this model [
10].
The diffusion coefficients of the relevant elements are listed as follows [
42]
The interfacial energy formula between cementite and ferrite [
42] is also given as Equation (12).
Mole volumes of M
3C and M
23C
6 in ferrite are 2.337 × 10
−5 m
3/mol and 0.79 × 10
−5 m
3/mol, respectively [
42].
From the FactSage predictions, the mole fractions of Mo, V, Mn and Cr dissolved in ferrite and precipitates can be calculated, so that the partition coefficient of alloy elements can be determined. The coarsening results of large carbides in H13 in 863 K and 973 K are listed in
Table 4 and
Table 5.
In
Table 4, the interfacial energy between M
23C
6 and ferrite is taken as 0.5 J/m
2 both in 863 K and 973 K.
Coarsening of M
3C is controlled by diffusion of carbon in ferrite. And carbon diffusion is influenced by other alloy elements in H13 such as Cr, Mn, V and Mo. Solubilities and diffusivities of alloy elements are shown in
Table 5. The interfacial energy between M
3C and ferrite is calculated according to Equation (12), and the results are 0.45 J/m
2 and 0.38 J/m
2.
It can be concluded that both M23C6 and M3C grow fast when the temperature rises from 863 K to 973 K, and m values for M3C are much larger than M23C6 at the same temperature.
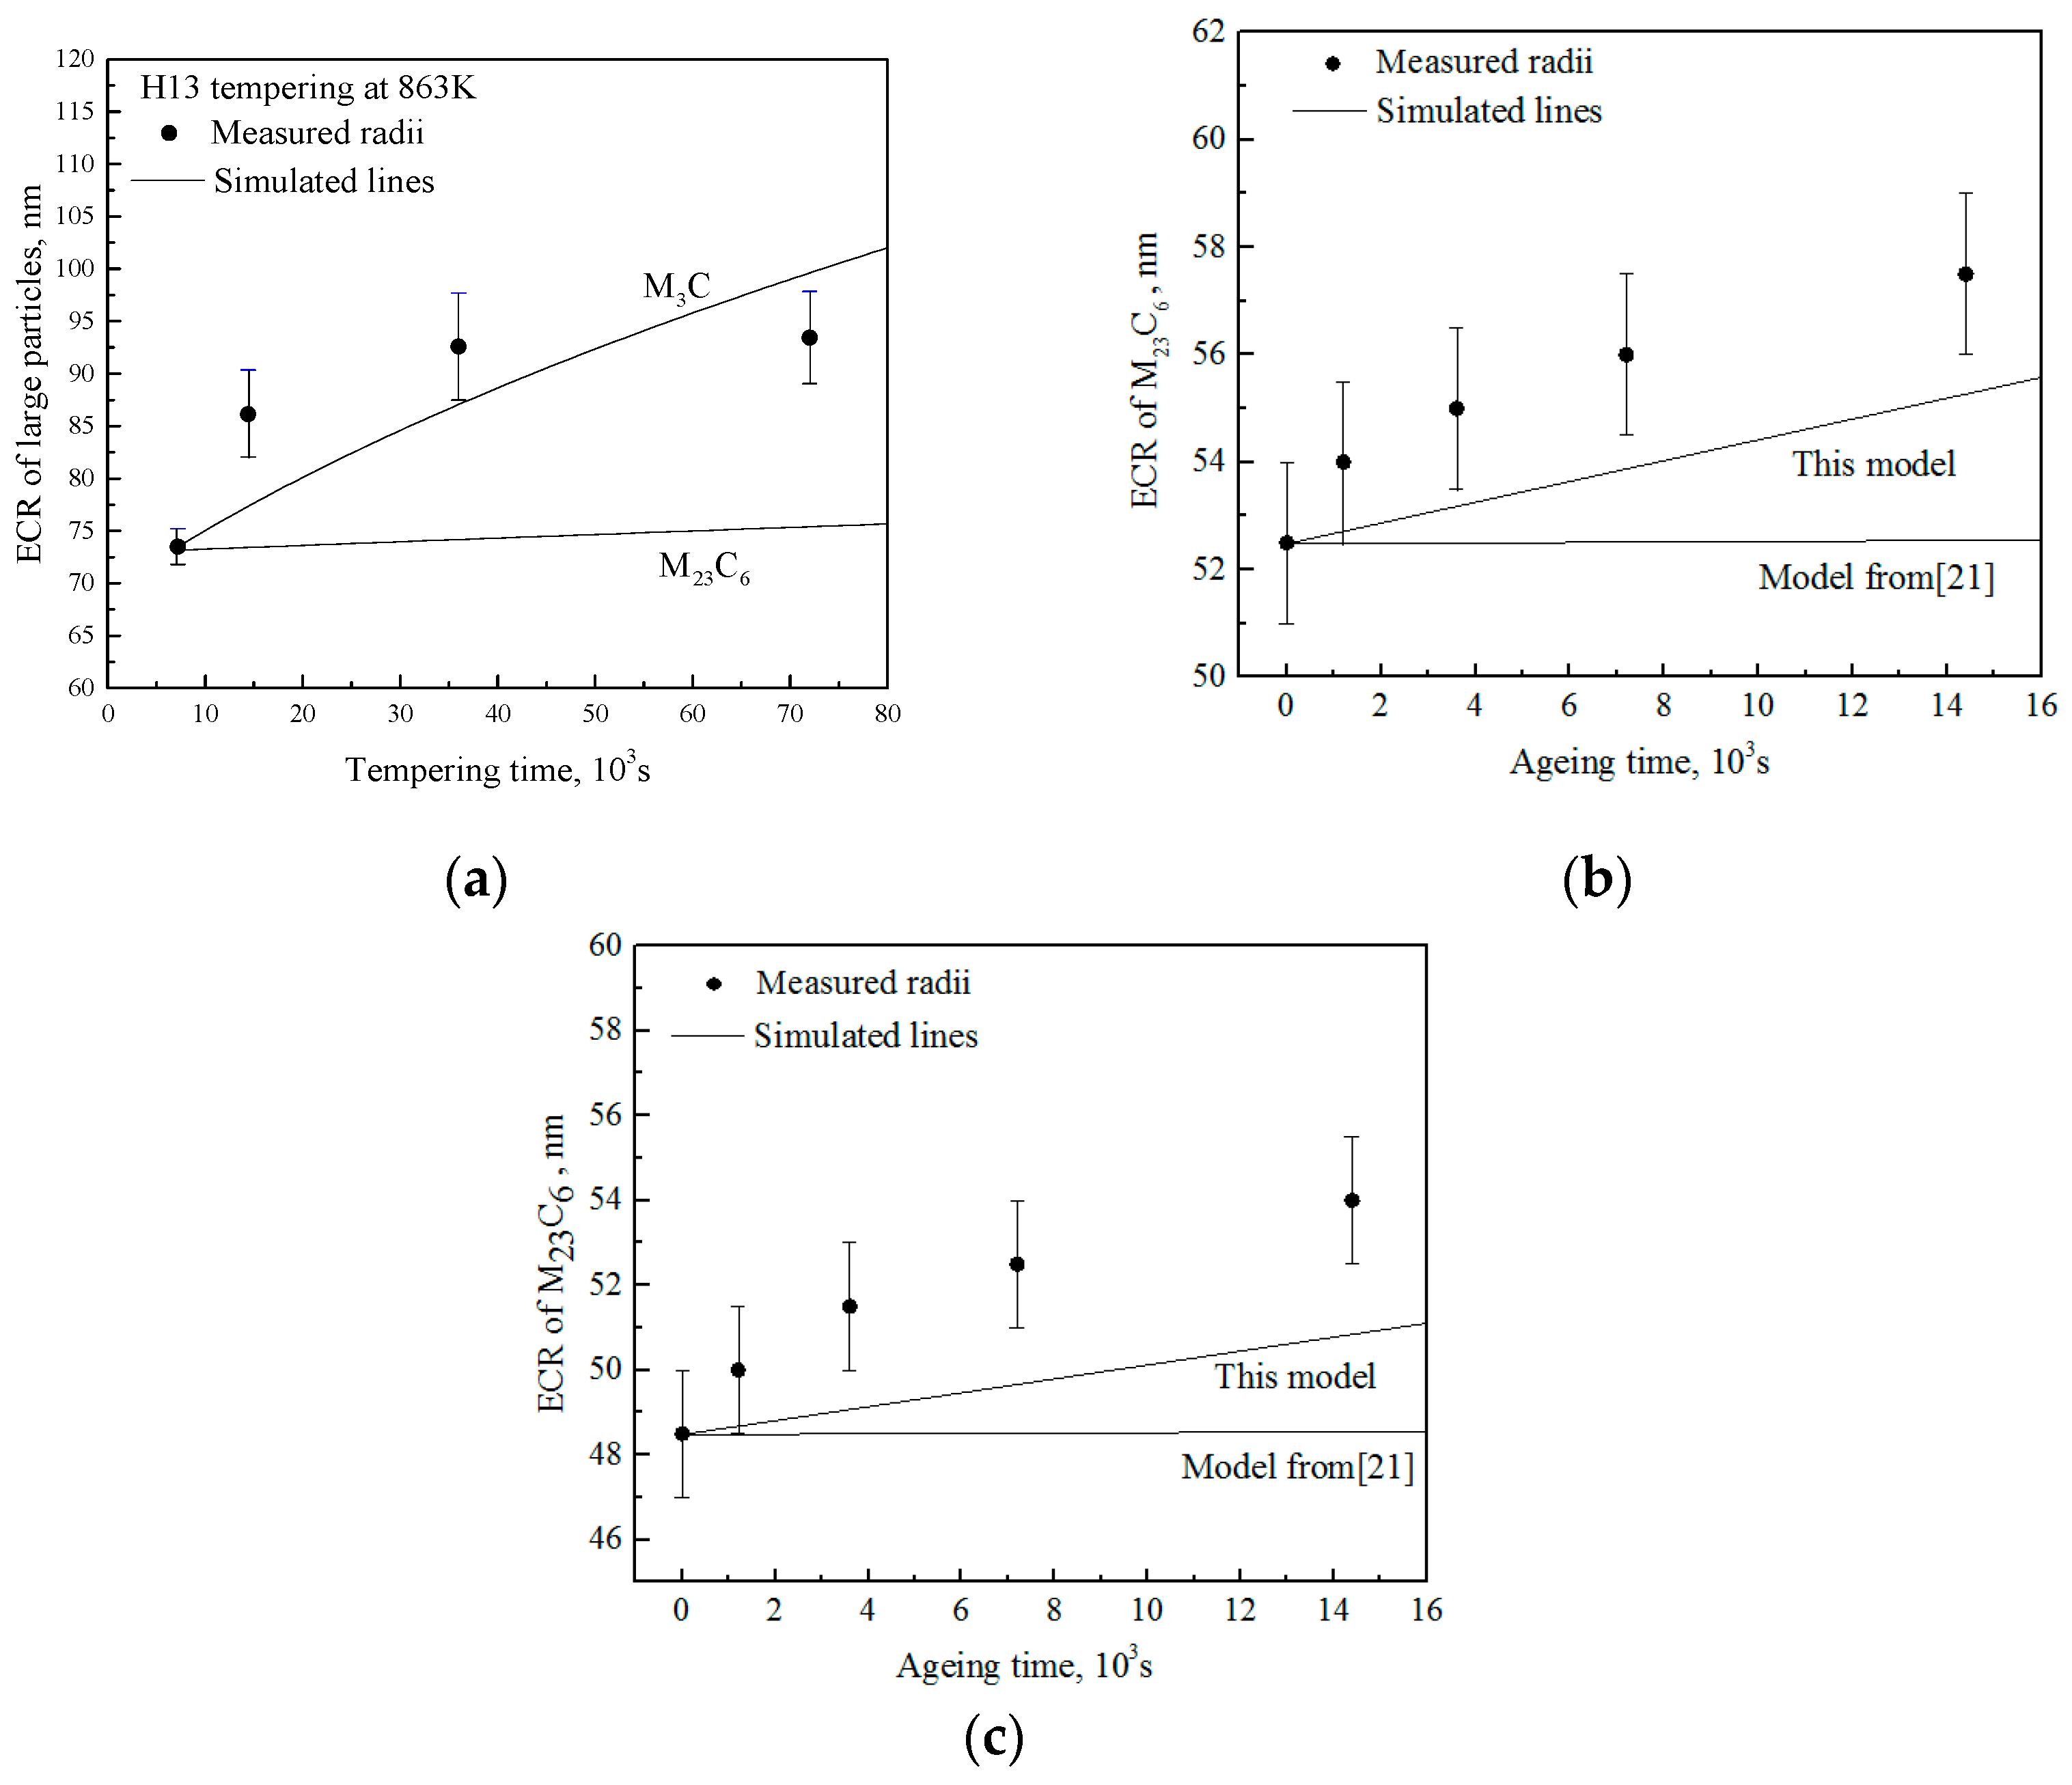
Simulation and experiment results in H13 with tempering time at 863 K are compared in
Figure 10a.
The experimental data are fitted by deploying Equation (3), and initial radius is set as 73.5 nm. The result is m = 1.78 ; it is between the M3C (2.09 ) and M23C6 (0.38 ) coarsening rates.
As a rule of thumb, the interfacial energy of M
23C
6 varies between 0.1 and 1 J /m
2 [
42], the lower value holds when the interfaces are more coherent and higher when the interfaces are incoherent, and it will decrease as the temperature goes up. According to coarsening simulation by Hu et al. [
21], 0.5–1 J/m
2 interfacial energy is set for M
23C
6/martensite in H13 at 863 K tempering. The coarsening rate is 0.38–0.48
, which is still far lower than the fitting slope. This is because the large carbides are mainly composed of M
3C along with some M
23C
6. Though the content of M
3C is low from FactSage calculation, large M
3C are usually easily found when they are sampled by carbon replica. It seems that coarsening rate is slower after tempering for 10 h at 863 K, which means that coarsening rate of large carbides is retarded by limited diffusion of alloying elements, e.g., Cr, Mo and V. Thus, M
23C
6 coarsening is influencing the coarsening of large precipitates.


