Article

Dynamic Recrystallization Simulation for X12 Alloy Steel by CA Method Based on Modified L-J Dislocation Density Model

School of Materials Science and Engineering, Henan University of Science and Technology, Luoyang 471023, China
*
Author to whom correspondence should be addressed.
Metals 2019, 9(12), 1291; https://doi.org/10.3390/met9121291
Submission received: 30 October 2019 / Revised: 23 November 2019 / Accepted: 26 November 2019 / Published: 30 November 2019

Abstract

:
Hot compressive behaviors of X12 alloy steel were investigated using a Gleeble-1500D thermal mechanical simulator in a temperature range from 1050 to 1250 °C and with a range of strain rates from 0.05 to 5 s−1 and a maximum true strain of 0.7. Stress–strain curves were obtained under various deformation conditions. A modified Laasraoui–Jonas (L-J) dislocation density model of X12 alloy steel was established for the given ranges of strain rate and temperature. On the basis of this dislocation density model, a cellular automaton (CA) model was constructed and used to simulate microstructure evolution during the hot compression process. Microstructure and grain size of X12 were predicted for different deformation conditions. The simulated grain size was compared with the actual grain size measured with metallographic photos. An average relative error of grain size was determined to be 6%, indicating that the modified L-J dislocation density model can accurately predict dynamic recrystallization behaviors of X12 alloy steel in hot forging processes.

1. Introduction

This X12 alloy steel is an important material for production of ultra-supercritical high and medium pressure rotors, which work in an environment of high temperature and high pressure. The working temperature of these rotors can reach 600 °C, and the pressure can be as high as 30 MPa. Thus, there are very strict requirements on the material [1,2,3]. X12 alloy steel is required to possess good low cycle fatigue strength and fracture toughness [4,5]. In addition, it must have good comprehensive performance for a stable working process. The hot deformation process in production of large forgings plays an important role in improving the comprehensive performance. Dynamic recrystallization is an important way to refine grain size and to improve microstructures and comprehensive properties of materials during hot deformation [6,7,8,9,10]. Consequently, studying dynamic recrystallization behavior of X12 alloy steel is of great significance for control of microstructure in large forgings. Dynamic recrystallization of X12 alloy steel for large forgings had been studied extensively. Dashan Sui studied hot deformation behavior of X12 alloy steel and established the Lassraoui two-stage model and dynamic recrystallization model. Effects of different forging processes on microstructure evolution of X12 alloy steel has also been investigated through metallographic experiments and macroscopic simulations [11,12]. Zhenhua Wang et al. studied the processing maps and the Zener–Hollomon parameter of 12% Cr alloy steel, discussed the microstructure evolution in combination with the processing maps and found that the thermoplastic of 12% Cr ultra-supercritical rotor steel was the worst at a strain rate of 1 s−1 and 950 °C during hot tension [13]. Up till now, most studies on microstructure evolution of X12 alloy steel were done through mathematical models combined with experimental means. But these methods cannot satisfactorily express the process of dynamic recrystallization.
With rapid development of computer simulation, more and more scientists use numerical techniques to simulate microstructure evolution. Current simulation methods mainly include cellular automaton, Monte Carlo, and phase field methods [14,15,16,17]. Cellular automaton (CA) can simulate microstructure evolution at different strains during hot deformation. Compared with the other two simulation methods, CA method has the virtues of good flexibility, high efficiency and corresponding relations between the real time and CA time [18,19]. CA method was successfully used to simulate microstructure evolution of different materials based on the CA model which is based mainly on the changes of dislocation density. Dislocation density is known to be the driving force for occurrence of dynamic recrystallization, which plays a decisive role during hot deformation [20,21,22]. At present, research models of dislocation density mainly include Kocks-Mecking (KM) model and Laasraoui–Jonas (L-J) model [23,24]. KM model considers that deformation mechanism is determined by the dislocation density of whole material. In addition, the total dislocation density includes migration dislocation density and cumulative dislocation density. The modified L-J dislocation model proposed by Gourdet and Montheillet [25] considers the influence of grain boundary migration. Consequently, the modified L-J dislocation density model not only has the characteristics of KM model, but also considers the effect of grain boundary migration on dislocation density. Therefore, the dislocation density model of X12 alloy steel is based on the modified L-J dislocation density model in this paper. At present, the dislocation density model combined with cellular automata technology is widely used to simulate microstructure during hot deformation. Liu X et al. used the L-J dislocation density model coupled with cellular automaton to simulate microstructure evolution and dislocation density changes during hot compression deformation of AZ31 magnesium alloy [26]. Lin et al. studied the dynamic recrystallization process of nickel-based superalloys by establishing a CA model with probabilistic status based on the dislocation density model. Dynamically recrystallized grain size and flow stress behavior can be well accounted for using an established model [27]. However, there are few studies on simulating the microstructure evolution of X12 alloy steel by establishing the L-J dislocation density model combined with cellular automata.
In this paper, the L-J dislocation density model of X12 alloy steel was established based on hot compression experiments. The CA model was established based on the dislocation density model for simulation of X12 steel hot compression experiment, and dynamically recrystallized grains were obtained after compression deformation under different conditions. The simulated grain size based on the modified L-J dislocation model is compared with the measured grain size. An average grain size error was determined to judge if our dislocation model can well predict the recrystallization behavior of X12 steel. The dynamic recrystallization microstructure evolution of X12 alloy steel by CA method is very important for studying the microstructure evolution during the forging process. Accurate simulation of the microstructure evolution during dynamic recrystallization is very important for the development of ultra-supercritical rotor forging solutions. This work will provide certain guidance on actual production processes in the future.

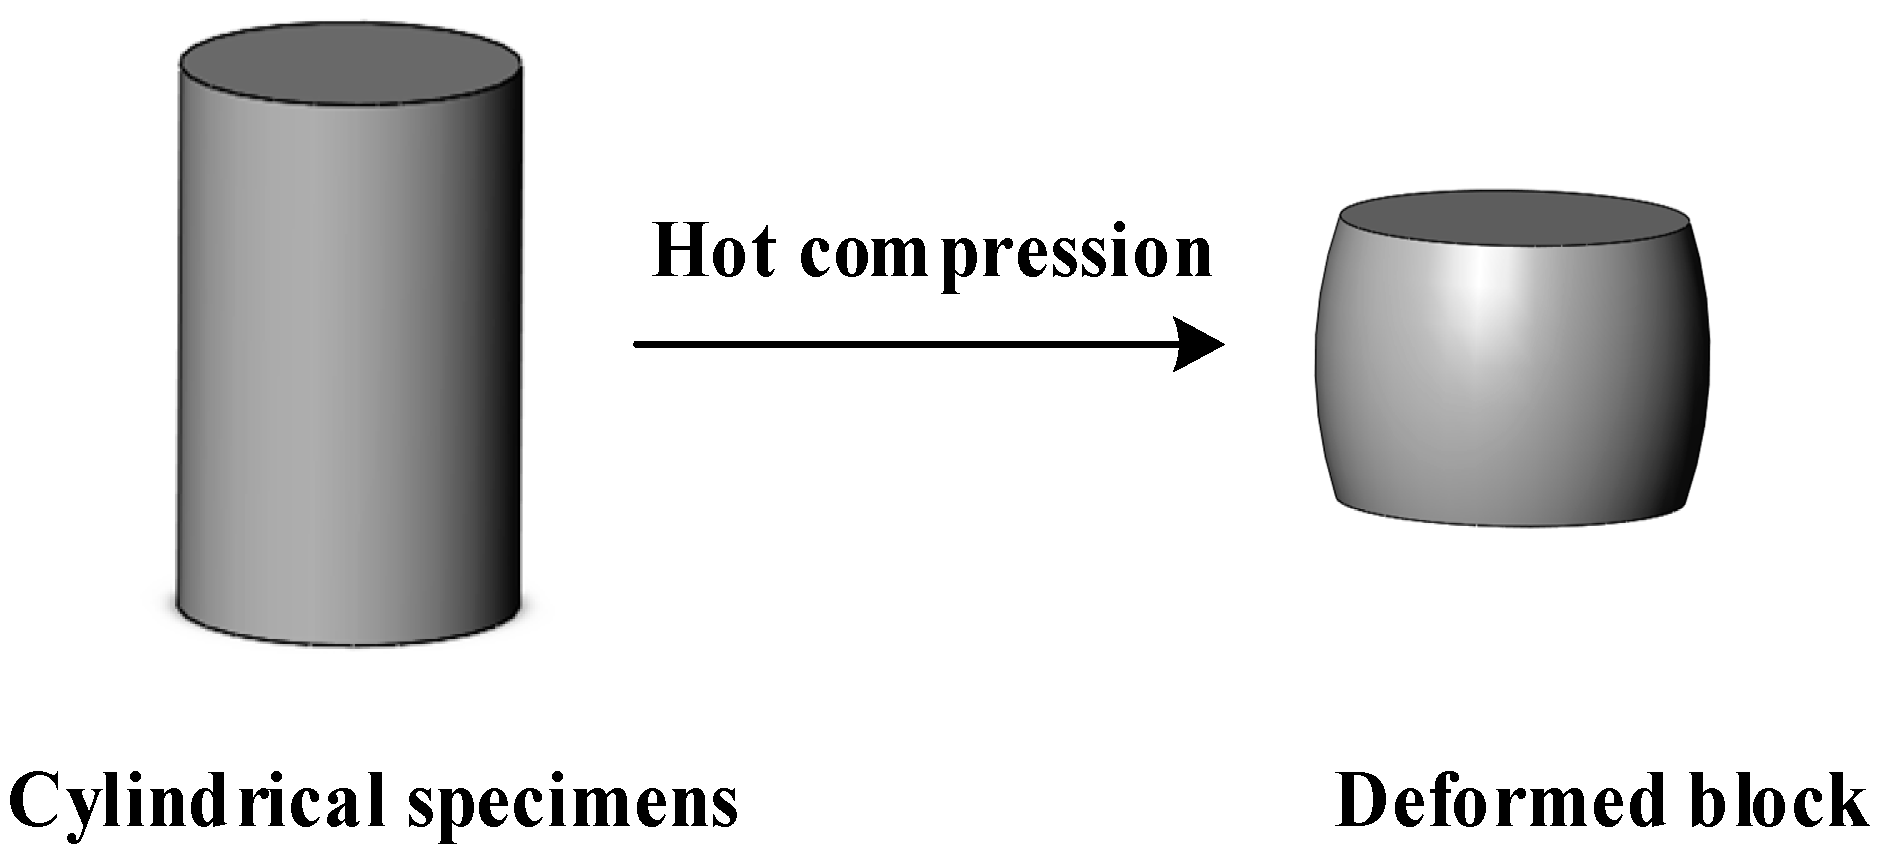
2. Materials and Experiments

The experimental material is an X12 alloy steel, and its chemical composition is shown in Table 1. The experimental bar was machined into cylindric specimens of Ø 8 × 12 mm, as shown in Figure 1. The initial microstructure of X12 steel is shown in Figure 2. An average grain size is measured to be 38.83 µm. Hot compression deformation was carried out on a Gleeble-1500D thermal mechanical simulation machine (Dynamic Systems Inc, New York, NY, USK) with a range of strain rates (0.05~5 s−1) and deformation temperatures (1050~1200 °C). The maximum true strain of compressed specimens was 0.7. Deformed specimens were quenched into water immediately in order to keep the microstructure unchanged. Cross sections of specimens after the compression were processed into samples and then been sanded and polished. The etchant with the composition of 1.25 g KMnO4 and 10% H2SO4 (100mL) was used to etch the samples. After specimens were mechanically polished and chemically etched, an observation of microstructure was conducted using an optical microscope (Olympus-PMG3, OlympusCorporation, Tokyo, Japan).

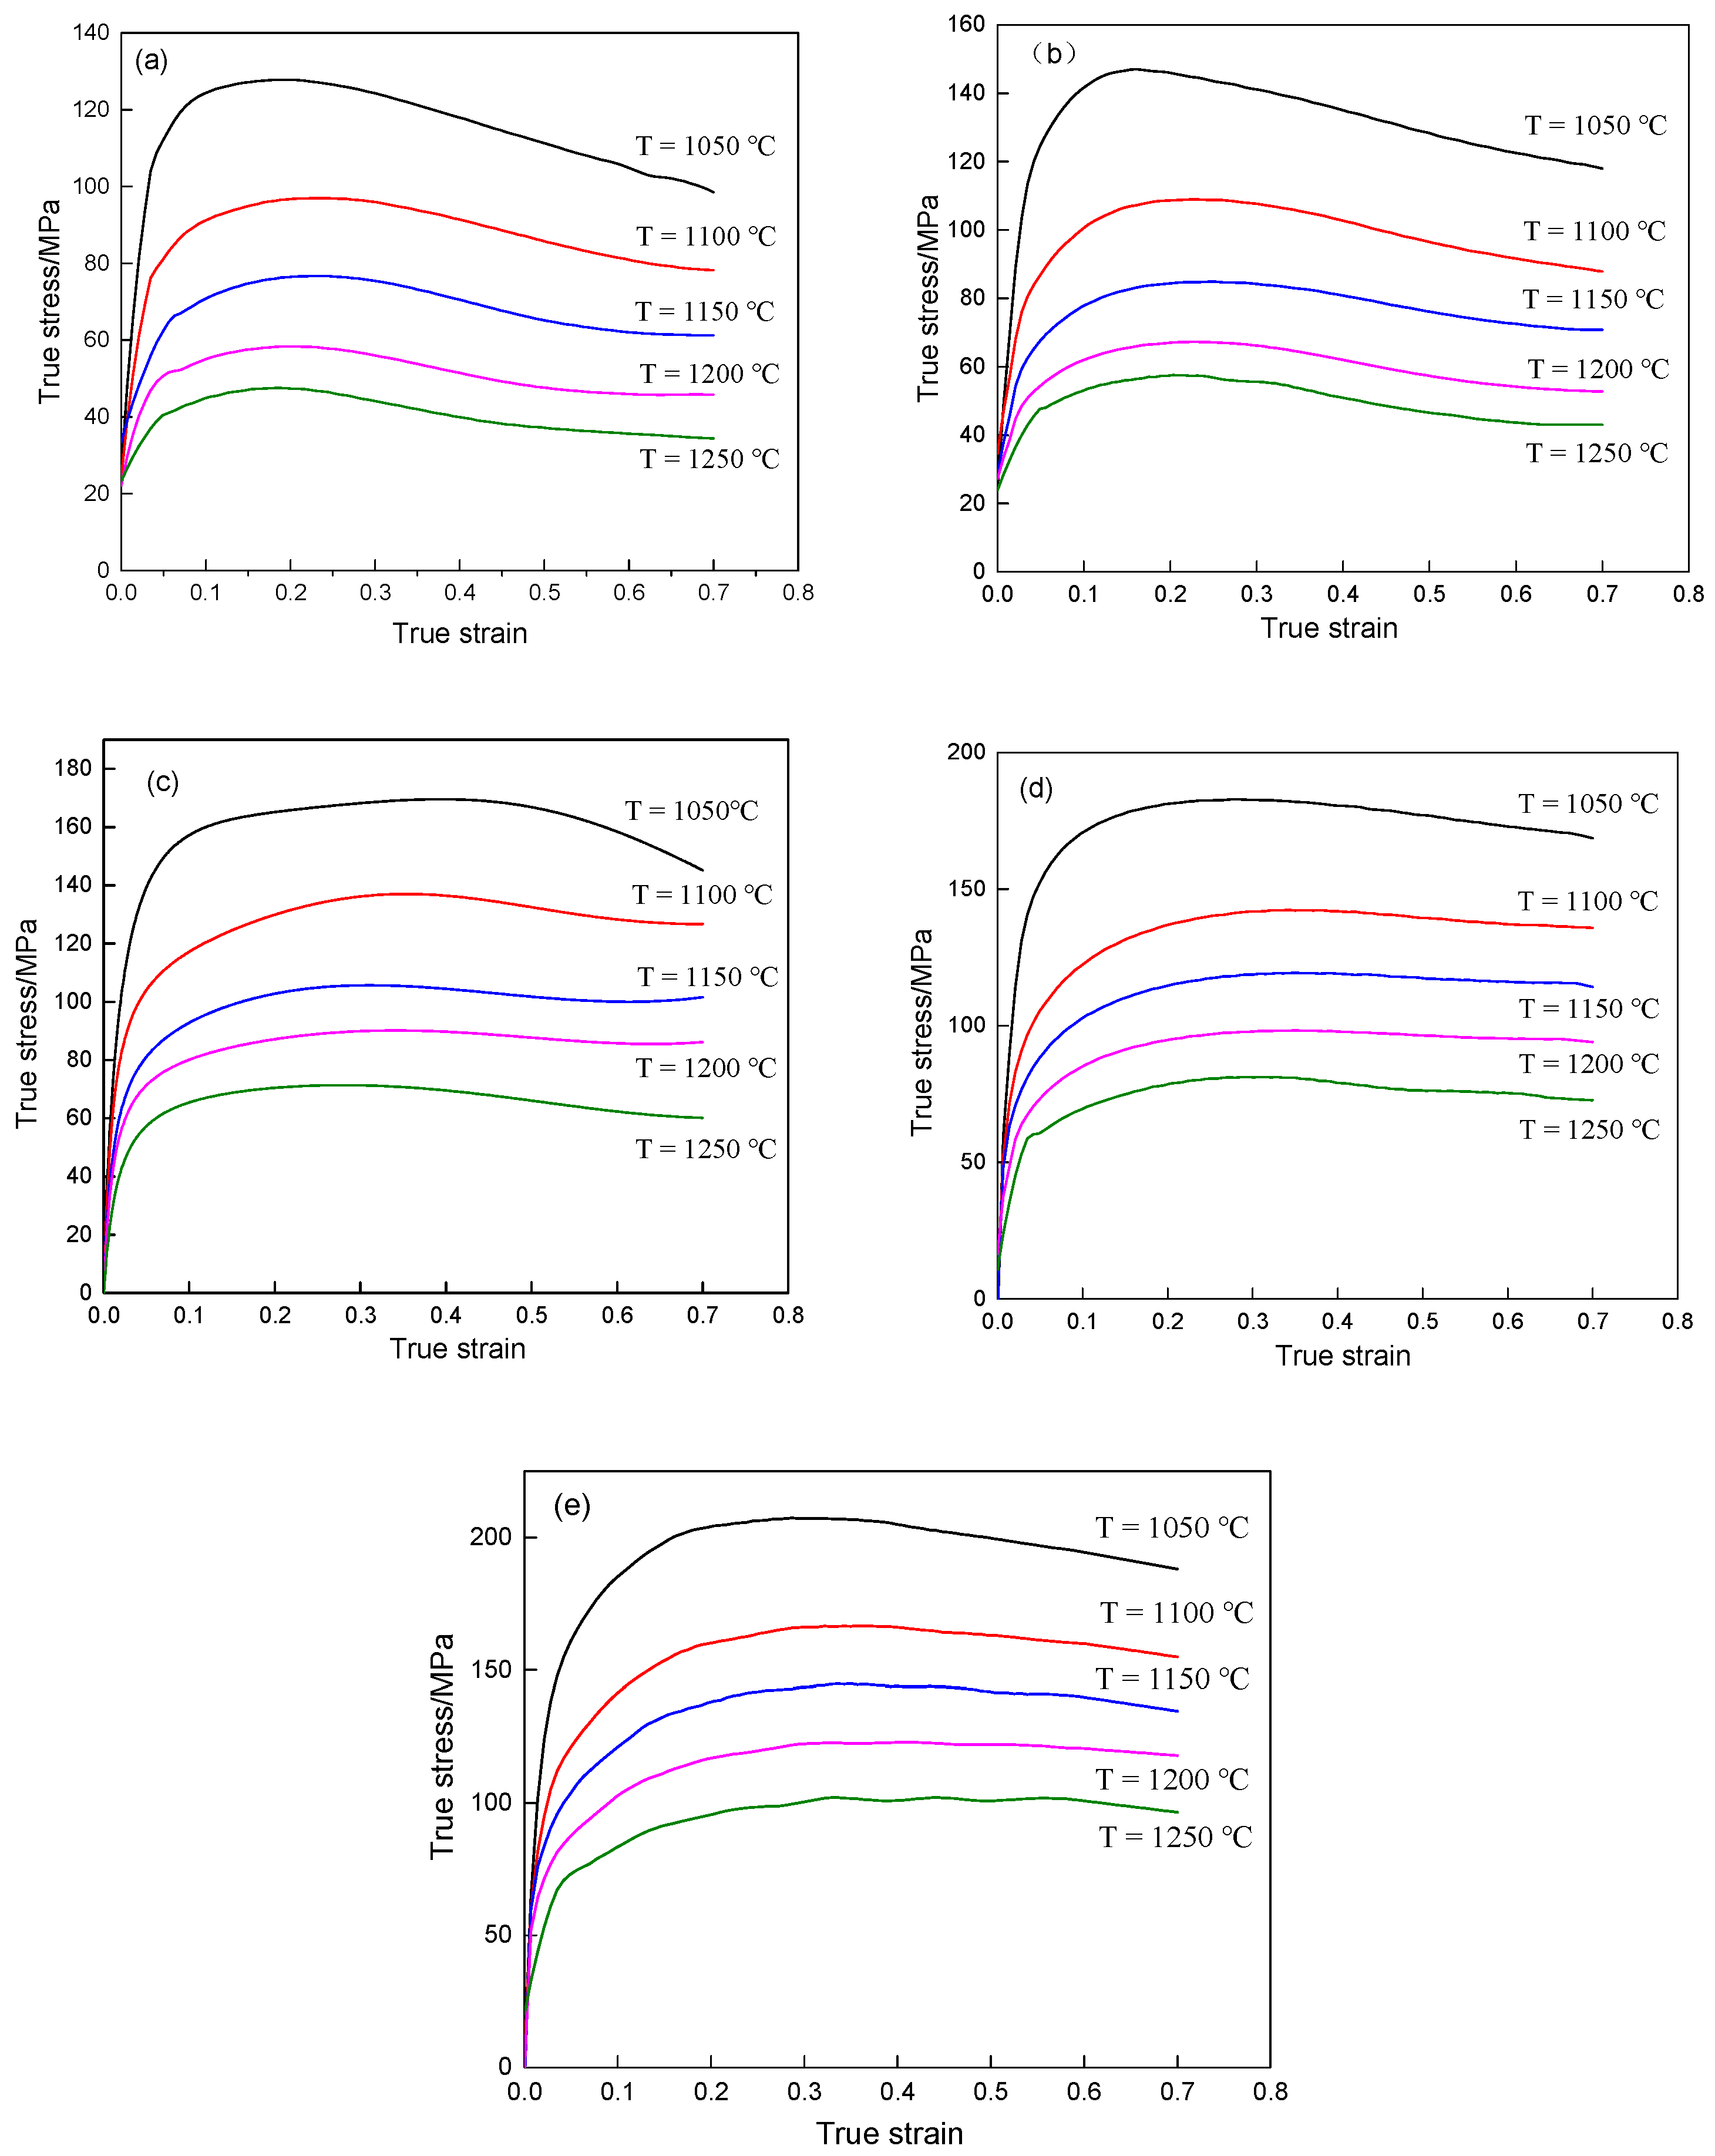
3. Results of Hot Compression

Hot compression experiments were implemented at temperatures of 1050~1200 °C and in a strain rate range of 0.05~5 s−1. Flow stress curves are represented in Figure 3. The dynamic softening mechanism of metals is mainly divided into dynamic recovery and dynamic recrystallization. When the metal with high stacking fault is deformed, the slip and migration of dislocations are easier to carry out, and the softening mechanism is dynamic recovery, such as aluminum alloy and magnesium alloy [28]. The main dynamic softening mechanism for large deformation of metals with low stacking fault energy is dynamic recrystallization, such as austenitic steel and austenitic alloy [29]. The alloy studied in this paper is an alloy steel containing various alloy elements. It can be seen from the flow stress curve that it has obvious dynamic recrystallization behavior. It can be learned from these curves that X12 alloy steel shows an obvious dynamic recrystallization behavior in the given ranges of strain rate and temperature. At a certain deformation temperature, flow stress rises with increasing strain rate. When strain rate increases from 0.01 to 5 s−1 at 1050 °C, the peak flow stress of X12 alloy steel increases by 79.56 MPa. With a constant strain rate, flow stress decreases with increasing temperature. At a strain rate of 0.05 s−1, the peak flow stress decreases by 80.23 MPa when temperature rises from 1050 to 1250 °C. At the beginning of deformation under the condition of 0.1 s−1 and temperature of 1150 °C, flow stress rises sharply due to a sharp increase of dislocation density, which leads to a work hardening effect [30,31]. As deformation increases, dislocation density of X12 alloy steel accumulates to a critical value. As a result, dynamic recrystallization occurs, whose softening effect causes a sharp drop of flow stress. Finally, the dynamic softening effect can be balanced by the work hardening effect so that flow stress tends to be stable.

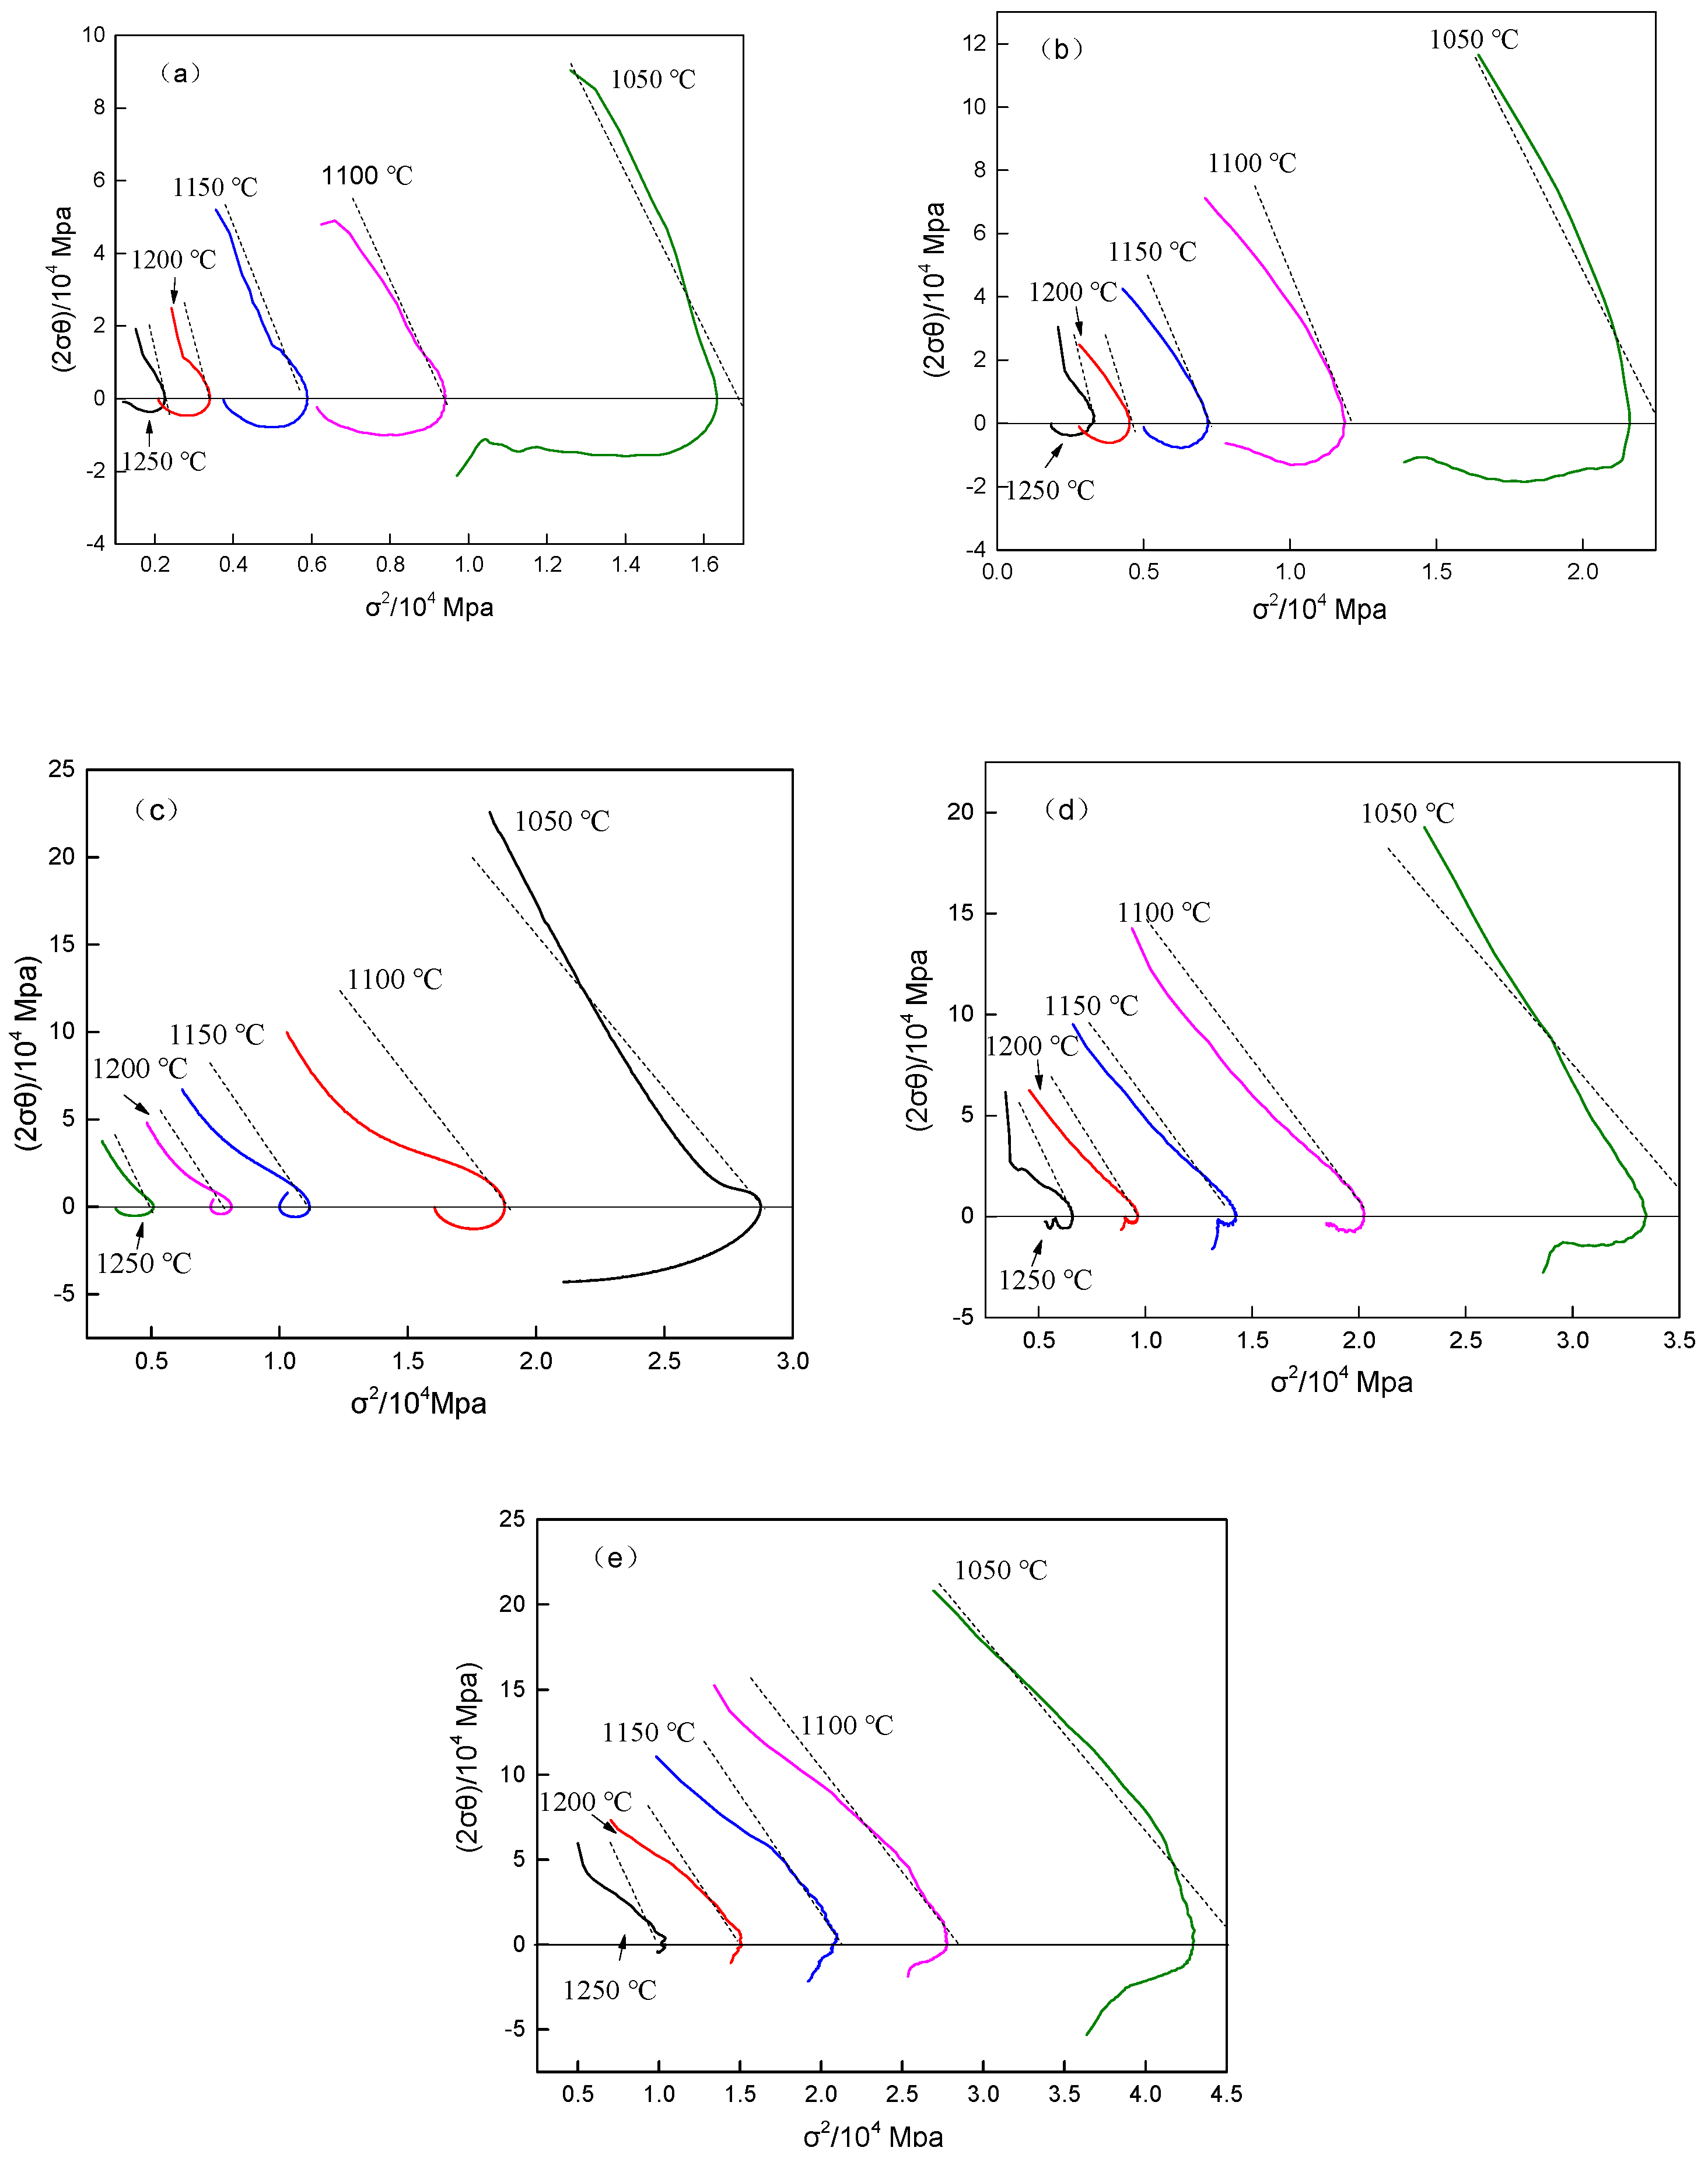
4. The Modified L-J Dislocation Density Model

4.1. Construction of the Dislocation Density Model

The essence of work hardening and dynamic softening through hot deformation of materials is the change of dislocation density inside material. Work hardening causes an accumulation and increase of dislocation density. Softening caused by dynamic recovery and dynamic recrystallization can bring about annihilation of dislocation energy inside material. The variation of dislocation density inside a grain during deformation can be expressed by the modified Laasraoui–Jonas (L-J) dislocation density model.
d ρ i d ε =   h r ρ ρ d V .
r = r 0 ( ε ˙ ε ˙ 0 ) m exp ( m Q R T ) .
h = h 0 ( ε ˙ ε ˙ 0 ) m exp ( m Q R T ) .
Here ρ represents the dislocation density, ρ i is dislocation density of the i - th new grain, r is the dynamic recovery softening coefficient, r 0 is the softening constant, d V is the volume swept by mobile boundaries, ε ˙ represents strain rate, ε is strain, h is hardening coefficient, h 0 is the hardening index, Q represents diffusion activation energy, R is gas constant, and T represents deformation temperature.
By solving the first-order linear differential equation of Equation (1), it can be inferred that:
ρ = h r + C exp ( r ε ) .
When ε = 0 , then ρ = ρ 0 , it can be inferred that C :
C = ρ 0 r h r .
σ can be expressed as:
σ = α μ b ρ .
When strain is large enough, flow stress is approximately equal to the recovery stress.
σ sat α μ b h r .
Here σ s a t is saturation stress, α is Taylor factor (usually 0.5), b is the Burger’s vector.
Then the relationship between the dynamic recovery softening coefficient, the stress, and the strain can be expressed as:
σ = [ σ sat 2 ( σ sat 2 σ 0 2 ) exp ( r ε ) ] 0.5 .
After the derivation transformation of the Equation (8), it can be shown as follows:
2 σ × d σ d ε = r σ sat 2 r σ 2 .
According to the definition of work hardening rate ( θ = d σ / d ε ), then Equation (9) can be expressed as follows:
2 σ θ =   r σ sat r σ 2 .
According to Equation (10), the softening coefficient under various deformation conditions can be acquired. The slope of the 2 σ θ r σ 2 can be set as k , then r = k .
High-temperature flow stress curves of X12 alloy steel can be obtained by hot compression experiment. Then the work hardening rate θ under different deformation conditions can be obtained through the first-order derivation of σ ε . Thereby curves at the corresponding strain rate and temperature can be established, as shown in Figure 4. The slope of the line 2 σ θ r σ 2 in the figure is the approximate slope k .
Substitute ε ˙ = 1 into Equation (2), and take the logarithm of both sides of Equation (2), then one can obtain Equation (11):
ln r = ln r 0 m ln ε ˙ m Q R T .
Substitute r obtained under different deformation conditions into Equation (11), and perform multivariate linear fitting, one can determine m = 0.178, Q = 278259, r 0 = 1413.
Dynamic recovery saturation stress can be obtained by extending work hardening curve- θ σ to θ = 0 . The hardening coefficient h 0 = 2.94 × 10¹³ is calculated by substituting above parameters into Equation (7).

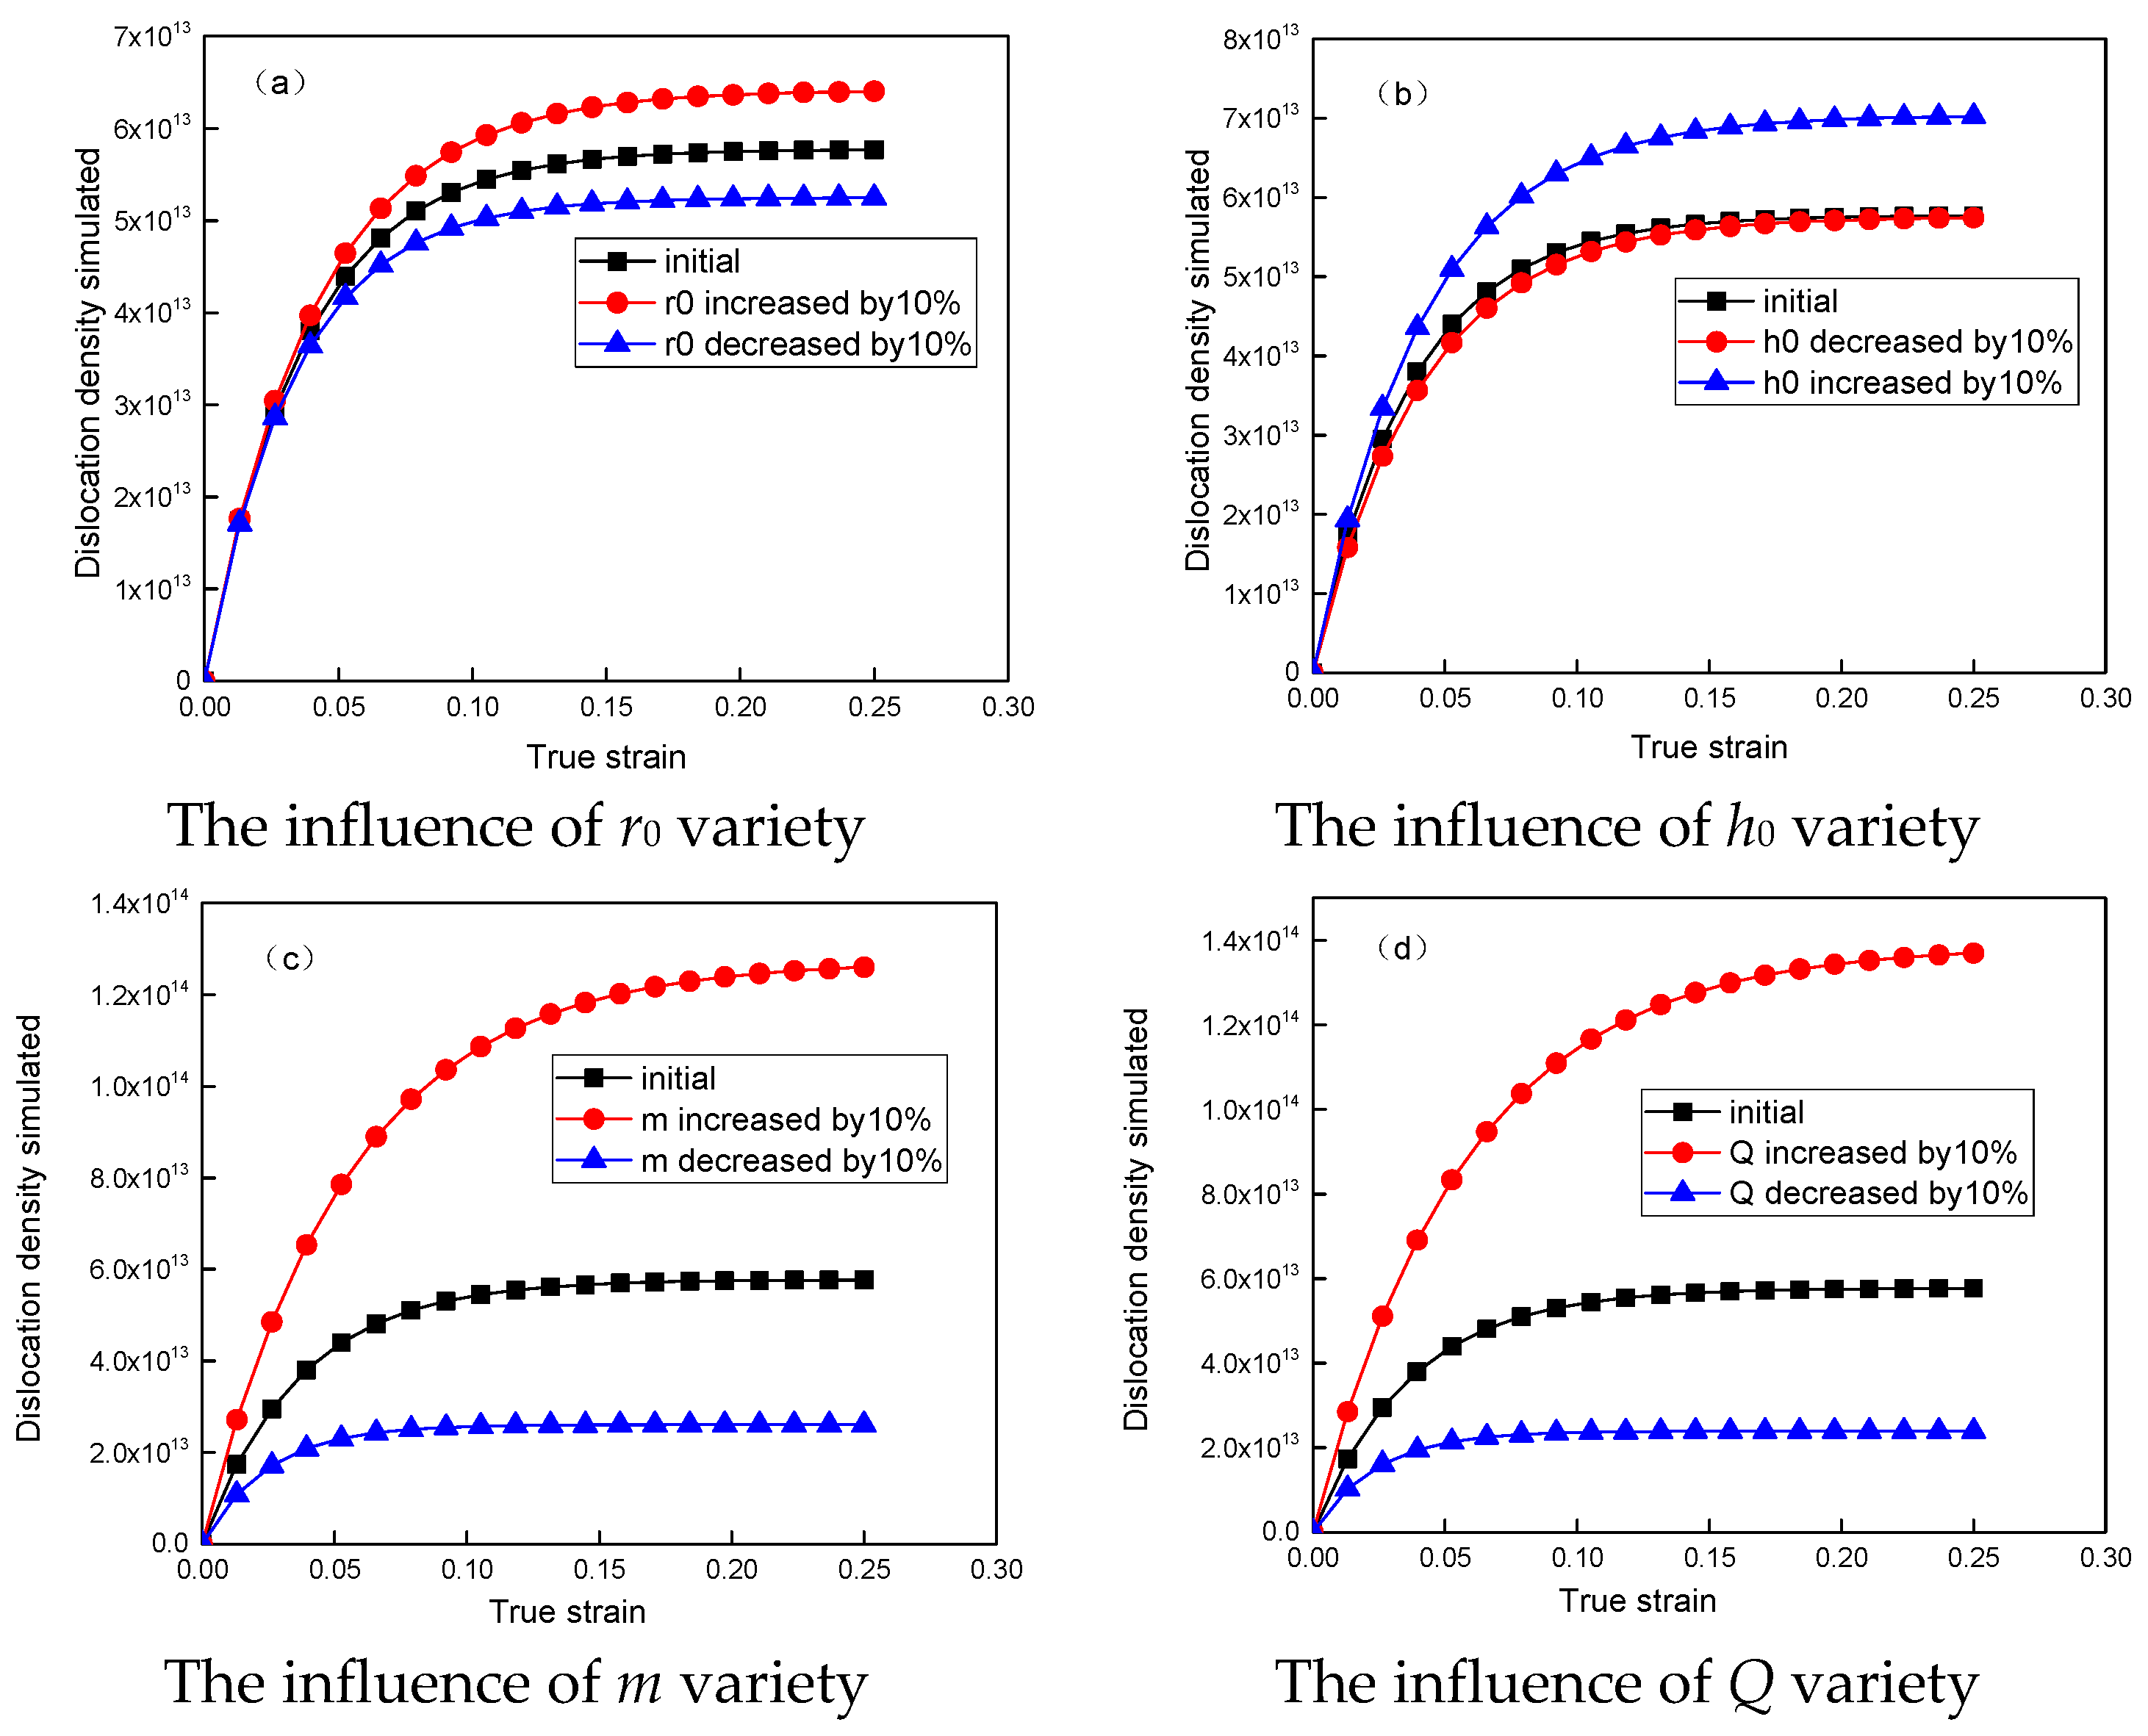
4.2. Variabilities Studies of Modified L-J Dislocation Model

Figure 5 shows the influence of different parameters on the dislocation density calculation results under the conditions with temperature of 1150 °C and strain rate of 0.1 s−1. The main parameters are r0, h0, m, and Q. Therefore, the influence of these parameters on the calculation results of dislocation density is calculated. It can be seen that m and Q have a greater influence on the results than r0 and h0.

5. Nucleation and Growth Model

As deformation increases, dislocation density inside material accumulates. When dislocation density exceeds a critical value, nucleation will occur. The critical dislocation density can be expressed as:
ρ c = ( 20 γ i ε ˙ 3 b l M τ 2 ) 1 / 3 .
M = ( δ D b b k T ) exp ( Q R T ) .
l = c 1 μ b σ .
τ = c 2 μ b 2 .
Here δ is characteristic grain boundary thickness, it is determined as 1 nm, D b represents diffusion coefficient, it is determined 7.5, b represents Burgers vector, γ i is interface energy, l is free trail of dislocation, τ is line dislocation energy, M is the GB mobility, k is Boltzmann constant, and Q is the diffusion activation energy.
The nucleation rate n ˙ is as follows:
n ˙ = C ε ˙ m exp ( Q a c t R T ) ,
where C and m represent the values of material constants, and Q a c t is deformation activation energy.
As temperature increases or holding time reaches a certain level, grains will gradually grow up. The growth rate of a grain v i and driving force F i required for grain growth can be obtained as:
ν i = M F i / ( 4 π r i 2 ) ,
F i = 4 π r i 2 τ ( ρ m ρ i ) 8 π r i γ i ,
where r i is the radius of the i - th recent grain, ρ i is dislocation density for dynamic recrystallized grains, ρ m is matrix grain dislocation density. The interface energy γ i can be obtained as follows:
γ i = γ m θ i θ m ( 1 ln θ i θ m ) .
Here, θ i is misorientation of recrystallized grains, θ m is grain boundary misorientation for adjacent grains. In addition, γ m is large angle grain boundary energy, which can be expressed as follows (where ν is Poisson ratio):
γ m = μ b θ m 4 π ( 1 ν ) .

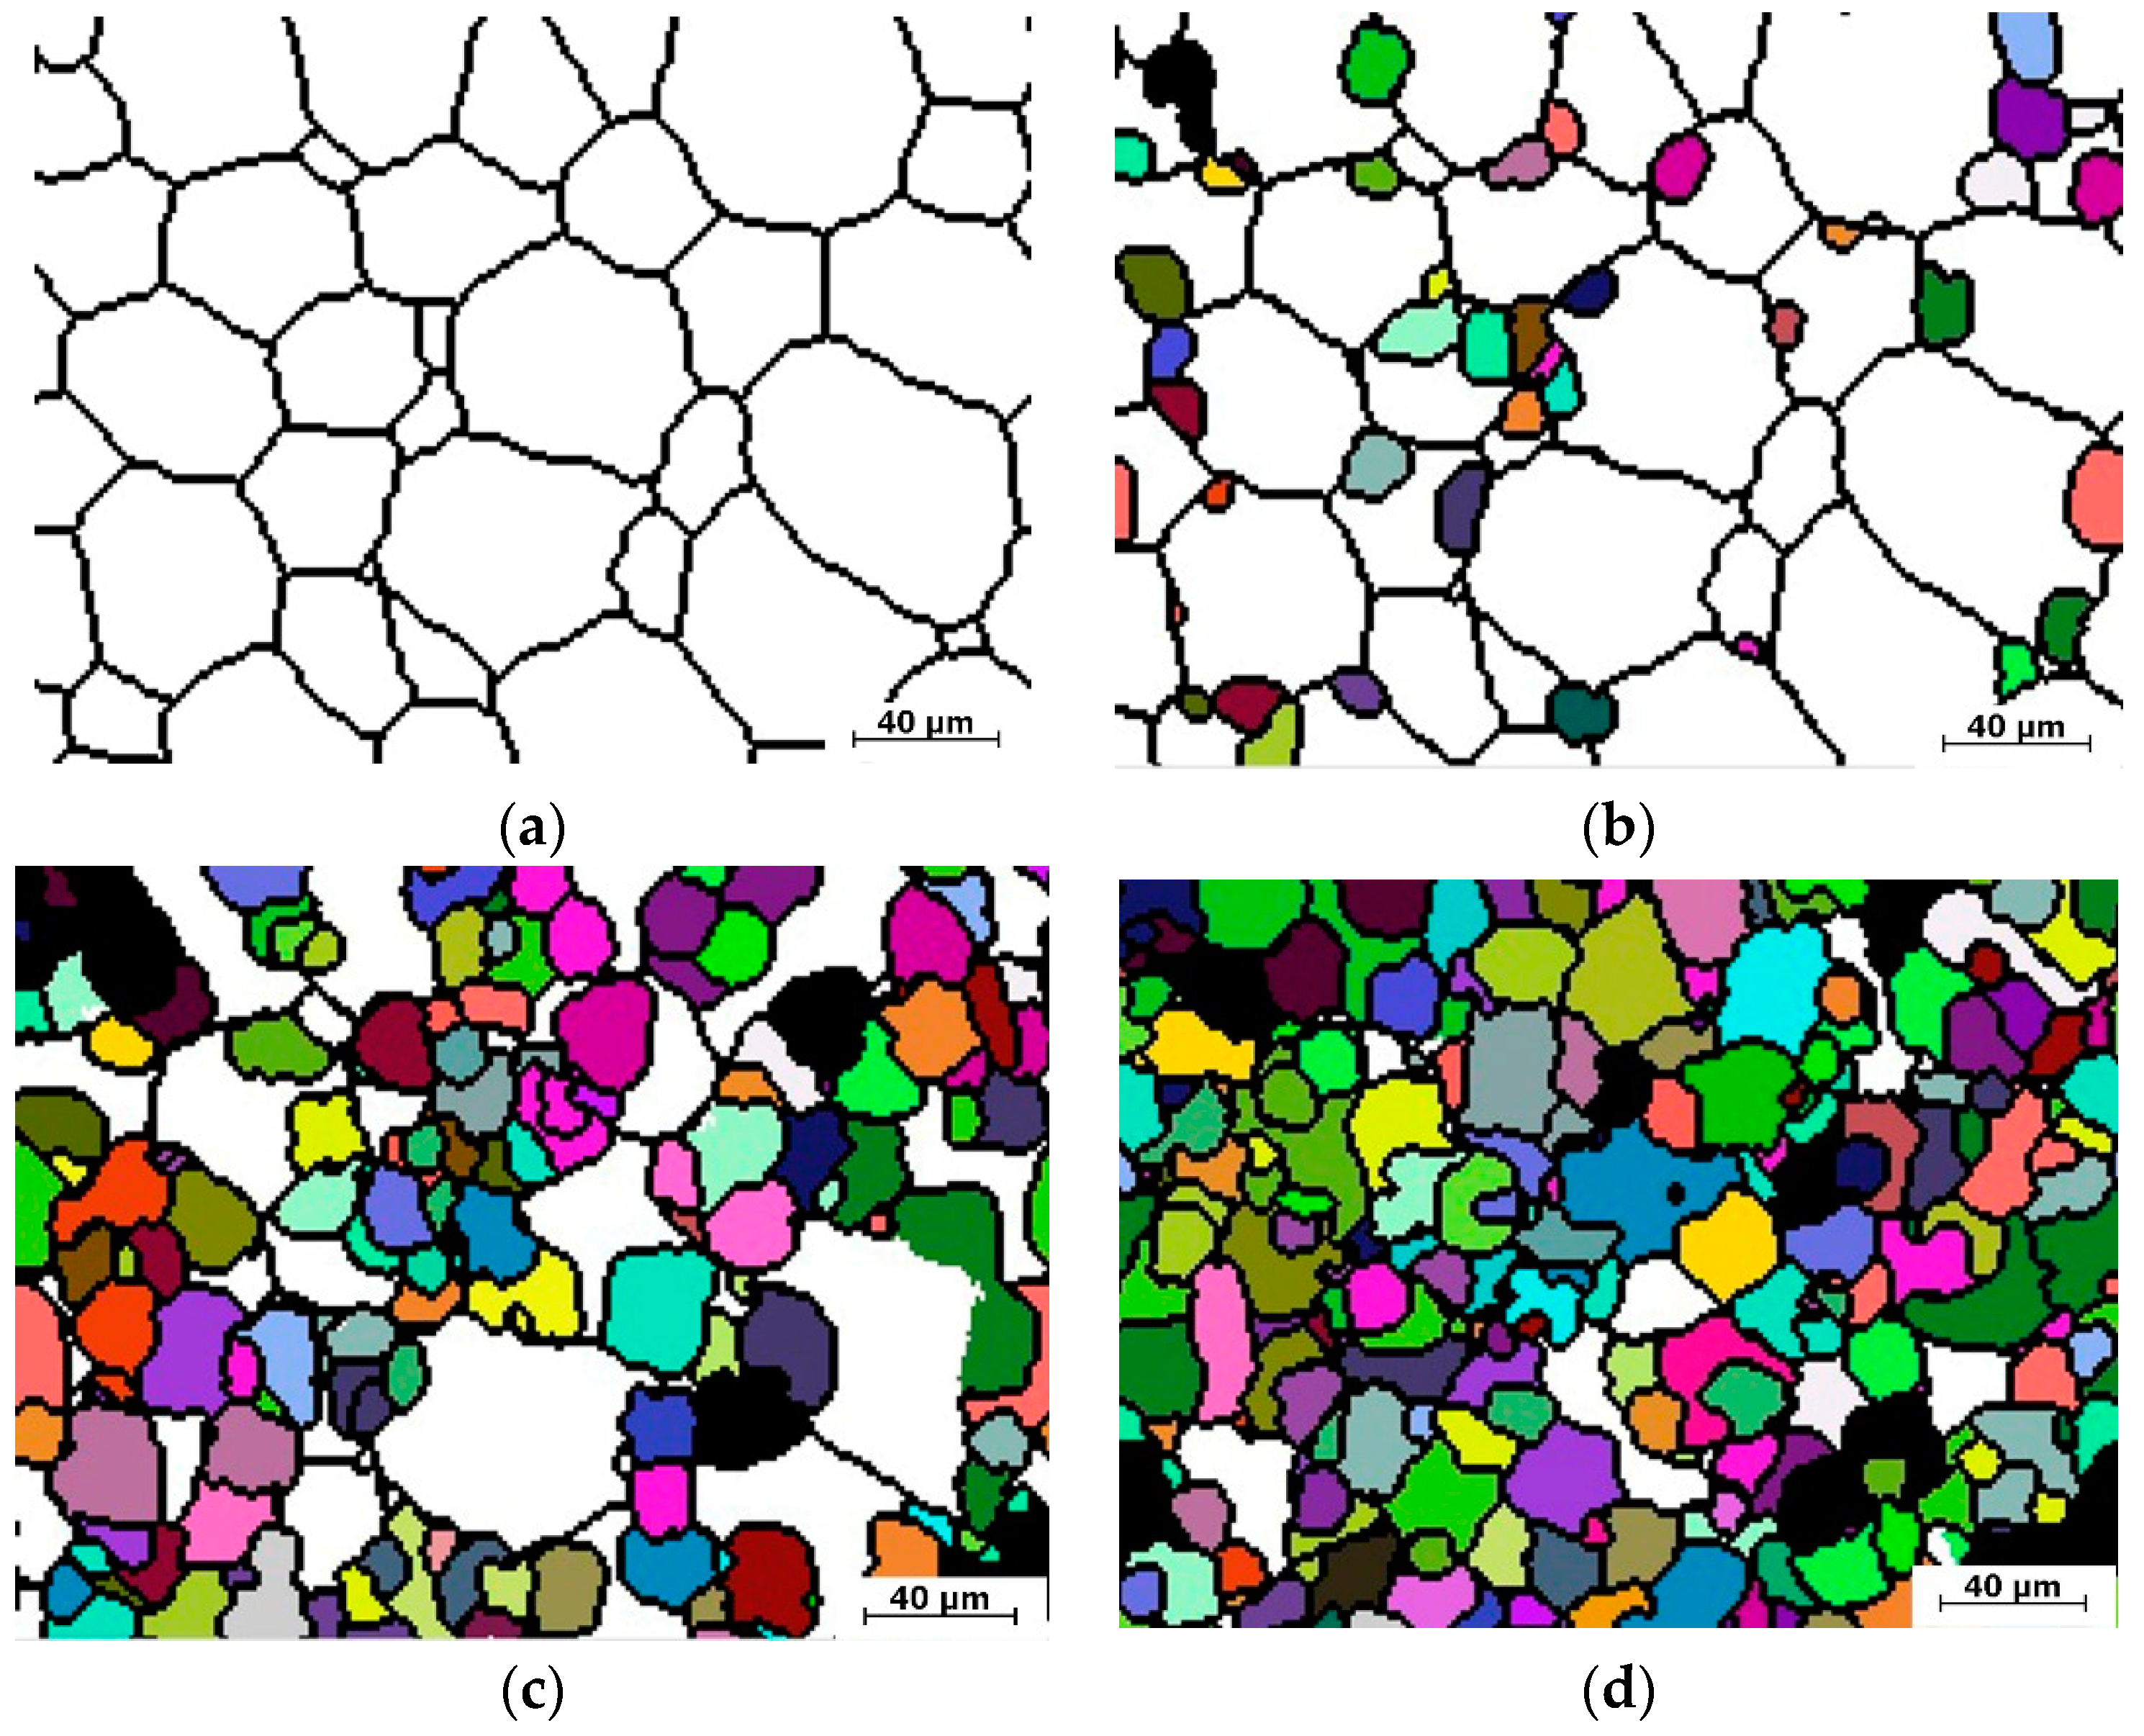
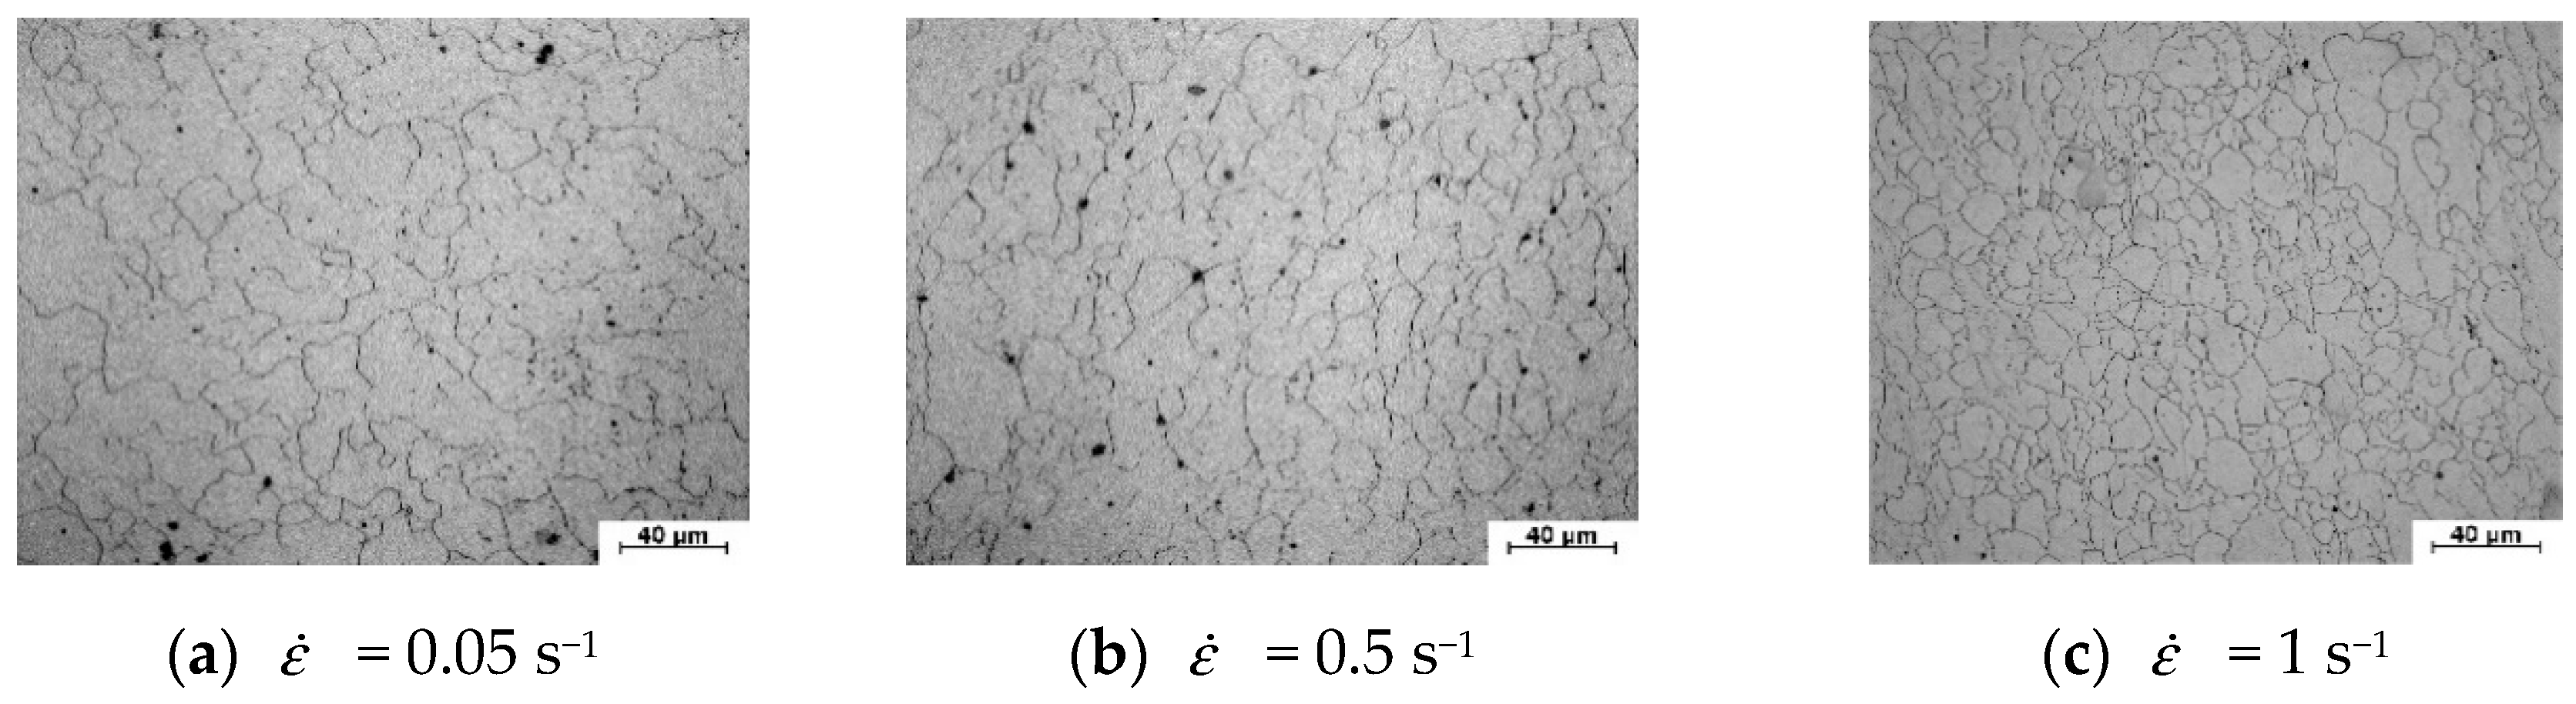
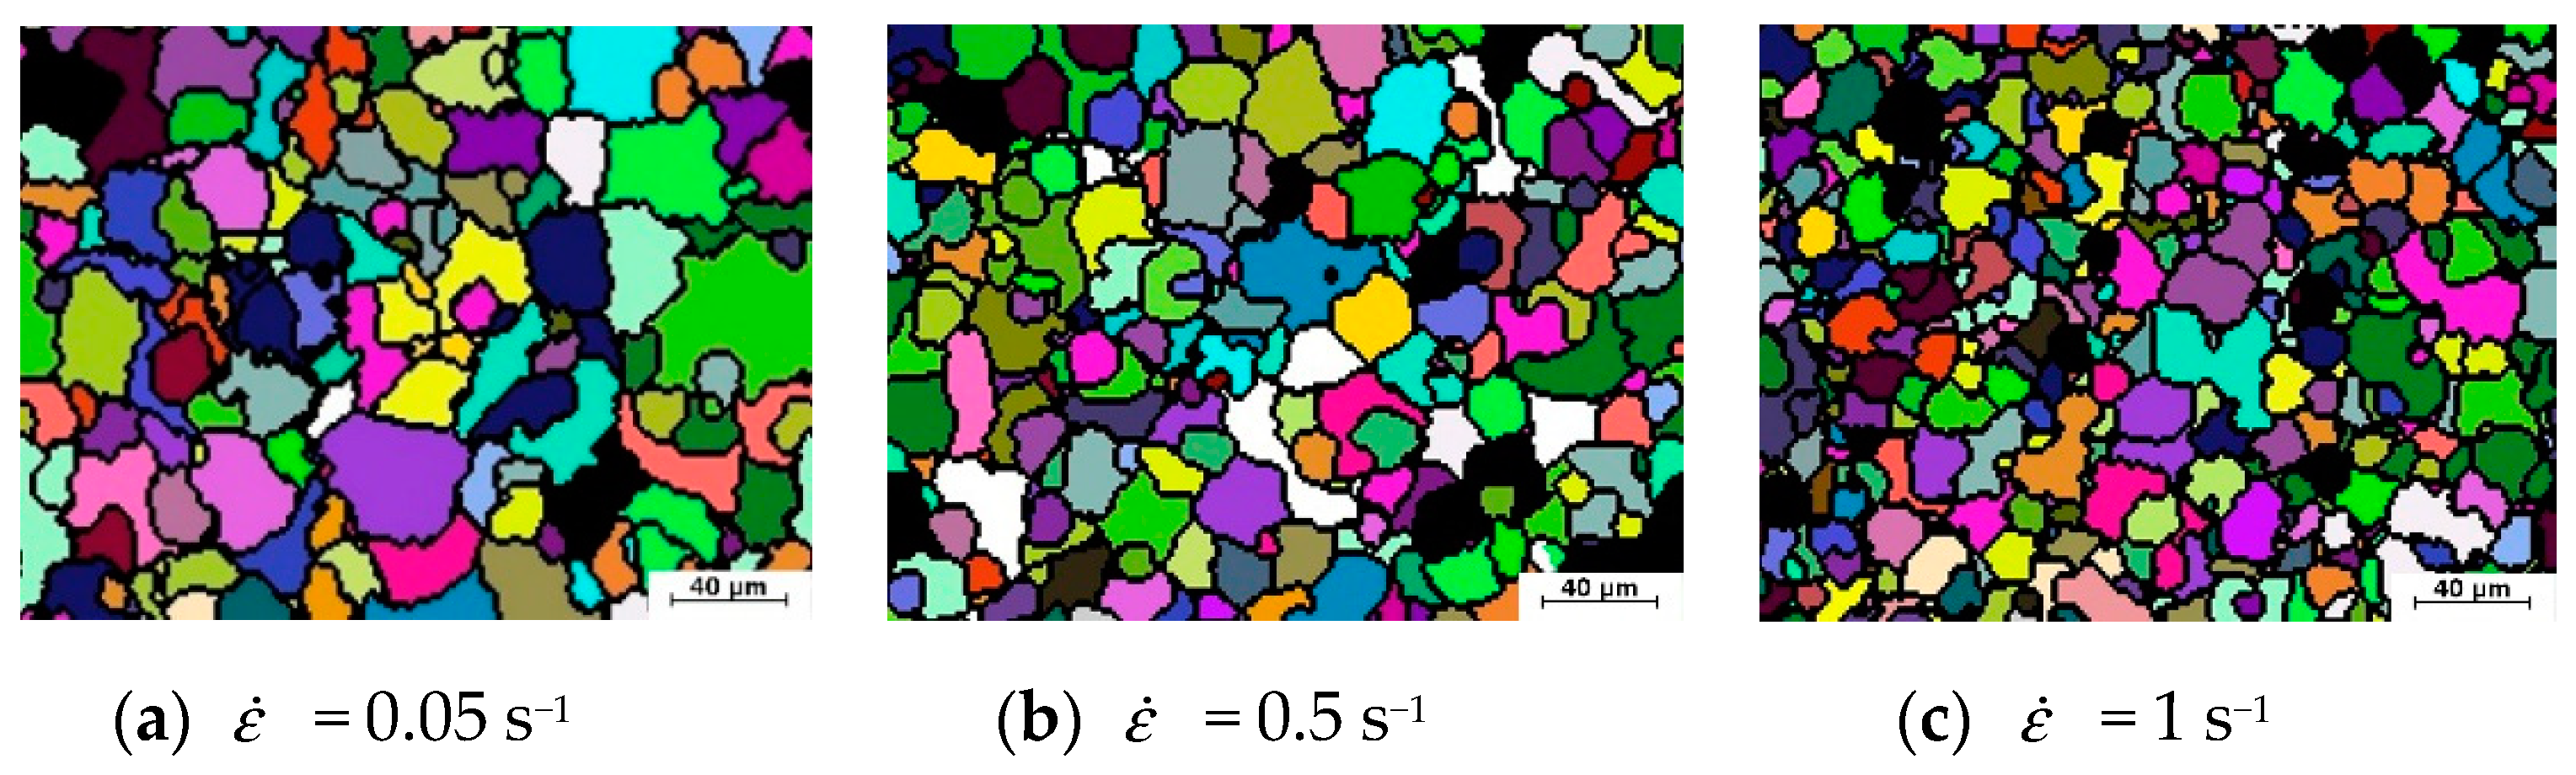
6. Microstructure Simulation and CA Model Validation

The established CA model based on the modified L-J dislocation density model was used to simulate the dynamic recrystallization behavior of X12 alloy steel during hot compression process. The microstructure evolution of X12 alloy steel was simulated at 1150 °C for strain rates of 0.05, 0.1, and 1 s−1, respectively. In the simulation area, 150 grids were adopted. The absolute length was set to 2 µm. The cell neighbor type was chosen as Moore neighbor type, and the initial value of dislocation density was set to 0.01. In the simulation process, the parameters of X12 related materials are shown in Table 2:
Figure 6 shows the simulation results for dynamic recrystallization of X12 alloy steel. Grain boundary is represented by black line and grains are shown as different internal colors. The initial microstructure of X12 alloy steel is shown in Figure 6a with a grain size of 38.86 µm. As deformation increases, dislocation density gradually increases. When dislocation density oversteps a critical value required for dynamic recrystallization, X12 alloy steel begins to enter a dynamic recrystallization process. First, a new grain nucleus begins to form at grain boundary (see Figure 6b) so that dislocation density at new nucleation becomes zero. Then a newly formed grain nucleus begins to grow gradually (see Figure 6c) and eventually is stabilized (Figure 6d). As a result of dynamic recrystallization, grains are refined effectively.
Actual metallographic photos obtained for samples deformed at 1150 °C and various strain rates are shown in Figure 7. The corresponding simulated microstructure is represented in Figure 8. It can be illustrated from Figure 7 and Figure 8 that grain size of X12 alloy steel is gradually refined as strain rate increases. These observations may be attributed to dislocation motion and grain boundary migration. During hot compression deformation process, deformation time reduces with rising strain rate. This reduces the time of dislocation movement and grain boundary migration. At the same time, time for grain growth is insufficient. In addition, a higher strain rate can increase the storage energy of dislocations during deformation, thus increasing the number of dynamic recrystallization nucleation. Consequently, finer grains can be obtained. Good agreements between the simulated and the experimental results are illustrated in Table 3, and Figure 7 and Figure 8. The relative error between the simulated and average grain size in experiments is below 10%, and the average relative error is 6%, which indicates that the established model can account for the dynamic recrystallization behavior of X12 alloy steel well.

7. Conclusions

Based on experimental and simulated results in this work, it can be concluded as follow:
(1)
X12 alloy steel underdoes a dynamic recrystallization when hot compressed at temperatures of 1050–1200 °C, and with strain rates of 0.05–5 s 1 .
(2)
Flow stress increases with reduction of temperature and raise of strain rate.
(3)
CA model based on the modified L-J dislocation density model can be used to simulate thermal compression deformation process of X12 alloy steel.
(4)
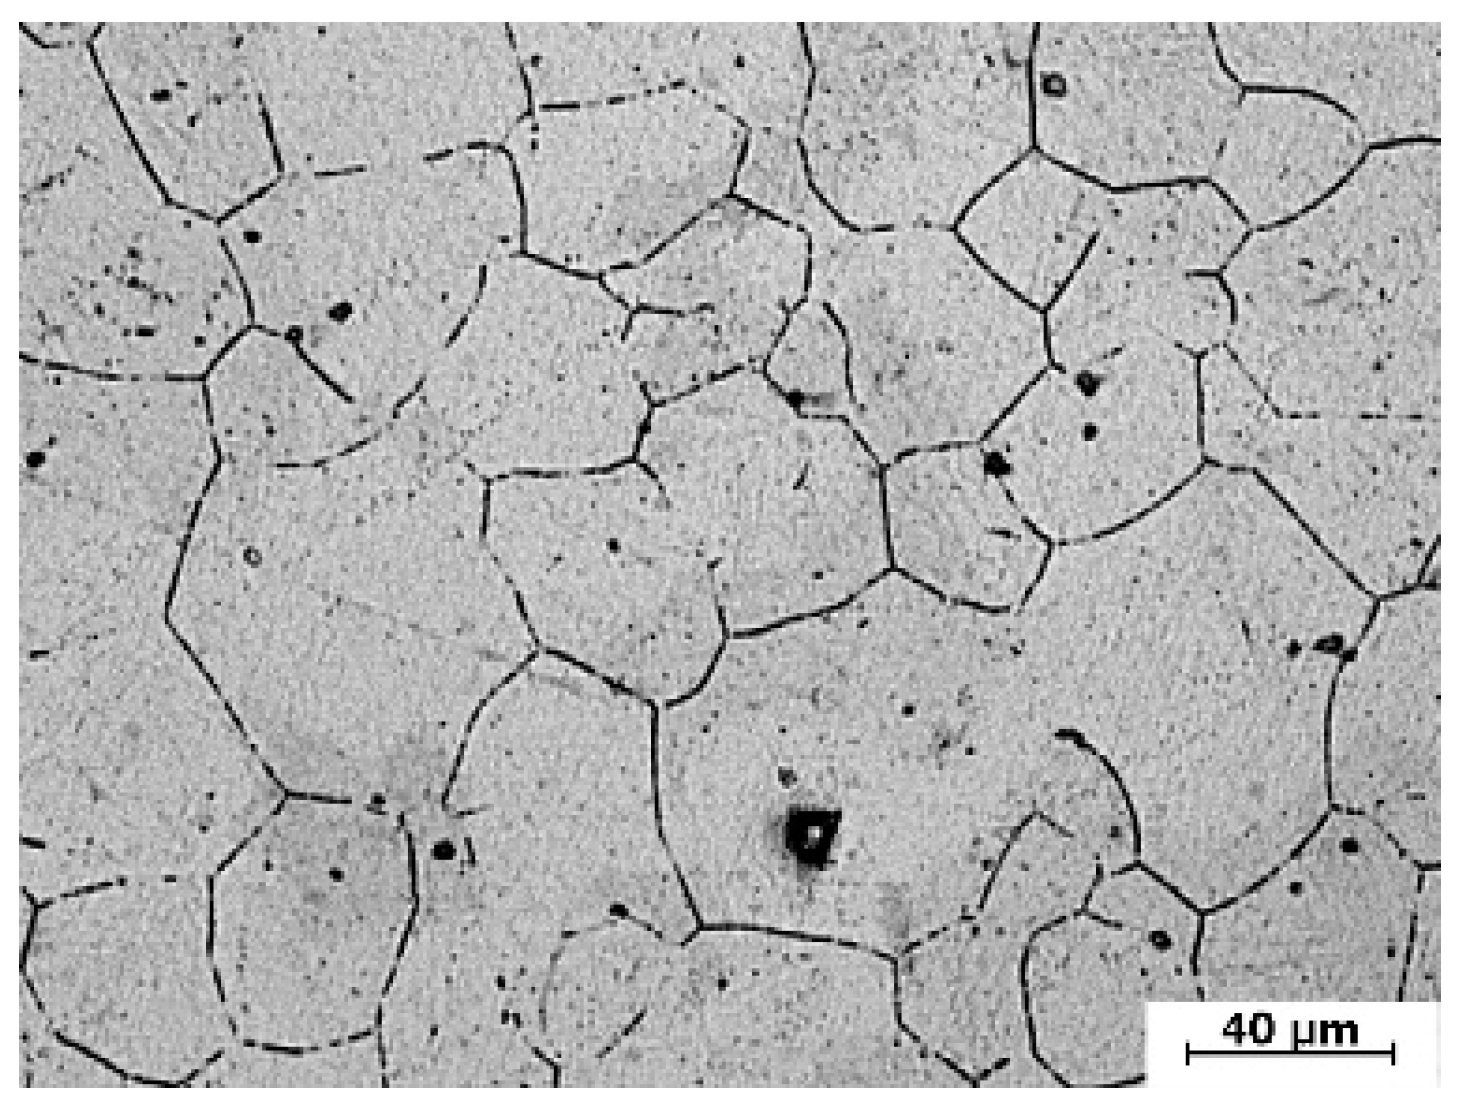
The simulated microstructures agree well with actual metallographic results with an average grain size error being as low as 6%.

Author Contributions

Proposing concepts, X.C.; methodology, X.C.; software, X.C. and J.Z.; manuscript writing, X.C.; data processing, J.Z.; data analysis, J.Z.; modify the manuscript, Y.D.; make chart, Y.D.; search the literature, Y.D.; revision of the manuscript, G.W.; determine the final manuscript, T.H.;

Funding

The research was supported by the National Natural Science Foundation of China (No.51575162).

Conflicts of Interest

The authors declare no conflict of interest.

References

  1. Cui, H.; Sun, F.; Chen, K.; Zhang, L.; Wan, R.; Shan, A.; Wu, J. Precipitation behavior of Laves phase in 10%Cr steel X12CrMoWVNbN10-1-1 during short-term creep exposure. Mater. Sci. Eng. A 2010, 527, 7505–7509. [Google Scholar] [CrossRef]
  2. Wang, B.; Fu, W.; Lv, Z.; Jiang, P.; Zhang, W.; Tian, Y. Study on hot deformation behavior of 12%Cr ultra-super-critical rotor steel. Mater. Sci. Eng. A 2008, 487, 108–113. [Google Scholar] [CrossRef]
  3. Rojas, D.; Garcia, J.; Prat, O.; Agudo, L.; Carrasco, C.; Sauthoff, G.; Kaysser-Pyzalla, A.R. Effect of processing parameters on the evolution of dislocation density and sub-grain size of a 12%Cr heat resistant steel during creep at 650 °C. Mater. Sci. Eng. A 2011, 528, 1372–1381. [Google Scholar] [CrossRef]
  4. El May, M.; Palin-Luc, T.; Saintier, N.; Devos, O. Effect of corrosion on the high cycle fatigue strength of martensitic stainless steel X12CrNiMoV12-3. Int. J. Fatigue 2013, 47, 330–339. [Google Scholar] [CrossRef]
  5. Fatoba, O.S.; Popoola, O.M.; Pityana, S.L. The influence of heat treatment and process parameters optimization on hardness and corrosion properties of laser alloyed X12CrNiMo steel. Silicon 2016, 8, 579–589. [Google Scholar]
  6. Feng, H.; Jiang, Z.H.; Li, H.B.; Jiao, W.C.; Li, X.X.; Zhu, H.C.; Shucai, Z.; Zhang, B.B.; Cai, M. Hot deformation behavior and microstructural evolution of high nitrogen martensitic stainless steel 30Cr15Mo1N. Steel Res. Int. 2017, 88, 1700149. [Google Scholar] [CrossRef]
  7. Shukla, A.K.; Murty, S.N.; Sharma, S.C.; Mondal, K. Constitutive modeling of hot deformation behavior of vacuum hot pressed Cu–8Cr–4Nb alloy. Mater. Des. 2015, 75, 57–64. [Google Scholar] [CrossRef]
  8. Abedi, H.R.; Hanzaki, A.Z.; Liu, Z.; Xin, R.; Haghdadi, N.; Hodgson, P.D. Continuous dynamic recrystallization in low density steel. Mater. Des. 2016, 114, 55–64. [Google Scholar] [CrossRef]
  9. Vetayanugul, B.; Morakotjinda, M.; Wila, P.; Krataitong, R.; Rengsomboon, A.; Panyafu, J.; Patakham, U.; Tongsri, R. Heating temperature and atmosphere affecting dynamic recrystallization and property of hot-squeezed ultralow carbon Fe-Cr-Mo steels. Mater. Today Proc. 2018, 5, 9256–9263. [Google Scholar] [CrossRef]
  10. Annasamy, M.; Haghdadi, N.; Taylor, A.; Hodgson, P.; Fabijanic, D. Dynamic recrystallization behaviour of AlxCoCrFeNi high entropy alloys during high-temperature plane strain compression. Mater. Sci. Eng. A 2018, 745, 90–106. [Google Scholar] [CrossRef]
  11. Sui, D.S.; Wang, W.; Fu, B.; Cui, Z.S. Research on flow stress model and dynamic recrystallization model of X12CrMoWVNbN10-1-1 steel. In AIP Conference Proceedings; AIP Publishing LLC: College Park, MD, USA, 2013. [Google Scholar]
  12. Sui, D.S.; Gao, L.; Cui, Z.S. Micro-structure evolution of different forging processes for 12%Cr steel during hot deformation. J. Shanghai Jiaotong Univ. 2015, 20, 606–611. [Google Scholar] [CrossRef]
  13. Wang, Z.; Fu, W.; Wang, B.; Zhang, W.; Lv, Z.; Jiang, P. Study on hot deformation characteristics of 12%Cr ultra-super-critical rotor steel using processing maps and Zener–Hollomon parameter. Mater. Charact. 2010, 61, 25–30. [Google Scholar] [CrossRef]
  14. Steiner, M.A.; McCabe, R.J.; Garlea, E.; Agnew, S.R. Monte Carlo modeling of recrystallization processes in α-uranium. J. Nucl. Mater. 2017, 492, 74–87. [Google Scholar] [CrossRef]
  15. Fu, J.; Peng, B.Y.; Xie, B.; Ye, Y.G. A modified Monte-Carlo potts model for dynamic recrystallization. Adv. Mater. Res. 2015, 1096, 280–287. [Google Scholar] [CrossRef]
  16. Rollett, A.D.; Srolovitz, D.J.; Luton, M.J. Microstructural simulations of dynamic recrystallization. Materialsence 1989, 40, 43–55. [Google Scholar] [CrossRef]
  17. Takaki, T.; Hirouchi, T.; Hisakuni, Y.; Yamanaka, A.; Tomita, Y. Multi-Phase-Field simulations for dynamic recrystallization. Comput. Mater. Sci. 2009, 45, 881–888. [Google Scholar] [CrossRef]
  18. Zheng, C.; Raabe, D. Interaction between recrystallization and phase transformation during intercritical annealing in a cold-rolled dual-phase steel: A cellular automaton model. Acta Mater. 2013, 61, 5504–5517. [Google Scholar] [CrossRef]
  19. Hallberg, H.; Wallin, M.; Ristinmaa, M. Simulation of discontinuous dynamic recrystallization in pure Cu using a probabilistic cellular automaton. Comput. Mater. Sci. 2010, 49, 25–34. [Google Scholar] [CrossRef]
  20. Li, H.; Sun, X.; Yang, H. A multiscale three-dimensional cellular automata-crystal plasticity finite element model for predicting the interaction among heterogeneous deformation, DRX microstructural evolution and mechanical responses in titanium alloys. Int. J. Plast. 2016, 87, 154–180. [Google Scholar] [CrossRef]
  21. Matsumoto, H.; Velay, V. Mesoscale modeling of dynamic recrystallization behavior, grain size evolution, dislocation density, processing map characteristic, and room temperature strength of Ti-6Al-4V alloy forged in the (α + β) region. J. Alloys Compd. 2017, 708, 404–413. [Google Scholar] [CrossRef]
  22. Jian, W. Determination of the kinetics for dynamic recrystallization based on dislocation density variation. J. Plast. Eng. 2009, 4, 2685–2699. [Google Scholar]
  23. Laasraoui, A.; Jonas, J.J. Prediction of steel flow stresses at high temperatures and strain rates. Metall. Mater. Trans. A 1991, 22, 1545–1558. [Google Scholar] [CrossRef]
  24. Mecking, H.; Kocks, U.F. Kinetics of flow and strain-hardening. Acta Mater. 1981, 29, 1865–1875. [Google Scholar] [CrossRef]
  25. Gourdet, S.; Montheullet, F. A model of continuous dynamic recrystallization. Acta Mater. 2003, 51, 2685–2699. [Google Scholar] [CrossRef]
  26. Xiao, L.I.U.; Li, L.X.; He, F.Y.; Jia, Z.H.O.U.; Zhu, B.W.; Zhang, L.Q. Simulation on dynamic recrystallization behavior of AZ31 magnesium alloy using cellular automaton method coupling Laasraoui–Jonas model. Trans. Nonferrous Metals Soc. China 2013, 23, 2692–2699. [Google Scholar]
  27. Liu, Y.X.; Lin, Y.C.; Li, H.B.; Wen, D.X.; Chen, X.M.; Chen, M.S. Study of dynamic re-crystallization in a Ni-based superalloy by experiments and cellular automaton model. Mater. Sci. Eng. A 2015, 626, 432–440. [Google Scholar] [CrossRef]
  28. Yang, Z.N.; Xiao, Y.Y.; Zhang, F.C.; Yan, Z.G. Effect of cold rolling on microstructure and mechanical properties of pure Zr. Mater. Sci. Eng. A 2012, 556, 728–733. [Google Scholar] [CrossRef]
  29. Páramo-Kañetas, P.; Özturk, U.; Calvo, J.; Cabrera, J.M.; Guerrero-Mata, M. High-temperature deformation of delta-processed Inconel 718. J. Mater. Process. Technol. 2018, 255, 204–211. [Google Scholar] [CrossRef]
  30. Ebrahimi, G.R.; Keshmiri, H.; Maldad, A.R.; Momeni, A. Dynamic recrystallization behavior of 13%Cr martensitic stainless steel under hot working condition. J. Mater. Sci. Technol. 2012, 28, 467–473. [Google Scholar] [CrossRef]
  31. Marandi, A.; Zarei-Hanzaki, R.; Zarei-Hanzaki, A.; Abedi, H.R. Dynamic recrystallization behavior of new trans-formation–twinning induced plasticity steel. Mater. Sci. Eng. A 2014, 607, 397–408. [Google Scholar] [CrossRef]
Figure 1. The hot compression deformation process.
Metals 09 01291 g001
Figure 2. Microstructure of X12 alloy steel before hot compression deformation.
Metals 09 01291 g002
Figure 3. Curves of true stress–strain of X12 alloy under different deformation conditions: (a) ε ˙ = 0.05 s1, (b) ε ˙ = 0.1 s1, (c) ε ˙ = 0.5 s1, (d) ε ˙ = 1 s1, (e) ε ˙ = 5 s−1.
Metals 09 01291 g003
Figure 4. Relationship curves between 2 θ σ and σ 2 : (a) ε ˙ =   0.05   s 1 ; (b) ε ˙ =   0.1   s 1 ; (c) ε ˙ =   0.5   s 1 ; (d) ε ˙ =   1   s 1 ; (e) ε ˙ =   5   s 1 .
Metals 09 01291 g004
Figure 5. The influence of different parameters variety on the dislocation density.
Metals 09 01291 g005
Figure 6. Microstructure evolution of X12 alloy steel during dynamic recrystallization (T = 1150 °C, ε ˙ = 0.5 s1): (a) ε = 0; (b) ε = 0.15; (c) ε = 0.35; (d) ε = 0.7.
Metals 09 01291 g006
Figure 7. Experimental microstructures at different strain rates at a deformation temperature of 1150 °C.
Metals 09 01291 g007
Figure 8. Simulated microstructures at different strain rates at a deformation temperature of 1150 °C.
Metals 09 01291 g008
Table 1. Chemical compositions of X12 alloy (mass fraction, %).
CCrMoNbVWNiMnN
0.11811.001.0290.0690.2070.950.7440.4200.055
Table 2. X12 alloy steel related material parameters.
Poisson’s RatioThermal EmissivityDeformation Activation Energy (kJ/mol)Shear Modulus/MPaBurgers Vector/mDiffusion Activation Energy/(kJ/mol)
0.30.753185,0002.35 × 10−10278
Table 3. Comparison of simulated and experimental average grain sizes.
Temperature/°CStrain Rate/s−1Simulated Average Grain Size/μmExperimental Average Grain Size/μmRelative Error/%
11500.0523244%
11500.518176%
1150111129%

