Article

Correlated Unique Variation of Electrical Resistivity to Crystallization Behavior of the Zr52.5Cu17.9Ni14.6Al10Ti5 Metallic Glass

1
Luoyang Ship Material Research Institute, Luoyang 471023, China
2
State Key Laboratory for Advanced Metals and Materials, University of Science and Technology Beijing, Beijing 100083, China
*
Author to whom correspondence should be addressed.
Metals 2019, 9(12), 1298; https://doi.org/10.3390/met9121298
Submission received: 7 November 2019 / Revised: 23 November 2019 / Accepted: 25 November 2019 / Published: 2 December 2019

Abstract

:
Due to the differences between the glass and crystalline phases, crystallization of metallic glass occurs with heat release, volume shrinkage, and electrical resistivity drastic changes. Electrical resistivity of the Zr52.5Cu17.9Ni14.6Al10Ti5 metallic glass during crystallization was investigated under both continuous heating and isothermal annealing. This amorphous alloy exhibits a continuous variation instead of sharp decline when reaches the onset crystallization temperature. This unique variation was found to be related to the formation of a few quasicrystalline phases. The slower phase transformation process of this metallic glass brings lots of grain boundaries, which results in increasing of resistivity at the last stage during isothermal annealing. These results imply that electrical resistivity measurement is a more intuitive approach to investigate structure evolution of metallic glasses.

1. Introduction

Metallic glasses (MGs) offer enormous application potential as advanced materials due to their unique properties, such as excellent mechanical properties and corrosion resistance. Upon heating, MGs will inevitably crystallize and transform into a mixture of amorphous and crystalline phases. The properties of the composite materials strongly depend on the type and amounts of crystallites within the glassy matrix. Therefore, a thorough understanding of the crystallization behavior is important not only for understanding the origin of high thermal stability and good glass-forming ability, but also for tailoring the properties for particular applications. Many efforts have been devoted to the crystallization behaviors of metallic glasses by thermal analysis [1,2,3].
Electrical resistivity is always related to the electronic structure of alloys and sensitive to structural changes, which are also applied to investigate phase transformation. Due to structural disorder, the electrical resistivity of MGs is one or two orders of magnitude higher than that of the corresponding crystalline alloys. Variation of electrical resistivity during crystallization is governed by the residual glass matrix, crystalline nuclei formation and their growth. Particularly, the appearance of grain changes the disordered arrangement of atoms and the band structure of metallic glasses, which leads to a sharp decline of resistivity at the onset crystallization temperature (Tx) [4,5,6,7,8]. The resistivity of the Zr76Ni24 alloy decreased drastically after annealing the samples slightly above crystallization temperature [9]. A Similar phenomenon was observed in the Pd–Cu–Ni–P metallic glasses in which the also resistivity decreased rapidly at the onset of crystallization temperature [10]. However, an abnormal change of electrical resistivity in the Cu46Zr46Al8 bulk metallic glass during crystallization was reported, which was attributed to the high-density site-saturated nucleation followed by slow growth crystallization kinetics [11]. Work by Haruyama et al. [4] relating to changes of electrical resistivity in two Zr-based MGs with the glass-to-quasicrystalline transformation and revealed that the drop of resistivity in the supercooled liquid (SCL) region was contributed to the transfer of oxide atoms into the icosahedral phase. These results indicate that in addition to the disorder to order transformation, other factors such as crystallization kinetics and paths also greatly influence changes of electrical resistivity. Additionally, MGs have different types and paths of crystallization, such as phase decomposition, formation of icosahedral phases or intermetallic compounds [12], and multi-step crystallization processes. Therefore, influences relating to the distribution and morphology of crystalline phases on electrical resistivity during crystallization require further investigation.
In this work, we report a unique variation of electrical resistivity in the Zr52.5Cu17.9Ni14.6Al10Ti5 MG during crystallization and correlate it with the phase transformation process. Compared to DSC traces only with exothermic peaks, these results imply that electrical resistivity measurement is a more intuitive approach to investigate structure evolution of MGs.

2. Materials and Methods

Master alloy ingot with composition of Zr52.5Cu17.9Ni14.6Al10Ti5 (atomic%) was prepared by arc melting a mixture of Zr (99.99%), Cu (99.99%), Ni (99.97%), Al (99.95%) and Ti (99.97%) under a Ti-gettered argon atmosphere. The ingot was re-melted five times to ensure composition homogeneity. The ingot was re-melted five times to ensure a composition homogeneity before been suction cast into a cylindrical specimen with a diameter of 5 mm using a copper-mold under high purity Ar atmosphere. The amorphous nature was examined by X-ray diffraction (XRD) using Cu Kα radiation in a Rigaku D/MAXDRB X-ray diffractometer (Rigaku, Tokyo, Japan).
Thermal analysis was performed using NETZSCH Differential Scanning Calorimetry (DSC-404f1, NETZSCH, Selb, Germany) with a heating rate of 10 K/min. A sample with dimensions of approximately 15 mm × 1.0 mm × 0.2 mm was prepared for electrical resistivity measurements using a standard four-probe technique at a heating rate of 10 K/min in a high vacuum furnace. The surface of all samples was carefully polished. Microstructure analysis was performed using Zeiss SUPRATM55 scanning electron microscopes (SEM, Carl Zeiss, Jena, Germany). Transmission electron microscopy (TEM) scans were performed using Tecnai G2 F30 (FEI, Hillsboro, OR, USA). The TEM samples were prepared using both focused ion beam milling and ion milling. For the alloy after heat treatment at 755 K, Model 691.CS ion milling was applied to produce TEM samples. The thinning angle gradually reduced from 10 to 4 degrees. Due to its brittleness, the TEM sample after isothermal annealing at 975 K was prepared by using a Zeiss Auriga Dual-beam FIB (Carl Zeiss, Jena, Germany). Samples were protected by coating the surface with Pt.

3. Results

3.1. Variation of Electrical Resistivity during Crystallization

3.1.1. Variation of Electrical Resistivity under Isochronal Measurement

X-ray diffraction pattern of the Zr52.5Cu17.9Ni14.6Al10Ti5 MG exhibits a broad diffraction peak without any crystalline-phase peaks, which proves the samples used in this work are fully amorphous as shown Figure 1.
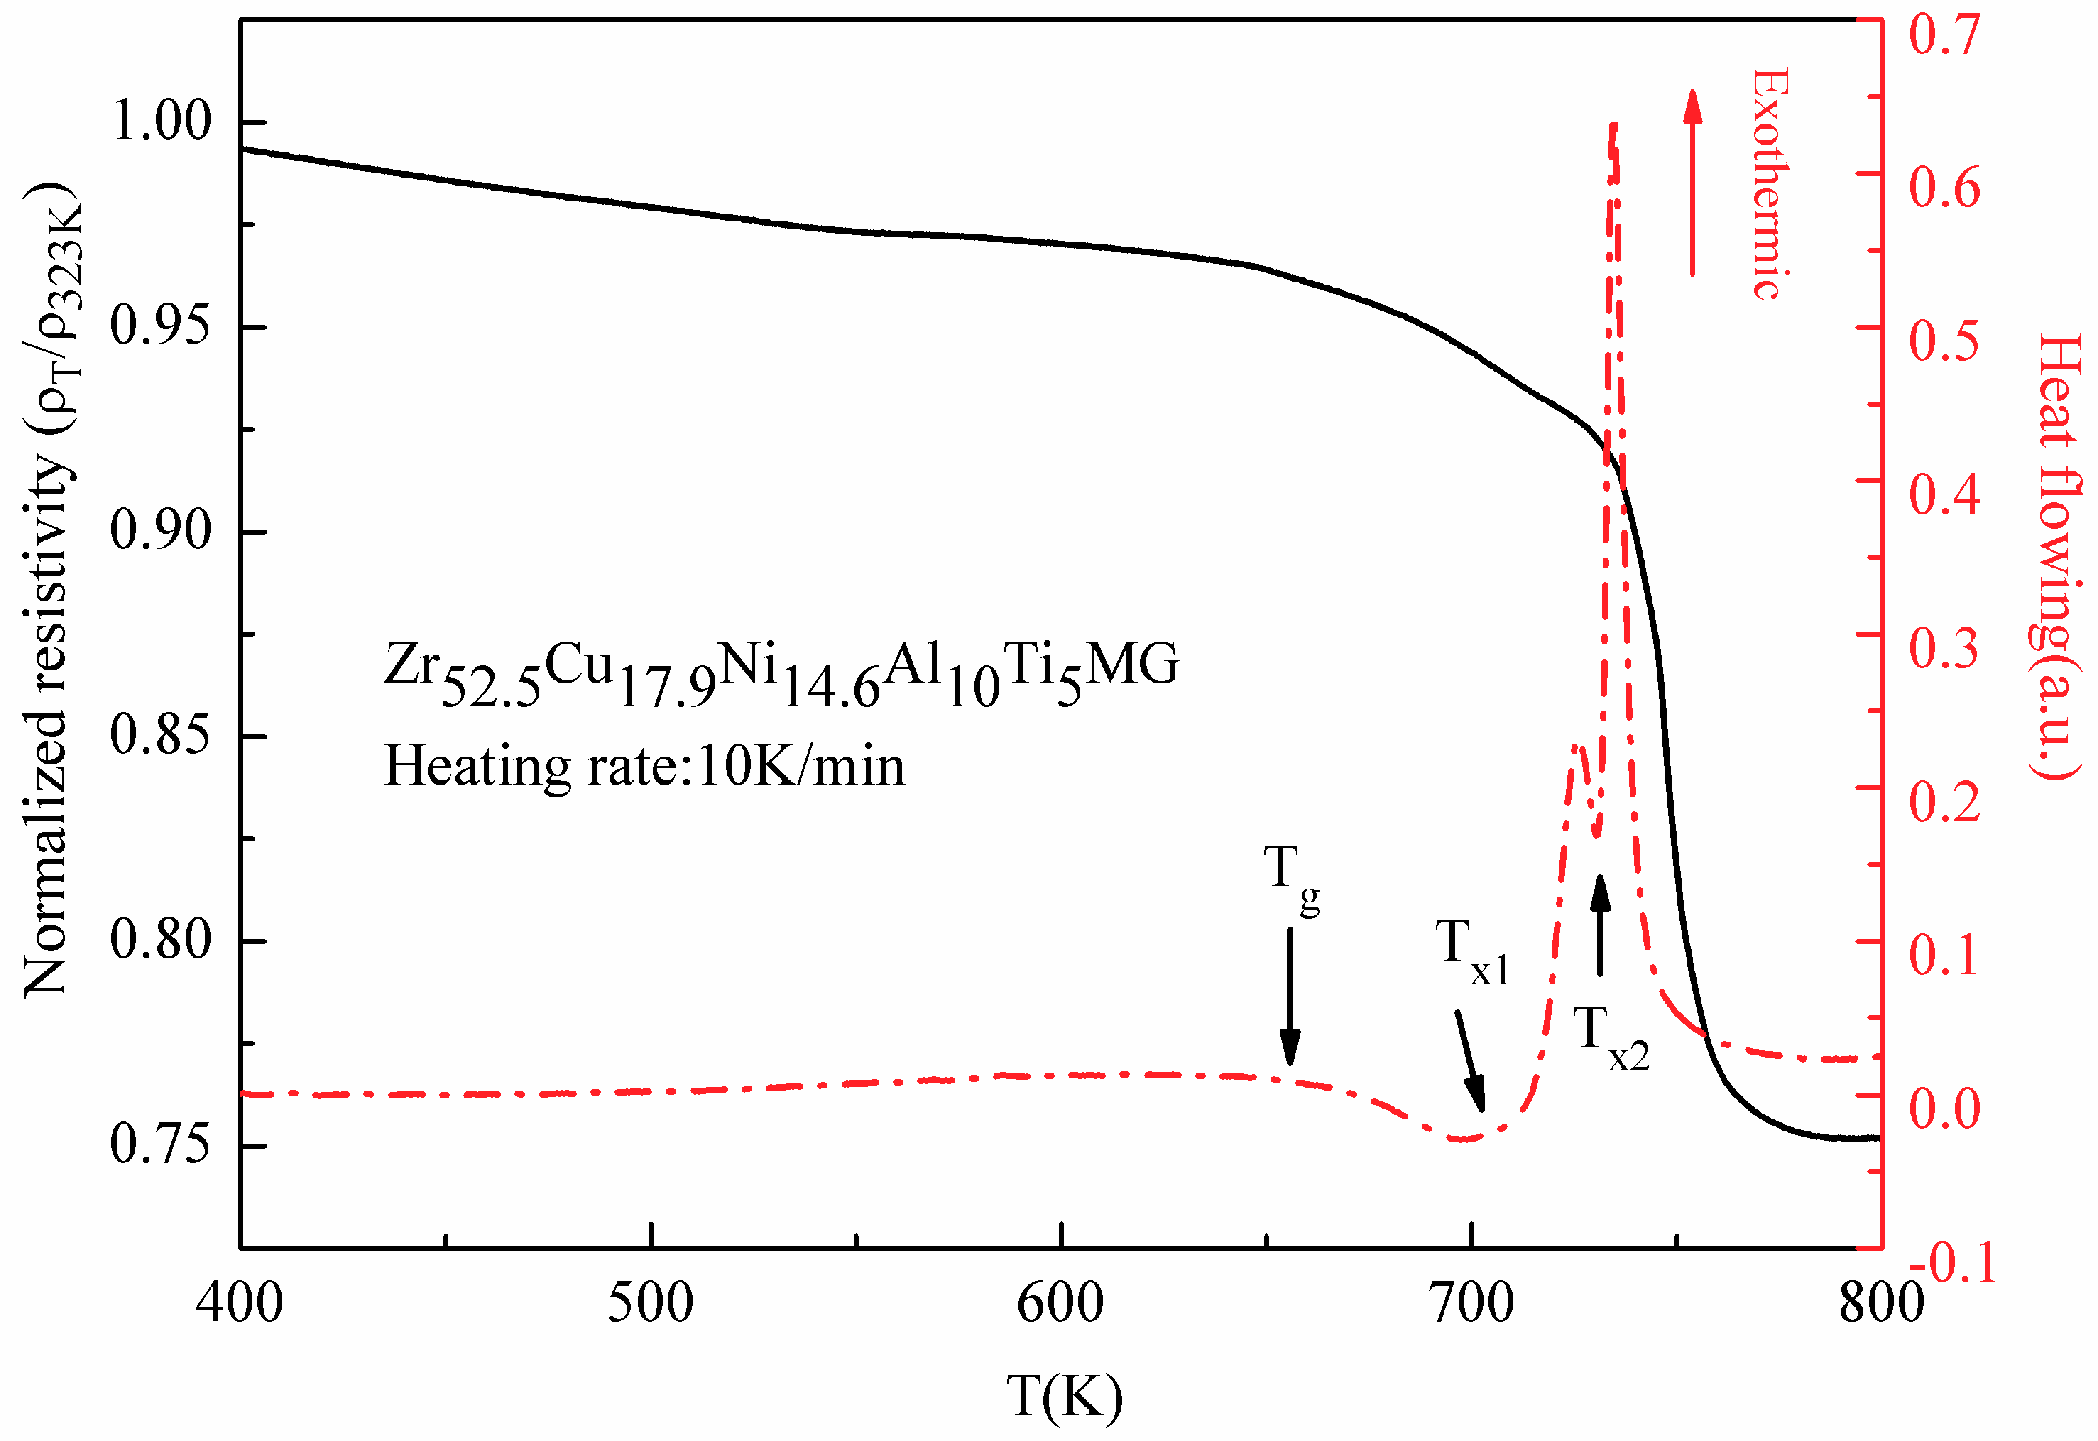
Figure 2 shows the normalized electrical resistivity (ρT/ρ323 K) and DSC traces of the Zr52.5Cu17.9Ni14.6Al10Ti5 MG at a heating rate of 10 K/min. This alloy exhibits a two-step crystallization process as displayed in the DSC curve. The glass transition temperature (Tg), the onset crystallization temperature (Tx1) and the second crystallization temperature (Tx2) are 656 K, 704 K and 730 K, respectively. As previously mentioned, due to the disorder to order transformation of atomic arrangement, a sharp drop of electrical resistivity, as well as a dramatic change of the slope, will be observed in the electrical resistivity against temperature curves at crystallization temperature onset (Tx1). These phenomena have previously been observed in Zr- and Cu-based metallic glasses, such as Zr41Ti14Cu12.5Ni10Be22.5 [5], Cu43Zr43Al7Ag7 [6], and Cu36Zr56Al8 [11]. However, the electrical resistivity of the Zr52.5Cu17.9Ni14.6Al10Ti5 MG exhibits a continuous variation when reaching Tx1. Only when the temperature reaches Tx2 does the electrical resistivity of this amorphous alloy rapidly decreases rapidly. It seems that the first crystallization process has less influence on resistivity. This phenomenon is similarly bserved in the samples under isothermal annealing in the SCL region.

3.1.2. Variation of Electrical Resistivity under Isothermal Annealing

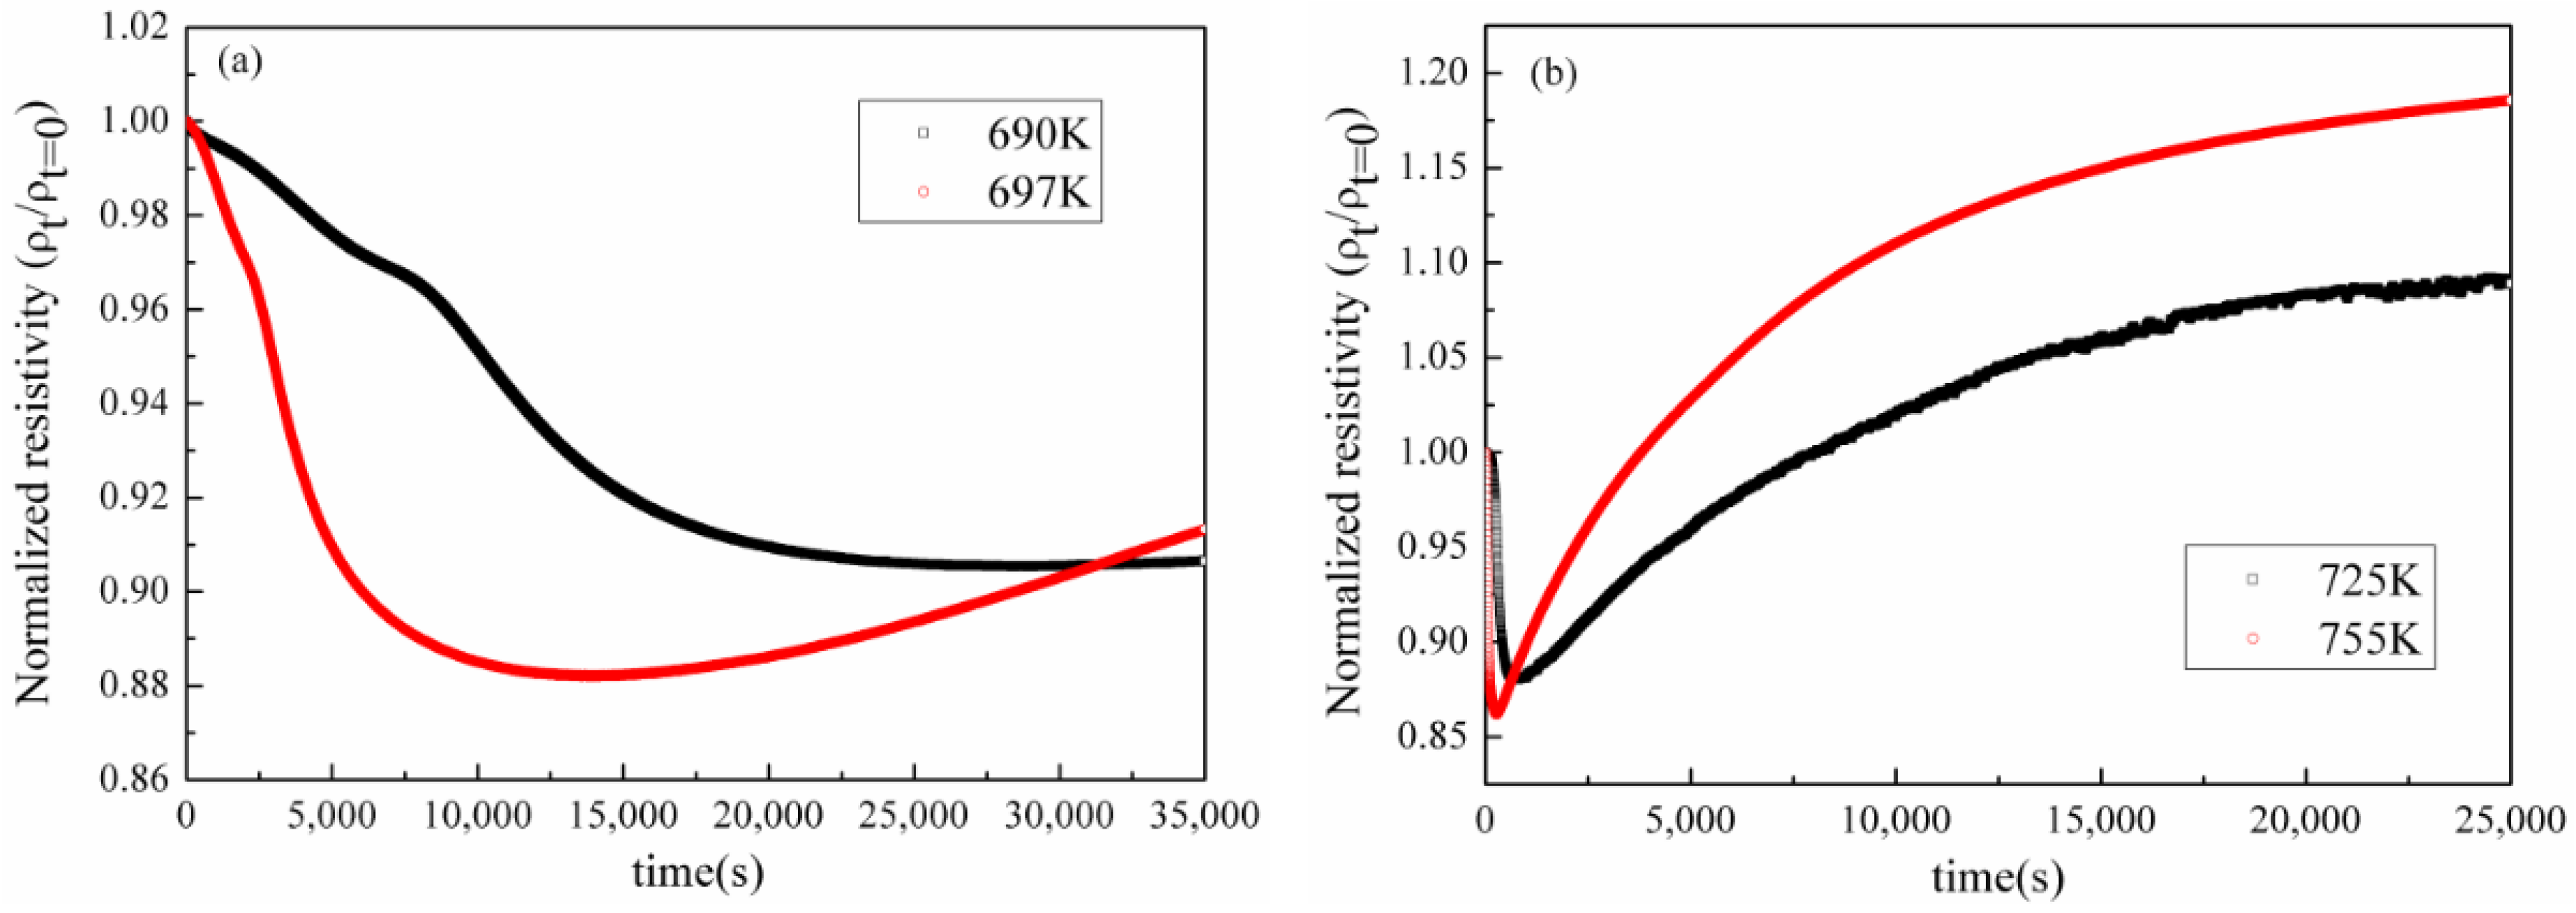
When isothermal annealing is performed in the SCL region, MGs devitrifies into a mixture of amorphous and crystalline phases after an initial incubation period. Examples have been reported in many glass forming systems using either thermal analysis or electrical resistivity measurement. However, two unique changes of resistivity were observed in the MG under scrutiny. Firstly, only one-step crystallization was observed in the resistivity curve as shown in Figure 3a, which is consistent with the isochronal measurement. In the early stage of annealing at 690 K, electrical resistivity exhibits a continuous variation. When treating time reached around 7000 s, the resistivity of this alloy declined rapidly. The XRD result, however, implies that some crystalline phases have appeared in the glassy matrix after annealing at 690 K for 3600 s (Figure 1). The sample under isothermal annealing at 697 K shows a similar change in resistivity at about 2000 s. Secondly, we observed an unusual increase of resistivity in the latter stages of heating. Resistivity tends to remain constant when completing crystallization [5]. The electrical resistivity of this alloy, however, increases slowly even after annealing at 697 K for 35,000 s. This finding contradicts previous work suggesting that this same MG had entirely crystallized after annealing at 675 K for about 30,000 s using DSC [13]. This phenomenon was more pronounced at higher temperatures. Figure 3b exhibits the variation of resistivity at 725 and 755 K, with a rapid decline followed by a sharp rise in resistivity. Here, it should be noted that the amorphous ribbons of the Zr52.5Cu17.9Ni14.6Al10Ti5 alloy with the heating rate of 5 K/min exhibit a similar tendency as the samples cut from the cylindrical specimen (Figure S1). In order to understand the unusual change in resistivity, the phase transformation process was investigated.

3.2. Phase Transformation of the Zr52.5Cu17.9Ni14.6Al10Ti5 MG

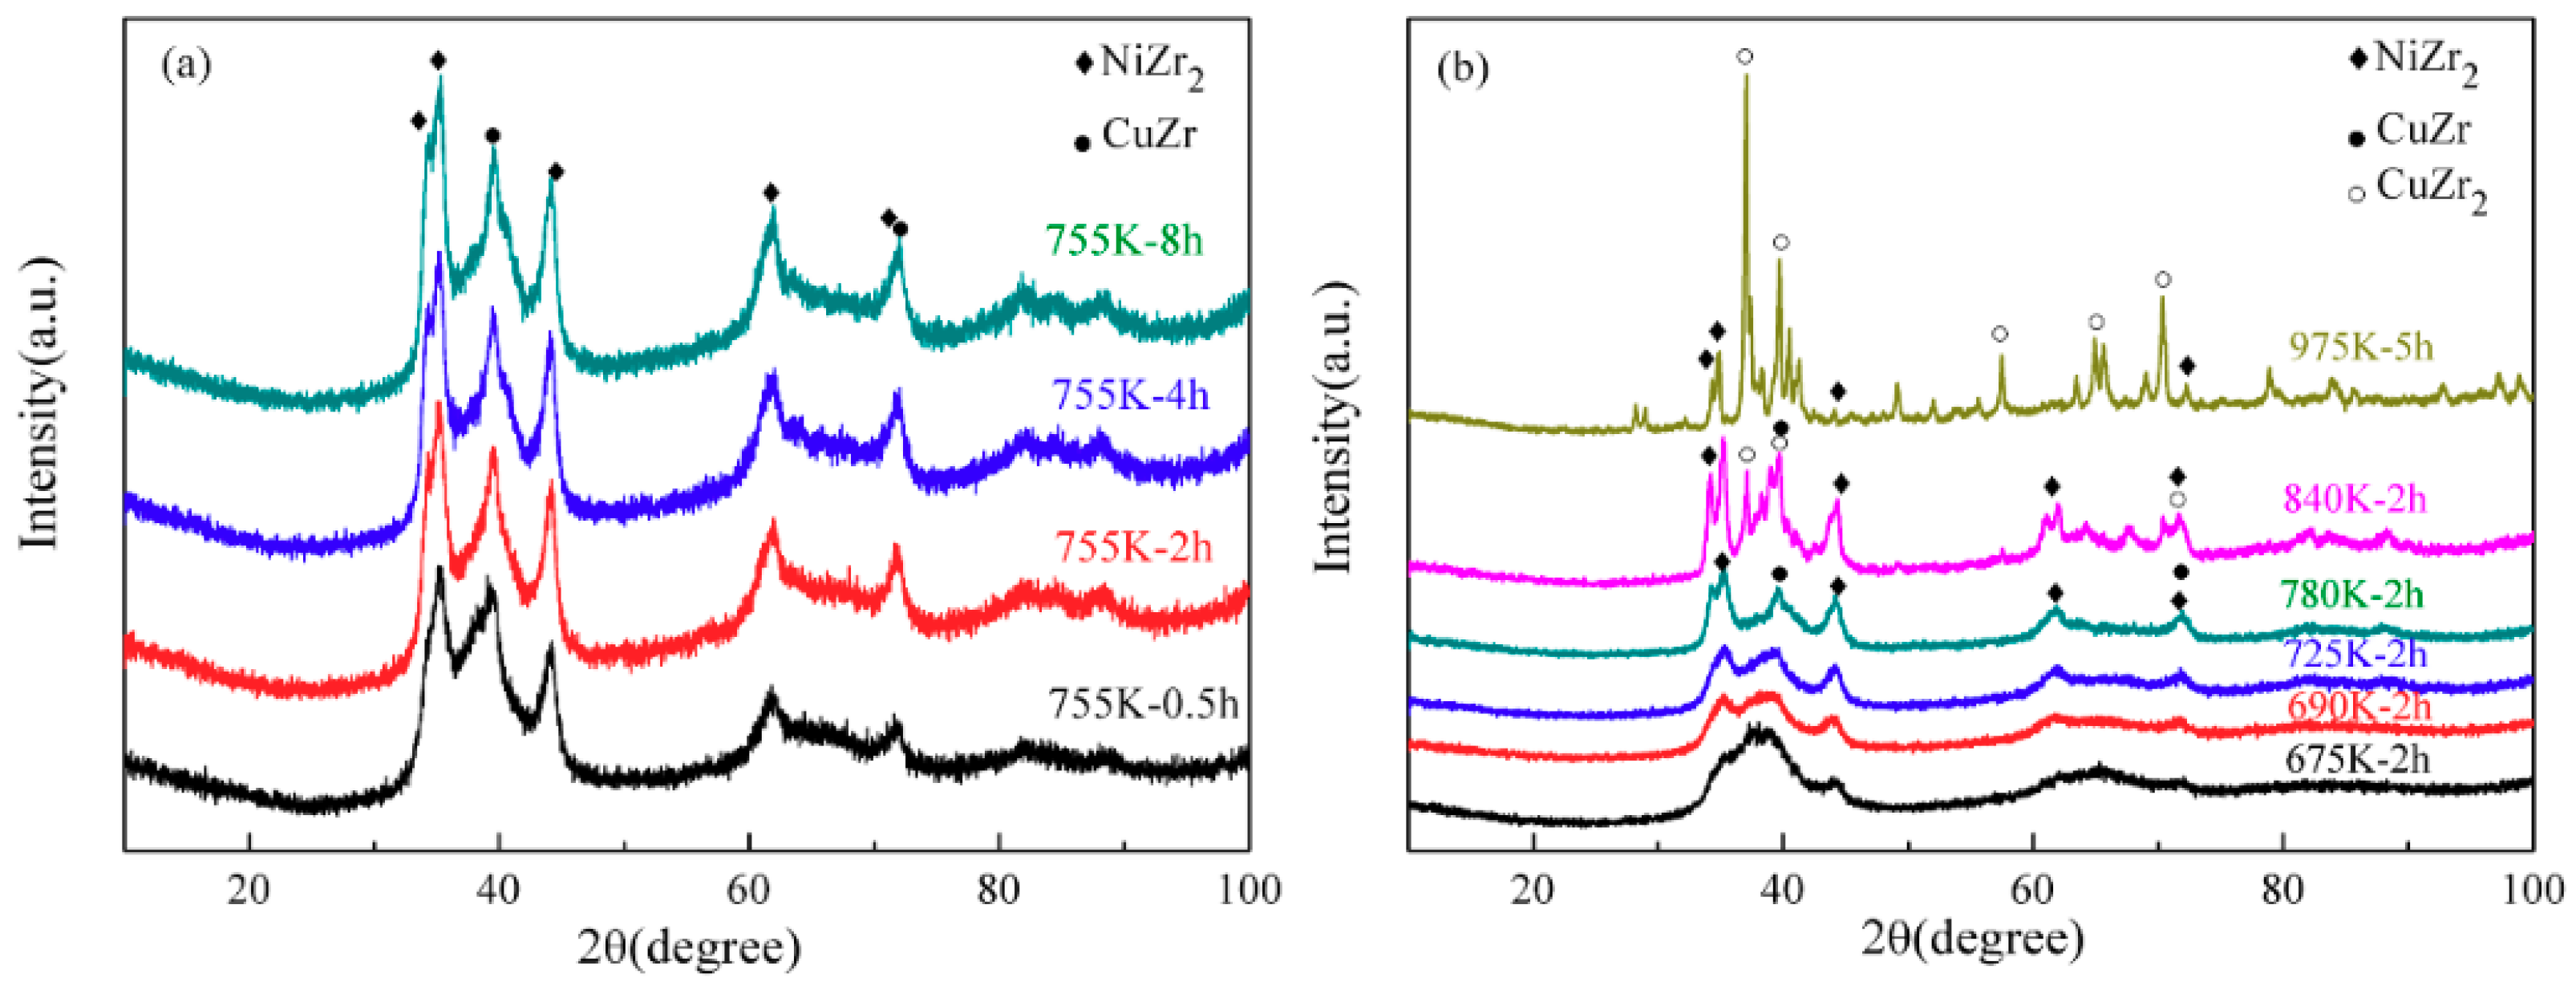
Figure 4a illustrates the XRD patterns of the Zr52.5Cu17.9Ni14.6Al10Ti5 MG after isothermal annealing at 755 K, at different time points. After annealing for 0.5 h, some broad diffraction peaks can be observed, corresponding to CuZr and NiZr2. While we do see much sharper peaks, no additional phases were observed as treatment time increased. After being treated at a temperature ranging from 675 K to 780 K for 2 h, samples possess the crystalline phases as illustrated in Figure 4b. When annealing temperature reached 840 K, a new phase corresponding to CuZr2 was observed. After annealing at 975 K for 5 h, the previous NiZr2 disappeared; transforming into CuZr2 and other unknown phases. Xing and coworkers suggest that the unknown phases are possibly compounds such as Zr6NiAl2 [14]. This result indicates that the unusual change of electrical resistivity is related to the slower phase transformation process. SEM experiments were performed to study phases morphology and distribution after heating treatment (Figure 5).
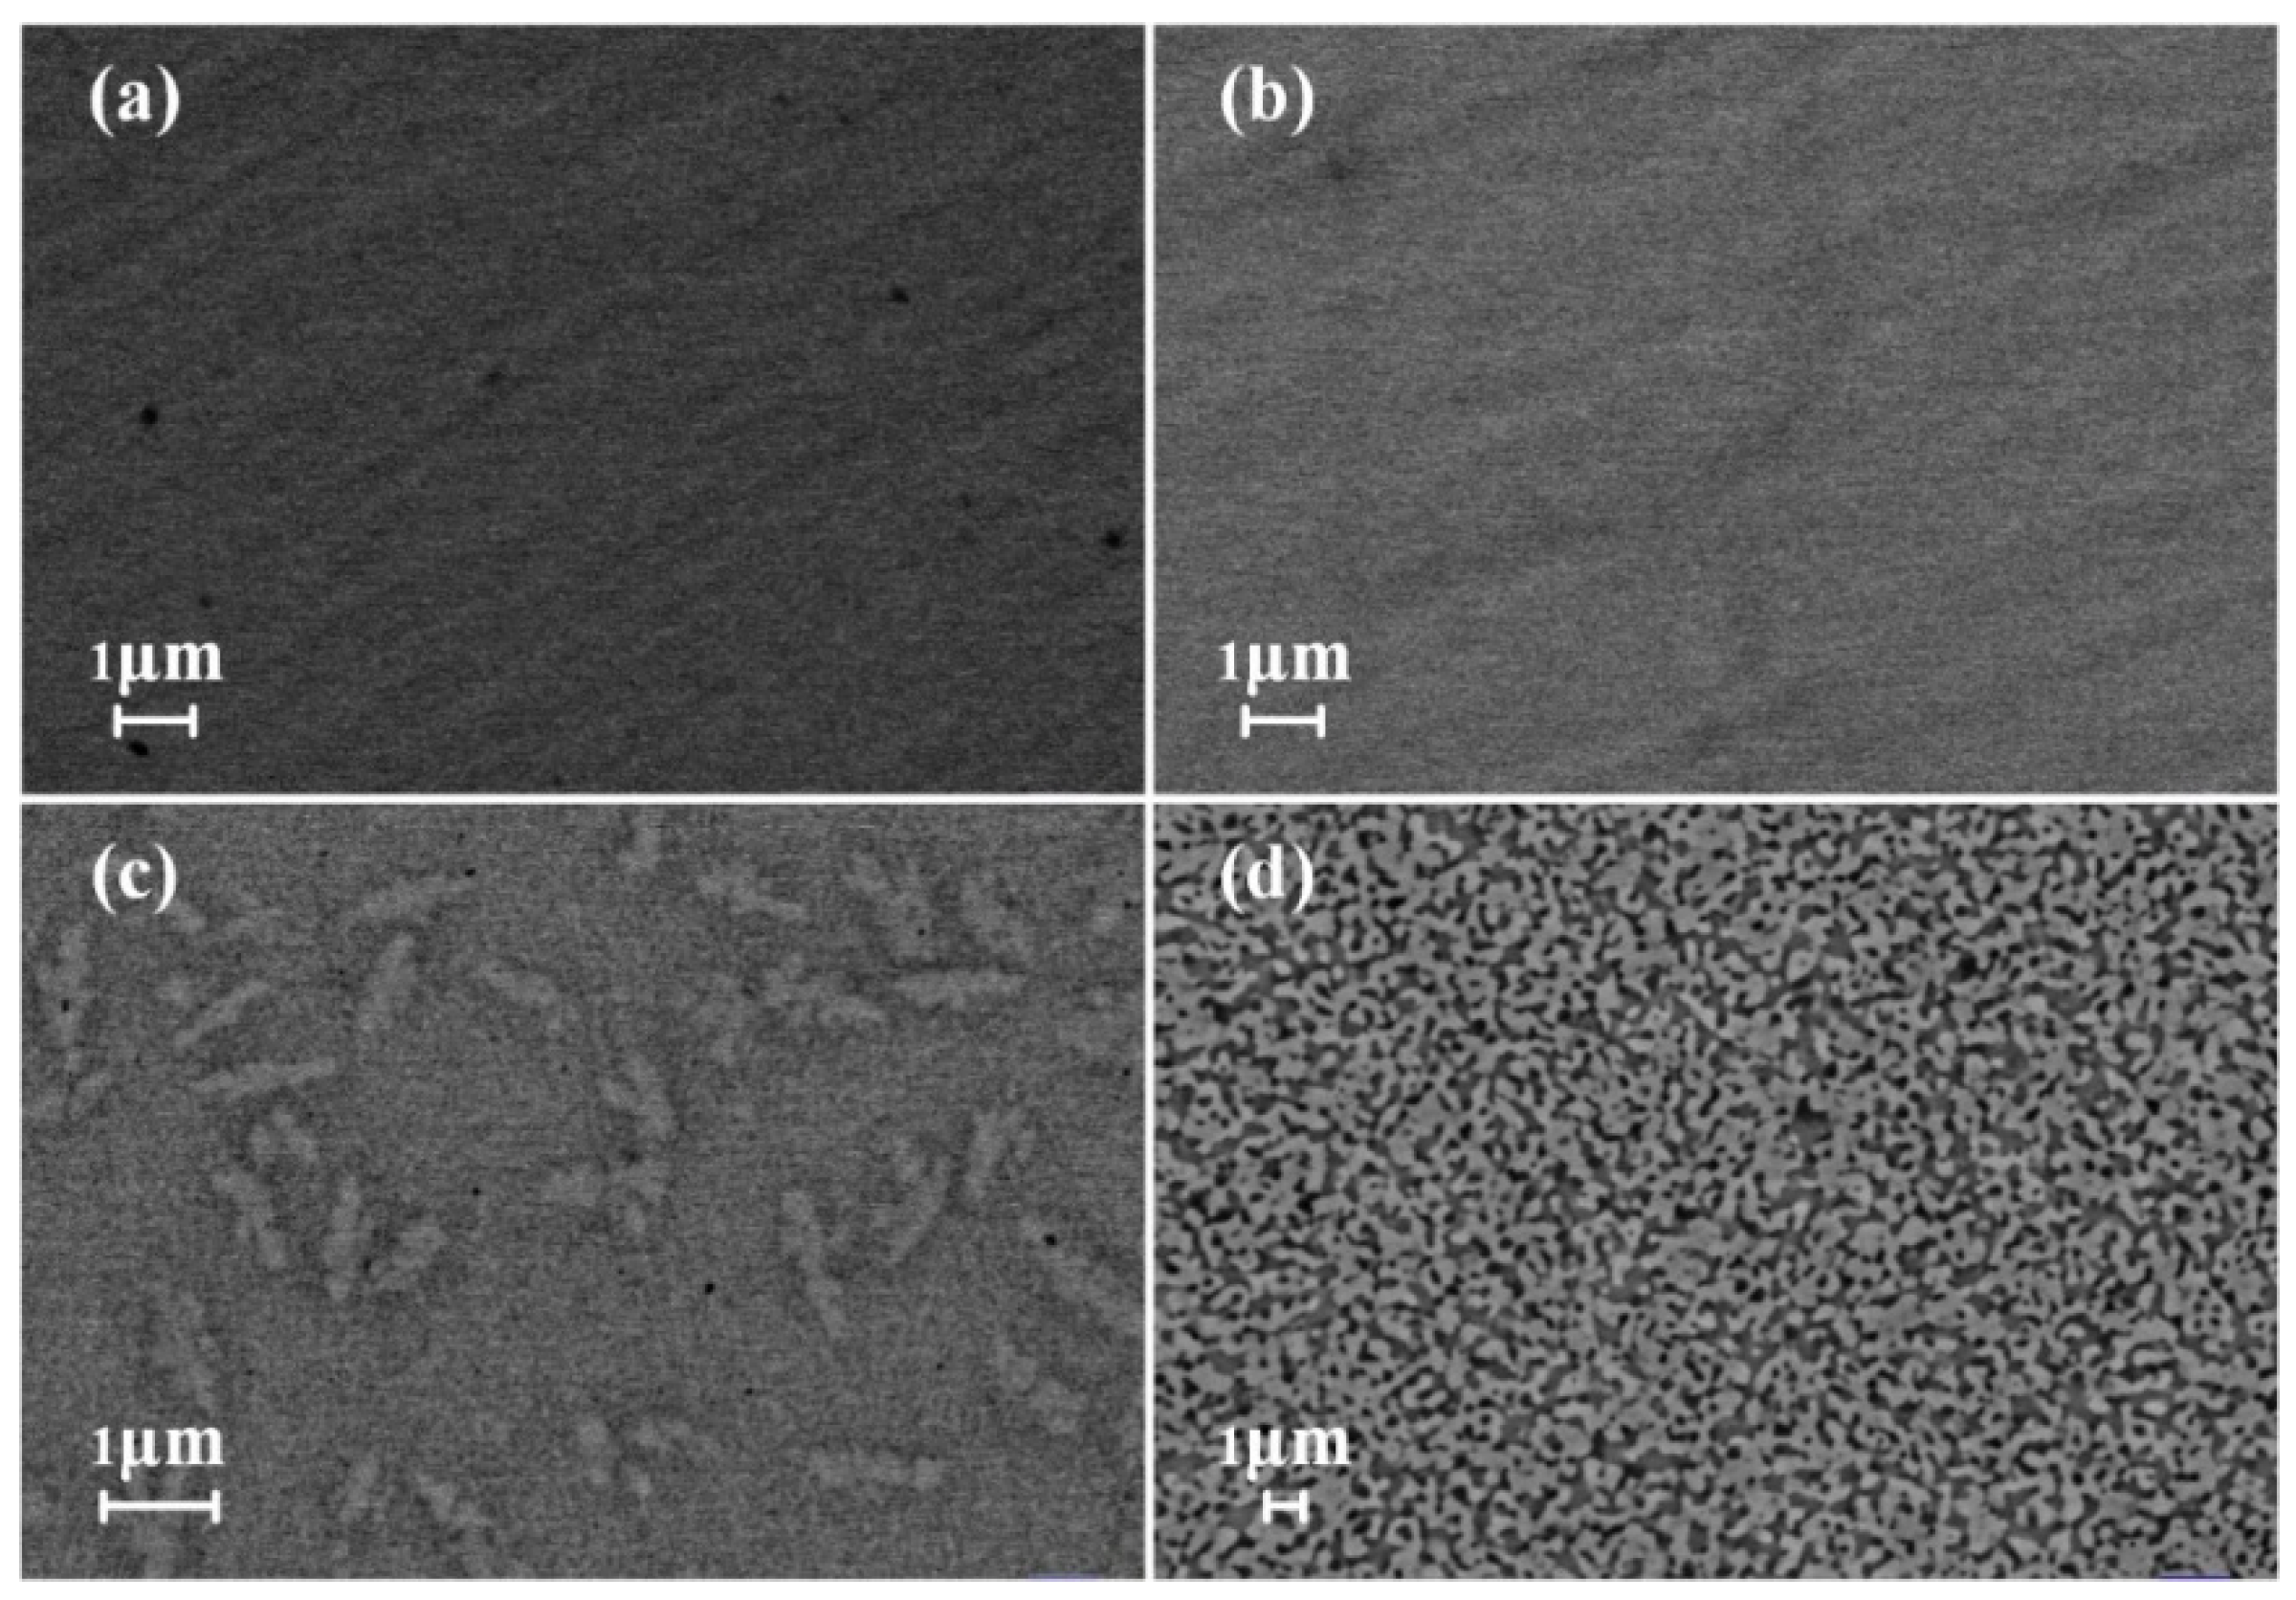
After annealing at 690 K and 697 K for 8 h, no obvious crystalline phases could be found in the matrix (Figure 5a,b). Some phases were observed in the sample after treating at 755 K for 8 h which is consistent with the broad peaks in XRD patterns (Figure 5c). When the temperature rose to 975 K, the glassy sample finally transformed into crystalline phases (Figure 5d). During the slower phase transformation process, the number of grain boundaries increased dramatically. The bright-field TEM images, together with the selected area electron diffraction patterns for this sample, are shown in Figure 6a. The selected area electron diffraction pattern (SADP) was taken from a region with a diameter of 200 nm. The outer-diffraction rings indicate that many crystalline phases emerge in the matrix. Some particles ranging from 8 to 20 nm in diameter were also observed and identified as NiZr2 (Figure 6b). The sample after annealing at 690 K has an almost unanimous XRD pattern. We deduce, therefore, that many small particles formed in the glassy matrix when annealing at 690 K and 697 K, but were too small to detect with SEM. By comparing the results of these three temperatures from both XRD and SEM, we posit that the phase growth rate is relatively slow. Figure 5d displays the phase morphology of this alloy after annealing at 975 K for 5 h. The glassy matrix has completely transformed into the net-like crystalline phases, which is further confirmed by TEM analysis. Particles of size larger than 200 nm were found (Figure 6c,d). SADP gives a series of spots corresponding to the CuZr2, which coincide with the XRD result (Figure 4).

4. Discussion

Due to structural disorder, the electrical resistivity of MGs is always one or two orders of magnitude higher than that of the corresponding crystalline alloys [15]. Variation of electrical resistivity during crystallization is governed by the residual glass matrix, crystalline nuclei formation, and their growth. Particularly, the appearance of grain changes, the disordered arrangement of atoms, and the band structure of metallic glasses which lead to a sharp decline of resistivity [4,5,6].
The resistivity of the Zr76Ni24 alloy decreased drastically after annealing the samples slightly above crystallization temperature [9]. A similar phenomenon was observed in the Pd–Cu–Ni–P metallic glasses with resistivity decreasing rapidly at the onset of crystallization temperature [10]. A relationship between the free volume and electrical resistivity was revealed. While crystallization always occurs with the decline of the free volume [16], the annihilation of the free volume would lead to increases of resistivity in glass state. The Zr52.5Cu17.9Ni14.6Al10Ti5 MG, however, exhibits a continuous variation in the initial stage of crystallization under both isochronal and isothermal measurement. Bai and coworkers have pointed out that the partially crystallized Zr48Nb8Cu12Fe8Be24 MG still had a negative temperature coefficient of resistivity when the ratio of crystalline phases was small [17]. After annealing at 690 K and 697 K for 8 h, no obvious crystalline phases could be found in the matrix (Figure 5a,b). Even when after treating at 755 K for 8 h, some phases could be observed in the SEM image. XRD patterns only exhibit broad peaks after heat treated at 725 K for 2 h. These results imply that only a few precipitated phases formed in the first step. The smaller ratio of crystalline phases may have less effect on the electrical resistivity.
Yang et al. [13] have investigated crystallization behavior of this amorphous alloy by using in-situ synchrotron diffraction. They argue that the first peak relates to the precipitation of a quasicrystalline phase. In situ SANS experiments and TEM studies also confirmed the precipitation of nanometer sized quasicrystalline phase after isothermal annealing at 673 K for 200 min in this alloy [18]. Quasicrystalline phase as the first precipitation phase was further discovered in other Zr-Cu-Ni-Al-Ti glass forming systems [19]. It is well established that both the glassy state and quasicrystalline state lack the long-range periodic translational order. The formation of icosahedral structure is favored over that of competing crystalline phases in the supercooled liquid region of the multicomponent metallic glass. This is due to the requirement of less atomic reconstruction. Electrical resistivity, as well as heat capacity measurements, have indicated that the electronic structure of the quasicrystalline state was quite similar to glassy state, but quite different from crystalline state [20]. Compared to crystalline phases, therefore, the nucleation barrier of quasicrystalline phase is relatively small.
Previous work suggests that the icosahedral short-range orders in the melt alloys could be preserved during solidification and ultimately determine the structure of amorphous state [21,22]. Icosahedral short-range orders in the glass matrix can easily overcome crystallization resistance and transform into the quasicrystalline phase continuously under heat treatment. The conductivity of glassy phase and I-phase can be explained by the same mechanism, the weak localization of conduction electron [23], which implies the electron transport property of the two phases is quite similar. The formation of several quasicrystalline phases, with similar electronic structure to the glassy matrix, result in a continuous variation of electrical resistivity when reaching Tx1.
The metastable quasicrystalline phase transforms into crystalline phases of greater stability at higher temperatures, or when annealing is protracted. The appearance of crystalline phases changes disorder arrangement of atoms, as well as the band structure, leading to the sharp decline of resistivity as shown in Figure 2 and Figure 3. The transformation process, however, is very slow. This is best illustrated by only occasional broad diffraction peaks being observed in the XRD pattern (Figure 4). No crystalline phases after annealing at 690 K and 697 K for 8h could be found in the matrix in SEM images (Figure 5a,b). Even after treating the sample at 755 K for 8 h, a few phases were observed in the matrix (Figure 5c). When the temperature rose to 840 K, phases changed from NiZr2 and ZrCu to NiZr2, ZrCu, and CuZr2. The final phases are CuZr2, NiZr2, and some unknown phases. During the slower phase transformation process, the number of grain boundaries increased dramatically, enhancing the scattering of electrons and resulting in increased resistivity (Figure 5 and Figure 6). A similar phenomenon was observed in the Cu64Zr36 MG [24]. This result suggests that a combination of DSC and electrical resistivity measurement can more accurately reflect the crystallization behavior of MGs. The electrical resistivity measurement is a more intuitive approach to investigate structure evolution of MGs since only exothermic peaks can be observed in DSC traces, while the formation of icosahedral phases and different crystallization kinetics may lead to different variations of electrical resistivity in different glass-forming systems [4,11].

5. Conclusions

Electrical resistivity of the Zr52.5Cu17.9Ni14.6Al10Ti5 metallic glass during crystallization was investigated using the four-probe technique. Contrary to the sharp decline of electrical sensitivity at crystallization temperature onset usually observed in MGs, this amorphous alloy exhibits a continuous variation instead of a sharp decline when reaching Tx1. This unique variation was found to be related to the formation of several quasicrystalline phases. The electronic structure of quasicrystalline phase is quite similar to that of the glassy matrix. The icosahedral short-range orders existed in the glass matrix can easily overcome crystallization resistance and transform into the quasicrystalline phase continuously under heating treatment. This amorphous alloy has slower phase transformation process which causes numerous grain boundaries. This further results in the enhancement of electron scattering and consequently, increases of resistivity during isothermal annealing.

Supplementary Materials

The following are available online at https://www.mdpi.com/2075-4701/9/12/1298/s1. Figure S1: The normalized electrical resistivity (ρT323 K) and DSC traces of the Zr52.5Cu17.9Ni14.6Al10Ti5 ribbons with a heating rate of 5 K/min.

Author Contributions

X.Z. and B.L. conceived, designed and performed the experiments; G.H. and Y.Z. contributed to the DSC analysis; X.J. contributed to the SEM work; Y.Q. contributed to FIB and TEM work; X.Z. and B.L. wrote the manuscript; F.Y. and B.L. supervised the work.

Funding

This research was funded by the National Natural Science Foundation of China, grant number 51401015.

Acknowledgments

The authors thank Li You for the assistance in TEM analysis.

Conflicts of Interest

The authors declare no conflict of interest.

References

  1. Zhuang, Y.X.; Duan, T.F.; Shi, H.Y. Calorimetric study of non-isothermal crystallization kinetics of Zr60Cu20Al10Ni10 bulk metallic glass. J. Alloys Compd. 2011, 509, 9019–9025. [Google Scholar] [CrossRef]
  2. Hu, L.; Ye, F. Crystallization kinetics of Ca65Mg15Zn20 bulk metallic glass. J. Alloys Compd. 2013, 557, 160–165. [Google Scholar] [CrossRef]
  3. Saida, J.; Matsushita, M.; Inoue, A. Transformation kenetics of nanoicosahedral phase from a supercooled liquid region in Zr70Pd30 binary glassy alloy. J. Appl. Phys. 2000, 88, 6081–6083. [Google Scholar] [CrossRef]
  4. Haruyama, O.; Miyazawa, T.; Saida, J.; Inoue, A. Change in electrical resistivity due to icosahedral phase precipitation in Zr70Pd20Ni10 and Zr65Al7.5Cu7.5Ni10Ag10 glasses. Appl. Phys. Lett. 2001, 79, 758–760. [Google Scholar] [CrossRef]
  5. Chung, S.J.; Hong, K.T.; Ok, M.R.; Yoon, J.K.; Kim, G.H.; Ji, Y.S.; Seong, B.S.; Lee, K.S. Analysis of the crystallization of Zr41Ti14Cu12.5Ni10Be22.5 bulk metallic glass using electrical resistivity measurement. Scrip. Mater. 2005, 53, 223–228. [Google Scholar]
  6. Young, S.J.; Chung, S.J.; Ok, M.R.; Hong, K.T.; Suh, J.Y.; Byeon, J.W.; Yoon, J.K.; Lee, K.H.; Lee, K.S. Analysis on the phase transition behavior of Cu base bulk metallic glass by electrical resistivity measurement. Mater. Sci. Eng. A 2007, 449, 521–525. [Google Scholar]
  7. Kim, Y.C.; Park, J.M.; Lee, J.K.; Bae, D.H.; Kim, W.T.; Kim, D.H. Amorphous and icosahedral phases in Ti–Zr–Cu–Ni–Be alloys. Mater. Sci. Eng. A 2004, 375, 749–753. [Google Scholar] [CrossRef]
  8. Kailath, A.J.; Dutta, K.; Alex, T.C.; Mitra, A. Crystallization study of Cu56Zr7Ti37 metallic glass by electrical resistivity measurement. J. Mater. Sci. Technol. 2011, 27, 275–279. [Google Scholar] [CrossRef]
  9. Kokanovice, I. Effect of disorder on the electrical resistivity in the partially crystalline Zr76Ni24 metallic glasses. J. Alloys Comp. 2006, 421, 12–18. [Google Scholar] [CrossRef]
  10. Haruyama, O.; Tando, M.; Nishiyama, N.; Kimura, H.M.; Inoue, A.; Arai, J. Electrical resistivity and Mössbauer studies for the structural relaxation process in Pd–Cu–Ni–P glasses. Mater. Trans. 2002, 43, 1931–1936. [Google Scholar] [CrossRef]
  11. Liu, B.B.; Zuo, N.N.; Ye, F. Abnormal change of electrical resistivity in the Cu46Zr46Al8 bulk metallic glass during crystallization. Mater. Lett. 2016, 171, 285–288. [Google Scholar] [CrossRef]
  12. Busch, R.; Schneider, S.; Peker, A.; Johnson, W.L. Decomposition and primary crystallization in undercooled Zr41.2Ti13.8Cu12.5Ni10.0Be22.5 melts. Appl. Phys. Lett. 1995, 67, 1544–1546. [Google Scholar] [CrossRef]
  13. Yang, L.; Wang, X.L.; Porter, W.D.; Lu, Z.P.; Stoica, A.D.; Payzart, E.A.; Almer, J.; Shi, D.L. Consecutive nucleation events during divetrification of Zr52.5Cu17.9Ni14.6Al10Ti5 bulk metallic glass. Adv. Eng. Mater. 2008, 10, 1043–1047. [Google Scholar] [CrossRef]
  14. Xing, L.Q.; Eckert, J.; Löser, W.; Schultz, L. Effect of cooling rate on the precipitation of quasicrystals from the Zr-Cu-Al-Ni-Ti amorphous alloy. Appl. Phys. Lett. 1998, 73, 2110–2112. [Google Scholar] [CrossRef]
  15. Mizutani, U. Electronic structure of metallic glasses. Prog. Mater. Sci. 1983, 28, 97–228. [Google Scholar] [CrossRef]
  16. Haruyama, O.; Tando, M.; Kimura, H.M.; Nishiyama, N.; Inoue, A. Structural relaxation in Pd–Cu–Ni–P metallic glasses. Mater. Sci. Eng. A 2004, 375–377, 292–296. [Google Scholar] [CrossRef]
  17. Bai, H.Y.; Tong, C.Z.; Zheng, P. Electrical resistivity in Zr48Nb8Cu12Fe8Be24 glassy and crystallized alloys. J. Appl. Phys. 2004, 95, 1269–1273. [Google Scholar] [CrossRef]
  18. Pekarskaya, E.; Löffler, J.F.; Johnson, W.L. Microstructural studies of crystallization of a Zr-based bulk metallic glass. Acta Mater. 2003, 51, 4045–4057. [Google Scholar] [CrossRef]
  19. Xing, L.Q.; Eckert, J.; Löser, W.; Schultz, L. High-strength materials produced by precipitation of icosahedral quasicrystals in bulk Zr-Ti-Cu-Ni-Al amorphous alloys. Appl. Phys. Lett. 1999, 74, 664–666. [Google Scholar] [CrossRef]
  20. Liu, B.B.; Ye, F. Low temperature heat capacity and electrical resistivity of the Ti40Zr25Cu12Ni3Be20 glass forming alloy. Intermetallics 2016, 75, 31–35. [Google Scholar] [CrossRef]
  21. Kelton, K.F.; Kim, W.J.; Stroud, R.M. A stable Ti-based quasicrystal. Appl. Phys. Lett. 1997, 70, 3230–3232. [Google Scholar] [CrossRef]
  22. Sachdev, S.; Nelson, D.R. Theory of the Structure Factor of Metallic Glasses. Phys. Rev. Lett. 1984, 53, 1947–1950. [Google Scholar] [CrossRef]
  23. Pierce, F.S.; Poon, S.J.; Guo, Q. Electron localization in metallic quasicrystals. Science 1993, 261, 737–739. [Google Scholar] [CrossRef] [PubMed]
  24. Cui, X.; Zhang, Q.D.; Li, X.Y.; Zu, F.Q. On crystallization behavior and thermal stability of Cu64Zr36 metallic glass by controlling the melt temperature. J. Non Cryst. Solids 2016, 452, 336–341. [Google Scholar] [CrossRef]
Figure 1. X-ray diffraction (XRD) patterns of the Zr52.5Cu17.9Ni14.6Al10Ti5 alloys for the amorphous alloy, samples after isothermal annealing at 690 K for 0.5 and 1 h, respectively.
Metals 09 01298 g001
Figure 2. The normalized electrical resistivity (ρT/ρ323 K) and DSC traces of the Zr52.5Cu17.9Ni14.6Al10Ti5 MG with a heating rate of 10 K/min.
Metals 09 01298 g002
Figure 3. Normalized electrical resistivity (ρtt=0) as function of time for the Zr52.5Cu17.9Ni14.6Al10Ti5 MG under isothermal annealing. (a) 690 and 697 K for 35,000 s; (b) 725 and 755 K for 25,000 s.
Metals 09 01298 g003
Figure 4. XRD patterns of the Zr52.5Cu17.9Ni14.6Al10Ti5 MG after isothermal annealing. (a) 755 K for different times; (b) 675 K, 690 K, 725 K, 780 K, 840 K for 2 h and 975 K for 5 h.
Metals 09 01298 g004
Figure 5. SEM images of the Zr52.5Cu17.9Ni14.6Al10Ti5 MG after isothermal annealing at various temperature and time points. (a) 690 K for 8 h; (b) 697 K for 8 h; (c) 755 K for 8 h; (d) 975 K for 5 h.
Metals 09 01298 g005
Figure 6. The bright-field TEM images with the selected electron diffraction patterns inserted for Zr52.5Cu17.9Ni14.6Al10Ti5 MG after isothermal annealing. (a,b) 755 K for 8 h; (c,d) 975 K for 5 h.
Metals 09 01298 g006