Article

Effects of Mo Concentration on the Structural and Corrosion Properties of Cu–Alloy

1
Instituto de Investigación en Metalurgia y Materiales, Universidad Michoacana de San Nicolás de Hidalgo, Morelia 58030, Mexico
2
Departamento de Ingeniería Metalúrgica y Materiales, Universidad Técnica Federico Santa Maria, Valparaíso 2340000, Chile
*
Author to whom correspondence should be addressed.
Metals 2019, 9(12), 1307; https://doi.org/10.3390/met9121307
Submission received: 27 September 2019 / Revised: 4 November 2019 / Accepted: 5 November 2019 / Published: 4 December 2019

Abstract

:
Mechanical Alloying (MA) has the ability to extend the solubility limits of immiscible alloys in a solid state. In this work, a Cu-10 wt% Mo alloy was synthesized by mechanical alloying, using a high-energy mill type SPEX. The X-ray diffraction and Rietveld results show a crystallite size of 24 and 22 nm of Cu and Mo, respectively, with an occupation value of Mo inside the Cu structure of 27%, which was identificated by Energy Dispersive X-ray Spectroscopy and High-Resolution Transmission Electron Microscopy analysis. After that, the alloy was sinterized in an oven, heating the alloy to 1000 °C—close to the melting point of Cu (1085 °C). Electrochemical tests were carried out under a saline environment of synthetic seawater. The results show that the polarization curve of the alloy showed a pitting corrosion at about 134.83 mV, as well as a repasivation phenomenon (Erp = 241.47 mV) in the cathodic branch. Finally, three time constants were observed in the Nyquist diagrams: formation of a corrosion product film, load transfer, and diffusion, indicating that the corrosion properties in this alloy were improved compared with other Cu–alloys.

1. Introduction

Copper and copper alloys are widely used in engineering because they have excellent properties, good electrical and thermal conductivity, excellent resistance to corrosion, and they are easy to manufacture [1]. Many copper-based binary systems, such as Cu–Mo, appear to be immiscible in the solid and liquid state, and they do not form any compound or alloy using conventional methods [2]. A new method that can be used for the formation of this alloy, is Mechanical Alloying (MA), a simple and versatile method due to its ability to increase the free energy of the system and solid solubility at room temperature [3,4], through the high transfer of energy that occurs between the milling media and the powders to be alloyed [5].
Pure copper has good resistance to corrosion. On the other hand, molybdenum has been used as reinforcement, for example, in stainless steels to inhibit chloride pitting, Zn coatings electrodeposited on steel [6], and Zr nucleus of nuclear reactors [7]. Some authors have conducted studies about copper matrix compounds and their behavior against corrosion [8,9,10]. Copper-base alloys have been widely used in the maritime area, such as in condenser tubes, immersion equipment, and underwater robots [11,12,13]. For this kind of alloy, it is important to know the corrosion behavior as well as the speed at which the process occurs in order to determine their behavior in different saline environments [14].
In line with previous research [3,4,15], the corrosion behavior of the Cu-20 wt% Mo alloy, synthesized in MA, sintered and characterized by X-ray diffraction (XRD), scanning electron microscope (SEM) and transmission electron microscope (TEM) was studied.

2. Materials and Methods

2.1. Materials and Synthesis

The elemental powders: copper (99.9 wt% purity, particle size <75 μm) and molybdenum (99.9 wt% purity, particle size <150 μm), were mixed according to the composition Cu-20wt% Mo and placed in a 25 mL stainless steel vial, with 10 stainless steel balls: 5 of 8 mm and 5 of 12 mm in diameter, adding 1wt% of stearic acid as the controlling agent of the process. The MA was performed in a SPEX 8000 M mill (SPEX® SamplePrep, NJ, USA) under an argon atmosphere for 10 h of milling, with a ball/powder ratio of 15/1.

2.2. Sintered

Three specimens were formed in a uniaxial hydraulic press, Atlas Manual 15T (Specac, Orpington, UK), using a stainless steel matrix of 5 mm in diameter, with the application of a load of 3 t for 1 min and using polyvinyl alcohol as a lubricant; after that, the specimens were sintered in a tubular furnace ICM 1360, RHT-180-50-1H (AGNI Gmbh, Aachen, Germany), at a temperature of 900 °C for 1 h under argon atmosphere at 2 bar.

2.3. Characterization

X-ray diffraction (XRD) analysis was performed in a STOE STADI MP multipurpose diffractometer (Darmstadt, Germany), with a monochromatic radiation Cu Kα1 (λ = 1.54056 Å), which was coupled with a Johann Ge (111) monochromator and a detector pixels Dectris Mythen 1K. The diffraction patterns were measured in an angular range from 30° to 120° of 2θ. A refinement of the diffraction patterns was performed by the Rietveld method using the MAUD software. Morphological and chemical analysis was carried out using a field emission scanning electron microscope (FE–SEM) JEOL JSM-7600F (Tokyo, Japan) and by EDS analysis, respectively. The specimens were observed by high-resolution transmission electron microscopy (HRTEM) in an FEI Tecnai F20 microscopy (Hillsboro, OR, USA).

2.4. Corrosion

The electrochemical properties were evaluated using a computer-controlled ACM potentiostat (UK), in a conventional 3-electrode cell, using a saturated calomel electrode (SCE) as a reference electrode and a graphite bar as an auxiliary electrode, at room temperature and in 60 mL of saline solution. The samples were tested in an artificial seawater solution with a pH of 8. The chemical composition is given in Table 1, according to ASTM D1141-98 [16]. The electrochemical techniques used were: potentiodynamic polarization, linear polarization resistance (LPR) and electrochemical impedance spectroscopy (EIS). The corrosion rate was calculated in terms of the corrosion current using the linear polarization curve. The potentiodynamic polarization curve was obtained by varying the applied potential with respect to the open circuit potential (OCP) from −1000 mV to +1000 mV at a scanning speed of 1 mV/s, ASTM G3-89 [17]. A delay of 60 min was given to achieve a stable reading before performing the electrochemical study. The impedance test was realized using a signal with an amplitude of 20 mV vs. the OCP between a frequency interval of 0.05 Hz to 10 KHz obtaining a measurement at 30 min, 12 h and 24 h after immersion. The measurement of the LPR was obtained by polarizing the specimen from +15 mV to −15 mV vs. OCP at a scan rate of 1 mV/s every 15 min for 24 h.

3. Results

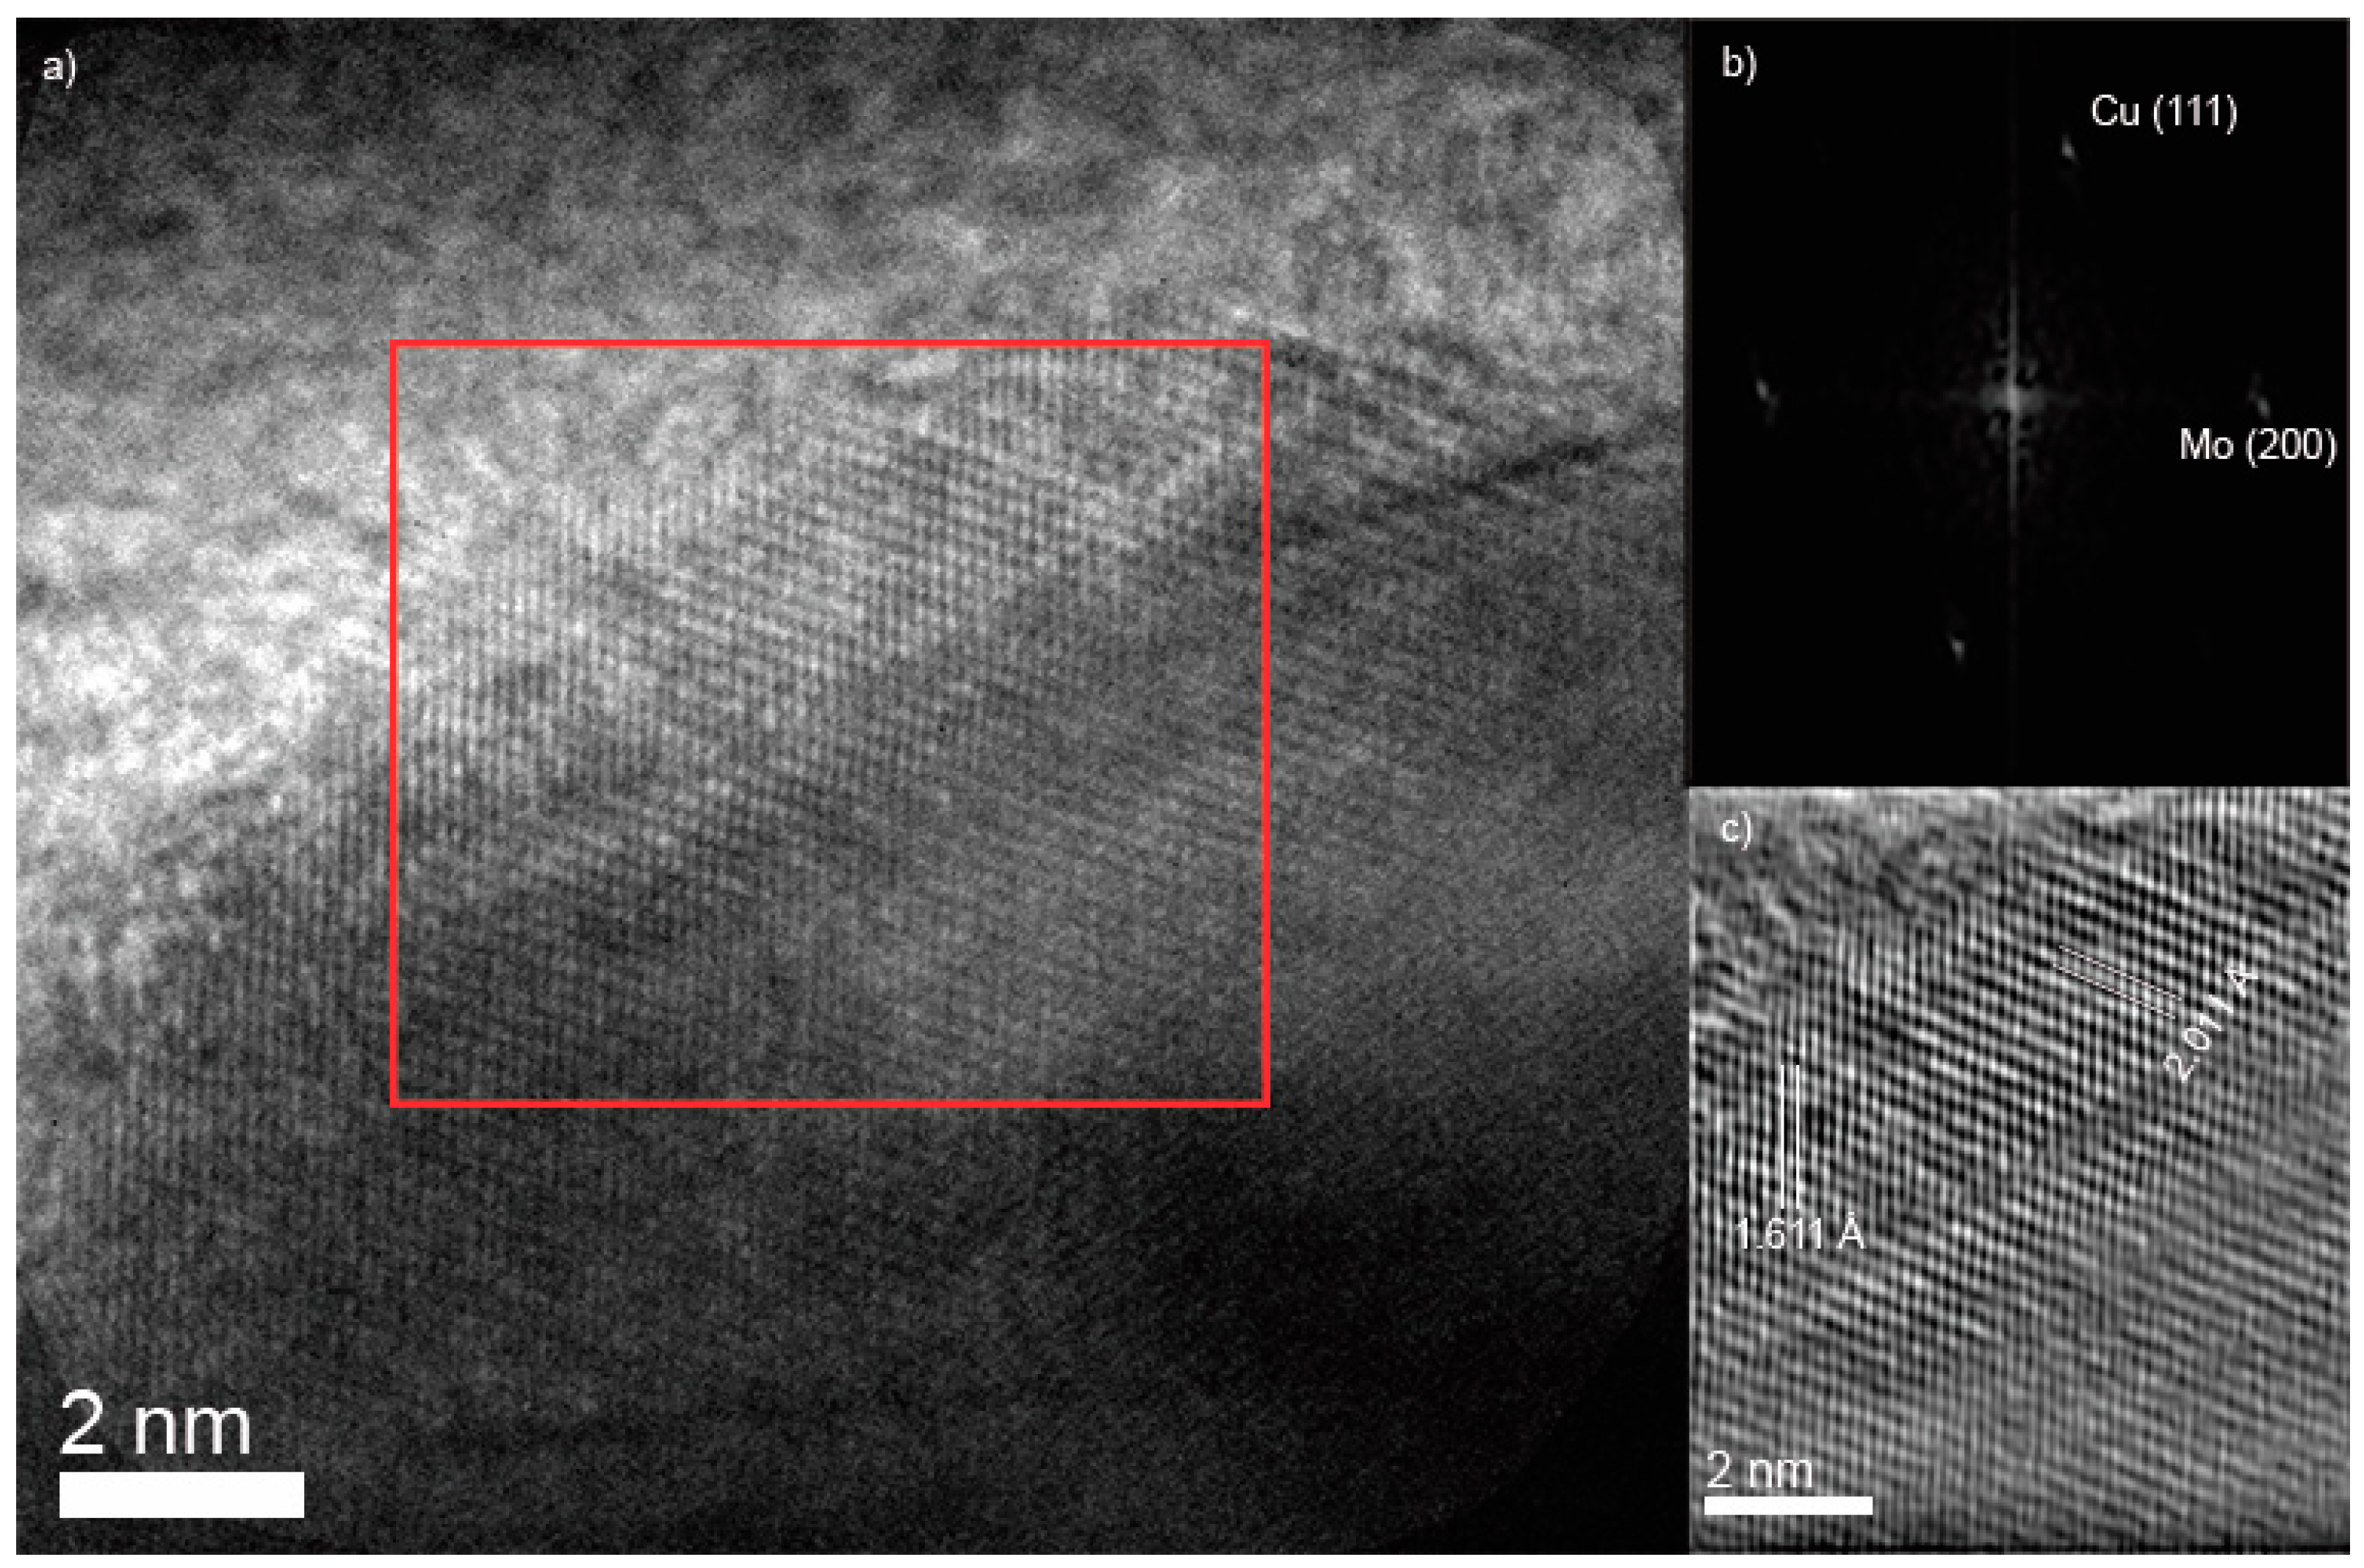
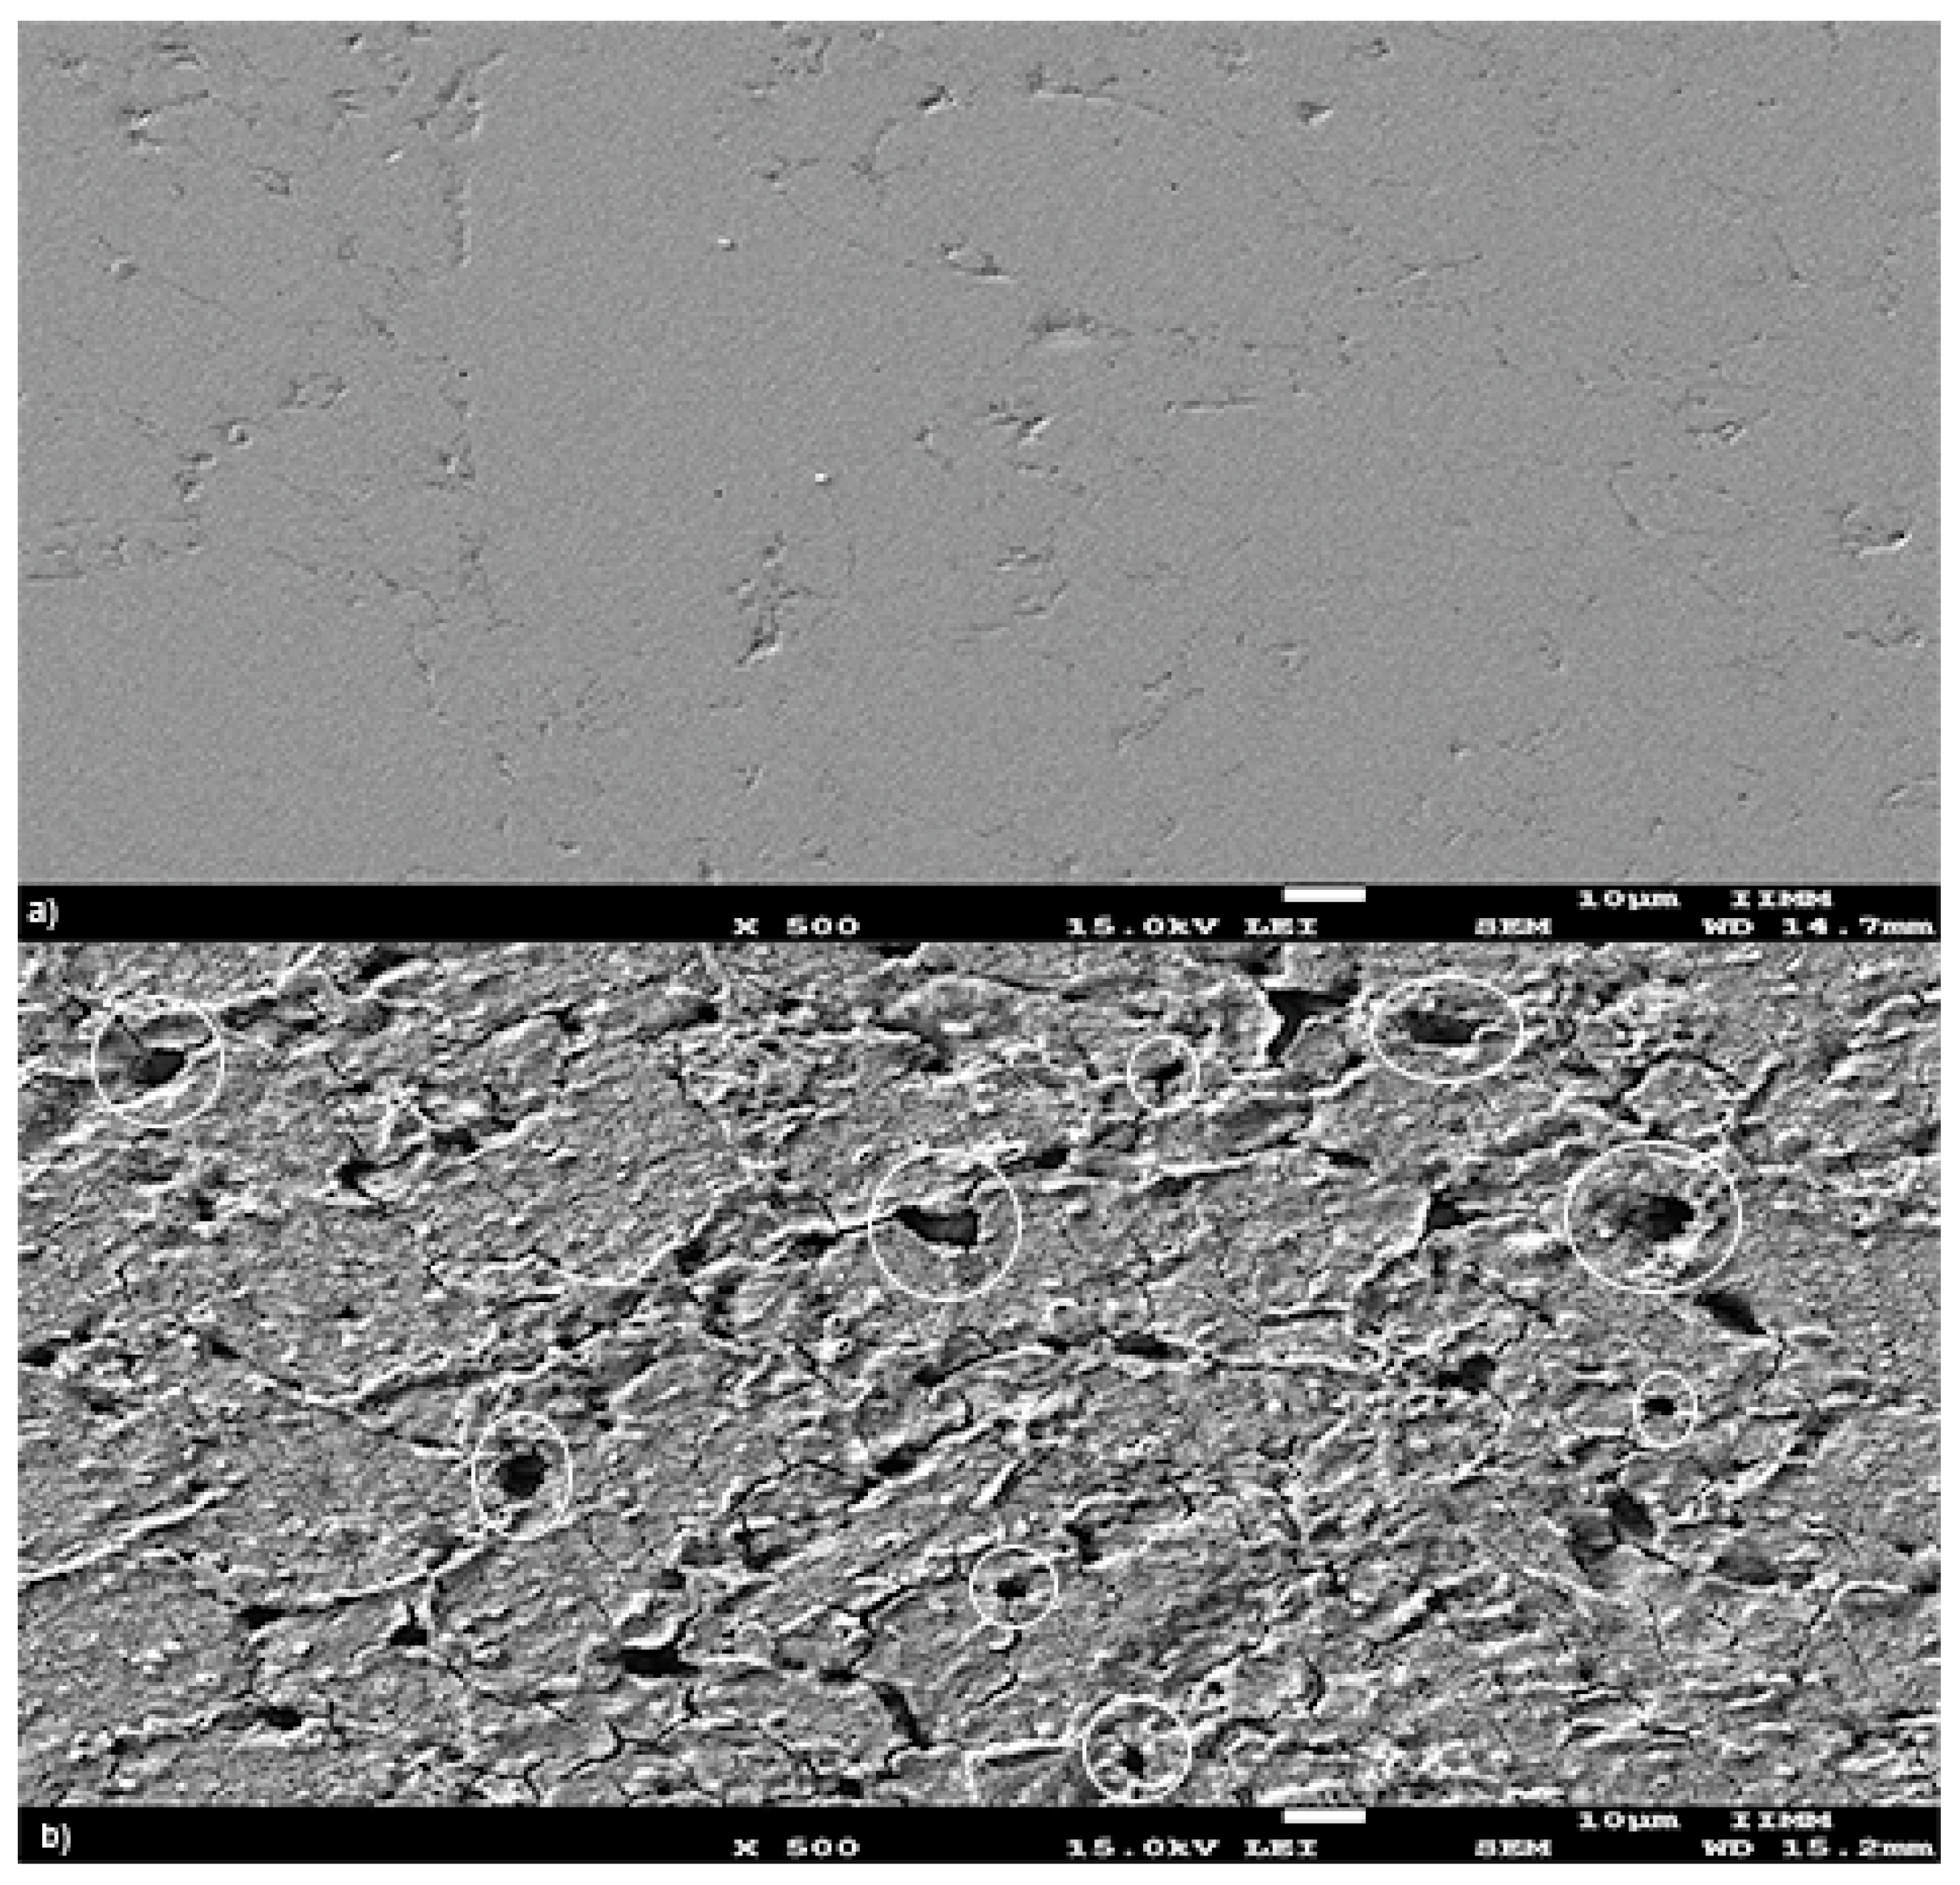
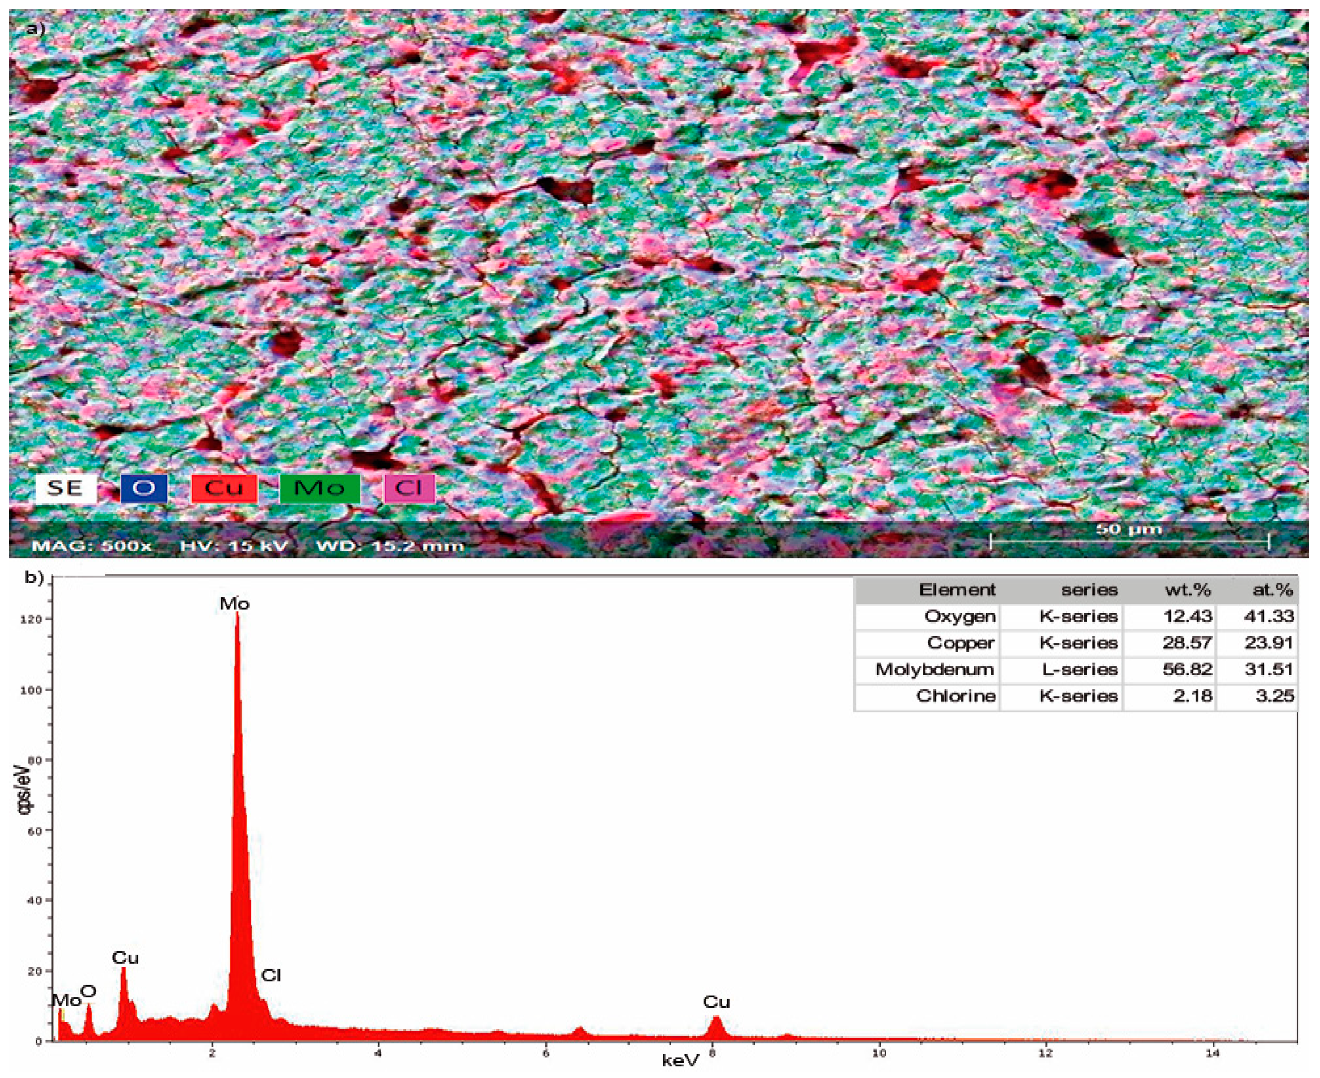
3.1. Characterization XRD, SEM, TEM

Figure 1a shows the diffraction patterns of the mixed elemental powders. The characteristic diffraction peaks of Cu (red) and Mo (blue) were identified by the cards 00-001-1241 and 00-001-1208, respectively, which adjust with the peaks observed in Figure 1b, which represents the diffraction pattern of the Cu-20 wt% Mo alloy. It is possible to observe that there is no presence of any oxide that could have been formed during the MA process. The figure shows a change in the intensity of the main peaks of Cu (111) and Mo (110), as well as a widening in the peaks adjacent to these. The intensity of the peaks of Cu and Mo decreases, and their width increases when they are subjected to the MA process. This tendency is due to the refinement of the size of the Cu and Mo crystals and the increase in the internal tension during the MA.
The parameter values of reliability, Chi2 and Rwp, obtained by MAUD software were 1.29 and 8.7, respectively, which shows a good fit. Crystallite size values of 24 and 22 nm, and microstrain values of 3.1 × 10⁻³ and 0.4 × 10⁻³ Å for Cu and Mo were obtained, respectively, and an occupancy of 27% of Mo in the Cu lattice was calculated.
The SEM analysis shows that the sample presents flake morphology with a size in the range 10–30 μm, due to the short time of MA (Figure 2a). EDS analysis indicates the chemical composition of the alloy which is Cu and Mo, and there is no presence of any other element (Figure 2d). This corroborates the XRD results, and the mapping shows a good distribution of the elements (Figure 2b,c).
The specimen was also characterized by HRTEM and Figure 3a is an image of the Cu-20 wt% Mo alloy, in which the well-defined atomic arrangements can be appreciated. In Figure 3b, it is possible to observe the fast Fourier transform (FFT), and Figure 3c corresponds to the inverse fast Fourier transform (IFFT) of the marked area in Figure 3a. The distances obtained were 2.011 Å for the plane (111) for the Cu, and 1.611 Å for the plane (200) of the phase Mo. In this image, it can also be seen how the Mo looks in the solution in the Cu matrix, meaning that through the MA a solid solution is obtained.

3.2. Density

The density of the pill (ρpill) was calculated using the Archimedes method, from the expression [18]:
ρ pill = m pill m H 2 O   ( evicted )   · ρ H 2 O
where mpill = pill mass, and mH2O(evicted) = mass of the dislodged water, which is the difference between the mass of the submerged pill and the mass of the surface-dried pill, and the water density (ρH2O). Table 2 shows the result of the measurement.
As shown in Table 2, the pills density was similar for the three sintered pills. In this work, we only present the results of sample 1.

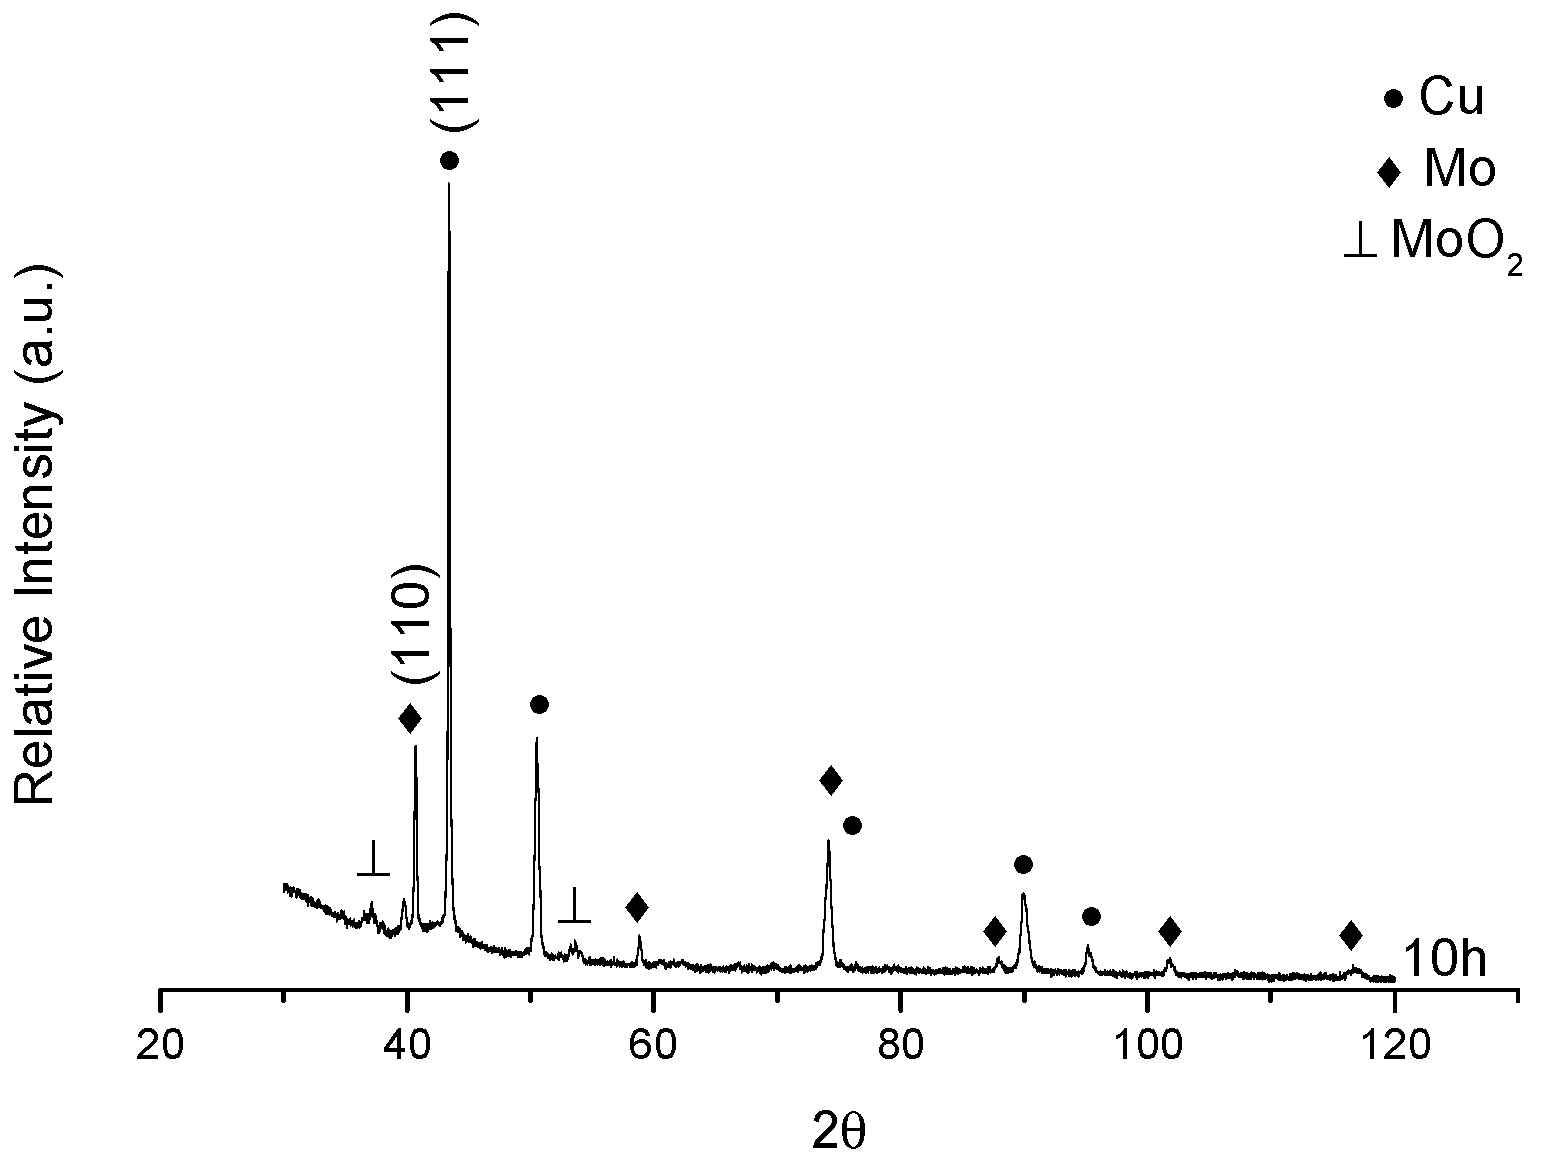
3.3. XRD after Sintering
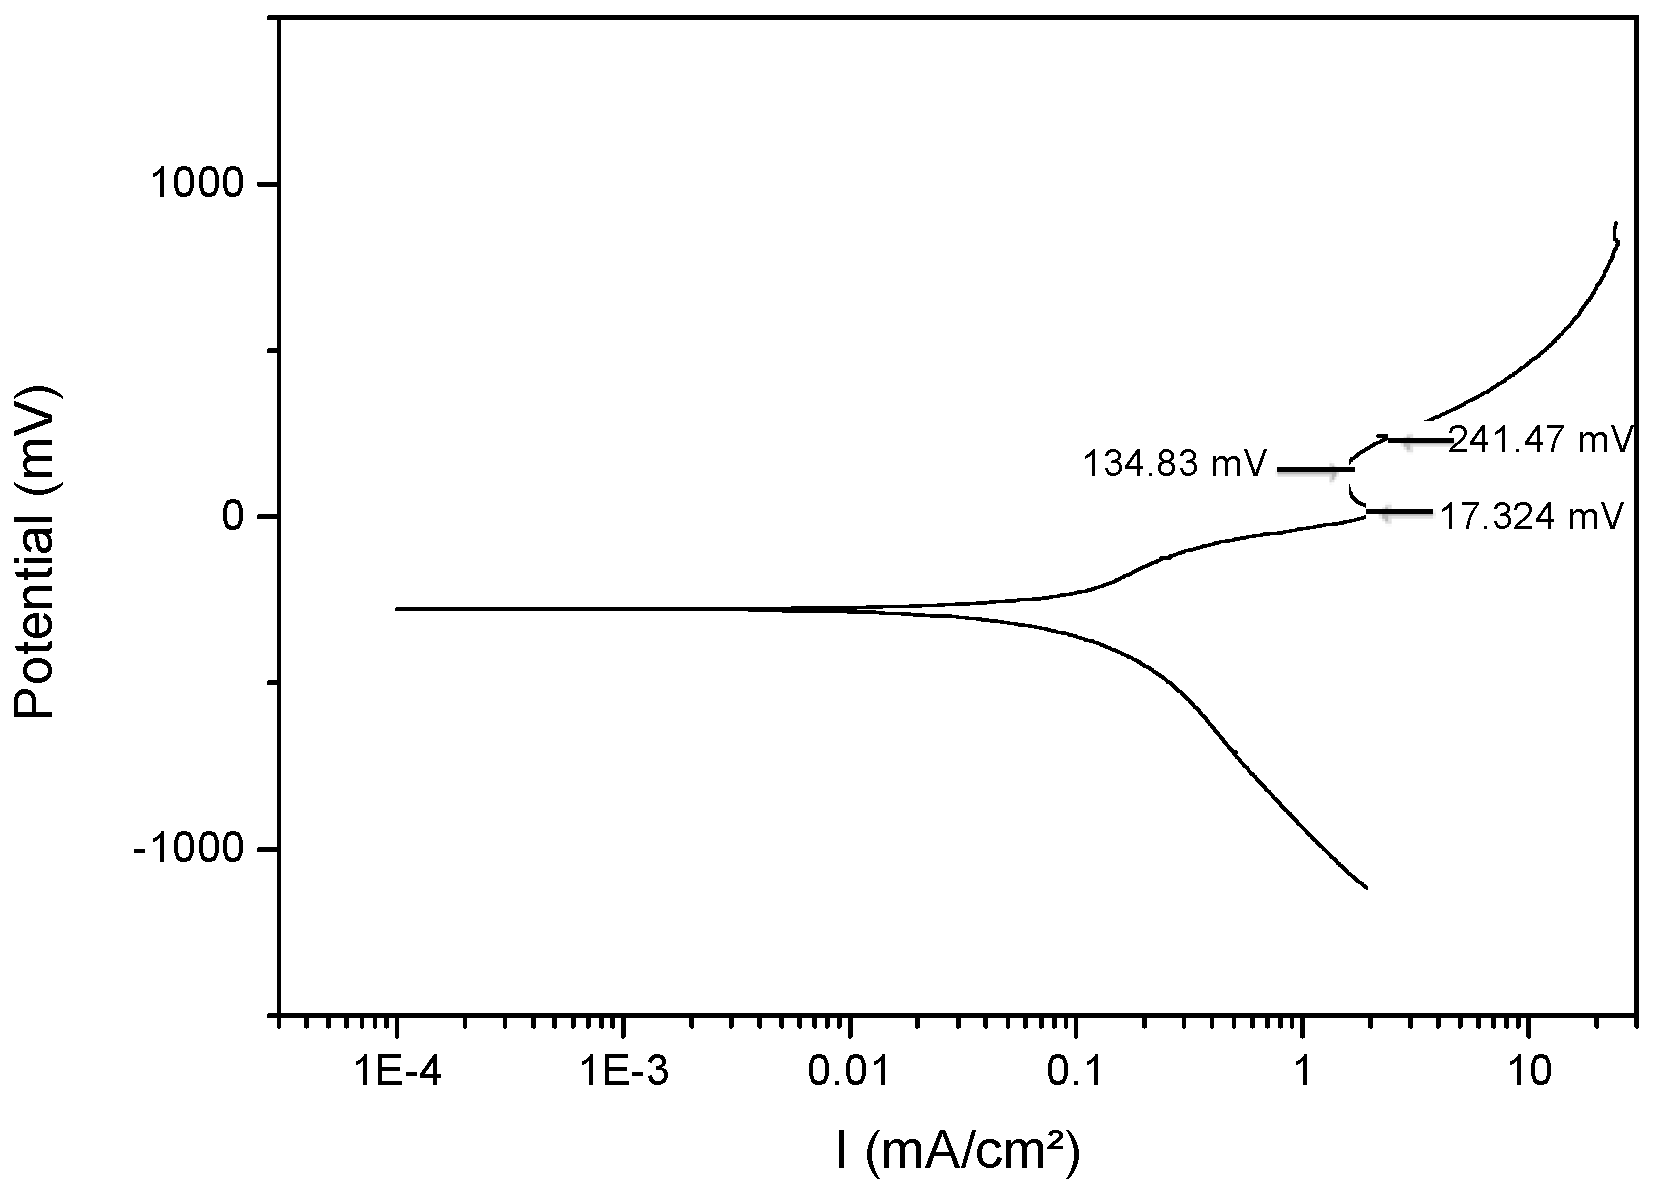
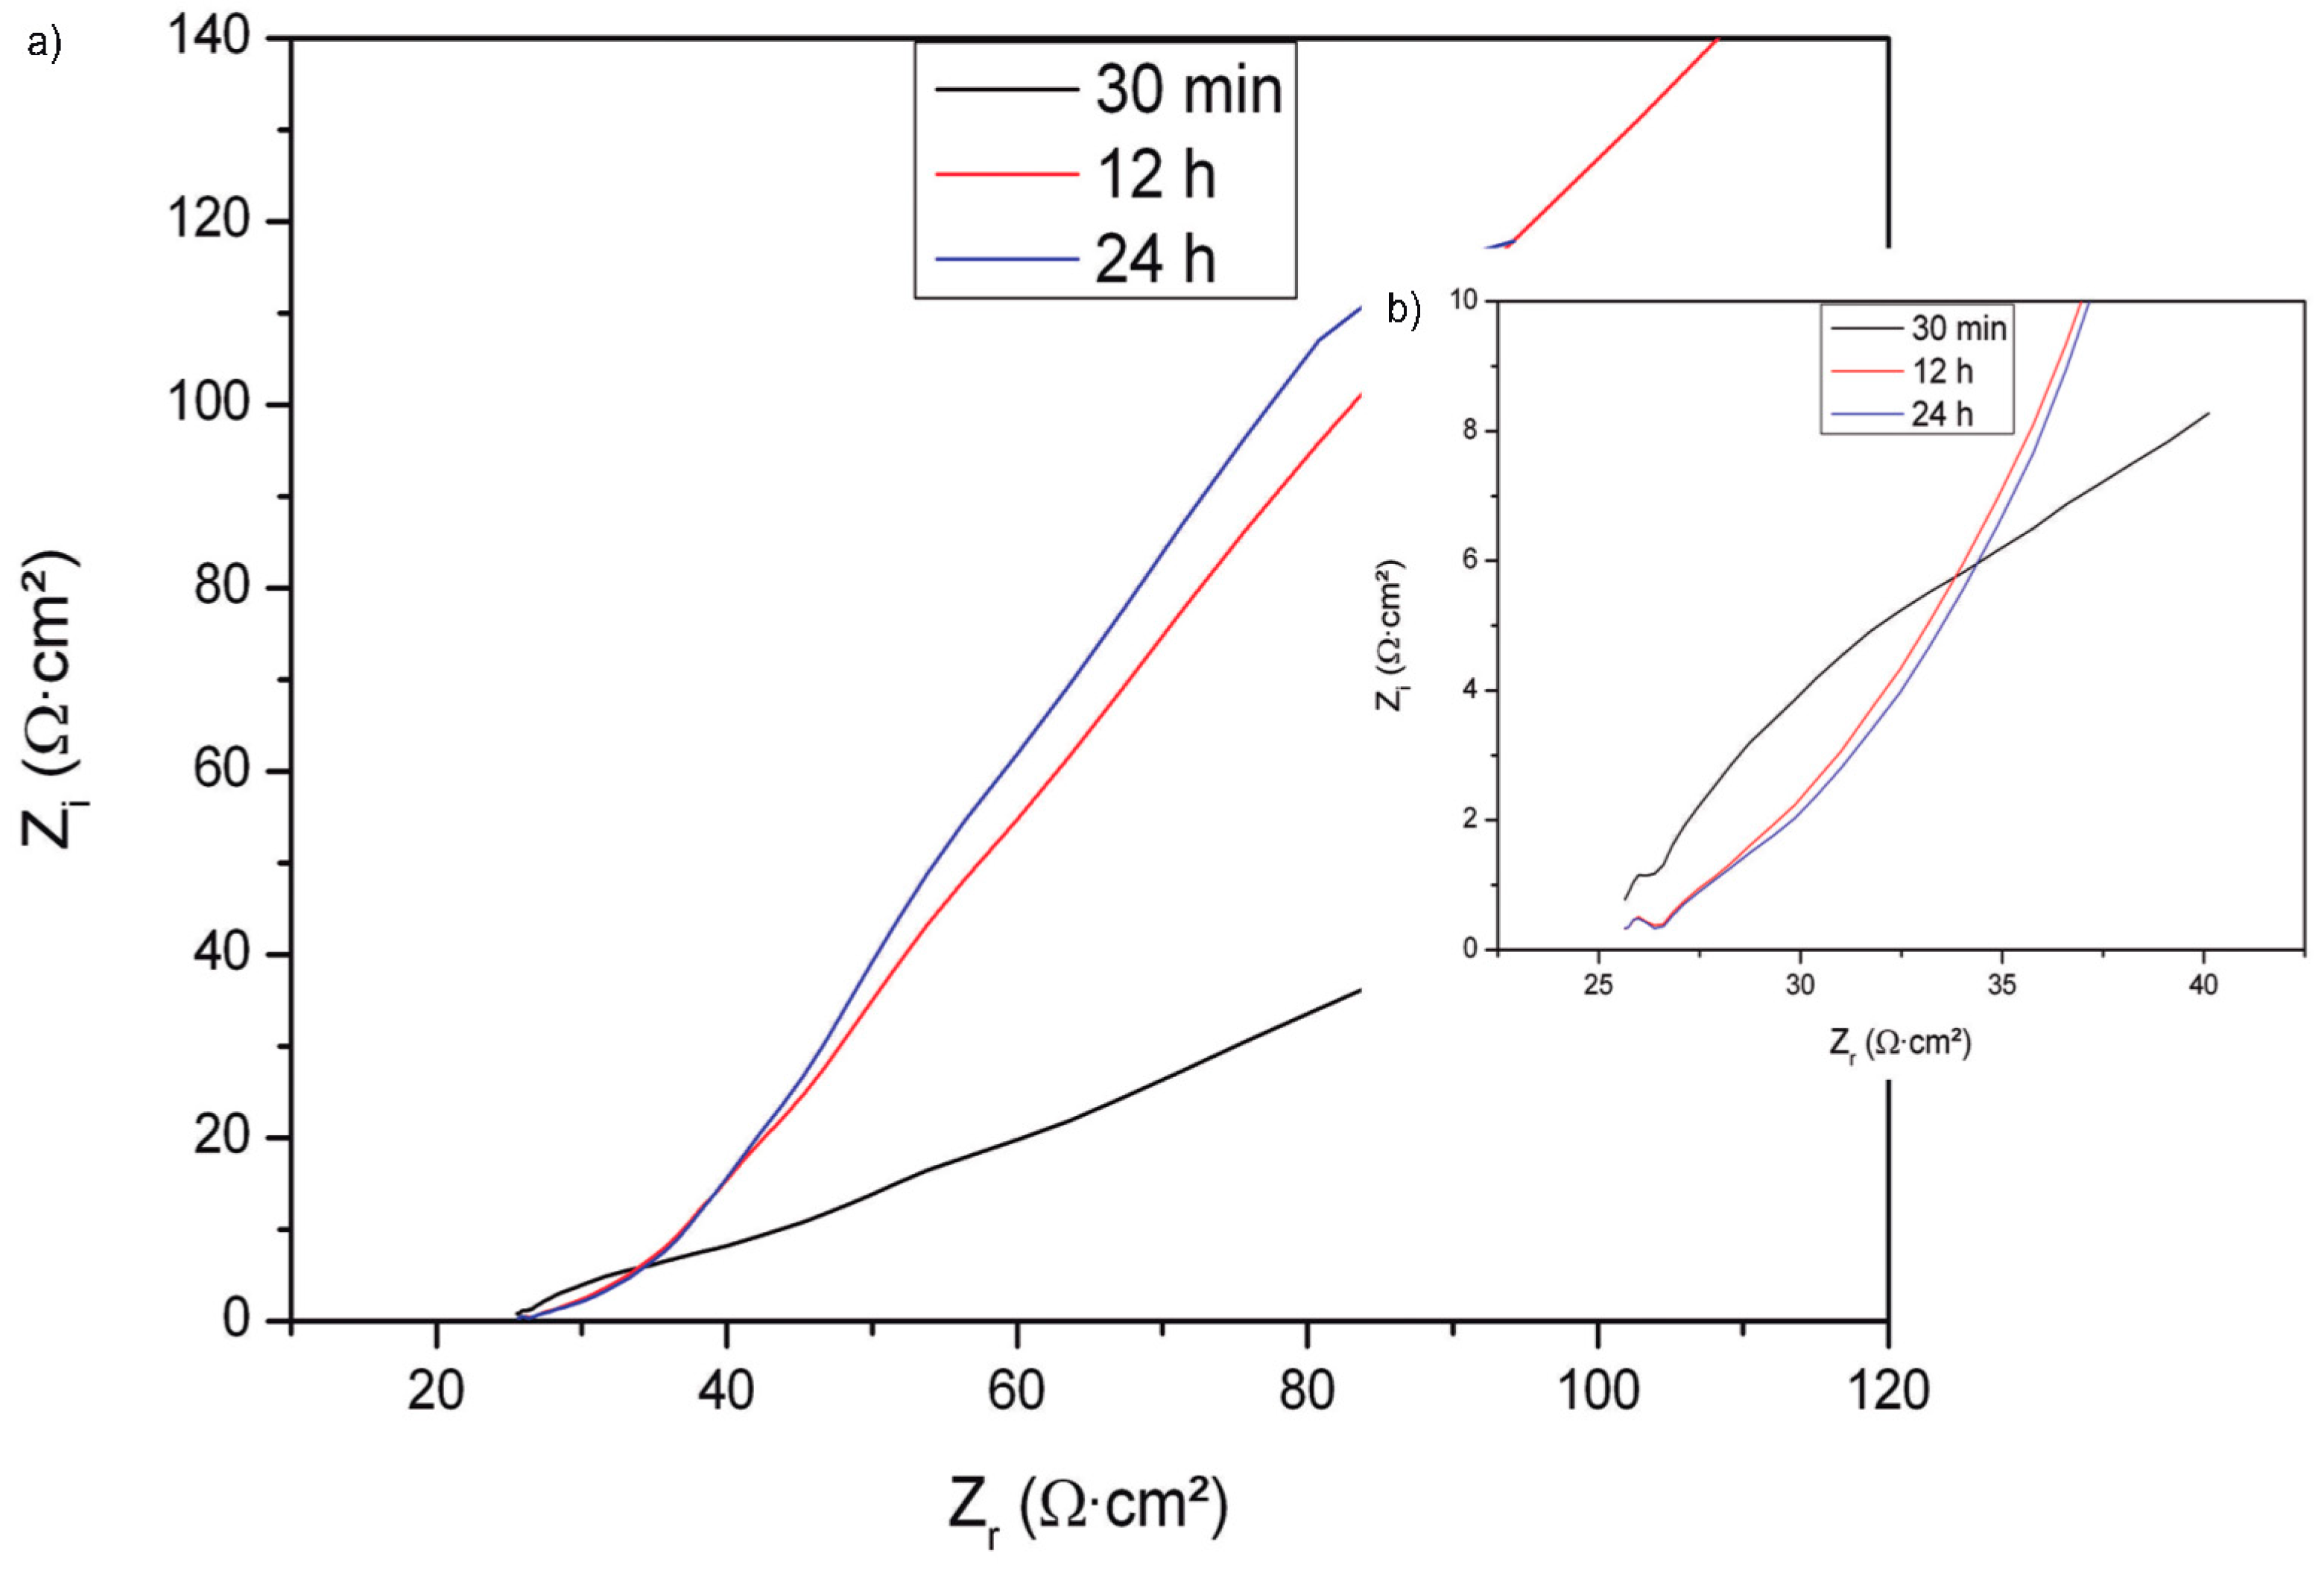
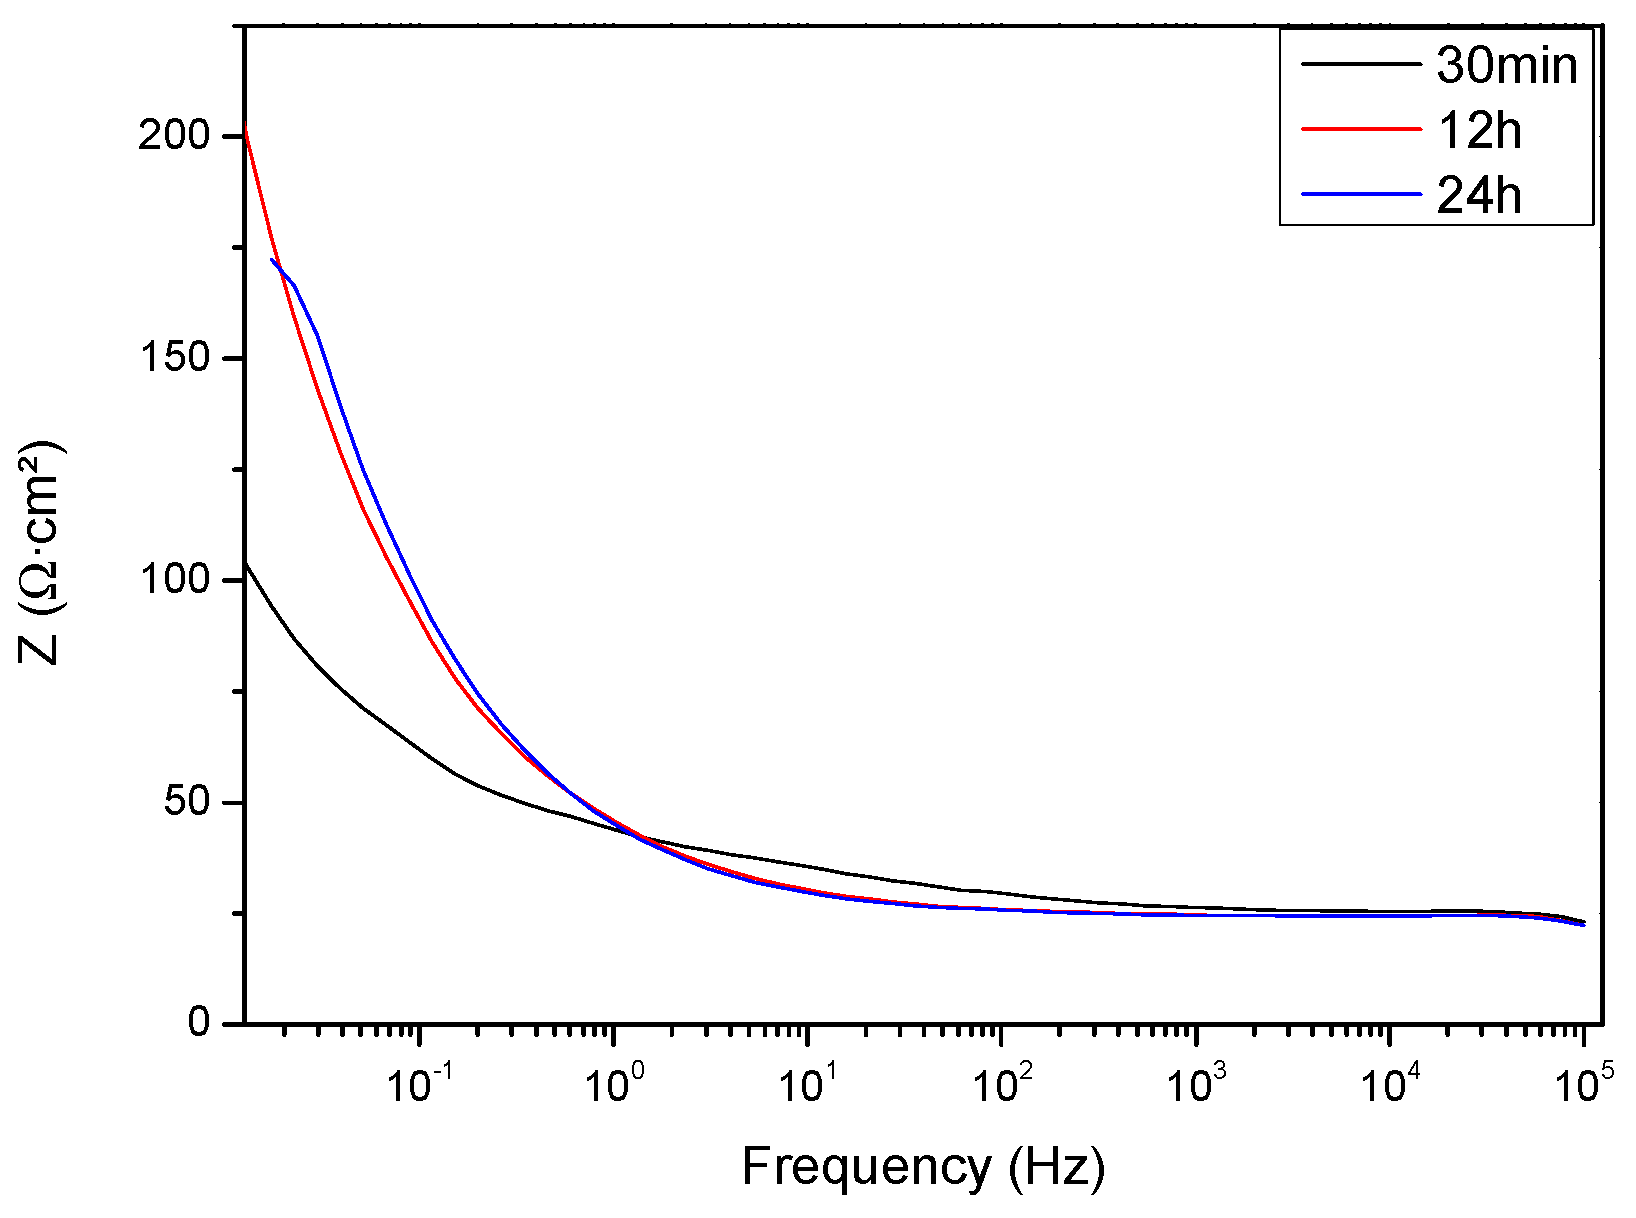
Figure 4 shows the diffraction pattern of the sintered specimen, in which the characteristic diffraction peaks of Cu and Mo were identified by cards 00-001-1241 and 00-001-1208 respectively. It is possible to observe the presence of two small peaks located at 37° and 53°, which were indexed as (MoO2 (101)), card 00-001-0615, which was not appreciable in the diffractograms of the Figure 1.

3.4. Corrosion

Figure 5 shows the polarization curve obtained after the corrosion test. It can be noted that in the cathodic branch a mixed process is observed, and in the anodic branch the increase in the Tafel slope is denoted, which indicates a passive behavior of Cu2O with a passivation potential, Ep = 17.325 mV, as well as an increase in the current density corresponding to the pitting potential, Epit = 134.83 mV. Some investigations expose the Cl ion as an agent for the propagation of pitting in Cu; others have shown that it reduces the severity of pitting in Cl ion containing systems. At the beginning, they presented pitting but this turned out to be most passive at the end of the period test; therefore, it is expressed that the layer of the oxide that is formed at the beginning is devastated by the attack and thus forms pitting. Once the pit has been formed, the material is again passivated, Erp = 241.47 mV. In the anodic branch, we observed a mixed behavior: aside from the charge transfer, there was the influence of the mass transfer that occurred after the diffusion of O2 through the layer that was formed from the corrosion products.
According to the literature, for the composition of film that is formed in copper or copper alloys subjected to electrochemical tests with a water electrolyte or saline solutions, Kruger discovered that a Cu2O film is formed when copper is exposed to water in an equilibrium state with an atmosphere containing oxygen, or mixtures of oxygen and helium containing 1%, 10%, or 20% oxygen. They also discovered that Cu2O is formed by a direct anodic reaction, and after 90–120 min a second layer of CuO is formed by precipitation. North and Pryor found Cu2O and Cu2(OH)3Cl formed in Cu, Cu-10Ni-1Fe-0.5Mn and Cu-30Ni-0.4Fe in boiling NaCl solution. In all these cases, the internal layer of Cu2O was formed by a direct anodic reaction and the upper layer of CuO or Cu2(OH)3Cl was formed by precipitation. Kato et al. studied the corrosion mechanism of the Cu-9.4Ni–1.7Fe alloy in a saturated NaCl solution, and found by XRD analysis that the corrosion product developed on the surface of the Cu–Ni alloy had Cu2O and Cu2(OH)3Cl. Therefore, in the case of the Cu-20 wt% Mo alloy, it would appear that the lower crystalline layer will be Cu2O and a mixture of CuO and Cu2(OH)3Cl in the form of the precipitates.
Table 3 presents the electrochemical parameters calculated from the polarization curve of Figure 5. The values of the Tafel slope presented in the table were calculated for the corrosion rate.
Finally, the corrosion rate was obtained according to following formula, in keeping with ASTM G102-89 [19].
V corr   =   0.00327 i corr · EW D   =   5.01   mm / years
As mentioned previously, there will be a pitting corrosion through the saline medium, which is shown by the polarization curve of Figure 5. Given that the inclusions, structural heterogeneities, and heterogeneities by the composition on the surface of the metal are usually the places where the hole can be started, they can also be originated through the concentration cells that are treated from the difference between the ion and oxygen [20,21]. Figure 6a shows an SEM image before the corrosion test, and in Figure 6b the pit formed after the electrochemical test is observed.
It is believed that the propagation of a hole brings about the dissolution of the metal in it, while maintaining a high degree of acidity in the bottom due to the reactions present in it. An anode reaction is generated in the lower part of the hole [22].
Cu → Cu2+ + 2e
Therefore, the cathodic reaction occurs on the metal surface surrounding the hole, and there is a reaction of oxygen with water and electrons are released from the anodic reaction [22].
O2 + 2H2O + 4e → 4OH
Consequently, the metal that delimits the pit is cathodically protected.
The large amount of metal ions that are concentrated in the hole attracts chloride ions to maintain a neutral charge; then, the metal chloride reacts with water to produce metal hydroxide and release acid.
Cu + Cl + H2O → CuOH + H+Cl
The production of a high acid concentration in the bottom of the pit, will cause the speed of the anodic reaction to increase and, therefore, the process is autocatalytic.
In the same way, products can be formed:
● Formation of Cu and a hydroxyl group by direct anodic reaction
Cu2O + H2O + 2e → 2Cu + 2OH,
● Formation of hydroxides and poorly soluble compounds
Cu2+ + 2OH → Cu(OH)2
2Cu2+ + 3OH + Cl → Cu2(OH)3Cl.
Figure 7a shows an image of the pill mapping where the distribution of the elements in the electrochemical reaction along the surface is notable. The elements in some points, with a higher concentration of copper than according to reaction (5), are the pit edges; in Figure 7b, the EDS of the area is presented, as well as quantification of the elements.
On the other hand, Figure 8, Figure 9 and Figure 10 show that the impedance spectra of the Cu-20 wt% Mo specimen are plotted against the time of exposure to the electrolyte at room temperature, atmospheric pressure, and in static conditions. Figure 8a corresponds to the electrochemical impedance spectra of the alloy in a Nyquist diagram, as a function of the exposure time of the metal sample, and Figure 8b is a close up of the initial behavior of the same.
In addition, a Warburg impedance can be observed in the Nyquist diagram (Figure 8b). This indicates that the mass transfer process is what determines the speed during the corrosion process. The Warburg impedance will be caused by the accumulation of corrosion products on the surface, which may also isolate the mass transfer of corrosive species to the metal surface [20]. The diagrams of Figure 8 show convex arcs and that as each diameter of the arcs increases, the impedance values increase and copper receives greater protection [22]. The shape of the copper impedance diagrams is similar to those found in the literature, for example, Khaled et al. 2008 and 2010 [23,24], in which a Warburg impedance character was also observed for the low frequency region of the Nyquist diagrams [25].
Figure 9 and Figure 10 show the alloy Bode plot, phase angle as a function of frequency (θ vs. f) and the impedance module as a function of frequency (|Z| vs. f), respectively. Figure 9 shows two-time constants in the range of the high and medium frequencies after 30 min of immersion, and according to the Nyquist diagram (Figure 8), the time constants represent two mechanisms: the activation process at low frequencies and a process produced by a film adsorbed at high frequencies. In the case of high frequencies, it can be attributed to the process of forming a film of corrosion products on the metal surface, as corroborated by SEM (Figure 7a). Meanwhile, the low frequency is usually attributed to the process of load transfer or activation. Regarding the 12 h and 24 h period of exposure, the behavior is similar and it can be observed at three time constants, attributable to: a film formation (high frequencies, 1000 Hz), load transfer (intermediate frequencies, 10 Hz) and diffusion (low frequencies, 1 Hz). The behavior in the impedance spectra of the Bode diagram (θ vs. f) indicates that starting at 12 h, the corrosion product’s film covers the total area exposed, so it is possible to appreciate a diffusion process through the film (low frequencies) (Figure 7a).
In Figure 10, it can be observed that after 30 min of immersion there are no considerable modifications; only a marginal decrease in the impedance (probably on the metal surface) is observed. However, the appearance of a film on the metallic substrate of Cu2(OH)3Cl increases the impedance at 12 and 24 h and keeps it constant. These results have a good correlation with the polarization curve results, but as was also mentioned, the specimen is passive because it covers it with a Cu2O film, and with the increase in potential this film is destroyed. Where there is a greater amount of Cl ions 36 and pitting occurs, once this phenomenon has passed, the corrosion products re-passivate the area.

4. Conclusions

Mechanical alloying is a good technique for the formation of immiscible alloys in solid state, Cu–Mo. In this investigation, an occupancy of 27% of Mo in the Cu lattice was obtained, in the same way that no contamination of the milling media was observed.
After the electrochemical tests, a Cu2O crystalline film was formed on the alloy surface when it was exposed to synthetic seawater; therefore, the passive phenomenon in the alloy corrosion was present. The corrosion rate that occurs in the specimen of the Cu-20 wt% Mo alloy will then be 5.01 mm/year.
The alloy exhibits a combined phenomenon of activation and concentration in the cathodic polarization. In the Nyquist diagrams, a similar behavior was observed at 12 and 24 h exposure times, which presents three time constants attributed to the process of a film formation by corrosion products (high frequencies), load transfer (intermediate frequencies) and diffusion (low frequencies).

Author Contributions

Conceptualization, C.A. and A.M.; investigation, O.H.; methodology, O.H.; project administration, C.A. and A.M.; software, O.H.; supervision, C.A. and A.M.; writing—original draft, O.H.; writing—review & editing, O.H.

Funding

This research received no external funding.

Acknowledgments

The IIMM laboratory for facilities to make synthetic seawater.

Conflicts of Interest

The authors declare no conflict of interest.

References

  1. Davis, J.R. (Ed.) Copper and Copper Alloys; ASM international: Materials Park, OH, USA, 2001. [Google Scholar]
  2. Ghorbani, A.; Sheibani, S.; Ataie, A. Microstructure and mechanical properties of consolidated Cu-Cr-CNT nanocomposite prepared via powder metallurgy. J. Alloys Compd. 2018, 732, 818–827. [Google Scholar] [CrossRef]
  3. Hernández, O.; Aguilar, C.; Medina, A.; Béjar, L.; Parra, C.; Carreón, H.; Borjas-García, S.E. Structural characterization of Cu10Mo alloy aynthesized by mechanical alloying. Microsc. Microanal. 2018, 24 (Suppl. 1), 800–801. [Google Scholar]
  4. Hernández, O.; Aguilar, C.; Medina, A.; Borjas, S.; Béjar, L.; Bernal, J.; Vega, J. Characterization of Cu-30Mo alloys synthesized by mechanical alloying. Microsc. Microanal. 2017, 23 (Suppl. 1), 1944–1945. [Google Scholar]
  5. Suryanarayana, C. Mechanical Alloying and Milling; CRC Press: Boca Raton, FL, USA, 2019. [Google Scholar]
  6. Kazimierczak, H.; Morgiel, J.; Swiatek, Z.; Vega, J.M.; García-Lecina, E. Effect of Mo addition on corrosion of Zn coatings electrodeposited on steel. Corros. Sci. 2018, 135, 107–119. [Google Scholar] [CrossRef]
  7. Nikulina, A.V.; Konkov, V.F.; Peregud, M.M.; Vorobev, E.E. Effect of molybdenum on properties of zirconium components of nuclear reactor core. Nucl. Mater. Energy 2018, 14, 8–13. [Google Scholar] [CrossRef]
  8. Patil, V. A study on mechanical properties of aluminium-4.5% copper alloy metal matrix composites reinforced with alumina fibers using squeeze casting process. J. Polym. Compos. 2018, 6, 22–31. [Google Scholar]
  9. Thurber, C.R.; Ahmad, Y.H.; Calhoun, M.C.; Al-Shenawa, A.; D’Souza, N.; Mohamed, A.; Golden, T.D. Metal matrix composite coatings of cupronickel embedded with nanoplatelets for improved corrosion resistant properties. Int. J. Corros. 2018, 2018, 5250713. [Google Scholar] [CrossRef]
  10. Singh, M.K.; Gautam, R.K.; Prakash, R.; Ji, G. Mechanical and corrosion behaviors of developed copper-based metal matrix composites. In IOP Conference Series: Materials Science and Engineering; IOP Publishing: Bristol, UK, 2018. [Google Scholar]
  11. Aponte, B.; Fernández de Romero, M.; Troconis de Rincón, O.; Arias, S.; Contreras, M.; Ramos, J.; Collantes, R. Costos por corrosión en el mantenimiento preventivo y correctivo de equipos e instalaciones en la industria. Rev. Téc. Ing. Univ. Zulia 2008, 31, 87–96. [Google Scholar]
  12. Schleich, W. Application of Copper-Nickel Alloy Uns C70600 for Seawater Service. In Proceedings of the CORROSION/2005 Annual Conference and Exhibition, Houston, TX, USA, 3–7 April 2005. [Google Scholar]
  13. Badawy, W.A.; Ismail, K.M.; Fathi, A.M. Effect of Ni content on the corrosion behavior of Cu–Ni alloys in neutral chloride solutions. Electrochim. Acta 2005, 50, 3603–3608. [Google Scholar] [CrossRef]
  14. Ma, A.; Jiang, S.; Zheng, Y.; Ke, W. Corrosion product film formed on the 90/10 copper–nickel tube in natural seawater: Composition/structure and formation mechanism. Corros. Sci. 2015, 91, 245–261. [Google Scholar] [CrossRef]
  15. Aguilar, C.; Medina, A.; Hernández, O.J.; Béjar, L.; Parra, C. Thermodynamic analysis of Fe contamination in Cu-Mo alloys processed by mechanical alloying. Philos. Mag. Lett. 2018, 98, 341–349. [Google Scholar] [CrossRef]
  16. ASTM D-1141-98, Standard Practice for the Preparation of Substitute Ocean Water; ASTM International: West Conshohocken, PA, USA, 2013.
  17. ASTM G3-89, Standard Practice for Conventions Applicable to Electrochemical Measurements in Corrosion Testing; ASTM International: West Conshohocken, PA, USA, 2010.
  18. Gil, S.; Rodríguez, E. (Eds.) Física re-Creativa Experimentos de Física usando nuevas tecnologías; Prentice Hall: Buenos Aires, Argentina, 2001. [Google Scholar]
  19. ASTM G102-89, Standard Practice for Calculation of Corrosion Rates and Related Information from Electrochemical Measurements; ASTM International: West Conshohocken, PA, USA, 1999.
  20. Niu, S.; Fang, Y.; Qiu, R.; Qiu, Z.; Xiao, Y.; Wang, P.; Chen, M. Superhydrophobic film based on Cu-dodecanethiol complex: Preparation and corrosion inhibition for Cu. Colloids Surf. A 2018, 550, 65–73. [Google Scholar] [CrossRef]
  21. Hu, L.; Zhang, S.; Li, W.; Hou, B. Electrochemical and thermodynamic investigation of diniconazole and triadimefon as corrosion inhibitors for copper in synthetic seawater. Corros. Sci. 2010, 52, 2891–2896. [Google Scholar] [CrossRef]
  22. Otmačić, H.; Stupnišek-Lisac, E. Copper corrosion inhibitors in near neutral media. Electrochim. Acta 2003, 48, 985–991. [Google Scholar] [CrossRef]
  23. Khaled, K.F. Guanidine derivative as a new corrosion inhibitor for copper in 3% NaCl solution. Mater. Chem. Phys. 2008, 112, 104–111. [Google Scholar] [CrossRef]
  24. Al-Mobarak, N.A.; Khaled, K.F.; Hamed, M.N.; Abdel-Azim, K.M.; Abdelshafi, N.S. Corrosion inhibition of copper in chloride media by 2-mercapto-4-(p-methoxyphenyl)-6-oxo-1, 6-dihydropyrimidine-5-carbonitrile: Electrochemical and theoretical study. Arabian J. Chem. 2010, 3, 233–242. [Google Scholar] [CrossRef] [Green Version]
  25. Chen, S.; Zhang, D. Study of corrosion behavior of copper in 3.5 wt.%NaCl solution containing extracellular polymeric substances of an aerotolerantsulphate-reducing bacteria. Corros. Sci. 2018, 136, 275–284. [Google Scholar] [CrossRef]
Figure 1. XRD pattern of: (a) mixed elemental powders, (b) Cu-20 wt% Mo alloy.
Metals 09 01307 g001
Figure 2. (a) Particles morphology, (b) Mapping Cu, (c) Mapping Mo, (d) EDS.
Metals 09 01307 g002
Figure 3. (a) TEM image of the alloy, (b) fast Fourier transform (FFT) and (c) inverse fast Fourier transform (IFFT) of the area marked in Figure 3a.
Metals 09 01307 g003
Figure 4. XRD pattern of the sintered specimen.
Metals 09 01307 g004
Figure 5. Polarization curve.
Metals 09 01307 g005
Figure 6. SEM Image: (a) before and (b) after the corrosion test.
Metals 09 01307 g006
Figure 7. (a) SEM Mapping after the corrosion test, (b) EDS and elements quantification.
Metals 09 01307 g007
Figure 8. (a) Nyquist diagram, (b) initial behavior.
Metals 09 01307 g008
Figure 9. Bode diagram (θ vs. f).
Metals 09 01307 g009
Figure 10. Bode diagram (|Z| vs. f).
Metals 09 01307 g010
Table 1. Chemical composition of the simulated seawater [16].
ComponentConcentration
NaCl19.62 g/L
MgCl24.16 g/L
Na2SO43.27 g/L
CaCl20.92 g/L
KCl0.55 g/L
NaHCO30.16 g/L
KBr0.08 g/L
H3BO30.02 g/L
SrCl20.02 g/L
NaF0.002 g/L
Table 2. Pills density.
Sample# pillDensity (g/cm3)
Cu-20 wt% Mo (10 h)17.76 ± 0.05
27.71 ± 0.05
37.70 ± 0.05
Table 3. Electrochemical parameters obtained from the polarization curve.
Sampleba
(mV/decade)
bc
(mV/decade)
Ecorr
(mV)
Icorr
(mA/cm2)
Ep
(mV)
Epitt
(mV)
Erp
(mV)
Cu-20 wt% Mo179.3556.6−278.30.33 ± 1 × 10−417.3134.8241.4

