Microstructure and Mechanical Properties of Sintered and Heat-Treated HfNbTaTiZr High Entropy Alloy

 , , , ,
Abstract
:
1. Introduction
2. Materials and Methods
3. Results
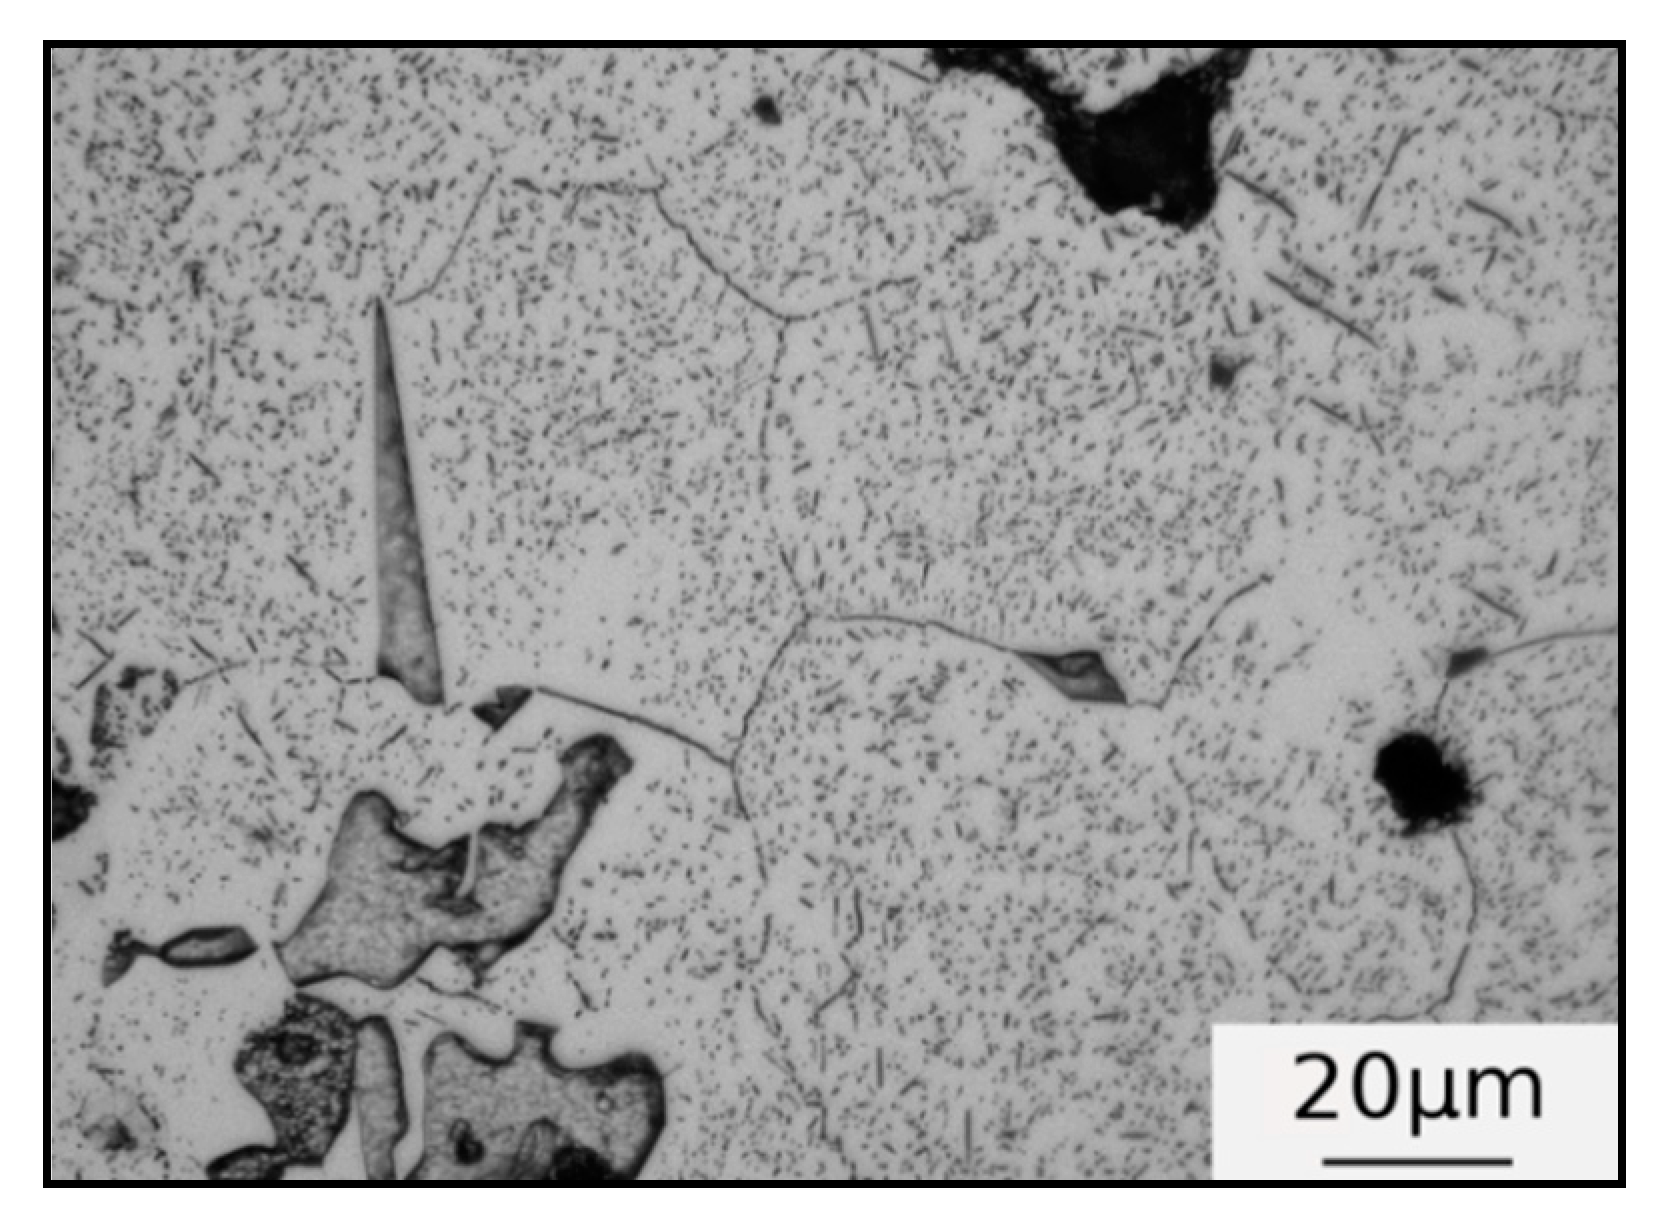
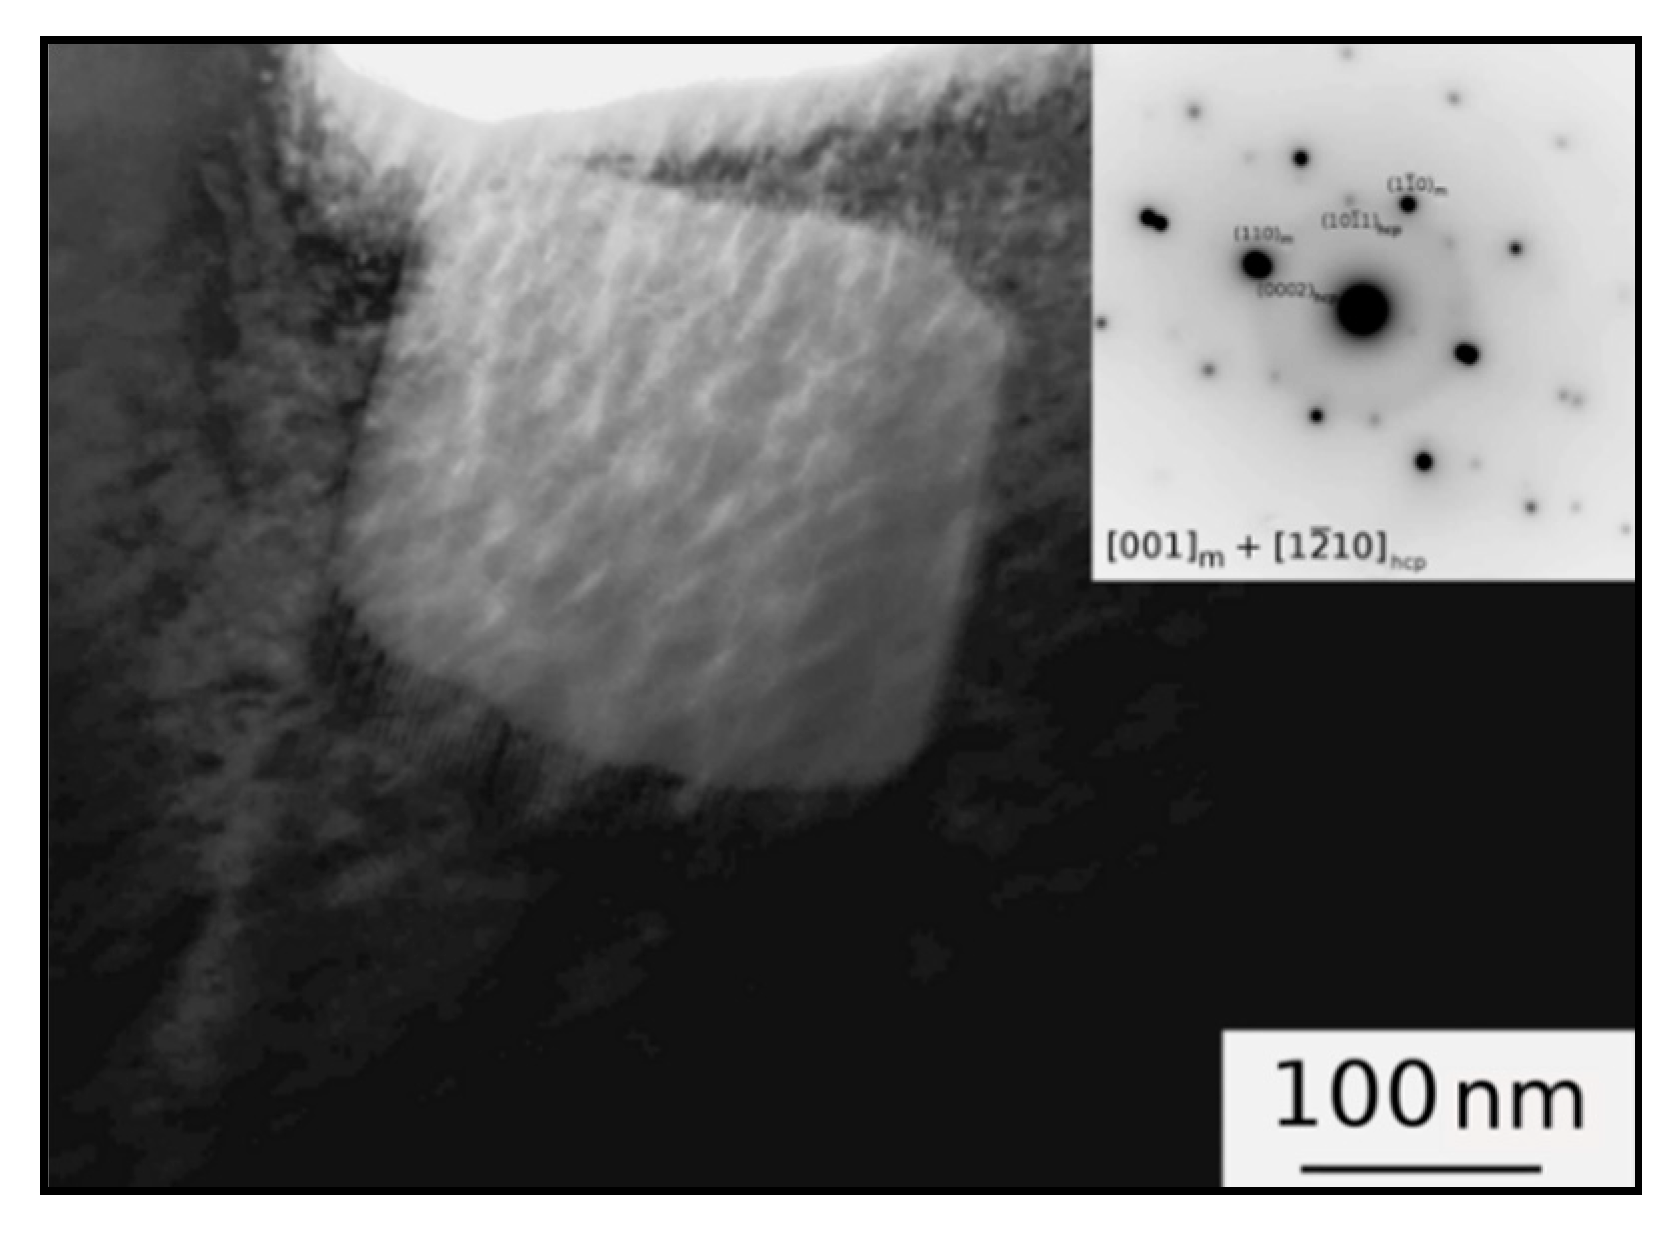
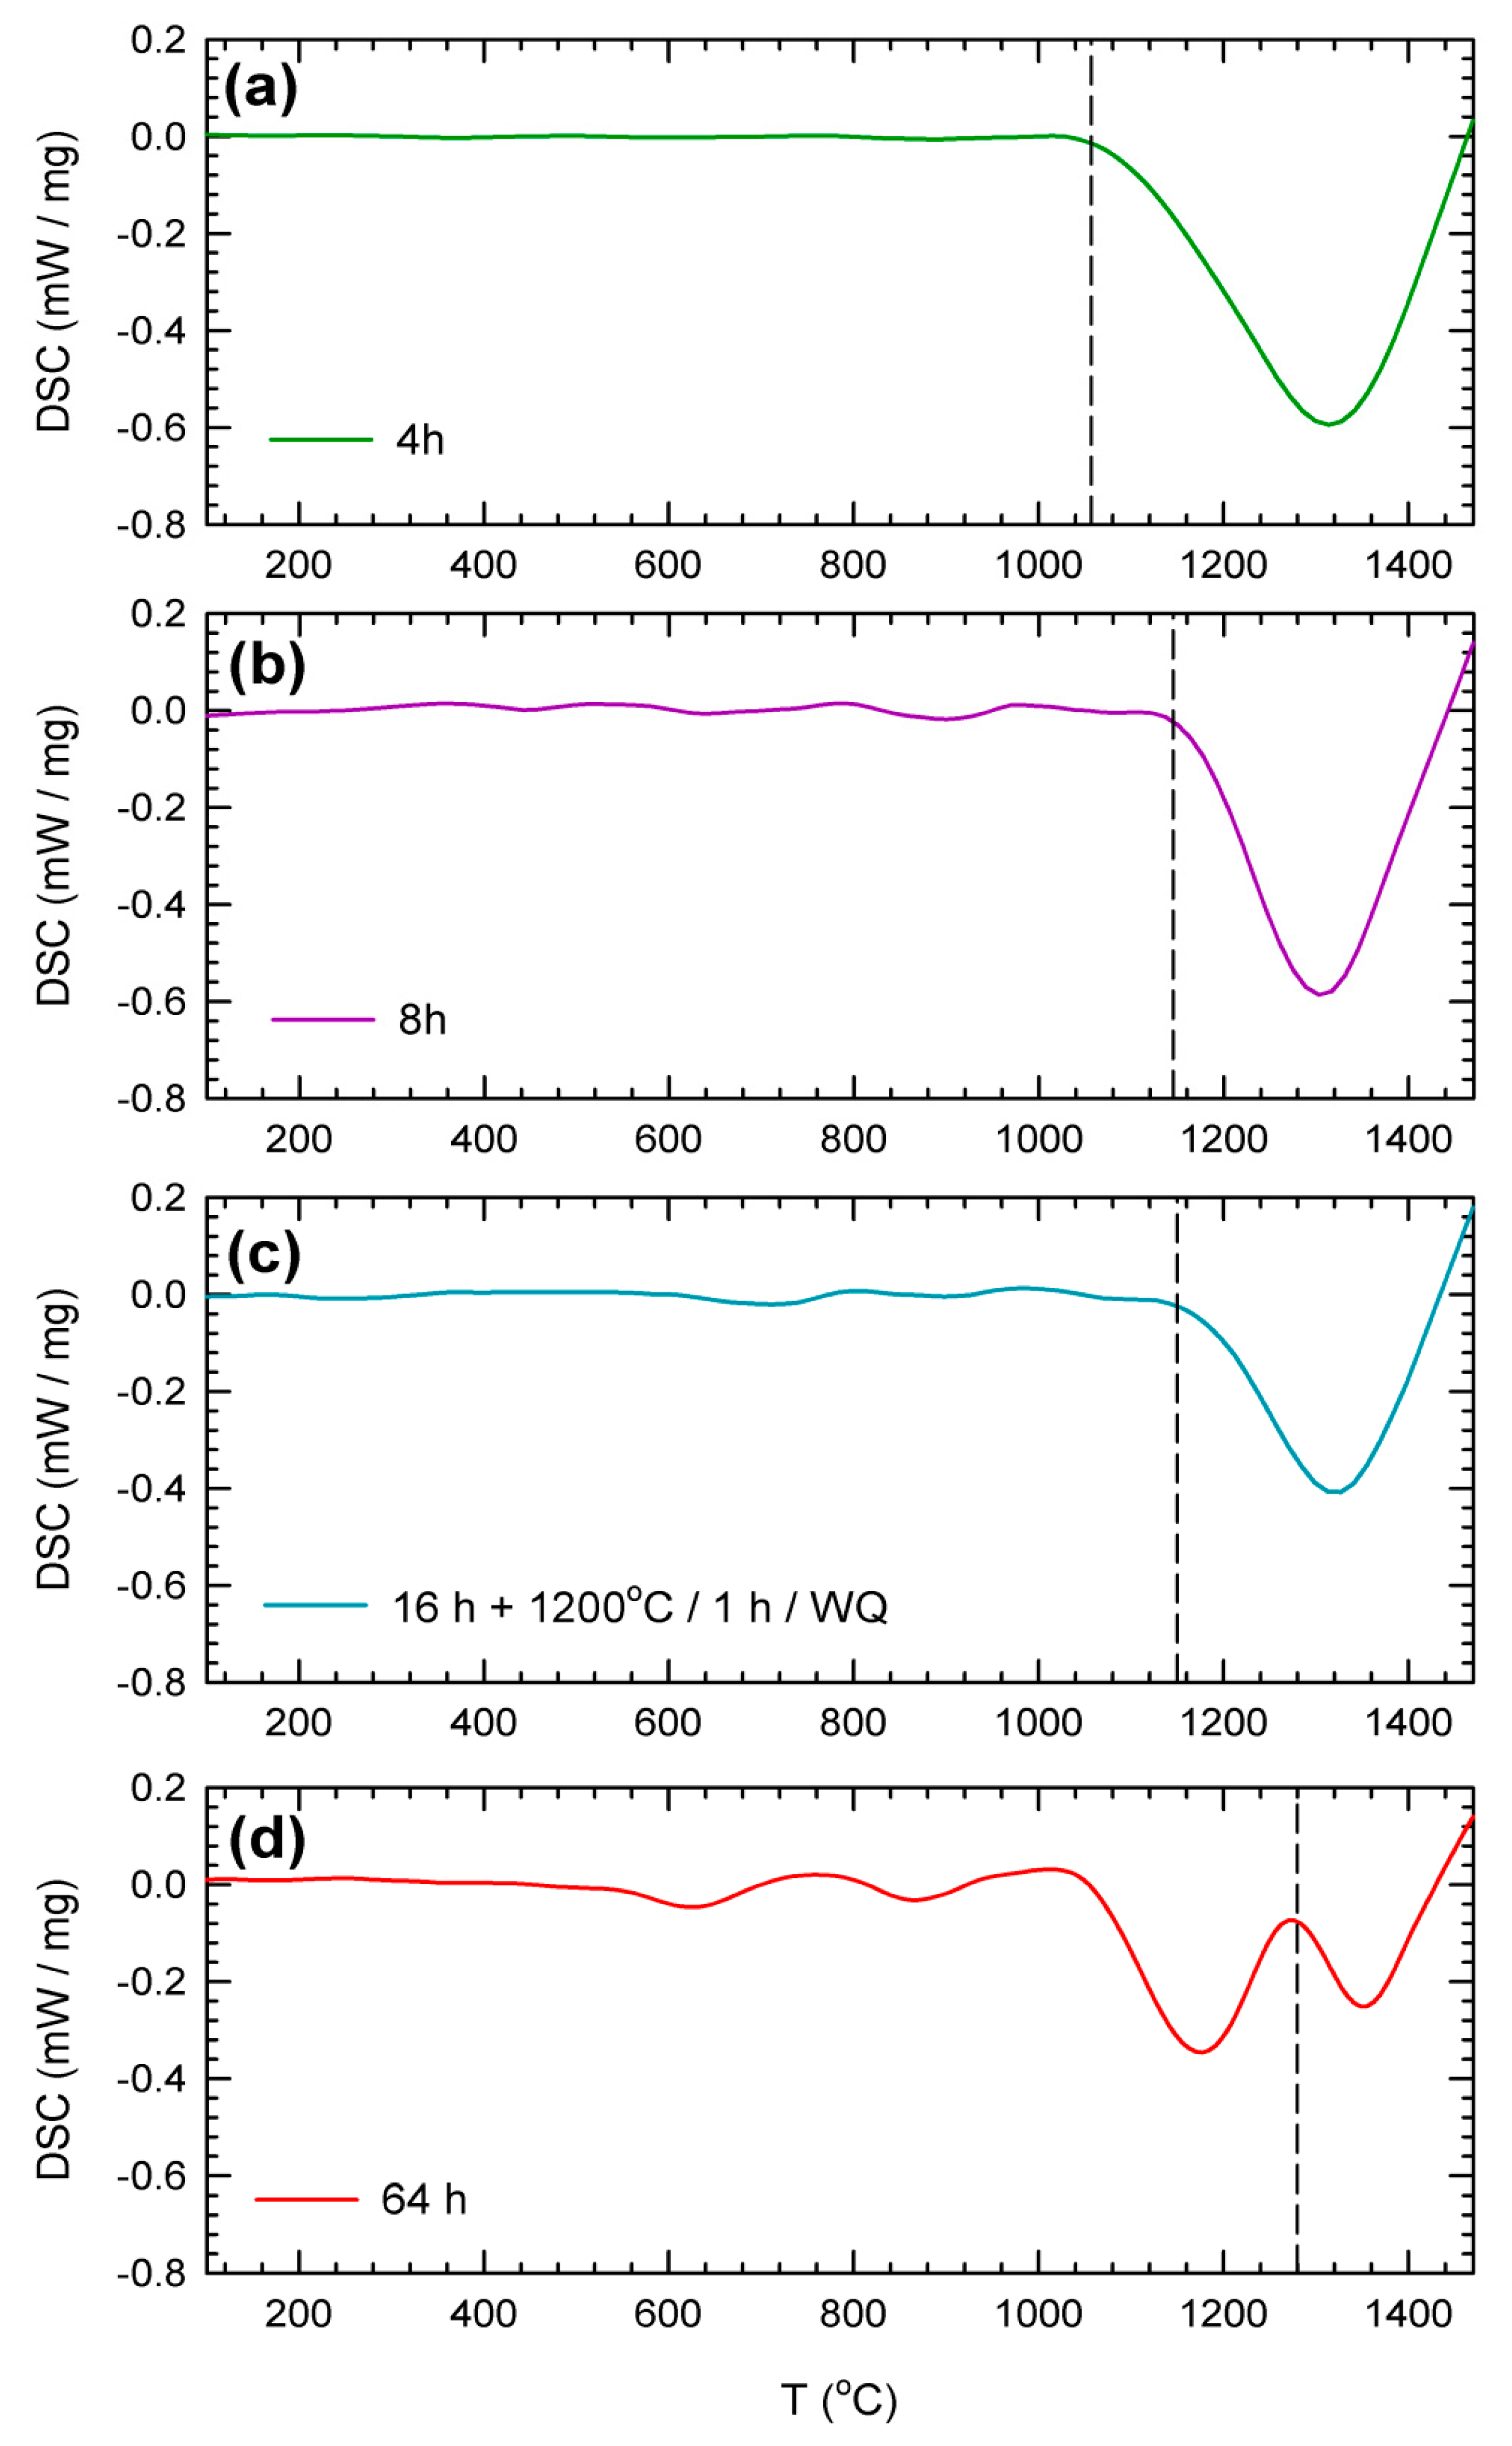
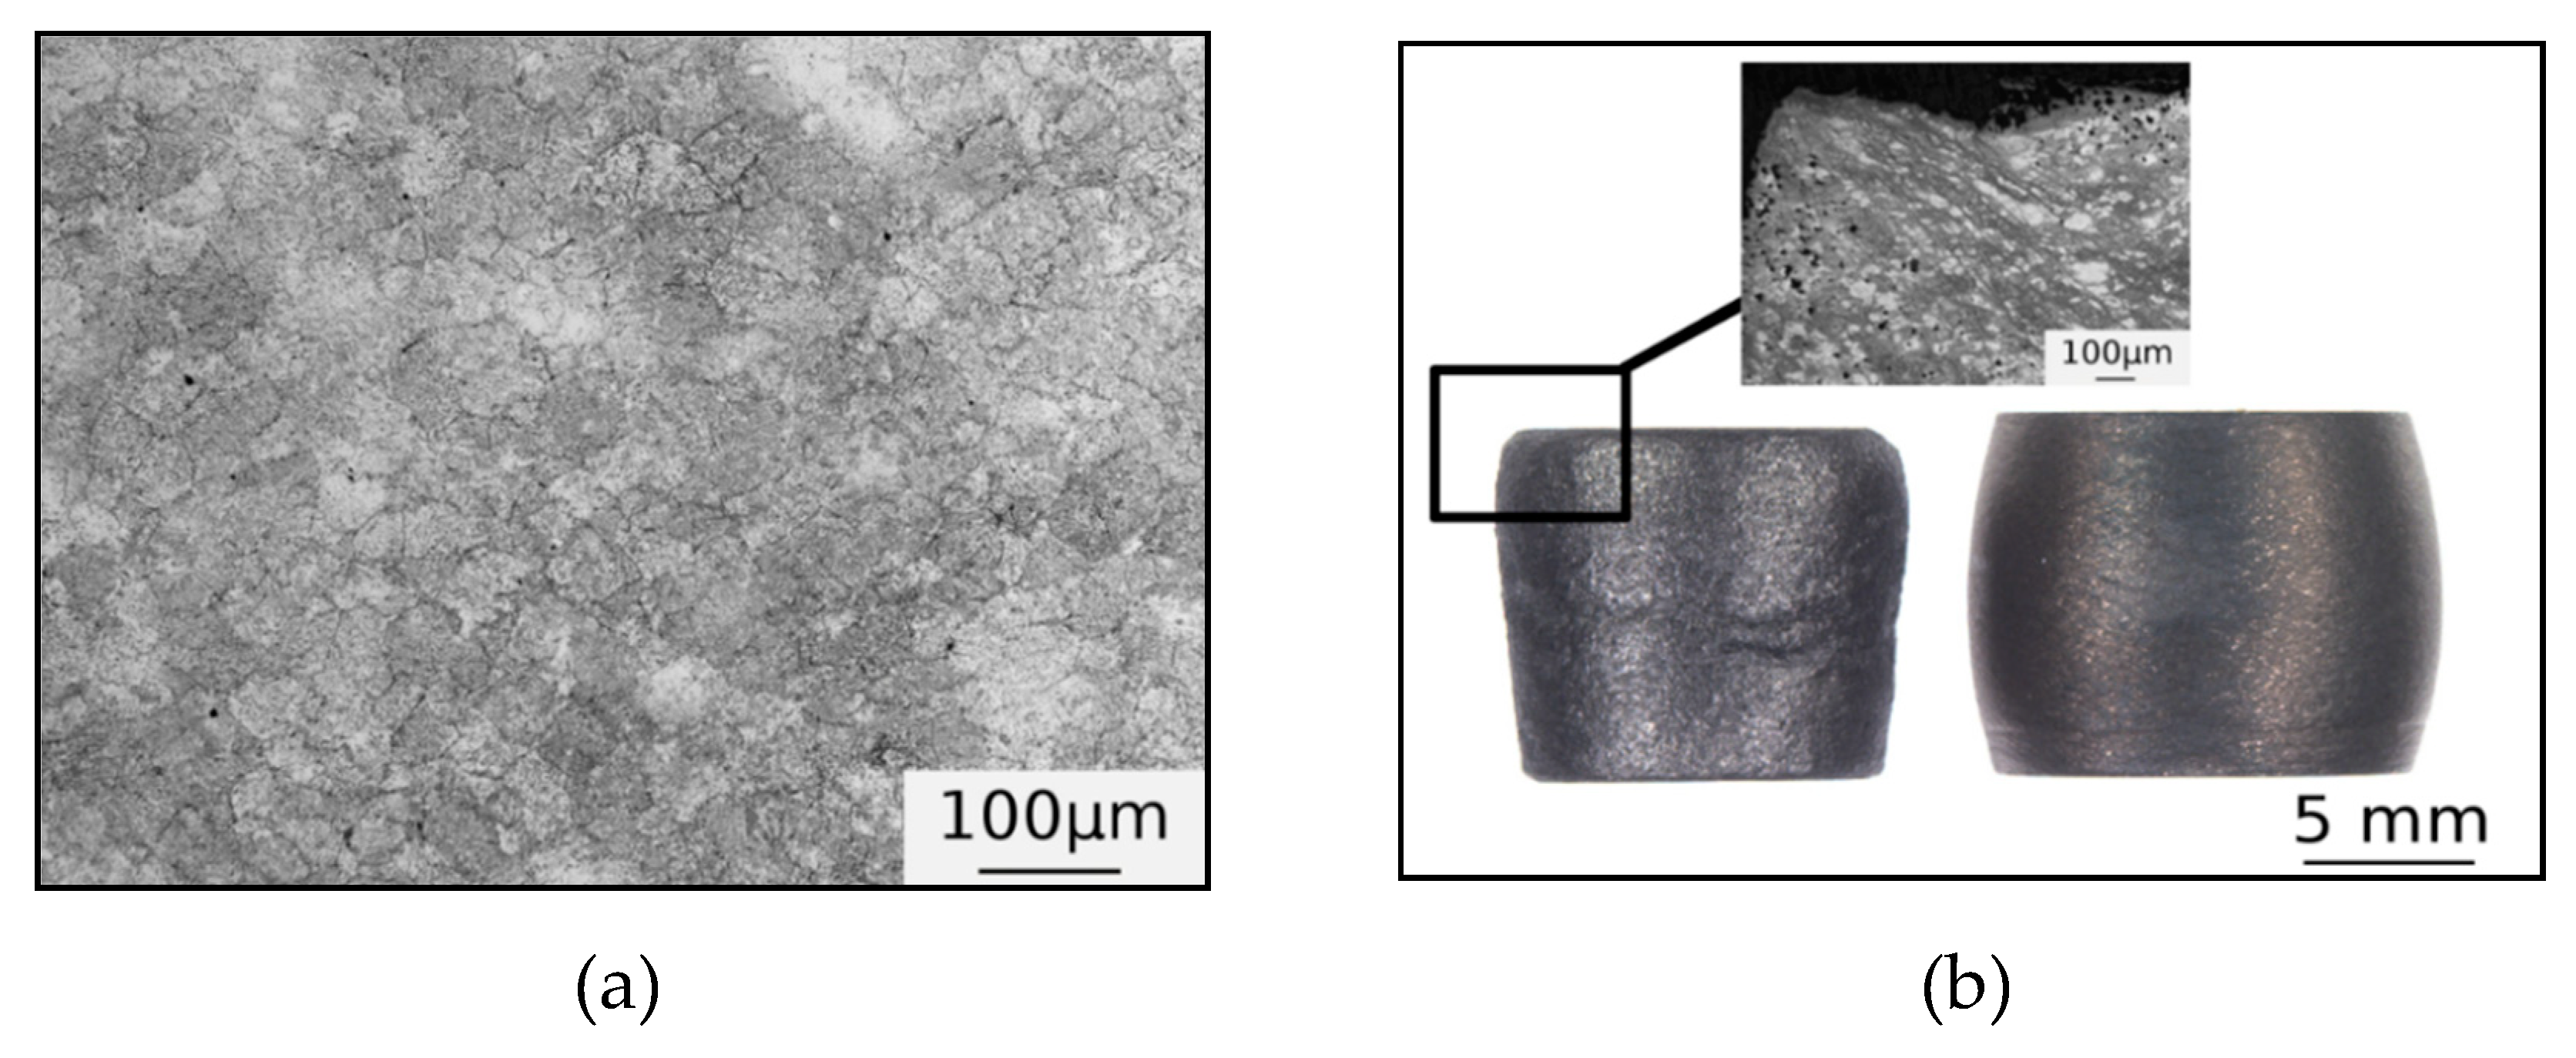
3.1. Microstructure
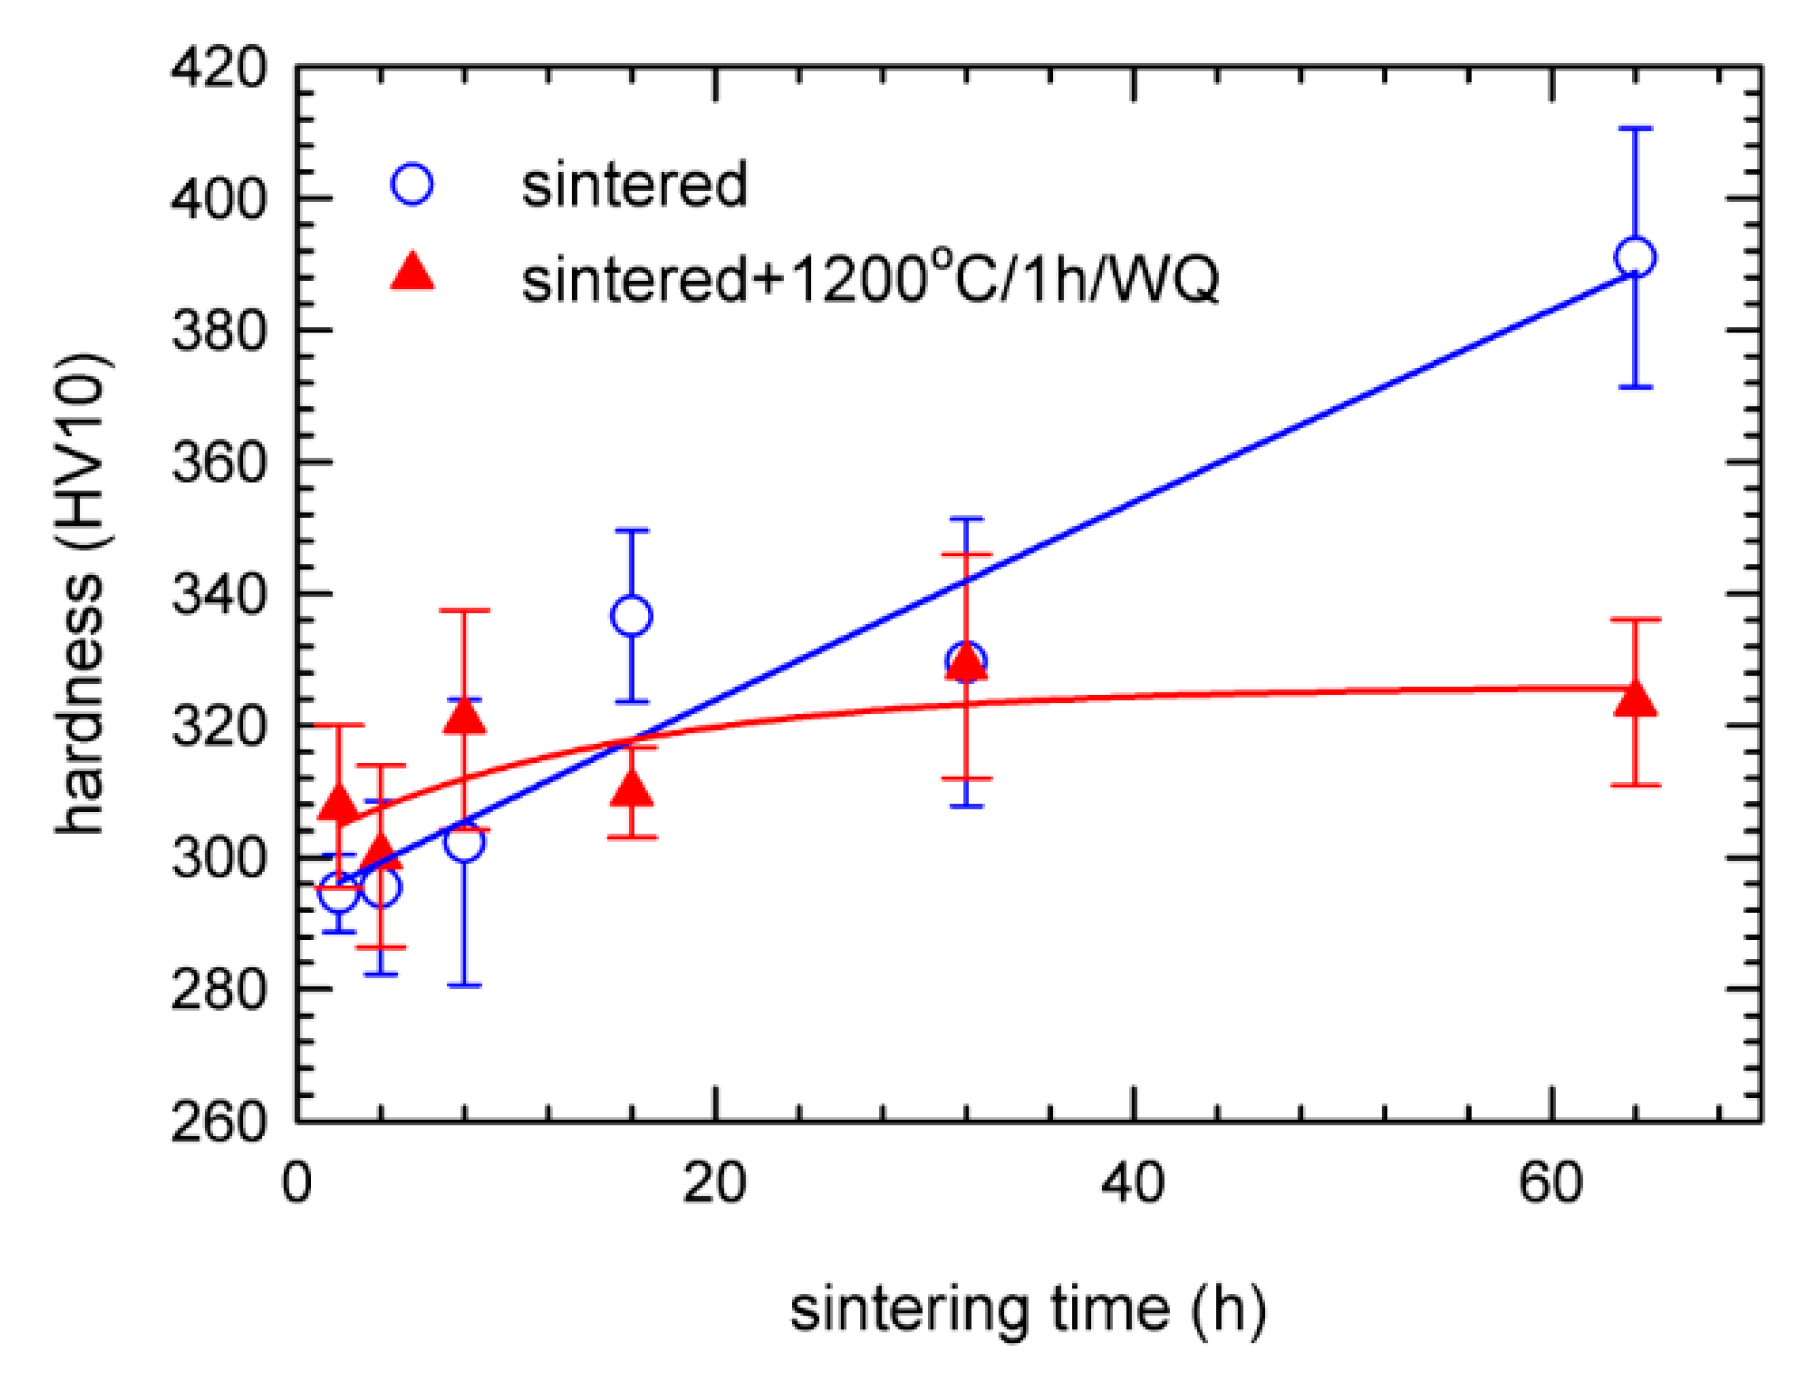
3.2. Mechanical Properties
4. Discussion
5. Conclusions
Author Contributions
Funding
Acknowledgments
Conflicts of Interest
References
- Miracle, D.B.; Senkov, O.N. Acta Materialia A critical review of high entropy alloys and related concepts. Acta Mater. 2017, 122, 448–511. [Google Scholar] [CrossRef] [Green Version]
- Yeh, B.J.; Chen, S.K.; Lin, S.J.; Gan, J.Y.; Chin, T.S.; Shun, T.T.; Tsau, C.H.; Chang, S.Y. Nanostructured High-Entropy Alloys with Multiple Principal Elements: Novel Alloy Design Concepts and Outcomes. Adv. Eng. Mater. 2004, 6, 299–303. [Google Scholar] [CrossRef]
- Cantor, B.; Chang, I.T.H.; Knight, P.; Vincent, A.J.N. Microstructural development in equiatomic multicomponent alloys. Mater. Sci. Eng. A 2004, 375–377, 213–218. [Google Scholar] [CrossRef]
- Kocich, R.; Kunčická, L.; Davis, C.F.; Lowe, T.C.; Szurman, I.; Macháčková, A. Deformation behavior of multilayered Al–Cu clad composite during cold-swaging. Mater. Des. 2016, 90, 379–388. [Google Scholar] [CrossRef]
- Kocich, R.; Kunčická, L.; Macháčková, A.; Šofer, M. Improvement of mechanical and electrical properties of rotary swaged Al-Cu clad composites. Mater. Des. 2017, 123, 137–146. [Google Scholar] [CrossRef]
- Zhang, Y.; Zuo, T.T.; Tang, Z.; Gao, M.C.; Dahmen, K.A.; Liaw, P.K.; Lu, Z.P. Microstructures and properties of high-entropy alloys. Prog. Mater. Sci. 2014, 61, 1–93. [Google Scholar] [CrossRef]
- Senkov, O.N.; Miracle, D.B. A new thermodynamic parameter to predict formation of solid solution or intermetallic phases in high entropy alloys. J. Alloys Compd. 2016, 658, 603–607. [Google Scholar] [CrossRef] [Green Version]
- Ye, Y.F.; Wang, Q.; Lu, J.; Liu, C.T.; Yang, Y. High-entropy alloy: Challenges and prospects. Mater. Today 2016, 19, 349–362. [Google Scholar] [CrossRef]
- Cao, Y.; Liu, Y.; Liu, B.; Zhang, W. Precipitation behavior during hot deformation of powder metallurgy Ti-Nb-Ta-Zr-Al high entropy alloys. Intermetallics 2018, 100, 95–103. [Google Scholar] [CrossRef]
- Yang, X.; Zhang, Y. Prediction of high-entropy stabilized solid-solution in multi-component alloys. Mater. Chem. Phys. 2012, 132, 233–238. [Google Scholar] [CrossRef]
- Vrtnik, S.; Lužnik, J.; Koželj, P.; Jelen, A.; Luzar, J.; Krnel, M.; Jagličič, Z.; Meden, A.; Fuerbacher, M.; Dolinšek, J. Magnetic phase diagram and magnetoresistance of Gd-Tb-Dy-Ho-Lu hexagonal high-entropy alloy. Intermetallics 2019, 105, 163–172. [Google Scholar] [CrossRef]
- Zhao, Y.J.; Qiao, J.W.; Ma, S.G.; Gao, M.C.; Yang, H.J.; Chen, M.W.; Zhang, Y. A hexagonal close-packed high-entropy alloy: The effect of entropy. Mater. Des. 2016, 96, 10–15. [Google Scholar] [CrossRef]
- Yusenko, K.V.; Riva, S.; Carvalho, P.A.; Yusenko, M.V.; Arnaboldi, S.; Suknikh, A.S.; Hanfland, M.; Gromilov, S.A. First hexagonal close packed high-entropy alloy with outstanding stability under extreme conditions and electrocatalytic activity for methanol oxidation. Scr. Mater. 2017, 138, 22–27. [Google Scholar] [CrossRef] [Green Version]
- Fuerbacher, M.; Heidelmann, M.; Carsten, T. Hexagonal High-Entropy Alloys. Mater. Res. Lett. 2015, 3, 1–6. [Google Scholar] [CrossRef]
- Chang, C.; Titus, M.S.; Yeh, J. Oxidation Behavior between 700 and 1300 C of Refractory TiZrNbHfTa High-Entropy Alloys Containing Aluminum. Adv. Eng. Mater. 2018, 20, 1–8. [Google Scholar] [CrossRef]
- Senkov, O.N.; Scott, J.M.; Senkova, S.V.; Maisenkothen, F.; Micracle, D.B.; Woodward, C.F. Microstructure and elevated temperature properties of a refractory TaNbHfZrTi alloy. J. Mater. Sci. 2012, 47, 4062–4074. [Google Scholar] [CrossRef]
- Kunčická, L.; Kocich, R.; Hervoches, C.; Macháčková, A. Study of structure and residual stresses in cold rotary swaged tungsten heavy alloy. Mater. Sci. Eng. A 2017, 704, 25–31. [Google Scholar] [CrossRef]
- Dirras, G.; Lilenstein, L.; Djemia, P.; Laurent-Brocq, M.; Tingaud, D.; Couzinie, J.P.; Perriere, L.; Chauveau, T.; Guillot, I. Elastic and plastic properties of as-cast equimolar TiHfZrTaNb high-entropy alloy. Mater. Sci. Eng. A 2016, 654, 30–38. [Google Scholar] [CrossRef]
- Schuh, B.; Volker, B.; Todt, J.; Schnell, N.; Perriere, L.; Li, J.; Couzinie, J.P.; Hohenwarter, A. Thermodynamic instability of a nanocrystalline, single-phase TiZrNbHfTa alloy and its impact on the mechanical properties. Acta Mater. 2018, 142, 201–212. [Google Scholar] [CrossRef]
- Senkov, O.N.; Pilchak, A.L.; Semiatin, S.L. Effect of Cold Deformation and Annealing on the Microstructure and Tensile Properties of a HfNbTaTiZr Refractory High Entropy Alloy. Metall. Mater. Trans. A 2018, 49, 2876–2892. [Google Scholar] [CrossRef]
- Zyka, J.; Málek, J.; Pala, Z.; Andršová, I.; Vesely, J. Structure and mechanical properties of TaNbHfZrTi high entropy alloy. In Proceedings of the METAL 2015—24th International Conference on Metallurgy and Materials, Brno, Czech Republic, 3–5 June2015. [Google Scholar]
- Juan, C.C.; Tsai, M.H.; Tsai, C.W.; Hsu, W.L.; Lin, C.M.; Chen, S.K.; Lin, S.J.; Yeh, J.W. Simultaneously increasing the strength and ductility of a refractory high-entropy alloy via grain refining. Mater. Lett. 2016, 184, 200–203. [Google Scholar] [CrossRef]
- Chen, S.; Tseng, K.K.; Tong, Y.; Li, W.; Tsai, C.W.; Yeh, J.W.; Liaw, P.K. Grain growth and Hall-Petch relationship in a refractory HfNbTaZrTi high-entropy alloy. J. Alloys Compd. 2019, 795, 19–26. [Google Scholar] [CrossRef]
- Eisenbarth, E.; Velten, D.; Müller, M.; Thull, R.; Breme, J. Biocompatibility of β-stabilizing elements of titanium alloys. Biomaterials 2004, 25, 5705–5713. [Google Scholar] [CrossRef] [PubMed]
- Grandin, H.M.; Berner, S.; Dard, M. A review of Titanium Zirconium (TiZr) alloys for use in endosseous dental implants. Materials 2012, 5, 1348–1360. [Google Scholar] [CrossRef] [Green Version]
- Biesiekierski, A.; Wang, J.; Abdel-Hady Gepreel, M.; Wen, C. A new look at biomedical Ti-based shape memory alloys. Acta Biomater. 2012, 8, 1661–1669. [Google Scholar] [CrossRef]
- Kunčická, L.; Kocich, R.; Lowe, T.C. Advances in metals and alloys for joint replacement. Prog. Mater. Sci. 2017, 88, 232–280. [Google Scholar] [CrossRef]
- Kocich, R.; Kursa, M.; Szurman, I.; Dlouhý, A. The influence of imposed strain on the development of microstructure and transformation characteristics of Ni–Ti shape memory alloys. J. Alloys Compd. 2011, 509, 2716–2722. [Google Scholar] [CrossRef]
- Couzinie, J.P.; Dirras, G.; Perriere, L.; Chauveau, T.; Leroy, E.; Champion, Y.; Guillot, I. Microstructure of a near-equimolar refractory high-entropy alloy. Mater. Lett. 2014, 126, 285–287. [Google Scholar] [CrossRef]
- Poletti, M.G.; Fiore, G.; Szost, B.A.; Battezzati, L. Search for high entropy alloys in the X-NbTaTiZr systems (X = Al, Cr, V, Sn). J. Alloys Compd. 2015, 620, 283–288. [Google Scholar] [CrossRef] [Green Version]
- Yao, J.Q.; Liu, X.W.; Gao, N.; Jiang, Q.H.; Li, N.; Liu, G.; Zhang, W.B.; Fan, Z.T. Phase stability of a ductile single-phase BCC Hf0.5Nb0.5Ta0.5Ti1.5Zr refractory high-entropy alloy. Intermetallics 2018, 98, 79–88. [Google Scholar] [CrossRef]
- Guo, N.N.; Wang, L.; Luo, L.S.; Li, X.Z.; Su, Y.Q.; Guo, J.J.; Fu, H.Z. Microstructure and mechanical properties of refractory MoNbHfZrTi high-entropy alloy. Mater. Des. 2015, 81, 87–94. [Google Scholar] [CrossRef]
- Todai, M.; Nagase, T.; Hori, T.; Matsugaki, A.; Sekita, A.; Nakano, T. Novel TiNbTaZrMo high-entropy alloys for metallic biomaterials. Scr. Mater. 2017, 129, 65–68. [Google Scholar] [CrossRef] [Green Version]
- Juan, C.C.; Tseng, K.K.; Hsu, W.L.; Tsai, M.H.; Tsai, C.W.; Lin, C.M.; Chen, S.K.; Lin, S.J.; Yeh, J.W. Solution strengthening of ductile refractory HfMo x NbTaTiZr high-entropy alloys. Mater. Lett. 2016, 175, 284–287. [Google Scholar] [CrossRef]
- Juan, C.C.; Tsai, M.H.; Tsai, C.W.; Lin, C.M.; Wang, W.R.; Yang, C.C.; Chen, S.K.; Lin, S.J.; Yeh, J.W. Enhanced mechanical properties of HfMoTaTiZr and HfMoNbTaTiZr refractory high-entropy alloys. Intermetallics 2015, 62, 76–83. [Google Scholar] [CrossRef]
- Maiti, S.; Steurer, W. Structural-disorder and its effect on mechanical properties in single-phase TaNbHfZr high-entropy alloy. Acta Mater. 2016, 106, 87–97. [Google Scholar] [CrossRef]
- Dirras, G.; Couque, H.; Lilensten, L.; Heczel, A.; Tingaud, D.; Couzinie, J.P.; Perriere, L.; Gubicza, J.; Guillot, I. Mechanical behavior and microstructure of Ti20Hf20Zr20Ta20Nb20 high-entropy alloy loaded under quasi-static and dynamic compression conditions. Mater. Charact. 2016, 111, 106–113. [Google Scholar] [CrossRef]
- Senkov, O.N.; Semiatin, S.L. Microstructure and properties of a refractory high-entropy alloy after cold working. J. Alloys Compd. 2015, 649, 1110–1123. [Google Scholar] [CrossRef]
- Dirras, G.; Gubicza, J.; Heczel, A.; Lilensten, L.; Couzinie, J.P.; Perriere, L.; Guillot, I.; Hocini, A. Microstructural investigation of plastically deformed Ti20Zr20Hf20Nb20Ta20 high entropy alloy by X-ray diffraction and transmission electron microscopy. Mater. Charact. 2015, 108, 1–7. [Google Scholar] [CrossRef]
- Wu, Y.D.; Cai, Y.H.; Chen, X.H.; Wang, T.; Si, J.J.; Wang, L.; Wang, Y.D.; Hui, X.D. Phase composition and solid solution strengthening effect in TiZrNbMoV high-entropy alloys. Mater. Des. 2015, 83, 651–660. [Google Scholar] [CrossRef]
- Kunčická, L.; Lowe, T.C.; Davis, C.F.; Kocich, R.; Pohludka, M. Synthesis of an Al/Al2O3 composite by severe plastic deformation. Mater. Sci. Eng. A 2015, 646, 234–241. [Google Scholar] [CrossRef]
- Kocich, R.; Szurman, I.; Kursa, M.; Fiala, J. Investigation of influence of preparation and heat treatment on deformation behaviour of the alloy NiTi after ECAE. Mater. Sci. Eng. A 2009, 512, 100–104. [Google Scholar] [CrossRef]
- Kang, B.; Lee, J.; Jin, H.; Hyung, S. Ultra-high strength WNbMoTaV high-entropy alloys with fi ne grain structure fabricated by powder metallurgical process. Mater. Sci. Eng. A 2018, 712, 616–624. [Google Scholar] [CrossRef]
- Zýka, J.; Málek, J.; Veselý, J.; Lukáč, F.; Čížek, J.; Kuriplach, J.; Melikhova, O. Microstructure and Room Temperature Properties of Different 3 and 4 Element Medium Entropy Alloys from HfNbTaTiZr System. Entropy 2019, 21, 114. [Google Scholar] [CrossRef] [Green Version]
- Čížek, J.; Haušild, P.; Cieslar, M.; Melikhova, O.; Vlasák, T.; Janeček, M.; Král, R.; Harcuba, P.; Lukáč, F.; Zýka, J.; et al. Strength enhancement of high entropy alloy HfNbTaTiZr by severe plastic deformation. J. Alloys Compd. 2018, 768, 924–937. [Google Scholar] [CrossRef]
- Lukáč, F.; Dudr, M.; Čížek, J.; Harcuba, P.; Vlasák, T.; Janeček, M. Defects in High Entropy Alloy HfNbTaTiZr Prepared by High Pressure Torsion. Acta Phys. Pol. A 2018, 134, 891–894. [Google Scholar] [CrossRef]
- Lukac, F.; Dudr, M.; Mušálek, R.; Klečka, J.; Cinert, J.; Čížek, J.; Chráska, T.; Čížek, J.; Melikhova, O.; Kuriplach, J.; et al. Spark plasma sintering of gas atomized high-entropy alloy HfNbTaTiZr. J. Mater. Res. 2018, 33, 3247–3257. [Google Scholar] [CrossRef]
- Biliński, B. The changes in surface free energy and surface heterogeneity of controlled-porosity glasses. Colloids Surf. A Physicochem.Eng. Asp. 1994, 84, 265–272. [Google Scholar] [CrossRef]
- Graham, D. The Characterization of Physical Adsorption Systems. I. The Equilibrium Function and Standard Free Energy of Adsorption. J. Phys. Chem. 1953, 57, 665–669. [Google Scholar] [CrossRef]
- Yates, D.J.C. A Note on some Proposed Equations of State for the Expansion of Rigid Porous Solids on the Adsorption of Gases and Vapours. Proc. Phys. Soc. Sect. B 1952, 65, 80–81. [Google Scholar] [CrossRef]
- Chen, S.Y.; Tong, Y.; Tseng, K.K.; Yeh, J.W.; Poplawsky, J.D.; Wen, J.G.; Gao, M.C.; Kim, G.; Chen, W.; Ren, Y.; et al. Phase transformations of HfNbTaTiZr high-entropy alloy at intermediate temperatures. Scr. Mater. 2019, 158, 50–56. [Google Scholar] [CrossRef]
- Senkov, O.N.; Senkova, S.V.; Woodward, C. Effect of aluminum on the microstructure and properties of two refractory high-entropy alloys. Acta Mater. 2014, 68, 214–228. [Google Scholar] [CrossRef]
- Wu, W.; Ni, S.; Liu, Y.; Song, M. Effects of cold rolling and subsequent annealing on the microstructure of a HfNbTaTiZr high-entropy alloy. J. Mater. Res. 2016, 31, 3815–3823. [Google Scholar] [CrossRef]
- Yang, C.; Aoyagi, K.; Bian, H.; Chiba, A. Microstructure evolution and mechanical property of a precipitation-strengthened refractory high-entropy alloy HfNbTaTiZr. Mater. Lett. 2019, 254, 46–49. [Google Scholar] [CrossRef]
- Krejčí, J.; Vrtílková, V.; Kabátová, J.; Přibyl, T.; Gajdoš, P.; Rada, D.; Šustr, J. High-Temperature Oxidation of a Sponge-Based E110 Cladding Tube Material: Weight Gain and Reaction Layer Kinetics. Nucl. Technol. 2018, 201, 52–65. [Google Scholar] [CrossRef]
- Okamoto, H. Phase Diagrams for Binary Alloys—Desk Handbook; ASM International: Cleveland, OH, USA, 2000. [Google Scholar]
- Málek, J.; Hnilica, F.; Veselý, J.; Smola, B.; Bartáková, S.; Vaněk, J. Microstructure and mechanical properties of Ti-35Nb-6Ta alloy after thermomechanical treatment. Mater. Charact. 2012, 66, 75–82. [Google Scholar] [CrossRef]
- Málek, J.; Veselý, J.; Smola, B.; Kolařík, K. The effect of boron addition on microstructure and mechanical properties of biomedical Ti35Nb6Ta alloy. Mater. Charact. 2014, 96, 166–176. [Google Scholar] [CrossRef]
- Bartáková, S.; Málek, J.; Prachár, P. The Effect of Oxygen Addition on Microstructure and Mechanical Properties of Various Beta-Titanium Alloys. JOM 2019. [Google Scholar] [CrossRef]
- Liu, Y.; Patterson, B.R. Grain growth inhibition by porosity. Acta Metall. Mater. 1993, 41, 2651–2656. [Google Scholar] [CrossRef]
- Zilnyk, K.D.; Leite, G.S.; Sandim, H.R.Z.; Rios, P.R. Grain growth inhibition by connected porosity in sintered niobium. Acta Mater. 2013, 61, 5821–5828. [Google Scholar] [CrossRef]
- Gil, F.J.; Aparicio, C.; Planell, J.A. Effect of Oxygen Content on Grain Growth Kinetics of Titanium. J. Mater. Synth. Process. 2003, 10, 10–13. [Google Scholar]
- Lei, Z.; Liu, X.; Wu, Y.; Wang, H.; Jiang, S.; Wang, S.; Hui, X.; Wu, Y.; Gault, B.; Kontis, P.; et al. Enhanced strength and ductility in a high-entropy alloy via ordered oxygen complexes. Nature 2018, 563, 546–550. [Google Scholar] [CrossRef] [PubMed]
- Senkov, O.N.; Scott, J.M.; Senkova, S.V.; Miracle, D.B.; Woodward, C.F. Microstructure and room temperature properties of a high-entropy TaNbHfZrTi alloy. J. Alloys Compd. 2011, 509, 6043–6048. [Google Scholar] [CrossRef]


| Phase | Ti | Zr | Nb | Hf | Ta |
|---|---|---|---|---|---|
| Matrix bcc | 19.9 ± 0.5 | 19.0 ± 1.3 | 21.1 ± 1.6 | 20.2 ± 0.9 | 19.8 ± 1.7 |
| precipitate bcc2 | 22.0 ± 2.1 | 7.0 ± 1.4 | 28.3 ± 2.8 | 11.1 ± 1.2 | 31.3 ± 3.4 |
| precipitate hcp | 7.7 ± 1.5 | 40.7 ± 1.6 | 6.5 ± 2.5 | 38.8 ± 3.0 | 7.8 ± 3.0 |
| Specimen | bcc | hcp (Zr- and Hf-rich) | bcc2 (Ta- and Nb-rich) |
|---|---|---|---|
| “2 h” | 68.5% | 5% | 26.5% |
| “4 h” | 59.5% | 11.3% | 29.2% |
| “8 h” | 65.6% | 11.6% | 22.8% |
| “16 h” | 65.0% | 6.8% | 28.2% |
| “32 h” | 58.5% | 13% | 28.5% |
| “64 h” * | 52.2% | 5.3% | 41.3% |
| “2 h” + 1200 °C/1 h/WQ | 87.5% | 12.5% | - |
| “4 h” + 1200 °C/1 h/WQ | 91.8% | 8.2% | - |
| “8 h” + 1200 °C/1 h/WQ | 95.3% | 4.7% | - |
| “16 h” + 1200 °C/1 h/WQ | 94.4% | 5.6% | - |
| “32 h” + 1200 °C/1 h/WQ | 94.6% | 5.4% | - |
| “64 h” + 1200 °C/1 h/WQ | 92.1% | 7.9% | - |
© 2019 by the authors. Licensee MDPI, Basel, Switzerland. This article is an open access article distributed under the terms and conditions of the Creative Commons Attribution (CC BY) license (http://creativecommons.org/licenses/by/4.0/).
Share and Cite
Málek, J.; Zýka, J.; Lukáč, F.; Čížek, J.; Kunčická, L.; Kocich, R. Microstructure and Mechanical Properties of Sintered and Heat-Treated HfNbTaTiZr High Entropy Alloy. Metals 2019, 9, 1324. https://doi.org/10.3390/met9121324
Málek J, Zýka J, Lukáč F, Čížek J, Kunčická L, Kocich R. Microstructure and Mechanical Properties of Sintered and Heat-Treated HfNbTaTiZr High Entropy Alloy. Metals. 2019; 9(12):1324. https://doi.org/10.3390/met9121324
Chicago/Turabian StyleMálek, Jaroslav, Jiří Zýka, František Lukáč, Jakub Čížek, Lenka Kunčická, and Radim Kocich. 2019. "Microstructure and Mechanical Properties of Sintered and Heat-Treated HfNbTaTiZr High Entropy Alloy" Metals 9, no. 12: 1324. https://doi.org/10.3390/met9121324