Article

Texture Gradient in a Rectangular Extruded Al60Mg40 Metal Matrix Composite

by
Soheil Sanamar
1,2,*,
Heinz-Günter Brokmeier
1,2 and
Norbert Schell
3
1
Institute of Materials Science and Engineering, TU Clausthal, 38678 Clausthal-Zellerfeld, Germany
2
Helmholtz-Zentrum Geesthacht, Max-Planck-Straße 1, 21502 Geesthacht, Germany
3
Helmholtz-Zentrum Geesthacht, German Engineering Materials Science Center outstation at Desy, Notkestraße 85, 22607 Hamburg, Germany
*
Author to whom correspondence should be addressed.
Metals 2019, 9(2), 167; https://doi.org/10.3390/met9020167
Submission received: 12 December 2018 / Revised: 23 January 2019 / Accepted: 30 January 2019 / Published: 1 February 2019

Abstract

:
By applying cold extrusion, an elemental metal powder composite Al60Mg40 was prepared. The texture gradient was measured over the cross-section of the extrusion profile using synchrotron radiation while the bulk texture was obtained by neutron diffraction. The aluminum phase shows a typical texture component of plane-strain deformation in the middle part of the sample and a uniaxial deformation texture at the surface. In the central region of the extruded bar, the (0002) Mg pole figure shows a split along the extrusion direction (±ED), which also has been observed in rare-earth containing magnesium alloys. These two poles twist towards the transverse direction on moving towards the surface of the extruded bar; one pole moves to +TD and the other one to −TD. The angle of twist increases towards the TD surface.

1. Introduction

The term ‘metal matrix composite’ (MMC) refers to a kind of material in which a metallic matrix is reinforced by another component such as a ceramic or other metals. In powder metallurgy, the starting material is usually a billet, which is then processed using plastic deformation techniques like extrusion, drawing or rolling. Deformation processed metal matrix composites (DMMCs) of two metal mixtures have received much attention during the last few decades because of their properties, such as thermal and electrical conductivity and mechanical properties including high strength [1,2,3].
The heavy deformation processing causes work hardening as well as texture changes and grain refinement, resulting in specific characteristics after the co-deformation of the different metals. One important result is the increase in strength of the deformation processed composite, which is believed to be related to, among other factors, the influence of texture on the deformation behavior [4]. In systems combining Al with Cu, Ti or Pb, it was found that the Al phase develops a <111> and <001> double fiber texture in the extrusion direction (ED) when the texture over the whole cross-section is measured [5]. On the other hand, in rectangular extruded material of Al-Ti, Al-Nb and Al-Ni, Al shows four main ideal orientations {123}<643>, {112}<111>, {100}<001> and {110}<111>.The study of highly anisotropic and inhomogeneous materials such as two-phase composites is very important for a basic understanding of many technological materials. Many authors have investigated the deformation texture of two-phase materials. A very early study was performed on α-β-brass [6]. It was found that each phase developed its own deformation texture.
During the extrusion process, several effects could result in a texture gradient. Firstly, the frictional interaction between the wall and billet causes shear stresses along the work piece (lubricant). Secondly, the extrusion conditions such as the shape of the die, die angle, extrusion speed, and extrusion temperature can contribute to the texture gradient. Thirdly, the flow stress difference between the two phases and how the stress from one phase is transferred into the second phase may play a role.
The crystallographic texture in an extruded bar tends to have a gradient over the cross section. The texture gradient influences mechanical properties such as the yield stress [7]. After early studies concerning the texture gradient within a drawn wire by Schmid [8] and an aluminum alloy [9] using a very early method, many investigations were subsequently performed with more modern techniques. Neutrons as well as high-energy photons are well known for their high penetration, and are excellent for looking deep into matter [10].
For the crystallographic texture of bulk material, neutrons have become a standard method [11,12], while local studies are mostly done with synchrotron radiation [13]. With respect to the Al-Mg system, some previous investigations have been reported in the literature. In cold-rolled Aluminum alloy 5052 [14] and commercially-rolled 6061 [15], a pronounced through-thickness texture gradient was observed, a typical cube texture that varied in intensity from the center to the surface. In a rolled and annealed Al-Mg alloy sheet [16], a through-thickness texture gradient was found, which appeared to be more related to the general deformation and not to shear-related texture with cube texture components. In the work presented below, texture gradients of the two-components within a metal mixture composite have been simultaneously measured and discussed. To the best of our knowledge, this is the first time that such a study has been reported in detail.

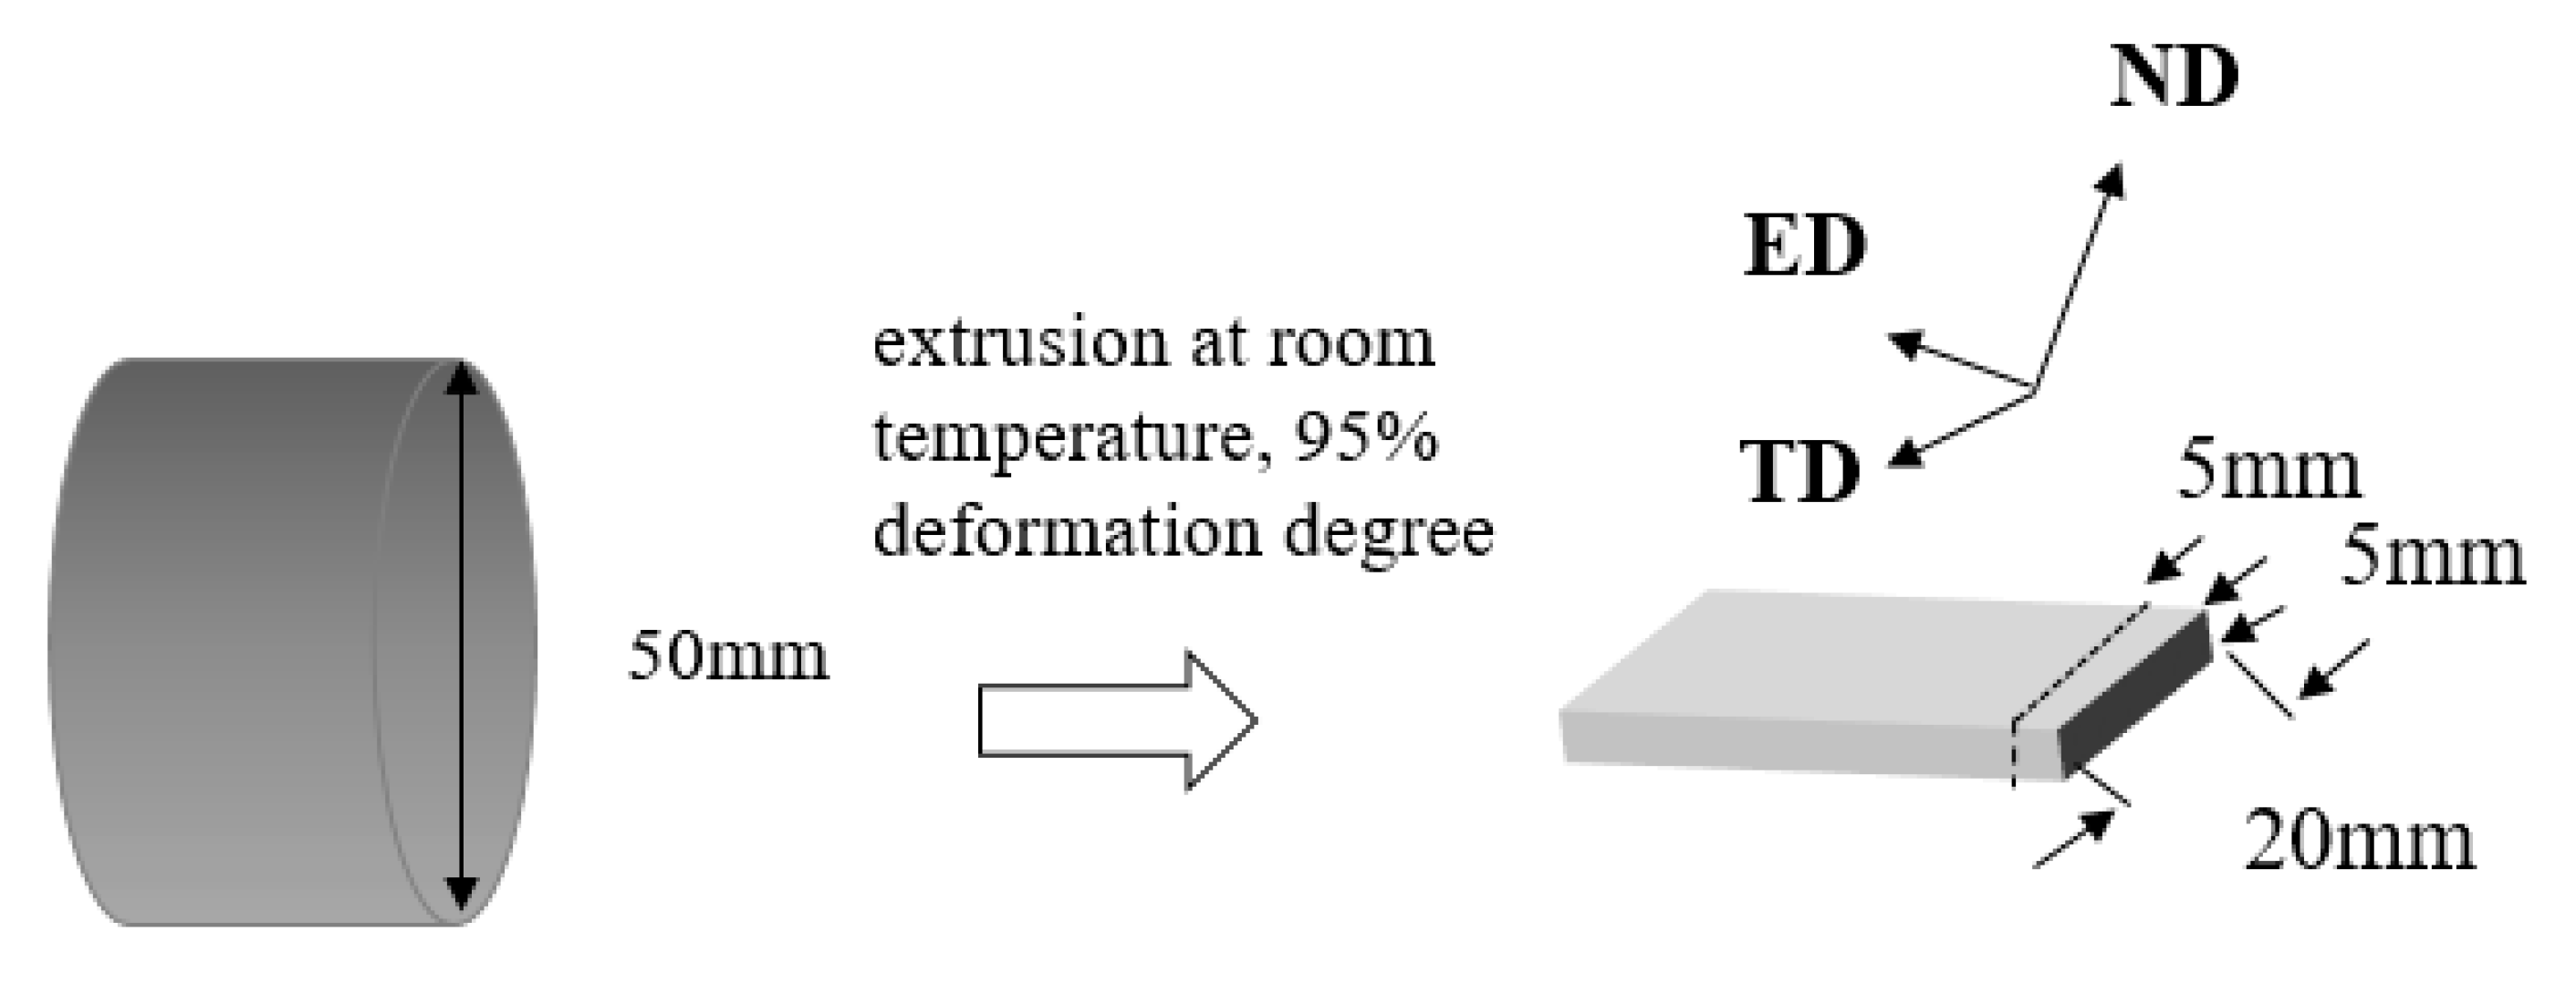
2. Experimental Procedure

The starting material was an Al-Mg composite processed through classical powder metallurgy. This method offers the possibility to combine very different materials, obtaining a two-phase composite. [17,18] In the present case, elementary Al-powder (99.94% purity) and elementary Mg-powder (96% purity) were mixed using a tubular mixer for one hour. The powder mixture was about 60 wt % Al and 40 wt % Mg. After that, the mixture was pre-compacted to a cylinder of 50 mm in diameter using a uniaxial pressure of 108 Pa. Finally, the compacted powder cylinder was extruded at room temperature to a 95% reduction in area, having a final rectangular cross section of 5 mm to 20 mm. The length of the bar depends on the cylinder volume; in the present case, the length of the extruded bar was about 100 cm. The result is a homogenous two-phased mixture of Al and Mg grains with no visible pores, which indicates an excellent co-deformation of both metals.
The interest was studying the texture gradient along TD. Due to the high penetration of the hard X-rays and the sufficient local resolution, synchrotron radiation is ideal for this kind of investigation. A test sample of 5 × 20 × 5 (length) mm³ was cut, on which 20 mm represents the transvers direction of the extrude bar (see Figure 1). Five texture measurement positions were selected (Z1 to Z5, see Figure 2). Texture measurements were performed with high-energy synchrotron radiation using the high energy beam line HEMS@PetraIII (DESY, Hamburg, Germany). A sketch of the set-up is shown in Figure 2. The gauge volume was fixed by the beam cross-section to be 500 × 500 µm2. The high penetration of 87.7 keV photons allowed us to investigate the 5 mm thick sample in transmission mode without any problem. The sample was fixed on an ω-stage that was mounted on an x-z-table (see Figure 2). This enables scans of the sample along the z direction and rotation around the vertical ω-axis. Using this setup, the extrusion direction was oriented parallel to the beam with the transverse direction pointing upwards. Due to the high brilliance of the synchrotron beam, the measurements were completed after a relatively short total counting time of 90 min.
An image plate detector (Perkin Elmer 1621, Perkin Elmer, Waltham, MA, USA) was positioned perpendicular to the beam at a distance of 1253 mm from the sample. Due to the low scattering angle obtained using a wavelength of 0.14235 Å (87.7 keV), a set of complete Debye-Scherrer-rings of both phases were collected on the detector.
In order to find the exact position of the upper surface of the sample a depth scan with single diffraction pattern, so called “single shots” were done moving z in steps of 0.1 mm, until the first diffraction spots were seen on the detector. Getting complete pole figures, the sample was rotated around the ω-axis in steps of 5° from 0° to 180° resulting in 37 diffraction images for each z position. This type of texture measurement was performed for all 5 positions (Z1 to Z5). The first position (Z1) was 1 mm from the surface. The positions Z2 to Z5 were 3.15 mm (Z2), 5.3 mm, 7.45 mm, and 9.6 mm from the surface.
The software package SABO written by Yi [19] was used to extract pole figures from Debye-Scherrer rings for all positions Z1 to Z5. The pole figure data in instrument angles ω and γ were transformed into an equal angular pole figure grid of 5° × 5°, followed by calculation of the orientation distribution function (ODF) using the Iterative Series Expansion Method (ISEM) as described by Bunge [20], with Lmax = 23 as the degree of series expansion. The maximum texture sharpness of the complete ODF odd and even part) is given as Vmax. According to the crystal symmetry of aluminum, the ODF was calculated with three pole figures, namely (111), (200) and (220), while for the hexagonal magnesium, the (10.0), (00.2), (10.1), (10.2), (11.0) and (10.3) had to be recorded calculating the ODF.
The global texture was obtained by thermal neutron diffraction (wavelength = 1.3Å) at TEX2@FRG-1, Helmholtz-Zentrum Geesthacht (HZG), Geesthacht, Germany [13]. A cubic sample (20 × 20 × 20 mm³) was prepared by gluing four samples together and positioning them in the center of an Eulerian cradle. Due to the high penetration depth of thermal neutrons and the large beam cross-section of 20 × 20 mm2, the whole sample was inside the neutron beam [11]. An equal area scanning routine of 679 pole figure points for each pole figure was performed to save counting time. The number of measured pole figures and set-up for ODF-calculation was identical to those employed in synchrotron studies. Microstructure and microhardness investigations were conducted on the TD-ND plane of the extruded bar in order to determine the microstructure and property gradients, and to see how they correlate to the texture gradient. A HMV-2000 microhardness tester (Struers, Willich, Germany) was used according to the ASTM E 38-99 standard.

3. Results

3.1. Microstructure and Hardness Tests

The microstructure within the ND-TD plane can be seen in Figure 3. The phase with brighter color is aluminum and the darker one is magnesium. Inside the extruded bar, typically pancake-shaped Al-particles that were surrounded by Mg were observed (Figure 3c–e). The particles were elongated in the TD-direction. These polycrystalline Al particles were observed in fine as well as in coarser aggregates. Closer to the surface of the extruded bar (Figure 3a–b), the pancake shape was reduced or disappeared and there was a tendency for some Al particles to elongate in the ND direction. In this position, Al as well as Mg particles also become smaller when viewed along the extrusion direction.
It can be concluded that along the whole extrusion cross-section, a homogeneous distribution of Al- and Mg-particles developed during the powder metallurgical processing and extrusion. The microhardness measurements were carried out at similar positions to those used for the texture measurements; microhardness indentations can be seen in Figure 3. Generally, the microhardness is in a band between HV 66 ± 2 and 72 ± 2 without any clear differences across the extruded bar.

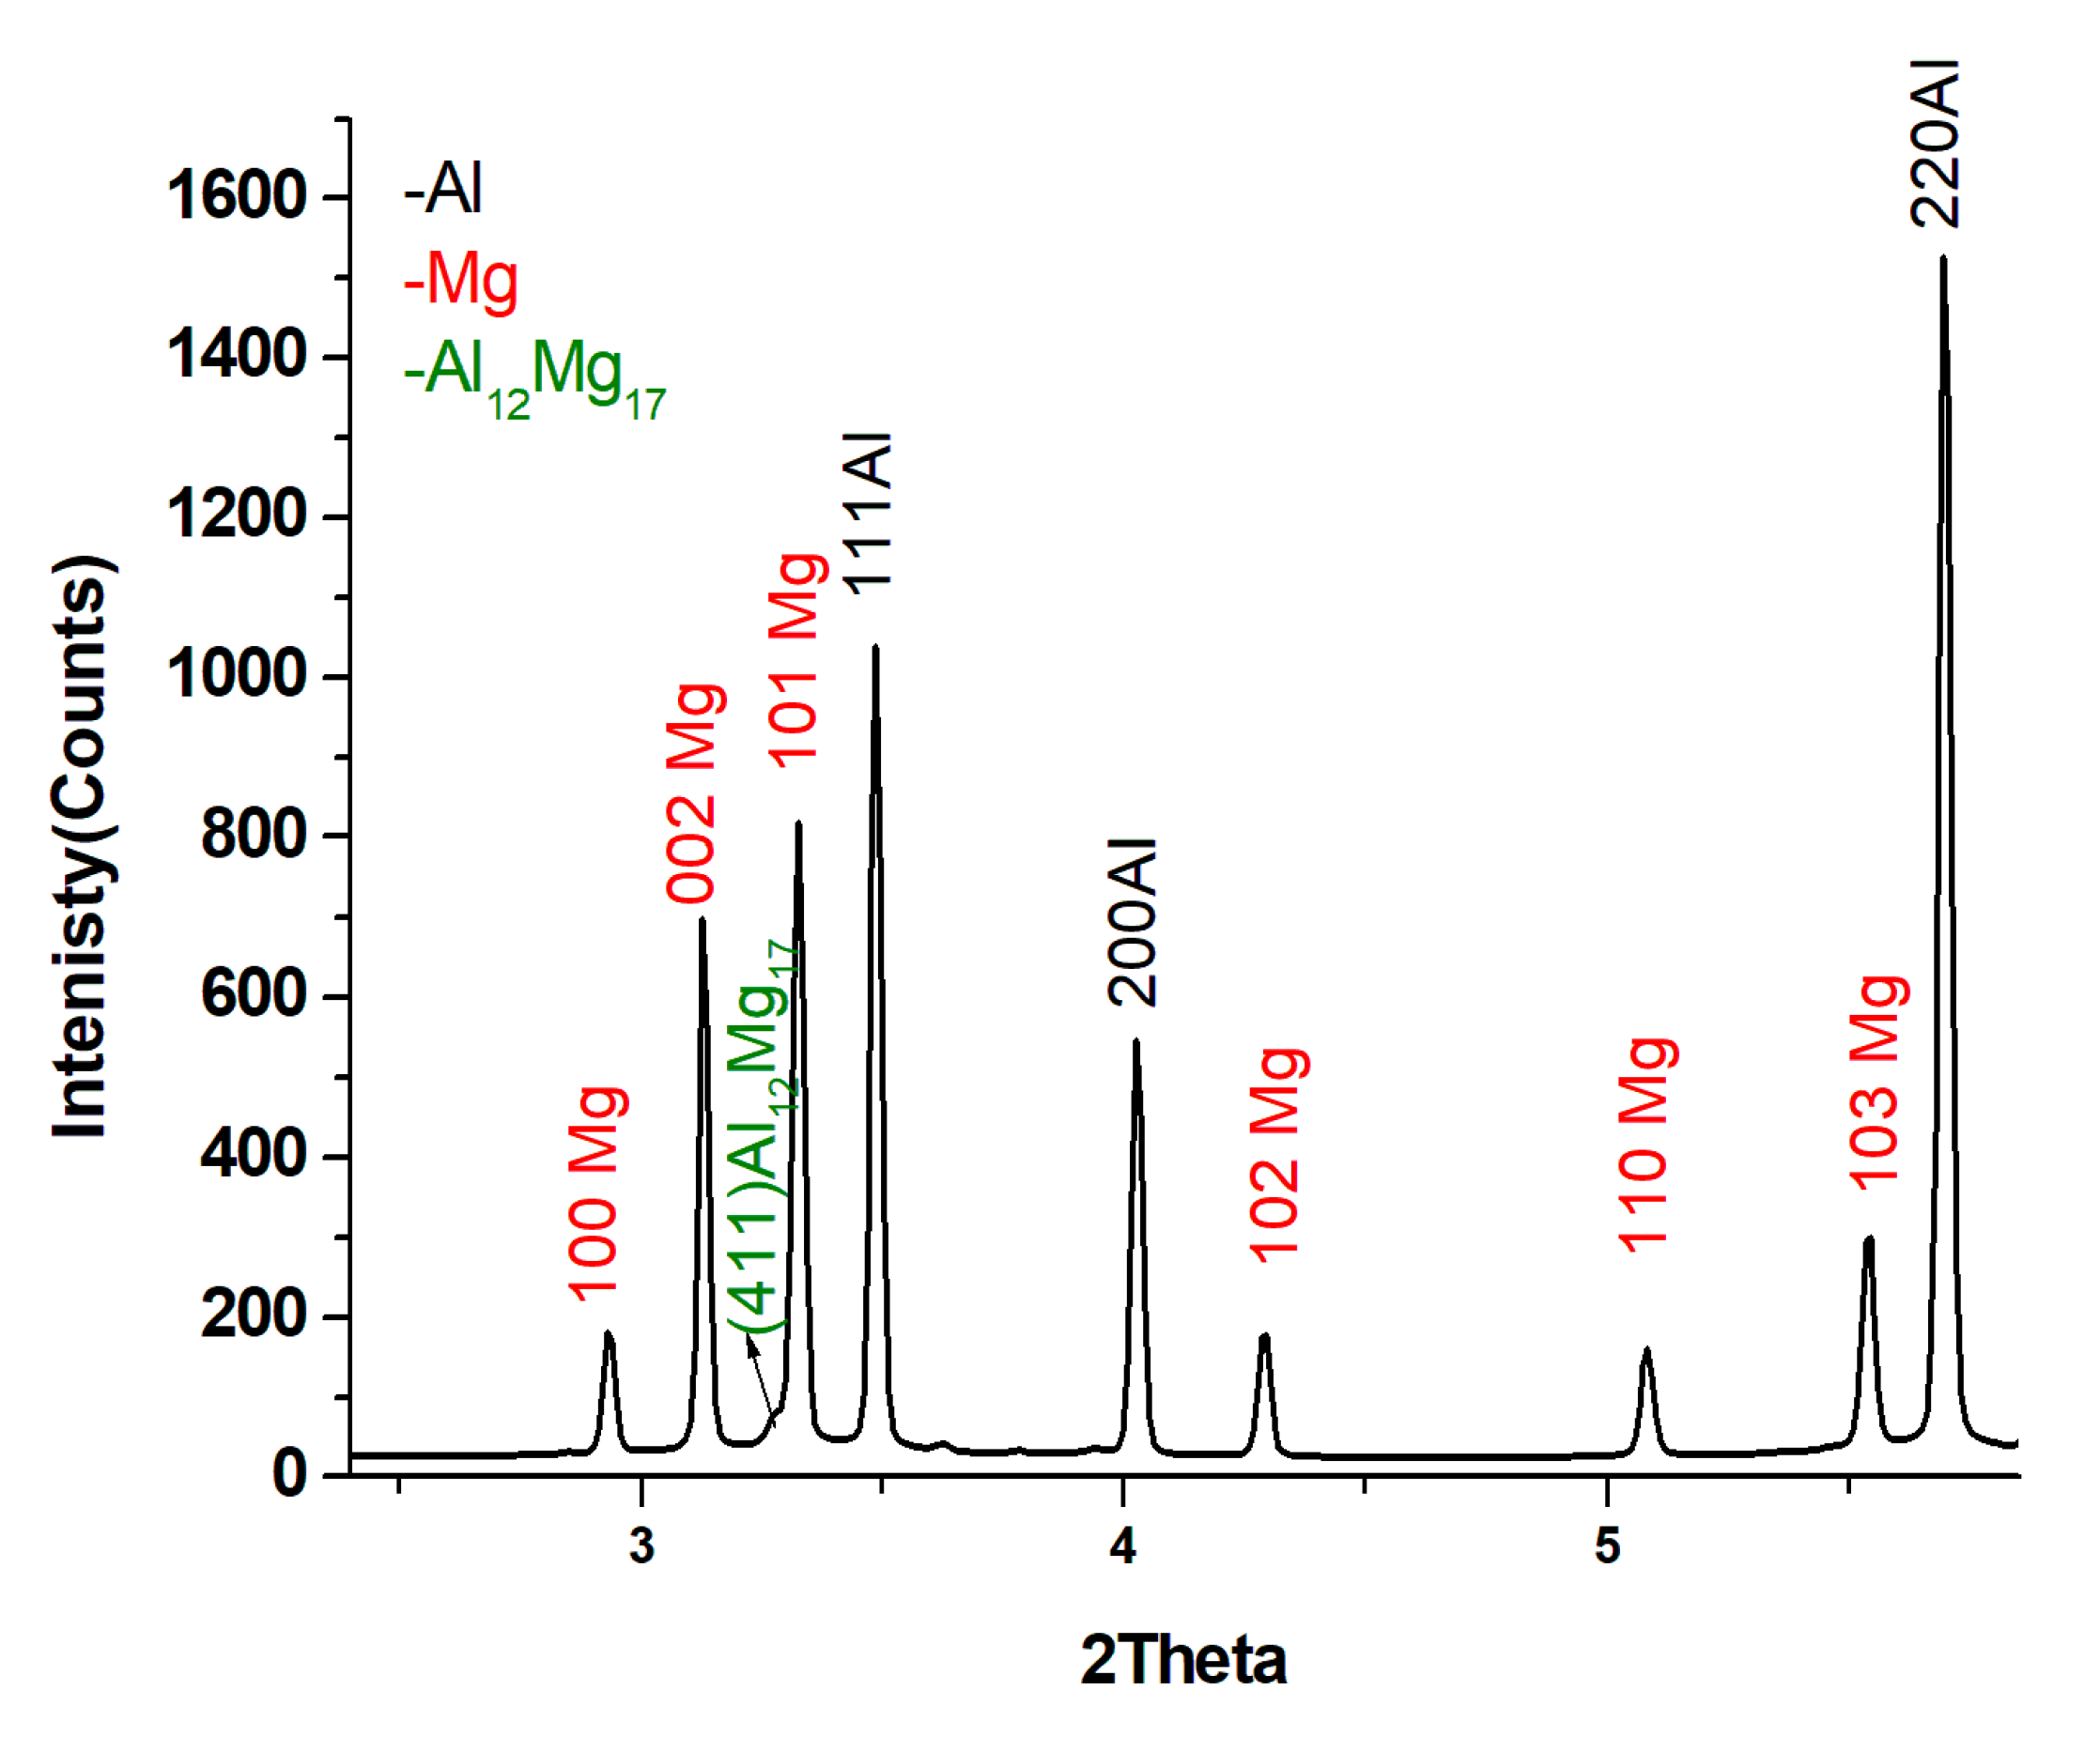
3.2. The Phase Composition of the Al60Mg40

Figure 4. shows the synchrotron diffraction pattern of Al60Mg40. Two-dimensional X-ray diffraction patterns were converted to one-dimensional intensity versus 2θ spectra using FIT2D software version 12_077 [21]. The pattern has been fully indexed and consists of Al and Mg which are separated. Due to the highly intense synchrotron beam [22], even the very low amount of Al12Mg17 intermetallic phase that was present can be seen. The pattern was also used to determine the lattice parameter of Al and Mg, which turned out to be the same as those of pure elementary Al and Mg.

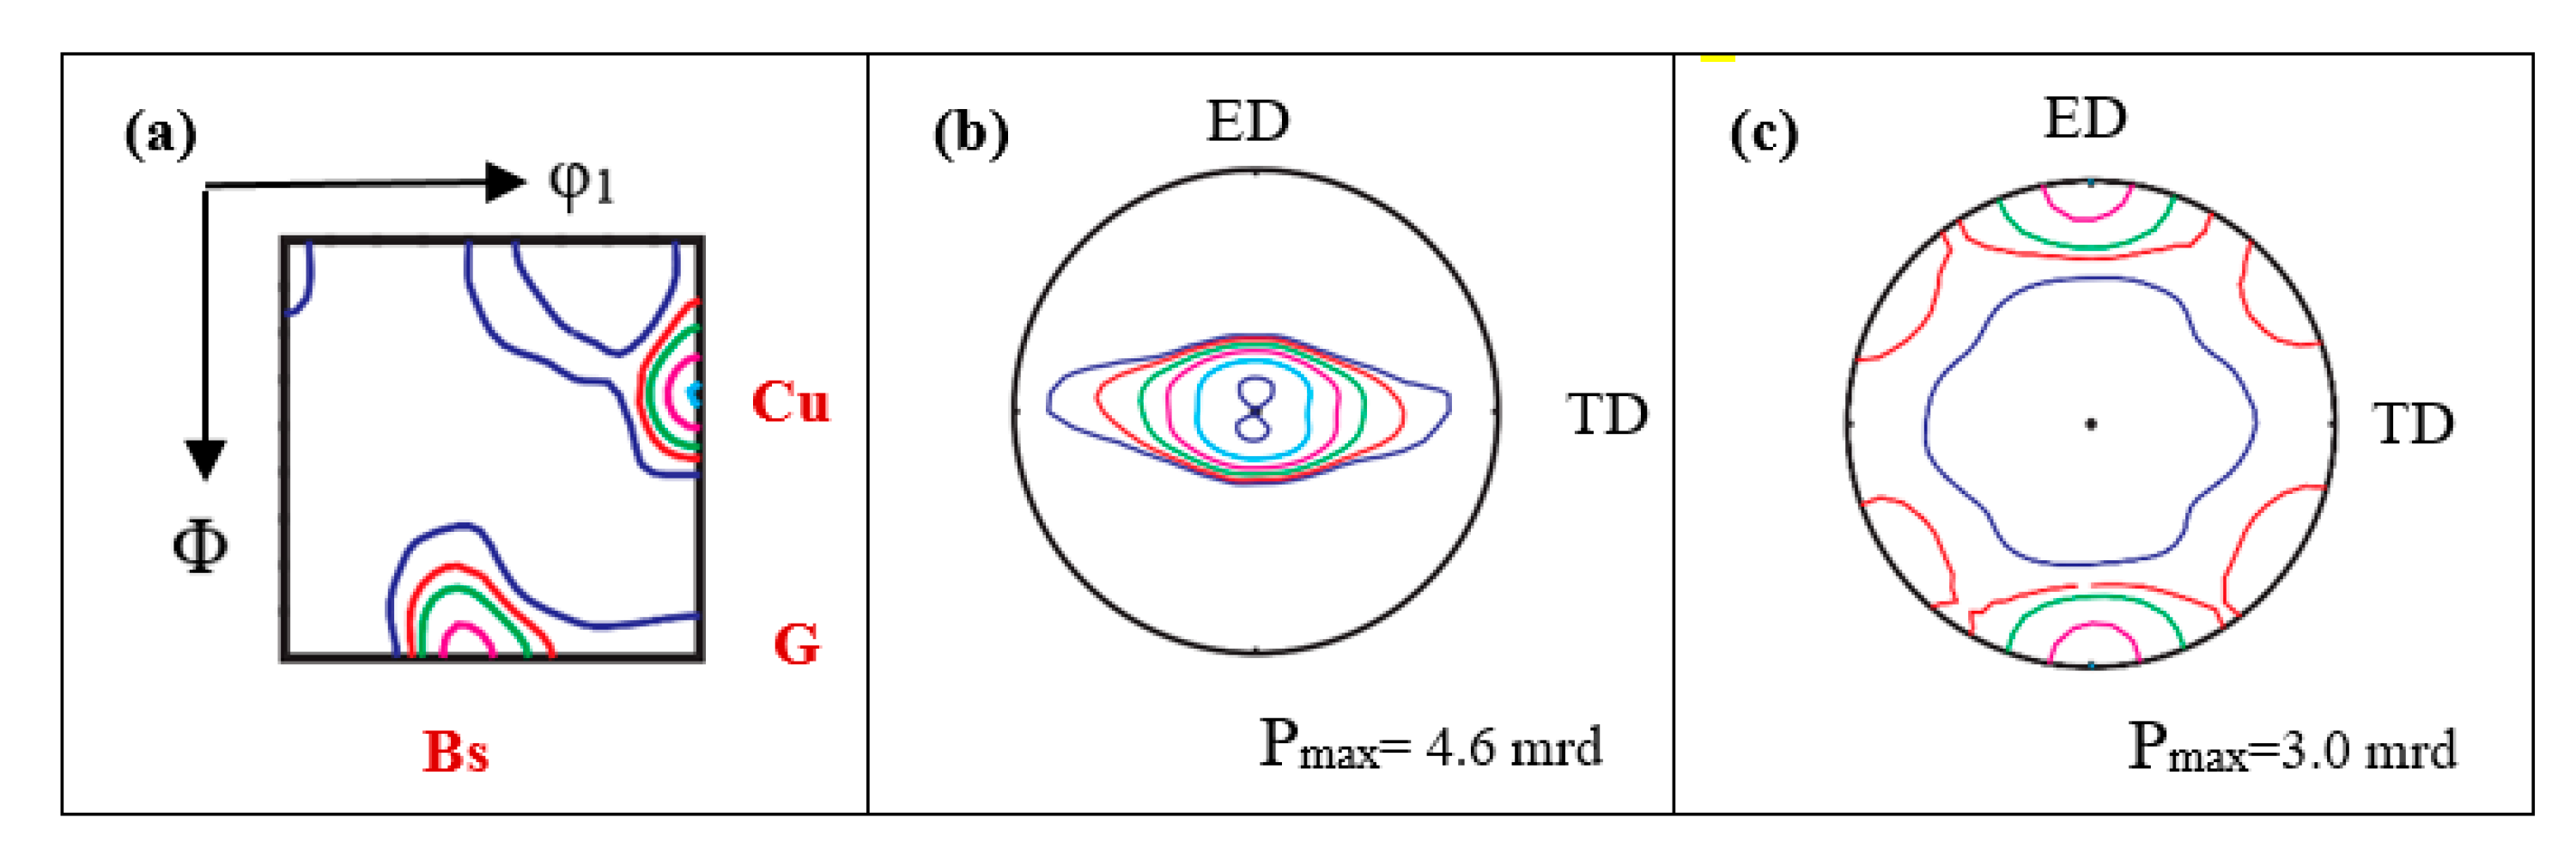
3.3. Bulk Texture of Rectangular Extruded Al60Mg40

The global texture measured by thermal neutrons represents the average texture of nearly the whole cross-section of the sample. The Al-texture is shown in the φ2 = 45°section of the ODF, see Figure 5a. Part of the β-fiber is visible, which runs from the copper component (Cu) {112}<111> (φ1 = 90°, Φ = 35°, φ2 = 45°) with about 10.6 mrd (maximum random density) through the S component {123}<634> (φ1 = 59°, Φ = 34°, φ2 = 63°) with 9.4 mrd to the brass component (BS){110}<211> (φ1 = 35°, Φ = 45°, φ2 = 90°) with 4.4 mrd. Also typical for plane strain deformed Al is the α-fiber going from the brass-component to the Goss component (G), see Figure 5a. Compared to rolling at room temperature [23], rectangular extrusion shows the same texture components but with weaker intensity. The Al texture sharpness depends firstly on the co-deformation with magnesium, as seen for other composites (Al-Cu, Al-Pb, and Al-Nb mentioned above) in which one phase flows around the other phase. Secondly, global textures show normally lower texture sharpness due the averaging of texture inhomogeneities in larger sample volumes. The Goss component is rather weak, similar to the very weak cube and rotated cube texture components that were also observed.
The magnesium texture represented by the (0002) and (10-10) pole figures (see Figure 5b,c) is much weaker than the aluminum texture. The main texture component in magnesium is a split, <0001> fiber parallel to the ND with a tilt of about ±10° in ED direction. This behavior is typical for rare-earth containing magnesium alloys that have undergone plane strain deformation; see Brokmeier [24] for Mg-WE43 or Hantzsche [25]. One can also observe ideal {0001}<10 1 0 ¯ > texture components which are overlapped due to the tilting. Moreover, a partial <10-10> fiber parallel to the ED with a scatter of nearly ±75° in the TD direction was also observed. These kinds of texture components have already been described in [26] for pure Mg-alloys.

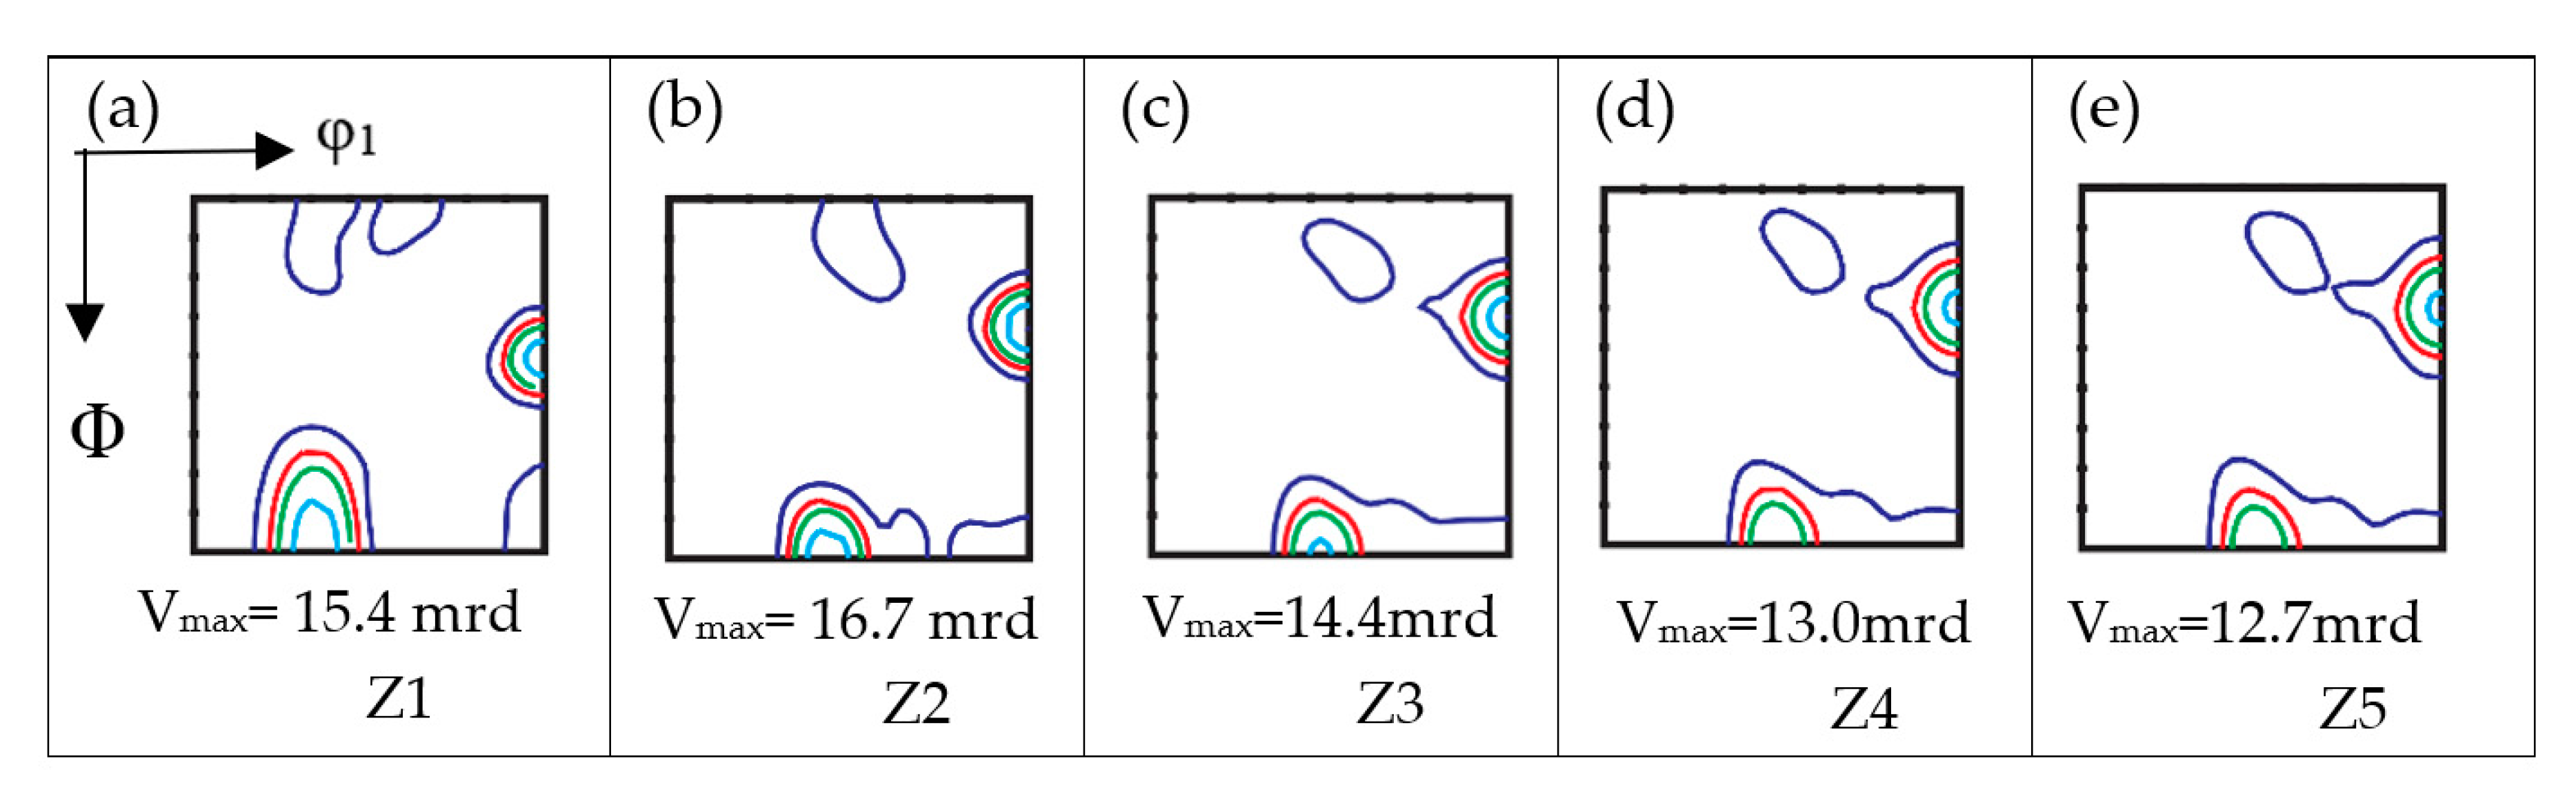
3.4. Texture Gradient of the Al-Phase

Figure 6 shows the ODF sections φ2 = 45°. These ODF-sections contain most of the texture components observed. In the central part of the rectangular extrudate (positions Z5, Z4 and Z3), the texture is more or less identical to the global texture obtained using neutron radiation; only the texture sharpness is little different. Going to the surface, two main texture effects are recognized. Firstly, the texture sharpness increases going from the center of the bar to the surface.
This can be seen by means of the so called β-fiber (see Figure 7), which has already been described for the Al-phase in the global texture Section 3.2 above. Despite the variation of the texture sharpness from central area (Z5) to the surface (Z1), Figure 8 shows a rotation of the brass component. In the α-fiber the brass component {110}<112> shifts to the G/B component {110}<111>.
The same reorientation is also observed for the S component {123}<634> (φ1 = 59°, Φ = 34°, φ2 = 63°), which rotates to the S* component. The Goss component is a minor texture component in the α-fiber, which varies between 1.8 mrd to 3.0 mrd.
At the TD surface of the extruded bar, a shear component, seen as splitting of the cube component (φ1 = 45°, Φ = 0°, φ2 = 45°), indicates friction at the surface during the extrusion process.

3.5. Texture Gradient of the Mg-Phase

Similar to the Al phase, for the Mg phase, it was oberved that the central part of the extrudate (see Figure 8) had the same texture as the global texture, but with a slightly stronger sharpness. The texture components are a split <0001> fiber parallel to the ND with a tilt of about ±10° in the ED, the ideal {0001}<10 1 ¯ 0 > and the partial <10-10> fiber parallel to the ED with a scatter of nearly ±75° in the TD. Compared to Al, the Mg texture gradient is stronger, and is more dependent on sample position. On one hand, the double peak of the split <0001> fiber exists along the whole gradient. On the other, a continuous rotation of the two <0001> fiber towards the TD is visible. Moreover, the ideal component is stable in the main part of the sample (Z5→Z3), and only diminishes near the surface of the extruded bar, while the partial <10-10> fiber parallel to the ED gets stronger and is enhanced to a complete fiber.

4. Discussion

The co-deformation of an Al60Mg40 composite during bar profile extrusion leads to a remarkable texture gradient in the transverse direction. This may result, on one hand, from the friction at the extrusion die, and secondly, from the co-deformation of cubic Al with hexagonal Mg. Al has excellent room temperature formability compared to the problematic room temperature formability of Mg. Room temperature extrusion in Al-Mg composites was only possible when using a sufficiently high Al content. Co-deformation of composites results in similar texture types to the deformation textures of the pure components [10].
For composites, the texture sharpness is lower in both components because the weaker component has to flow around the harder component, resulting in the scatter around the ideal orientations being higher. This is one way to weaken the texture if strong textures are undesirable. Harder particles tend to deform less with weaker surroundings. In the case of a high difference in deformation resistance, the harder particle will only rotate and not deform, such as Ni in an Al-matrix [27]. At the surface, the Al matrix shows a strong <111> fiber and a very weak <100> fiber. This kind of texture was usually observed after wire drawing and rod extrusion, as well as after uniaxial tensile loading [28].
At the middle section of the bar, one can observe a typical plane-strain deformation texture similar to the sheet rolling textures of different Al-alloys having the copper type texture [23]. Three typical rolling texture components exist, namely copper, S and brass. The texture gradient in the Al matrix can be described by a rotation of the β-fiber towards the <111> fiber parallel to ED. This rotation can be clearly seen in the shift of the brass texture component (central area-Z5) to the G/B texture component (TD surface-Z1) in the α-fiber. Simultaneously, a weak <100> fiber parallel to the ED was present near the TD surface. These two types of texture in the bulk of an extrudate and near the surface were also described for an L-profile extrudate of an Al-Li alloy by [29]. The effect was mainly attributed to local strain variation during the extrusion process [30] and the related activation of slip systems, as reported in [23].
One key point is the extrusion asymmetry ratio of width to thickness (W/T). In rectangular shaped extrusions, compression is much greater in the ND than in the TD. Beside the rotation of the texture components, the texture sharpness varies strongly from the central region (Z5) to the surface (Z1). The texture gradient can be seen in Figure 7, which shows the β-fiber (Z2-Z4) and the ideal <111> fiber (Z1), and in Figure 8, exhibiting the α-fibre. Similar to an investigation of Zhong et al. [31], on a rolled Al7020 plate, the strongest texture is not directly at the surface, but in a certain distance that is related to the sample cross-section.
The texture gradient (see Figure 9) is more pronounced in the Mg-phase than in the Al-phase. The Mg-texture in the central region of the extrudate shows a different type of texture development. The double pole in the (0002) pole figure, which can be described as two <0001> fibers//ND with a tilt of ±10° can be related to a remarkable contribution of <c + a> glide. This spreading texture which has various tilt angles was mostly observed in rare earth (RE) Mg alloys [32] and also in some non-RE Mg alloys [33,34]. It is known that the CRSS ratio of basal to <c + a> glide is important for the splitting angle of the central pole [35]. In the present example, it appears that the neighborhood of Al grains influences the critical resolved shear stress/CRSS of <c + a> glide in such a way that <c + a> glide is intensified and this type of texture developed. Other Mg grains, having non-favored orientations for <c + a> glide, develop the ideal {0001}<10-10> texture component. Steiner et al. [36] reported that prismatic glide, in addition to basal glide, was obtained during the modeling of plain strain compression. Depending on the ratio of active prismatic glide versus active basal glide, a third texture component that could sometimes be observed in Mg is the partial <10-10> fiber in the ED. This partial fiber in the ED is a common texture component related to the balance between basal and prismatic glide when there is only a small contribution from prismatic glide. This kind of fibre forms under restricted degrees of freedom and results in a complete orientation girdle around the fiber axis. For an ideal round extrusion, this fiber is ideal and has an orientation girdle from +TD to −TD in the (0002) pole figure, with a nearly constant intensity distribution along the girdle. In the present case, this girdle is incomplete with a scatter around ND toward the +TD and −TD. The degree of scatter depends on the aspect ratio of the width/thickness of the extruded plate or on the pass reduction parameters during rolling. Thin rolled sheets with high width/thickness reduction show no scatter and <10-10> partial fiber [37]. The texture gradient indicates that the three Mg-texture components behave differently. The ideal texture component {0001} <10-10> is present only in the central region of the extrudate, where the die angle has little or even no influence. The contribution of prismatic glide is higher in the central region than closer to the TD surface, whereas the partial fiber gets stronger from the central region to the TD surface and develops a complete <10-10> fiber parallel to the ED when basal glide in combination with prismatic glide was active. The evolution of the split texture component, which shows a rotation of the two poles toward +TD, is remarkable. The rotation angle in the central region (positions Z5 to Z4) is moderate but very strong close to the TD surface (Z1). Similar to the texture gradient in the Al-phase, the β-fiber rotates to the <111> fiber, and arises due to local strain variations. In Figure 10, the rotation angle in the Al-texture gradient is indicated, and is obtained from the shift in the α-fiber, while Figure 11 shows the rotation of the basal pole texture component in the (0002) pole figure.

5. Conclusions

Rectangular extrusion is a deformation process which is classified as being between round extrusion and rolling. Therefore, the global texture measured by neutron diffraction and texture gradients obtained by high-resolution synchrotron diffraction show more diversity in texture than after round extrusion or rolling. The high deformation geometry of round extrusion suppresses many texture details due to rotational pole figure symmetry. Rolling to a high reduction often only results in a strong preferred orientation of major texture components, and only at the very near surface does one observe textures influenced by shear. In the Al-phase, a texture gradient with a moderate sharpness in the central region and a much stronger texture close to the TD surface of the extruded bar were detected. The typical β-fiber of rolled Al in the center region (Z5) rotates to a <111> fiber parallel to ED at surface (Z1). For Mg, the texture is much weaker than for Al but stronger in the center (Z5) than close to surface of the bar (Z1). For Mg in the central region, a {0001}<10-10> texture component is present which disappears at the TD surface. The weak partial <10-10> fiber parallel to ED in the central region (Z5) develops a complete fiber on moving closer to the TD-surface. The typical double pole in the basal pole figure, which is known for rare earth Mg-alloys, was seen in the Mg-phase of the composite. This texture component results from <c + a> glide and is distributed very inhomogenously along the investigated gradient. The double pole rotates from ND to TD and is related to the local strain field. For Mg, as a material with a c/a ratio close to the ideal c/a ratio of the hexagonal close packed structure, the basal plane tends to orient parallel to the transport plane of the deformation process [24].

Author Contributions

S.S. designed and performed the synchrotron experiments and analyzed the data. The synchrotron experiments were supported by N.S., who is responsible for the HEMS beamline. The neutron measurements were performed by H.-G.B. S.S. also performed the sample prepration for microhardness tests and optical microspcopy. The manuscript was written by S.S. and intensively discussed with H.-G.B.

Funding

This study was supported by German Research Foundation (DFG) through grant number BR961/7-1.

Acknowledgments

The authors would like to thank Mr. Schnieber for his assistance in neutron diffraction experiments and Bernd Schwebke for his assistance in synchrotron diffraction experiments.

Conflicts of Interest

The authors declare no conflict of interest.

References

  1. Raabe, D.; Hangen, U. Correlation of microstructure and type II superconductivity of a heavily cold rolled Cu-20mass%Nb. Acta Mater. 1996, 44, 953–961. [Google Scholar] [CrossRef]
  2. Bergmann, H.W.; Frommeyer, G.; Wassermann, G. The dependence of the texture and microstructures in two-phase composites on the yield stresses of the components. In Book Texture of Materials; Gottstein, G., Lücke, K., Eds.; Springer: Berlin, Germnay, 2007; Volume 2, pp. 371–377. ISBN 0-387-09220-X. [Google Scholar]
  3. Xu, K.; Russell, A.M.; Chumbley, L.S.; Laabs, F.C.; Gantovnik, V.B.; Tian, Y. Characterization of strength and microstructure in deformation processed Al-Mg composites. J. Mater. Sci. 1999, 34, 5955–5959. [Google Scholar] [CrossRef]
  4. Kai, X. Microstructure and Strength of a Deformation Processed Al-20%Sn Metal-Metal Composite. Ph.D. Thesis, Iowa State University, Ames, IA, USA, 2003. [Google Scholar]
  5. Brokmeier, H.-G. Experimental textures of Al-Pb, Al-Cu, and Fe-Cu metal-metal composites. Mater. Sci. Eng. 1994, 175, 131–139. [Google Scholar] [CrossRef]
  6. Grewen, J.; Wassermann, G. Textur-Untersuchungen an Drähten I. Z. Metallkunde 1954, 45, 499–505. [Google Scholar]
  7. Vasudevan, A.K.; Frickee, W.G.; Malcolm, R.C. On through thickness crystallographic texture gradient in Al-Li-Cu-Zr alloy. Metall. Mater. Trans. A 1998, 19, 731–732. [Google Scholar] [CrossRef]
  8. Wassermann, G.; Schmid, E. Über die Textur hartgezogener Drähte. Z. Phys. 1972, 42, 779–794. [Google Scholar]
  9. Hirosawa, E.; Author, C.D. Fiber textures of extruded aluminum alloy rod. Tran. JIM 1964, 5, 235–238. [Google Scholar] [CrossRef]
  10. Brokmeier, H.-G.; Randau, C.; Gan, W.; Hofmann, M.; Lippmann, T.; Schell, N. Investigation of texture gradients of semi-finished products by neutrons. Mater. Sci. Forum Trans. Tech. Publ. 2011, 702, 499–506. [Google Scholar] [CrossRef]
  11. Bunge, H.-G. Advantages of neutron diffraction in texture analysis. Text. Microstruct. 1997, 10, 265–307. [Google Scholar] [CrossRef]
  12. Brokmeier, H.-G.; Randau, C.; Garbe, U.; Spalthoff, P.; Bohlen, J. Texture gradient in a bonelike extrusion profile of MgZe10. In Proceedings of the 8th International Conference on Magnesium Alloys and their Applications; Weimar, Germany, 26–29 October 2009, Kainer, K.U., Ed.; Wiley-VCH: Weimar, Germany, 2009. [Google Scholar]
  13. Brokmeier, H.-G.; Zink, U.; Schnieber, R.; Witassek, B. Texture Analysis at GKSS Research Center (Instrumentation and Application). In Book Texture and Anisotropy of Polycrystals; Schwarzer, R., Ed.; TTP Transtech Publications: Zürich, Switzerland, 1998; pp. 277–282. [Google Scholar]
  14. Chena, M.B.; Li, J.; Zhao, Y.M.; Yuan, H.; Liu, W.C. Comparison of texture evolution between different thickness layers in cold roled Al-Mg alloy. Mater. Charact. 2011, 62, 1188–1195. [Google Scholar] [CrossRef]
  15. Ghosh, M.; Miroux, A.; Kestens, L.A. Correlating r-value and through thickness texture in Al–Mg–Si alloy. J. Alloys Compd. 2015, 619, 585–591. [Google Scholar] [CrossRef]
  16. Liu, J.; Banovic, S.W.; Biancaniello, F.S.; Jiggetts, R.D. Through-Thickness Texture Gradient in an annealed Al-Mg alloy sheet. Metall. Trans. 2005, 36, 869–874. [Google Scholar] [CrossRef]
  17. Ondracek, G. Verbundwerkstoffe Phasenverbindung und mechanische Eigenschaften Band 1. In Book Verbundwerkstoffe Technologie und Prüfung; ERIK TONEN: Belgien, Belgium, 1985; pp. 7–22. [Google Scholar]
  18. Bolmaro, R.E.; Fourty, A.; Brokmeier, H.-G. Measurement and simulation of extrusion textures in Al-Mg composites. Mater. Sci. Forum 1999, 321–324, 621–625. [Google Scholar] [CrossRef]
  19. Yi, S. Investigation on the Deformation Behavior and the Texture Evolution in Magnesium Wrought Alloy AZ31. Ph.D. Thesis, TU Clausthal, Clausthal-Zellerfeld, Germany, 2005. [Google Scholar]
  20. Bunge, H.J. Texture Analysis in Materials Science, 3rd ed.; Cuvillier Verlag: Göttingen, Germany, 1993; ISBN 3-928815-81-4. [Google Scholar]
  21. Hammersley, A.P.; Svensson, S.O.; Hanfland, M.; Fitch, A.N.; Häusermann, D. Two-Dimensional Detector Software: From Real Detector to Idealised Image or Two-Theta Scan. High Press. Res. 1996, 14, 235–248. [Google Scholar] [CrossRef]
  22. Gan, W.; Huang, Y.; Yang, L.; Kainer, K.U.; Jiang, M.; Brokmeier, H.-G.; Hort, N. Identification of unexpected hydrides in Mg–20 wt% Dy alloy by high-brilliance synchrotron radiation. J. Appl. Cryst. 2012, 45, 17–21. [Google Scholar] [CrossRef]
  23. Hirsch, J.; Lücke, K. Mechanism of deformation and development of rolling textures in polycrystalline F.C.C. metals. Acta Metall. 1988, 36, 2883–2904. [Google Scholar] [CrossRef]
  24. Brokmeier, H.-G. Hot rectangular extrusion textures of six Mg-alloys via neutron diffraction. Adv. Eng. Mater. 2017. [Google Scholar] [CrossRef]
  25. Hantzsche, K.; Bohlen, J.; Wendt, J.; Kainer, K.U.; Yi, S.B.; Letzig, D. Effect of rare earth additions on microstructure and texture development of magnesium alloy sheets. Scr. Mater. 2010, 63, 725–730. [Google Scholar] [CrossRef]
  26. Wang, Y.N.; Huang, J.C. Texture analysis in hexagonal materials. Mate. Chem. Phys. 2003, 81, 11–26. [Google Scholar] [CrossRef]
  27. Gertel-Kloos, H.; Brokmeier, H.-G. Texture and phase development in Al-40at% Ni Composites. Mater. Sci. Forum 1994, 157–162, 515–520. [Google Scholar] [CrossRef]
  28. Schläfer, U.; Bunge, H.J. Cyclic Textures in Aluminium wires. Texture 1972, 1, 31–49. [Google Scholar] [CrossRef]
  29. Tempus, G.; Scharf, G.; Calles, W. Influence of extrusion process parameters on the mechanical properties of Al-Li-Extrusions. J. Phys. Colloq. 1987, 48, 187–193. [Google Scholar] [CrossRef]
  30. Przystupa, M.A.; Vasudēvan, A.K.; Rollet, A.D. Crystallographic texture gradients in the aluminum 8090 matrix alloy and 8090 particulate composites. Mater. Sci. and Eng. 1994, A186, 35–44. [Google Scholar] [CrossRef]
  31. Zhong, Z.Y.; Brokmeier, H.-G.; Maawad, E.; Schell, N. Texture Dependent Lattice Strains and Texture Gradient in Al7020. In Proceedings of the 17th International Conference on Textures of Materials (ICOTOM17), Dresden, Germany, 24–29 August 2014. [Google Scholar]
  32. Griffiths, D.G. Explaining texture weakening and improved formability in magnesium rare earth alloys. Mater. Sci. Technol. 2015, 31, 10–24. [Google Scholar] [CrossRef]
  33. Agnew, S.R.; Duygulu, Ö. Plastic anisotropy and the role of non-basal slip in magnesium alloy AZ31B. Int. J. Plast. 2005, 21, 1161–1193. [Google Scholar] [CrossRef]
  34. Mackenzie, L.W.F.; Pekguleryuz, M.O. The recrystallization and texture of magnesium–zinc–cerium alloys. Scr. Mater. 2008, 59, 665–668. [Google Scholar] [CrossRef]
  35. Agnew, S.R.; Yoo, M.H.; Tome, C.N. Application of texture simulation to understanding mechanical behavior of Mg and solid solution alloys conatining Li or Y. Acta Mater. 2001, 49, 4277–4289. [Google Scholar] [CrossRef]
  36. Steiner, M.A.; Bhattachary, J.J.; Agnew, S.R. The origin and enhancement of <0001>{11 2 ¯ 0} texture during heat treatment of rolled AZ31B magnesium alloys. Acta Mater. 2015, 95, 443–455. [Google Scholar] [CrossRef]
  37. Pérez-Prado, M.T.; del Valle, J.A.; Ruano, O.A. Effect of sheet thickness on the microstructural evolution of an Mg AZ61 alloy during large strain hot rolling. Scr. Mater. 2004, 50, 667–671. [Google Scholar] [CrossRef]
Figure 1. Schematic sketch of material production.
Metals 09 00167 g001
Figure 2. Texture measurement using synchrotron radiation.
Metals 09 00167 g002
Figure 3. The microstructure and position of micro hardness tests. (a) Z1:1 mm; (b) Z2:3.15 mm; (c) Z3:5.3 mm; (d) Z4:7.45 mm; (e) Z5:9.6 mm below the surface.
Metals 09 00167 g003
Figure 4. The synchrotron diffraction pattern of Al60Mg40.
Metals 09 00167 g004
Figure 5. (a) Al-texture presented as ODF section φ2 = 45° and as Mg pole figures. (b) (0002) and (c) (10-10).
Metals 09 00167 g005
Figure 6. ODF sections in increments of φ2 = 45° measured by synchrotron radiation for Al in rectangular cold extruded Al60Mg40. (a) 1 mm, (b) 3.15 mm, (c) 5.3 mm, (d) 7.45 mm, (e) 9.16 mm below the surface.
Metals 09 00167 g006
Figure 7. The β-fiber plot of Z1 to Z5.
Metals 09 00167 g007
Figure 8. The α-fiber plot of Z1 to Z5.
Metals 09 00167 g008
Figure 9. Texture gradients of the Mg-phase in Al60Mg40, presented by (0002), (10-10) and (11-20) Mg pole figures; (a) 1 mm, (b) 3.15 mm, (c) 5.3 mm (d) 7.45 mm and (e) 9.6 mm below the surface.
Metals 09 00167 g009
Figure 10. Transition from β-fiber to the <111> // ED fiber.
Metals 09 00167 g010
Figure 11. Pole rotation of (0002) pole figure of Mg.
Metals 09 00167 g011

