Abstract
In this paper, we demonstrate that trace amounts of P addition can activate the sintering of carbonyl powder and influence the magnetic properties of the sintered materials. Fe-x P (x = 0, 0.6, 0.8, 1.0, 1.2, 1.4, and 1.6 wt.%) samples were fabricated by doping carbonyl powder with different amounts of Fe3P. They were sintered at 1000 °C in argon for 2 h. The sintering of the Fe-0 wt.% P sample was interrupted by the ferrite-austenite transformation at 912 °C due to the low diffusion rate of the austenite. The addition of P can stabilize the ferrite, and suppress the ferrite-austenite transformation. Therefore, all the P-containing samples shrank continuously throughout the whole sintering process, which showed improved sintering densities compared to the P-free sample. However, the sintering density did not increase monotonously with increasing P content. The Fe-1.4 wt.% P and Fe-1.6wt.% P samples easily got oxidized during sintering, and the densification process was thus influenced by the P-containing oxide particles. As a result, the Fe-1.2 wt.% P sample exhibited the highest sintering density (7.664 g/cm3) and the best magnetic properties (coercive force 172 A/m).
1. Introduction
Fe-based soft magnetic materials are widely used in electronic, computer, and telecommunication industries due to their quick magnetization and demagnetization, high permeability, and high magnetic induction in a weak magnetic field [1,2,3,4,5,6,7]. Wrought process is a traditional method for processing Fe-based soft magnetic materials. However, it is not a net shape fabrication method, and thus not suitable for the fabrication of magnetic components with complicated shape [8,9,10]. As an alternative, powder metallurgy is more effective and economical in mass production of parts with miniature structures and a complex shape [11,12]. Therefore, it has been applied to the fabrication of various Fe-based soft magnetic materials [13,14,15].
The sinterability of pure iron is not good [16,17]. Pure iron needs to be sintered at high temperatures in order to produce soft magnetic materials with high density, high permeability, and low coercivity [18]. To meet this end, a technology called δ-phase sintering process has been invented and used to facilitate the sintering of pure iron. When the pure iron is sintered at 1400 °C, its structure is transformed into δ-phase with a BCC (body-centered cubic) structure, which has a lower atomic packing density than FCC (face-centered cubic) γ-phase, therefore resulting in an improved self-diffusivity and higher sintered density. A relative density of 99.8% and good magnetic properties are obtained from pure iron by the use of this method [19].
The sintering density and magnetic performances of iron can also be improved by the addition of alloying elements, such as Ni and Si [20,21,22,23,24]. Therefore, a lot of research focuses on the sintering process of Fe-50%Ni [22,25] and Fe-Si [21], and the influence of interstitial elements, such as O, C and N, on their magnetic properties. Phosphorus is also an important alloying element for Fe-based soft magnetic material. Fe-P alloys are well known for their low coercivity, high permeability, and good workability. Moreover, P can improve the sinterability of iron and Fe3P is used widely in industry as a sintering aid for iron-based alloys. The addition of P ranging from 0.3 wt.% to 8 wt.% has been studied [2,3,5,8,15,16,26,27]. Additionally, the influence of P on the sintering process of Fe-Ni and Fe-Si alloys has been investigated, which proves that the addition of P can help Ni and Si diffusing into the Fe matrix and thus improve the magnetic properties [15,22,28,29].
However, there is a disadvantage of using P in high-temperature sintering. Phosphorous has a very low boiling point, ~280 °C, and therefore is a volatile element at elevated temperatures. Nevertheless, current research indicates that most of the Fe-based soft magnetic materials need to be produced at temperatures higher than 1200 °C, and the loss of P at the sintering temperature is significant [2,5,9,15,26,30,31]. Therefore, it is useful to develop a technology which can produce Fe-P alloys at relatively low temperatures. In this research, we used P to stablish the BCC structure of α-Fe and optimize the sintering parameters of Fe-P alloys. Fe-P alloys with good density were successfully produced at 1000 °C. This research can shed light on the low-temperature sintering process of Fe-P alloys.
2. Experimental Procedure
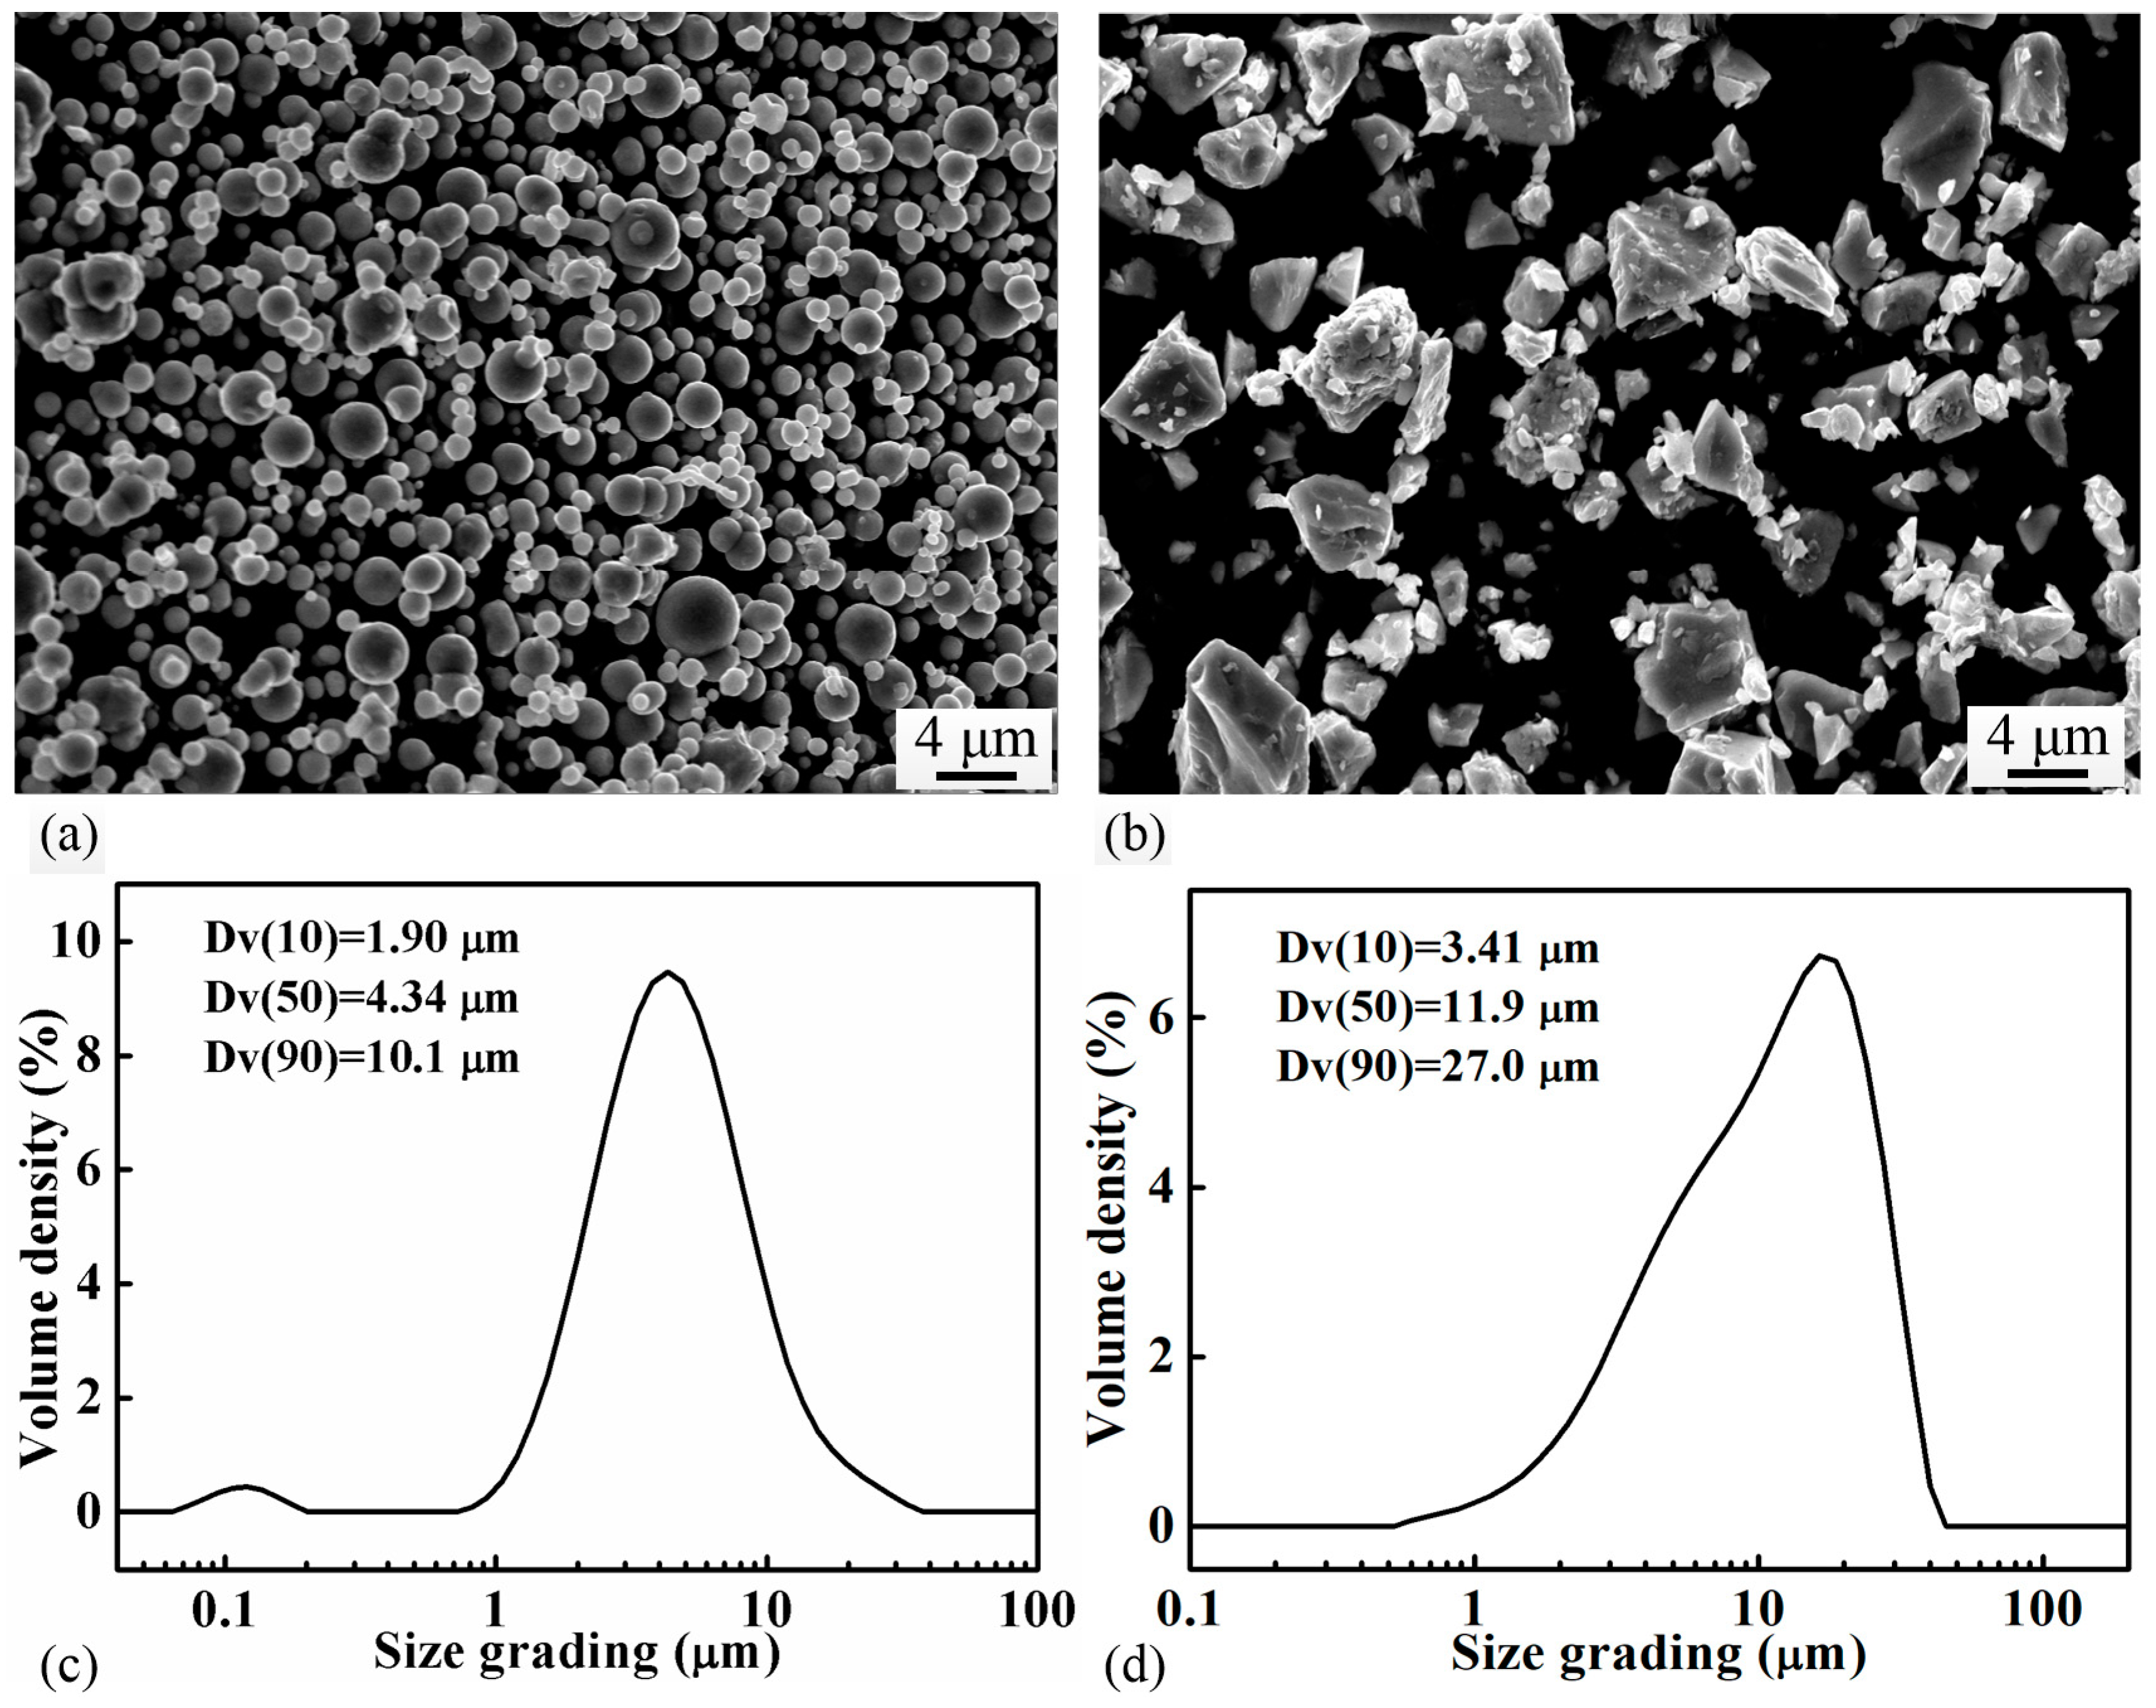
Carbonyl iron powder (D50 = 4.34 μm, Yuean, China) and Fe3P (D50 = 11.90 μm, produced in-house) powder were used as raw materials. The particle size of the powders was measured by a laser particle size analyzer (Mastersizer3000, Malvern, UK). The morphology of the powders was observed by using a scanning electron microscope (SEM, ZEISS, EVO 10, Oberkochen, Germany). Figure 1 shows the SEM micrographs and particle size distribution of both powders. The carbonyl powder is spherical in shape, while the Fe3P powder, produced by crashing the casting ingot, has an irregular morphology. Six batches of powder mixtures with different nominal compositions (Fe with 0, 0.6, 0.8, 1.0, 1.2, 1.4, and 1.6 wt.% P, respectively) were produced by blending the carbonyl iron powder with different amounts of Fe3P in a 3D mixer (Willy A. Bachofen AG Maschinenfabrik, TURBULAT2F, Muttenz, Switzerland) for 8 h. Subsequently, the powder mixture was compacted in a cold-pressing machine under a pressure of 400 MPa to produce cylindrical green samples (Ø10 mm × 10 mm). The sintering behaviors of the green samples were studied in a dilatometer (DIL, NETZSCH, 402 C, Freistaat Bayern, Germany), where the samples were heated under flowing argon at a rate of 5 °C/min to different temperatures (900~1300 °C) and soaked at the temperature for different times (0.5–5 h).
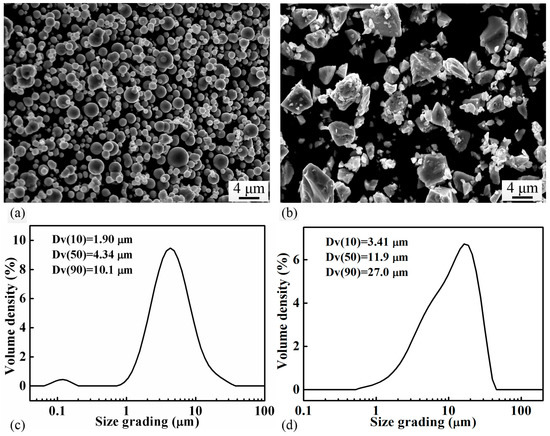
Figure 1.
Micrographs showing the morphology of (a) the carbonyl iron powder, (b) the Fe3P powder; and particle size distribution of (c) the carbonyl iron powder, (d) the Fe3P powder.
After sintering in the DIL, the microstructures of the sintered samples were observed by using a scanning electron microscope (SEM, ZEISS, EVO 10, Oberkochen, Germany). The compositions of the samples were analyzed by using the energy dispersive spectroscopy (EDS, Oxford Instrument, model, Oxford, UK) with which the SEM was equipped. The grain sizes of the sintered samples were measured from the SEM micrographs through image analysis. The sintering density of samples were measured by using a density balance (METTLER TOLEDO, Practum 224-1 CN, Zurich, Switzerland) according to Archimedes’ principle. The enthalpy variation of the samples during sintering was measured by a simultaneous thermal analyzer (STA, NETZSCH, 400F3, Freistaat Bayern, Germany) equipped with a differential scanning calorimetry (DSC, NETZSCH, 400F3, Freistaat Bayern, Germany) detector. In order to evaluate the soft magnetic properties of the sintered samples, their coercive forces were determined by a coercimeter (TOHOKU, K-HC1000, Sendai, Japan).
3. Experimental Results
3.1. Effects of Sintering Parameters and P Contents on the Sintering Density
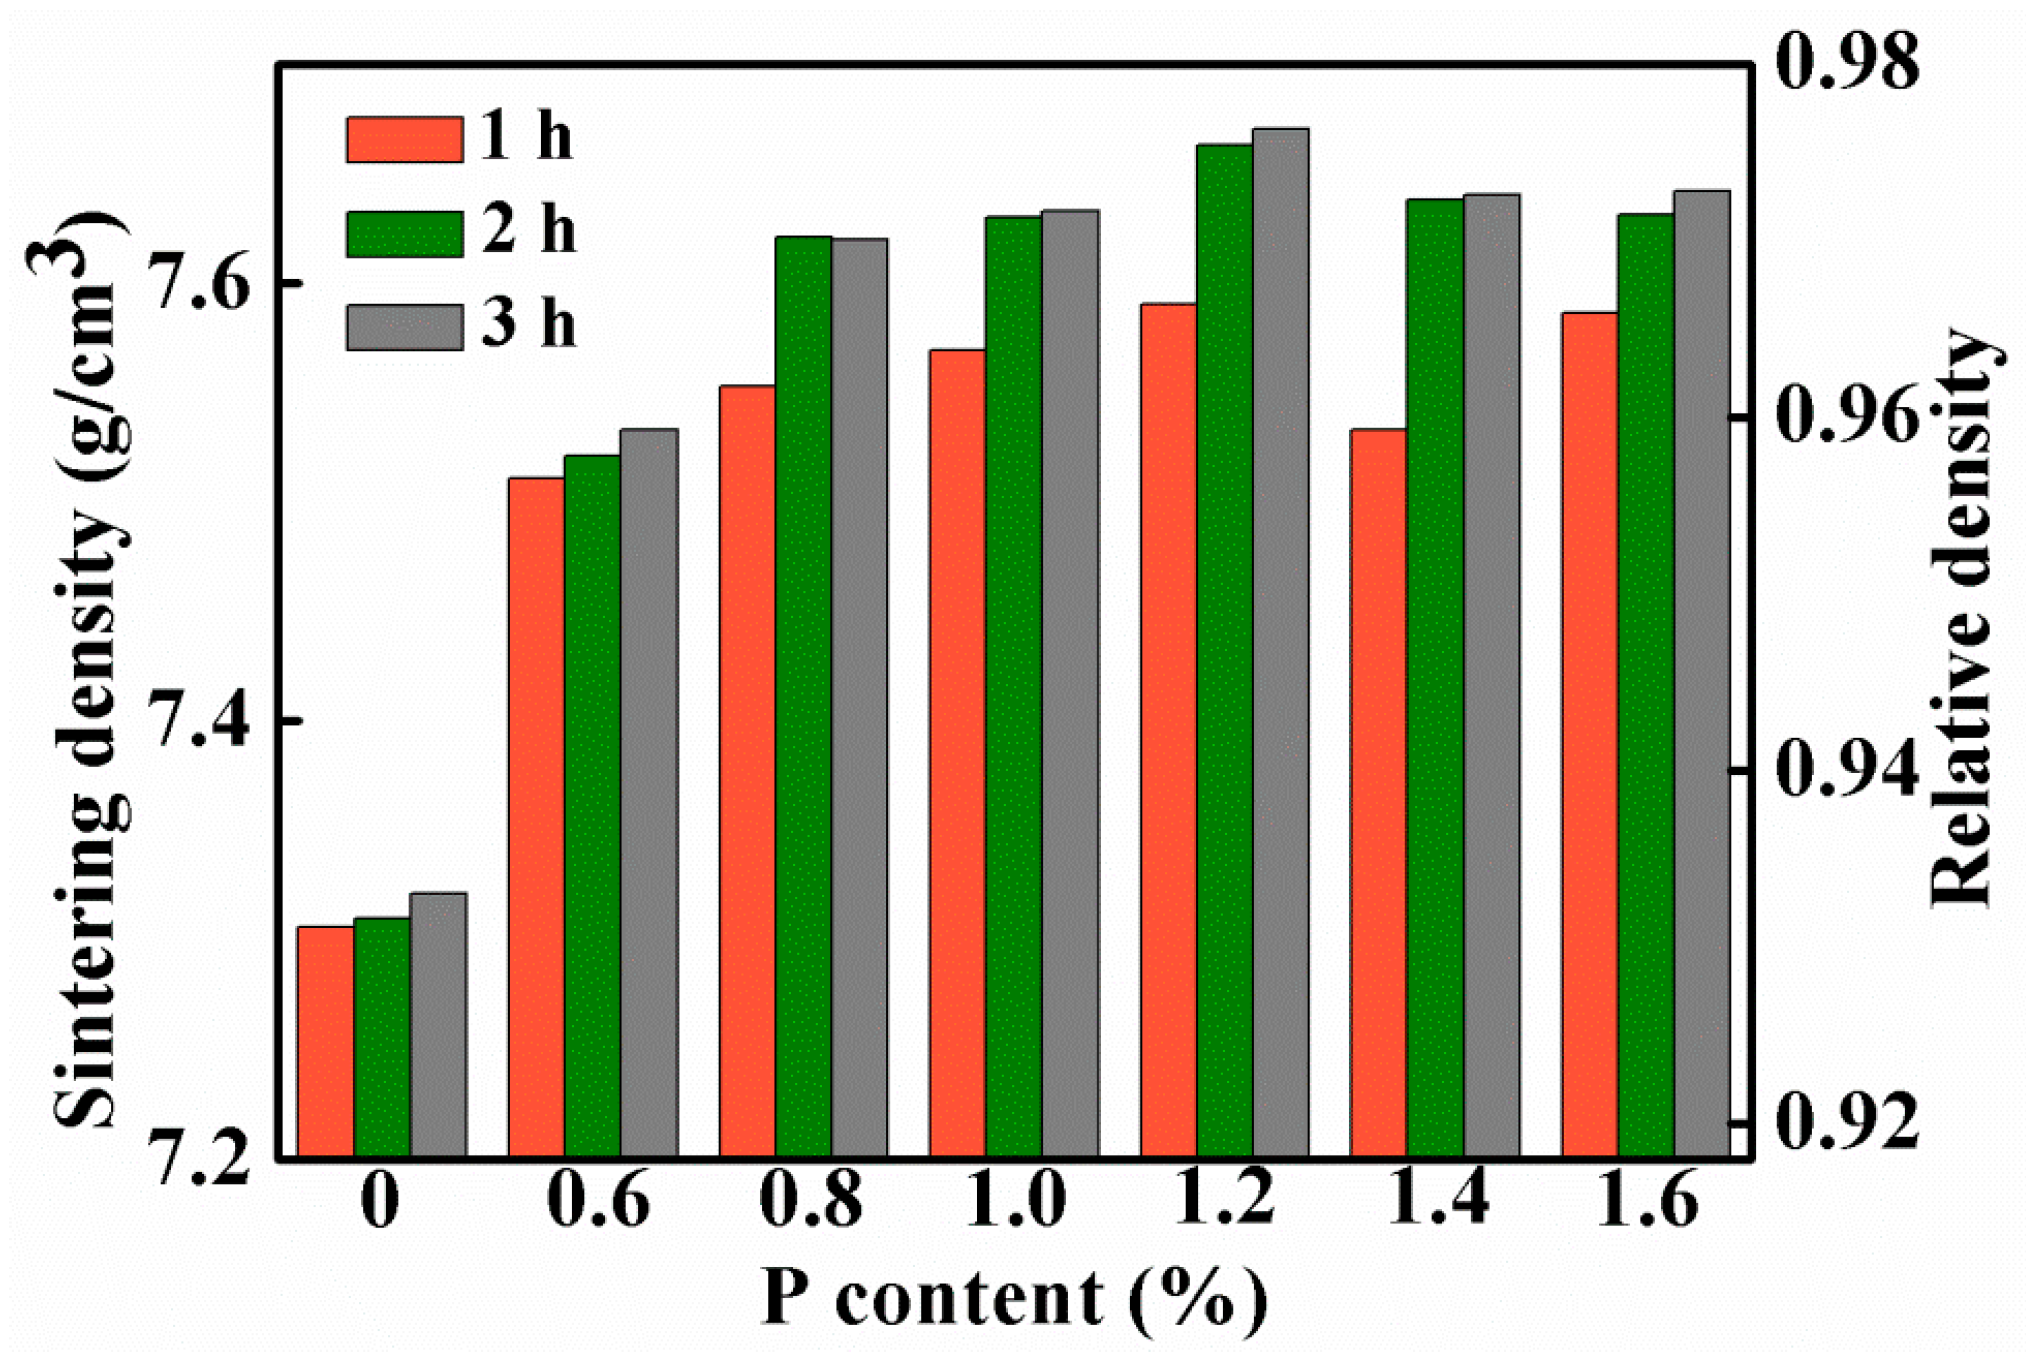
Figure 2a shows the sintering densities of the Fe-0.8%P samples sintered to different temperature ranging from 900 to 1300 °C. The sintering density of samples increases gradually with the increasing of sintering temperature. When the temperature increased from 900 to 1000 °C, sintering density increased sharply from 7.50 g/cm3 (relative density 95.5%) to 7.63 g/cm3 (relative density 97.2%). However, the sintering density increased slowly with the sintering temperature above 1000 °C. Figure 2b shows the influence of soaking time on the sintering density of the Fe-0.8%P sample. Two groups of samples were sintered at 900 to 1000 °C separately, and held at the temperatures for different periods of times (ranging from 0.5 to 5 h). At both temperatures, the sintering density increased with soaking time. The influence of soaking time was significant when the soaking time was shorter than 2 h. When the soaking time increased from 0.5 to 2 h, the sintering density of the sample sintered at 900 °C increased from 7.44 to 7.53 g/cm3, while those sintered at 1000 °C increased from 7.56 to 7.64 g/cm3. However, further prolonging the soak time only increased the sintering density slightly. Based on the results shown above, samples with different P contents (0, 0.6, 0.8, 1.0, 1.2, 1.4, and 1.6 wt.%) were sintered at 1000 °C for different periods of time (1, 2, and 3 h). The green densities and sintering densities of the samples are listed in Table 1 and Table 2 respectively. The sintering densities are also shown in Figure 3. As what have already been found in Figure 2b, the sintering densities of samples with different P contents all increased with soaking time. Moreover, Figure 3 indicates that the addition of a small amount of P can improve the sinterability of the carbonyl powder significantly. With only a 0.6% addition of P, the density of the sample sintered at 1000 °C for 3 h increased from 7.32 to 7.53 g/cm3. In the meantime, the corresponding relative density increased from 93.3% to 96.0%. When the P content increased to 1.0%, the sintering density of the sample increased further to 7.67 g/cm3. However, further addition of P had an adverse effect on the sintering density. As a result, the sintering densities of samples containing 1.4 and 1.6 wt.% of P were lower than that of the 1.2 wt.% sample.
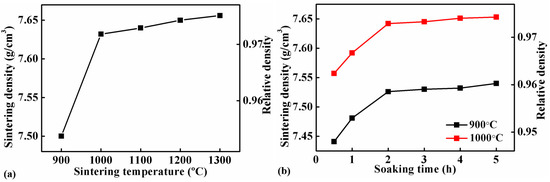
Figure 2.
Sintering densities of Fe-0.8%P samples sintered at different temperatures for 2 h (a), and those sintered at 900 °C and 1000 °C for different periods of time (b).

Table 1.
A summary of green densities of Fe-x P (x = 0, 0.6, 0.8, 1.0, 1.2, 1.4, and 1.6 wt.%) samples sintered at 1000 °C for different times.
Table 2.
A summary of sintering densities of Fe-x P (x = 0, 0.6, 0.8, 1.0, 1.2, 1.4 and 1.6 wt.%) samples sintered at 1000 °C for different time.
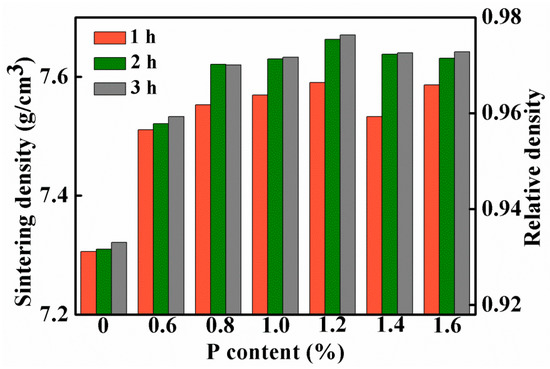
Figure 3.
Sintering densities of samples with different P contents, which are sintered at 1000 °C for 1, 2, and 3 h.
3.2. Thermal Analysis
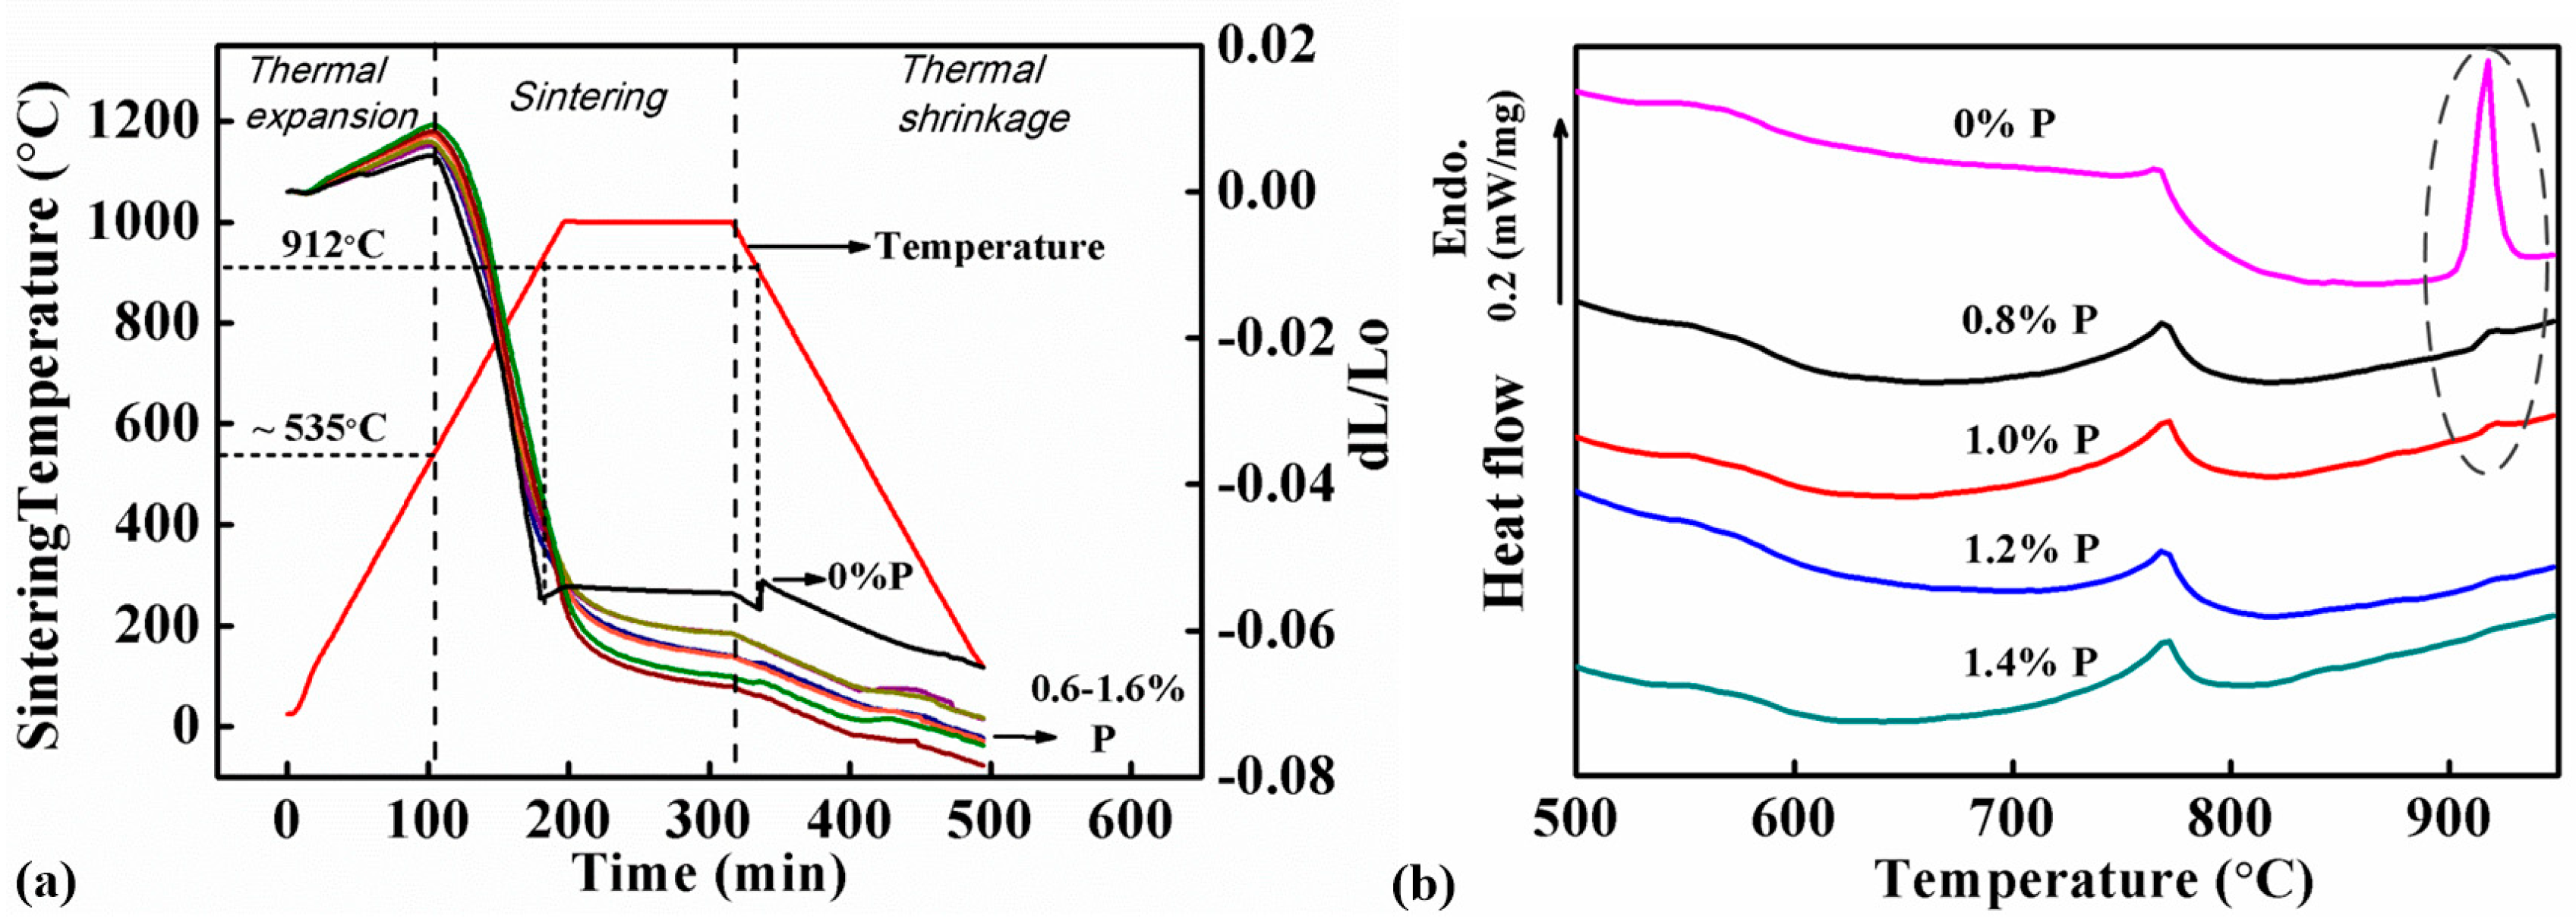
Figure 4a shows the DIL curves of samples with different P contents (0, 0.6, 0.8, 1.0, 1.2, 1.4 and 1.6 wt.%). All the samples showed expansion when they were heated from RT (room temperature) to ~535 °C. The expansion rates in this stage varied from 0.96 × 10⁻⁵ to 1.79 × 10⁻⁵ K−1, which were caused by thermal expansion of the samples. The samples started to be sintered when the sintering temperature was higher than 550 °C. The thermal expansion was offset by the shrinkage caused by sintering, therefore the expansion slowed down and finally changed to shrinkage.
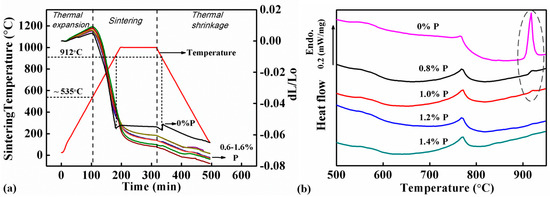
Figure 4.
Analysis results: (a) Dilatometer (DIL) curves of samples with different P contents and the corresponding temperature profile, which indicate that the sintering of the Fe-0%P sample was interrupted at 912 °C, but the Fe-0.6–1.6%P samples shrank continuously during sintering, and (b) differential scanning calorimetry (DSC) curves of samples with different P contents scanned from RT (room temperature) to 950 °C at a heating rate of 15 °C/min, which reveal an endothermic peak at 912 °C corresponding to the ferrite-austenite reaction in the Fe-0%P sample. The endothermic peak became smaller or disappeared completely in all the P-containing samples.
The samples exhibited different sintering behaviors with the addition of P. The sintering of the P-free sample suddenly stopped at 912 °C, and the sample’s dimension remained almost unchanged when the samples were soaked at 1000 °C subsequently. However, the sintering interruption did not occur in the 6 P-containing samples. They continued shrinking at above 912 °C and the following 1000 °C soaking. The difference between the P-free and P-containing samples was observed in the cooling stage as well. All the samples shrank due to thermal shrinkage. The P-containing samples shrank continuously in this stage, but the shrinkage of the P-free sample was interrupted at 912 °C by a sudden jump in its DIL curve. Due to the influence of P, the P-containing samples exhibited larger shrinkage in the whole furnace cycle than the P-free sample. This confirms that the addition of P benefited the sintering and the DIL results accord well with the sintering density data shown in Figure 3.
Figure 4b shows the DSC curves of samples with 0.8, 1.0, 1.2, and 1.4 wt.% of P when they were scanned from RT to 1000 °C in argon. An endothermic peak was found at 770 °C, which was obviously corresponding to the magnetic transformation when the samples reached the Curie point of Fe. Apart from that, another endothermic peak was found at 910 °C in the DSC curves of the P-free sample and those containing P less than 1.0 wt.%. It was caused by the phase transformation of Fe from ferrite to austenite. However, this peak was missing in the DSC curves of the two samples containing 1.2 and 1.4 wt.% P.
3.3. Magnetic Properties
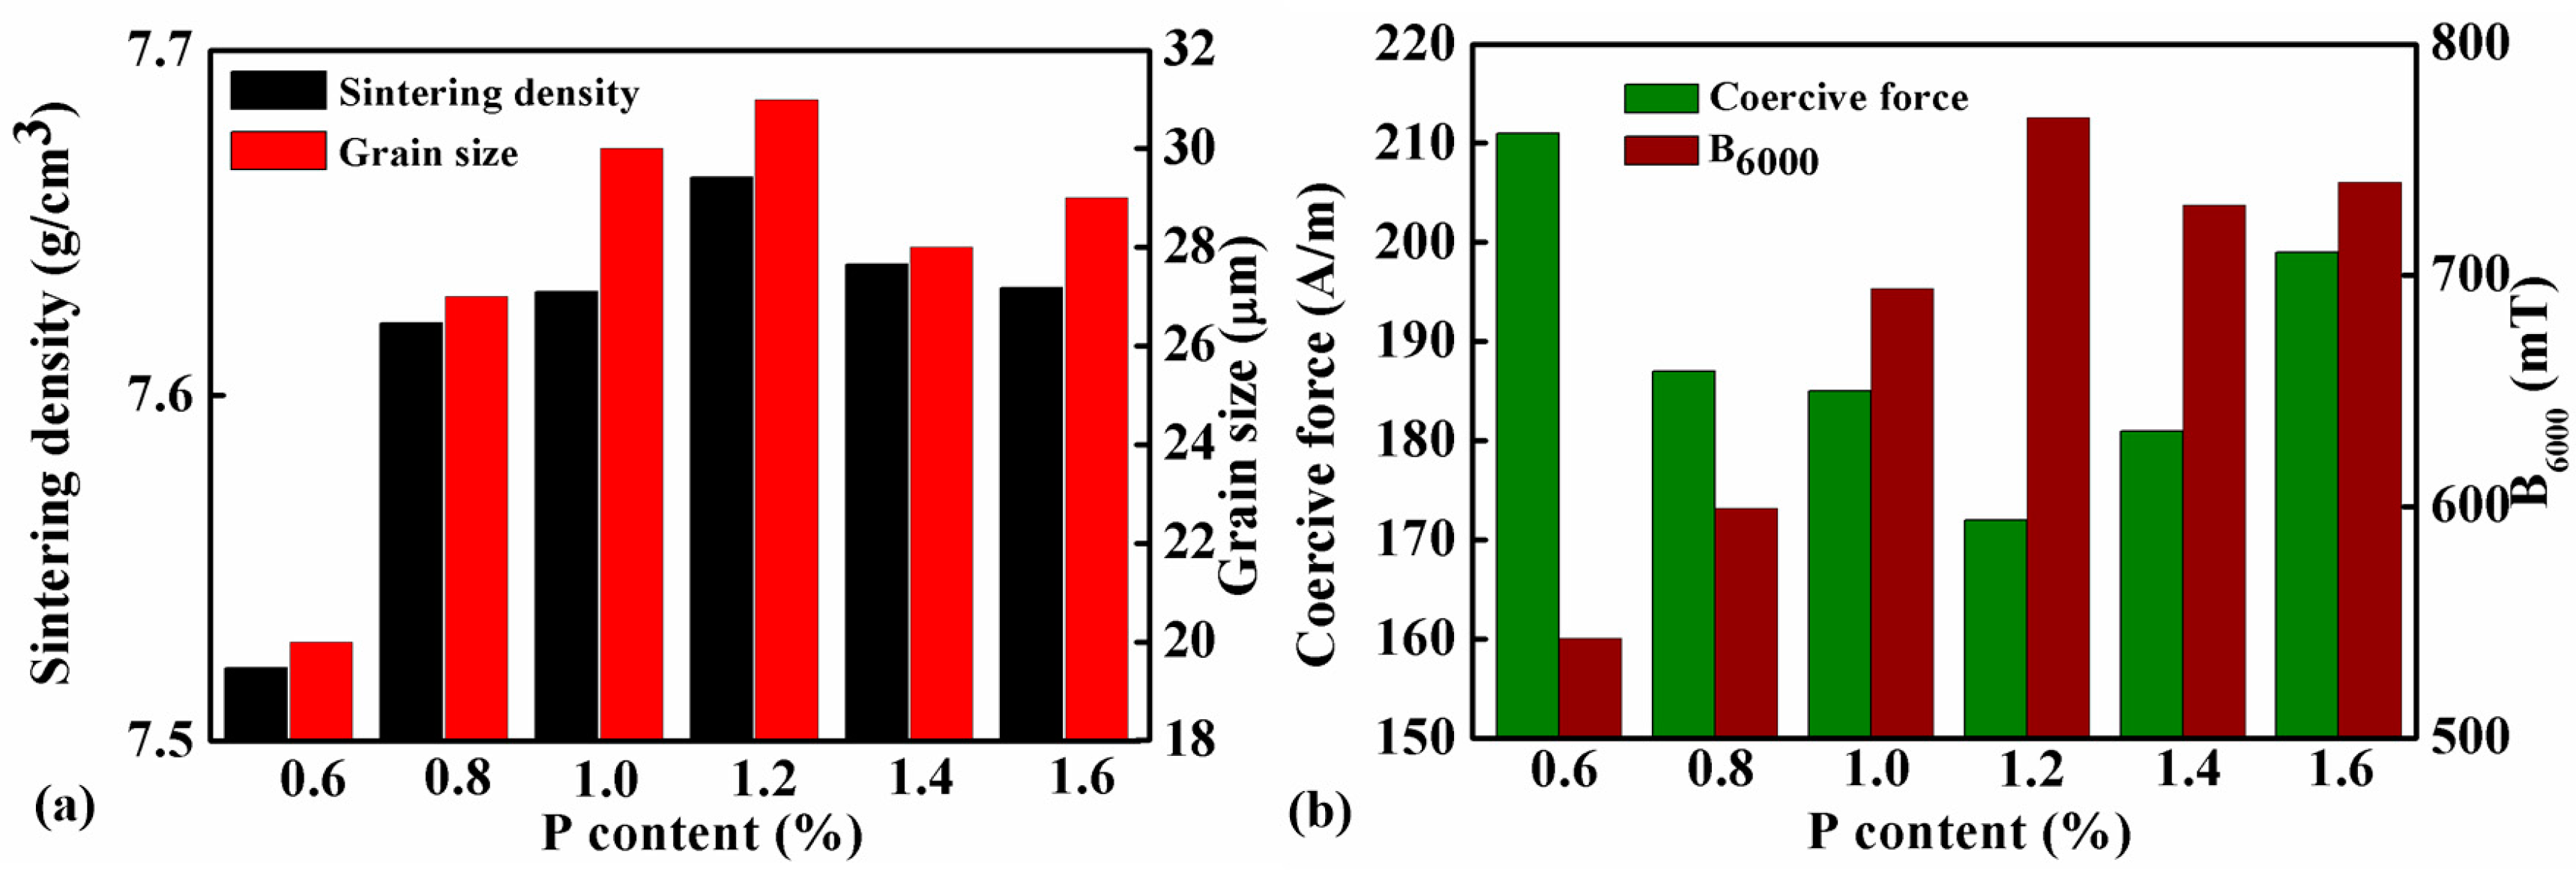
Table 3 lists the coercive force and magnetic induction under 6000 A/m (B6000) of samples with different amounts of P addition which were sintered at 1000 °C for 2 hr. The data are plotted together with the sintered density in Figure 5a,b. Apparently, the magnetic property and the sintering density of the material are positively correlated. When the addition of P increasing from 0.6 to 1.2 wt.%, the density of the sample increased from 7.31 to 7.66 g/cm3. In the meantime, the coercive force of the sample decreased from 211 to 172 A/m, and the magnetic induction increased from 543 to 768 mT. However, further increase of P content will adversely change the trend. Therefore, the sintering density, coercive force, and magnetic induction of the sample with 1.6 wt.% P were 7.63 g/cm3, 199 A/m, and 740 mT, respectively, which are all inferior to the sample with 1.2 wt.% P.
Table 3.
A summary of coercive forces, magnetic induction, and grain size of Fe-x P (x = 0, 0.6, 0.8, 1.0, 1.2, 1.4, and 1.6 wt.%) samples sintered at 1000 °C for 2 h.

Figure 5.
(a) Sintering densities and grain sizes, (b) coercive force and magnetic induction under 6000 A/m (B6000) of samples with different P contents sintered at 1000 °C for 2 h.
3.4. Microstructure Observation
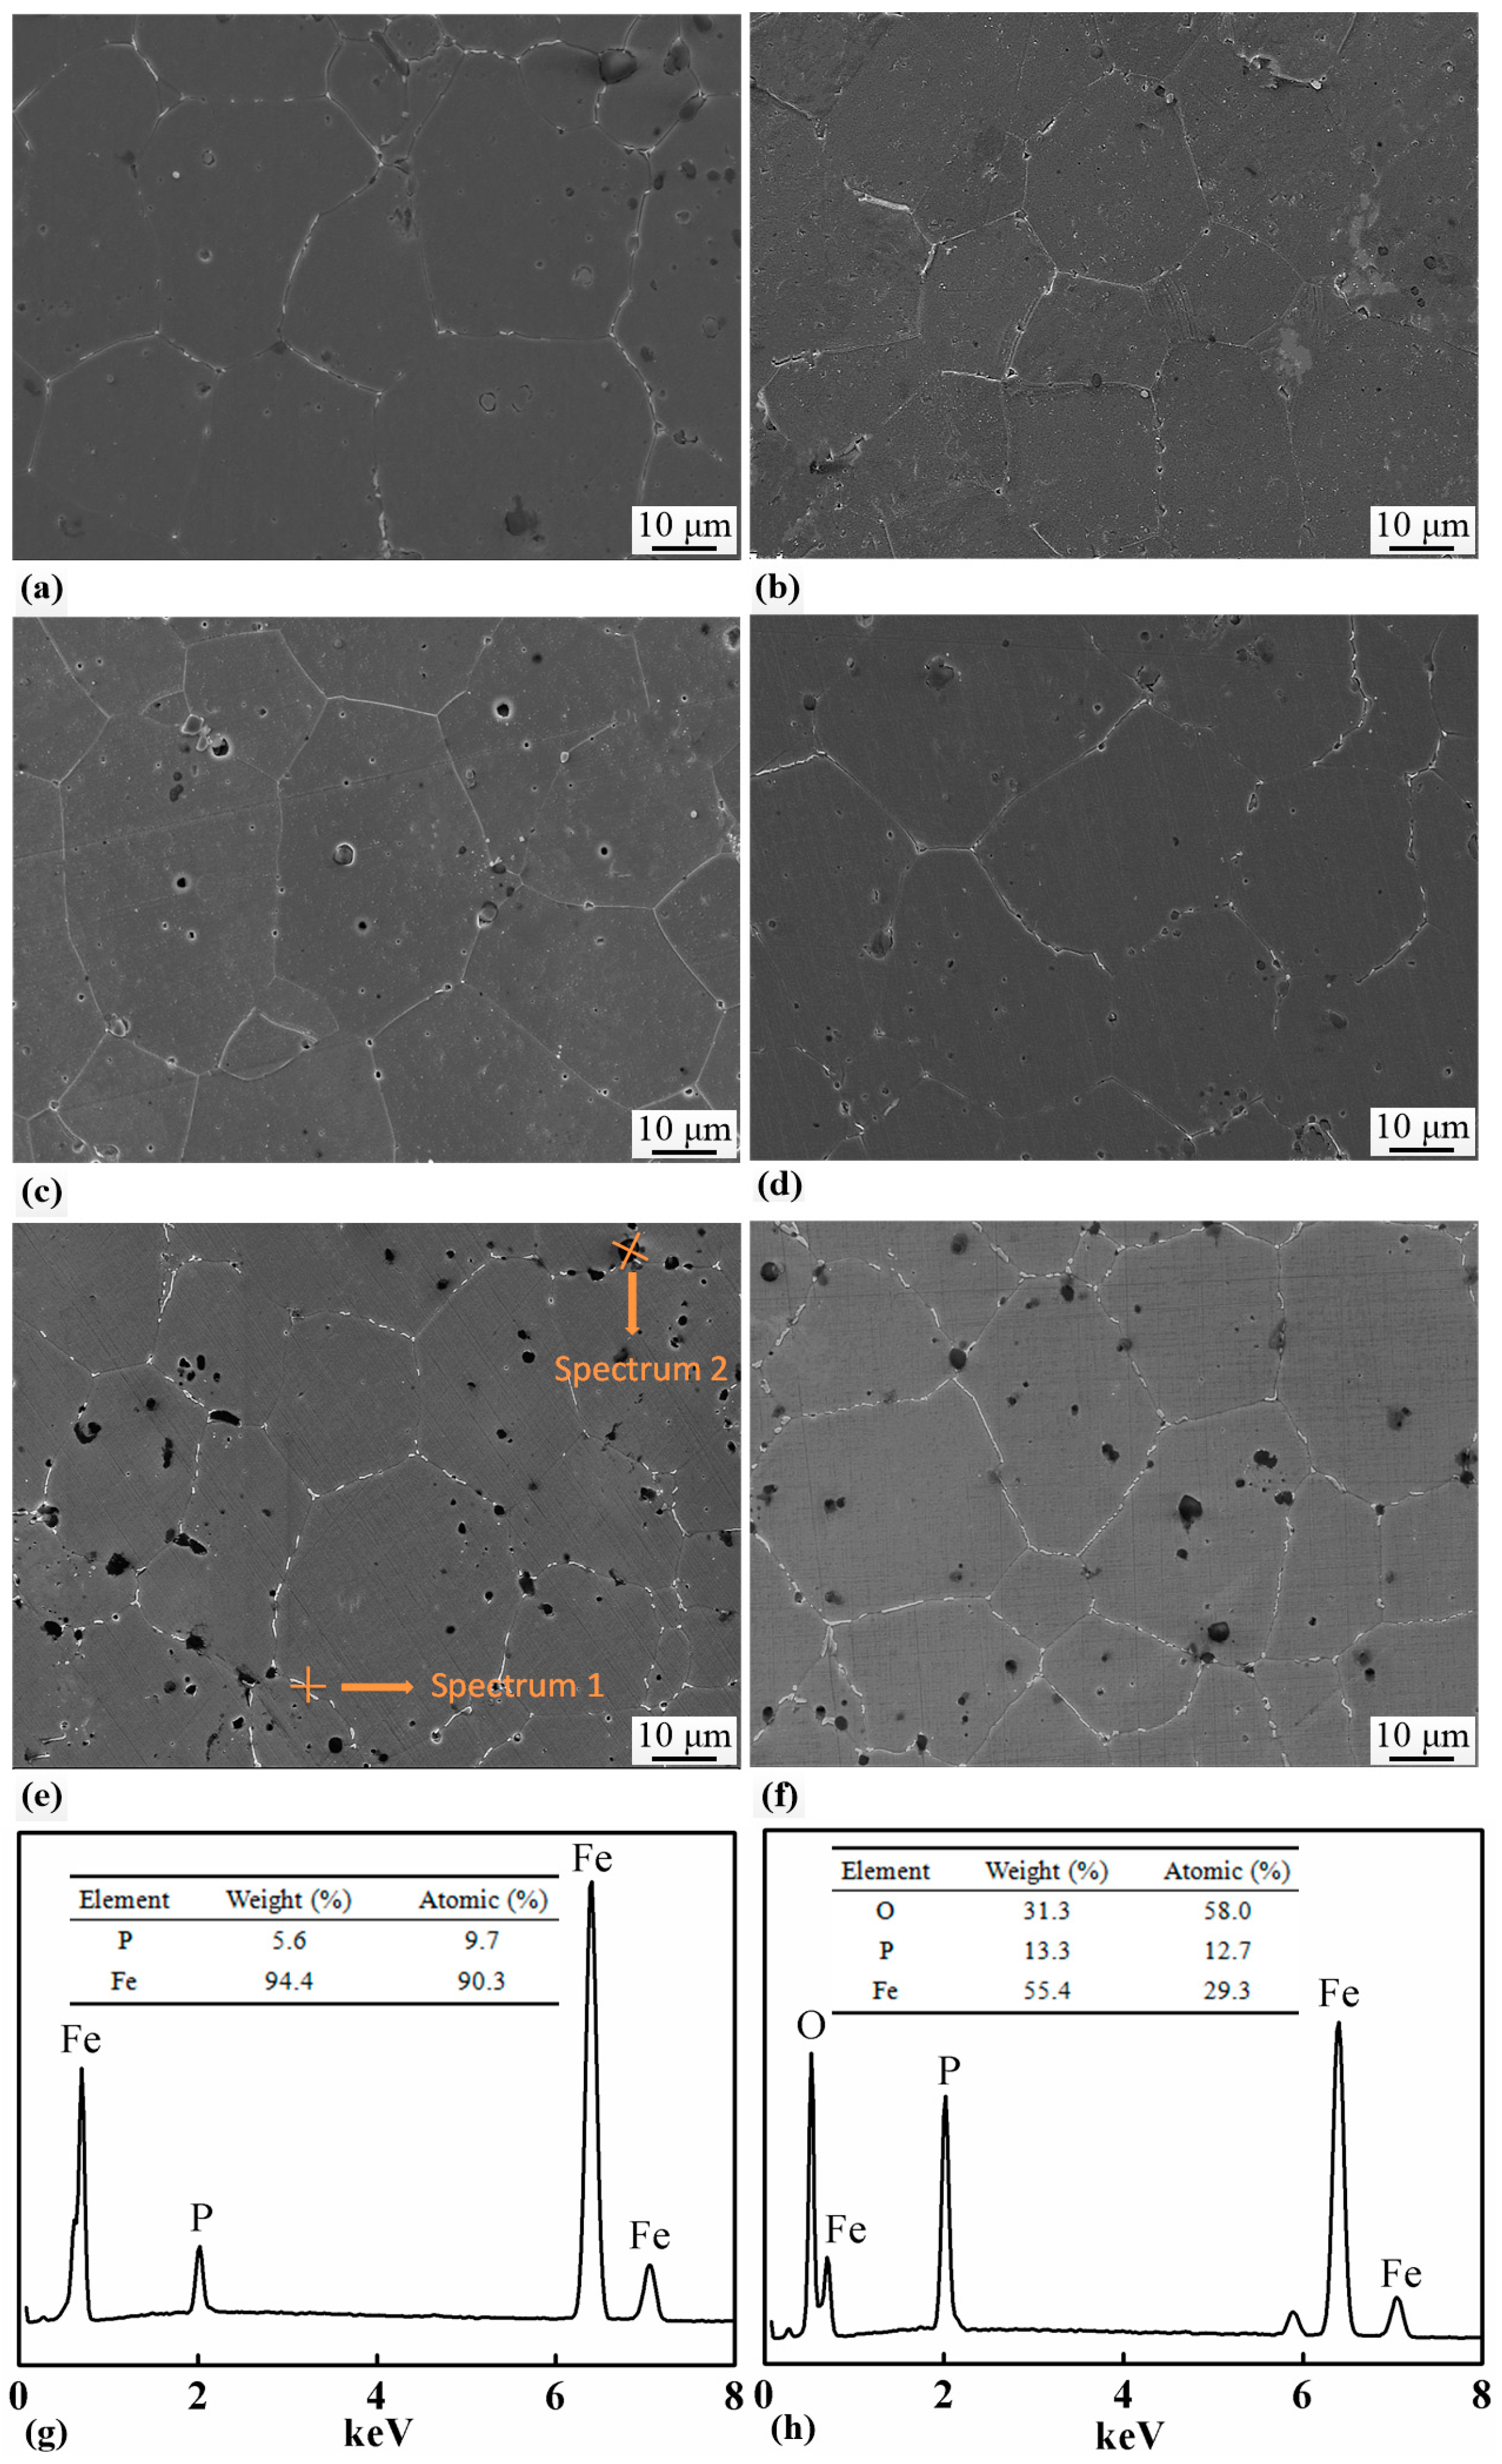
The SEM micrographs of the samples with 0.8, 1.0, 1.2, and 1.4 wt.% of P, which were sintered at 1000 °C for 2 h, are shown in Figure 6. All the samples had equiaxial grains with white precipitates distributed along the grain boundaries. The grain sizes were measured and the results are listed in Table 3 and shown in Figure 5a as well. Increase in P content had little effect on the grain size of the sintered samples. In the samples with 1.2 and 1.4 wt.% of P, black particles with a size of several microns were formed, which were found either along the grain boundaries or inside the grains. EDS was carried out on the grain boundary precipitates and the black particles. The results are shown in Figure 6g,h, and suggest that the grain boundary precipitates only contain Fe and P, while the black particles are a kind of complex oxides of Fe and P.
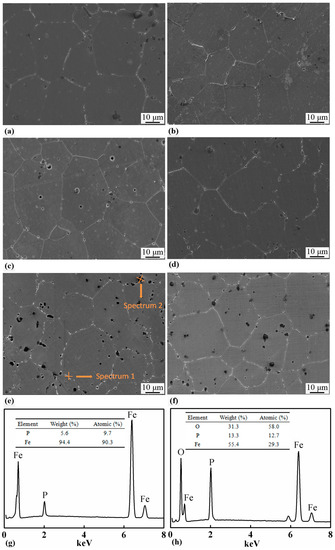
Figure 6.
SEM micrographs of samples with (a) 0.6 wt.%, (b) 0.8 wt.%, (c) 1.0 wt.%, (d) 1.2 wt.%, (e) 1.4 wt.%, and (f) 1.6 wt.% contents of P, which were sintered at 1000 °C for 2 h. P-rich bright precipitates were distributed along grain boundaries in all the samples and P-containing black particles were seen in the Fe-1.4 wt.% and Fe-1.6 wt.% samples. EDS spectra revealed the chemical compositions of the bright precipitates (g) and the black particles (h).
4. Discussion
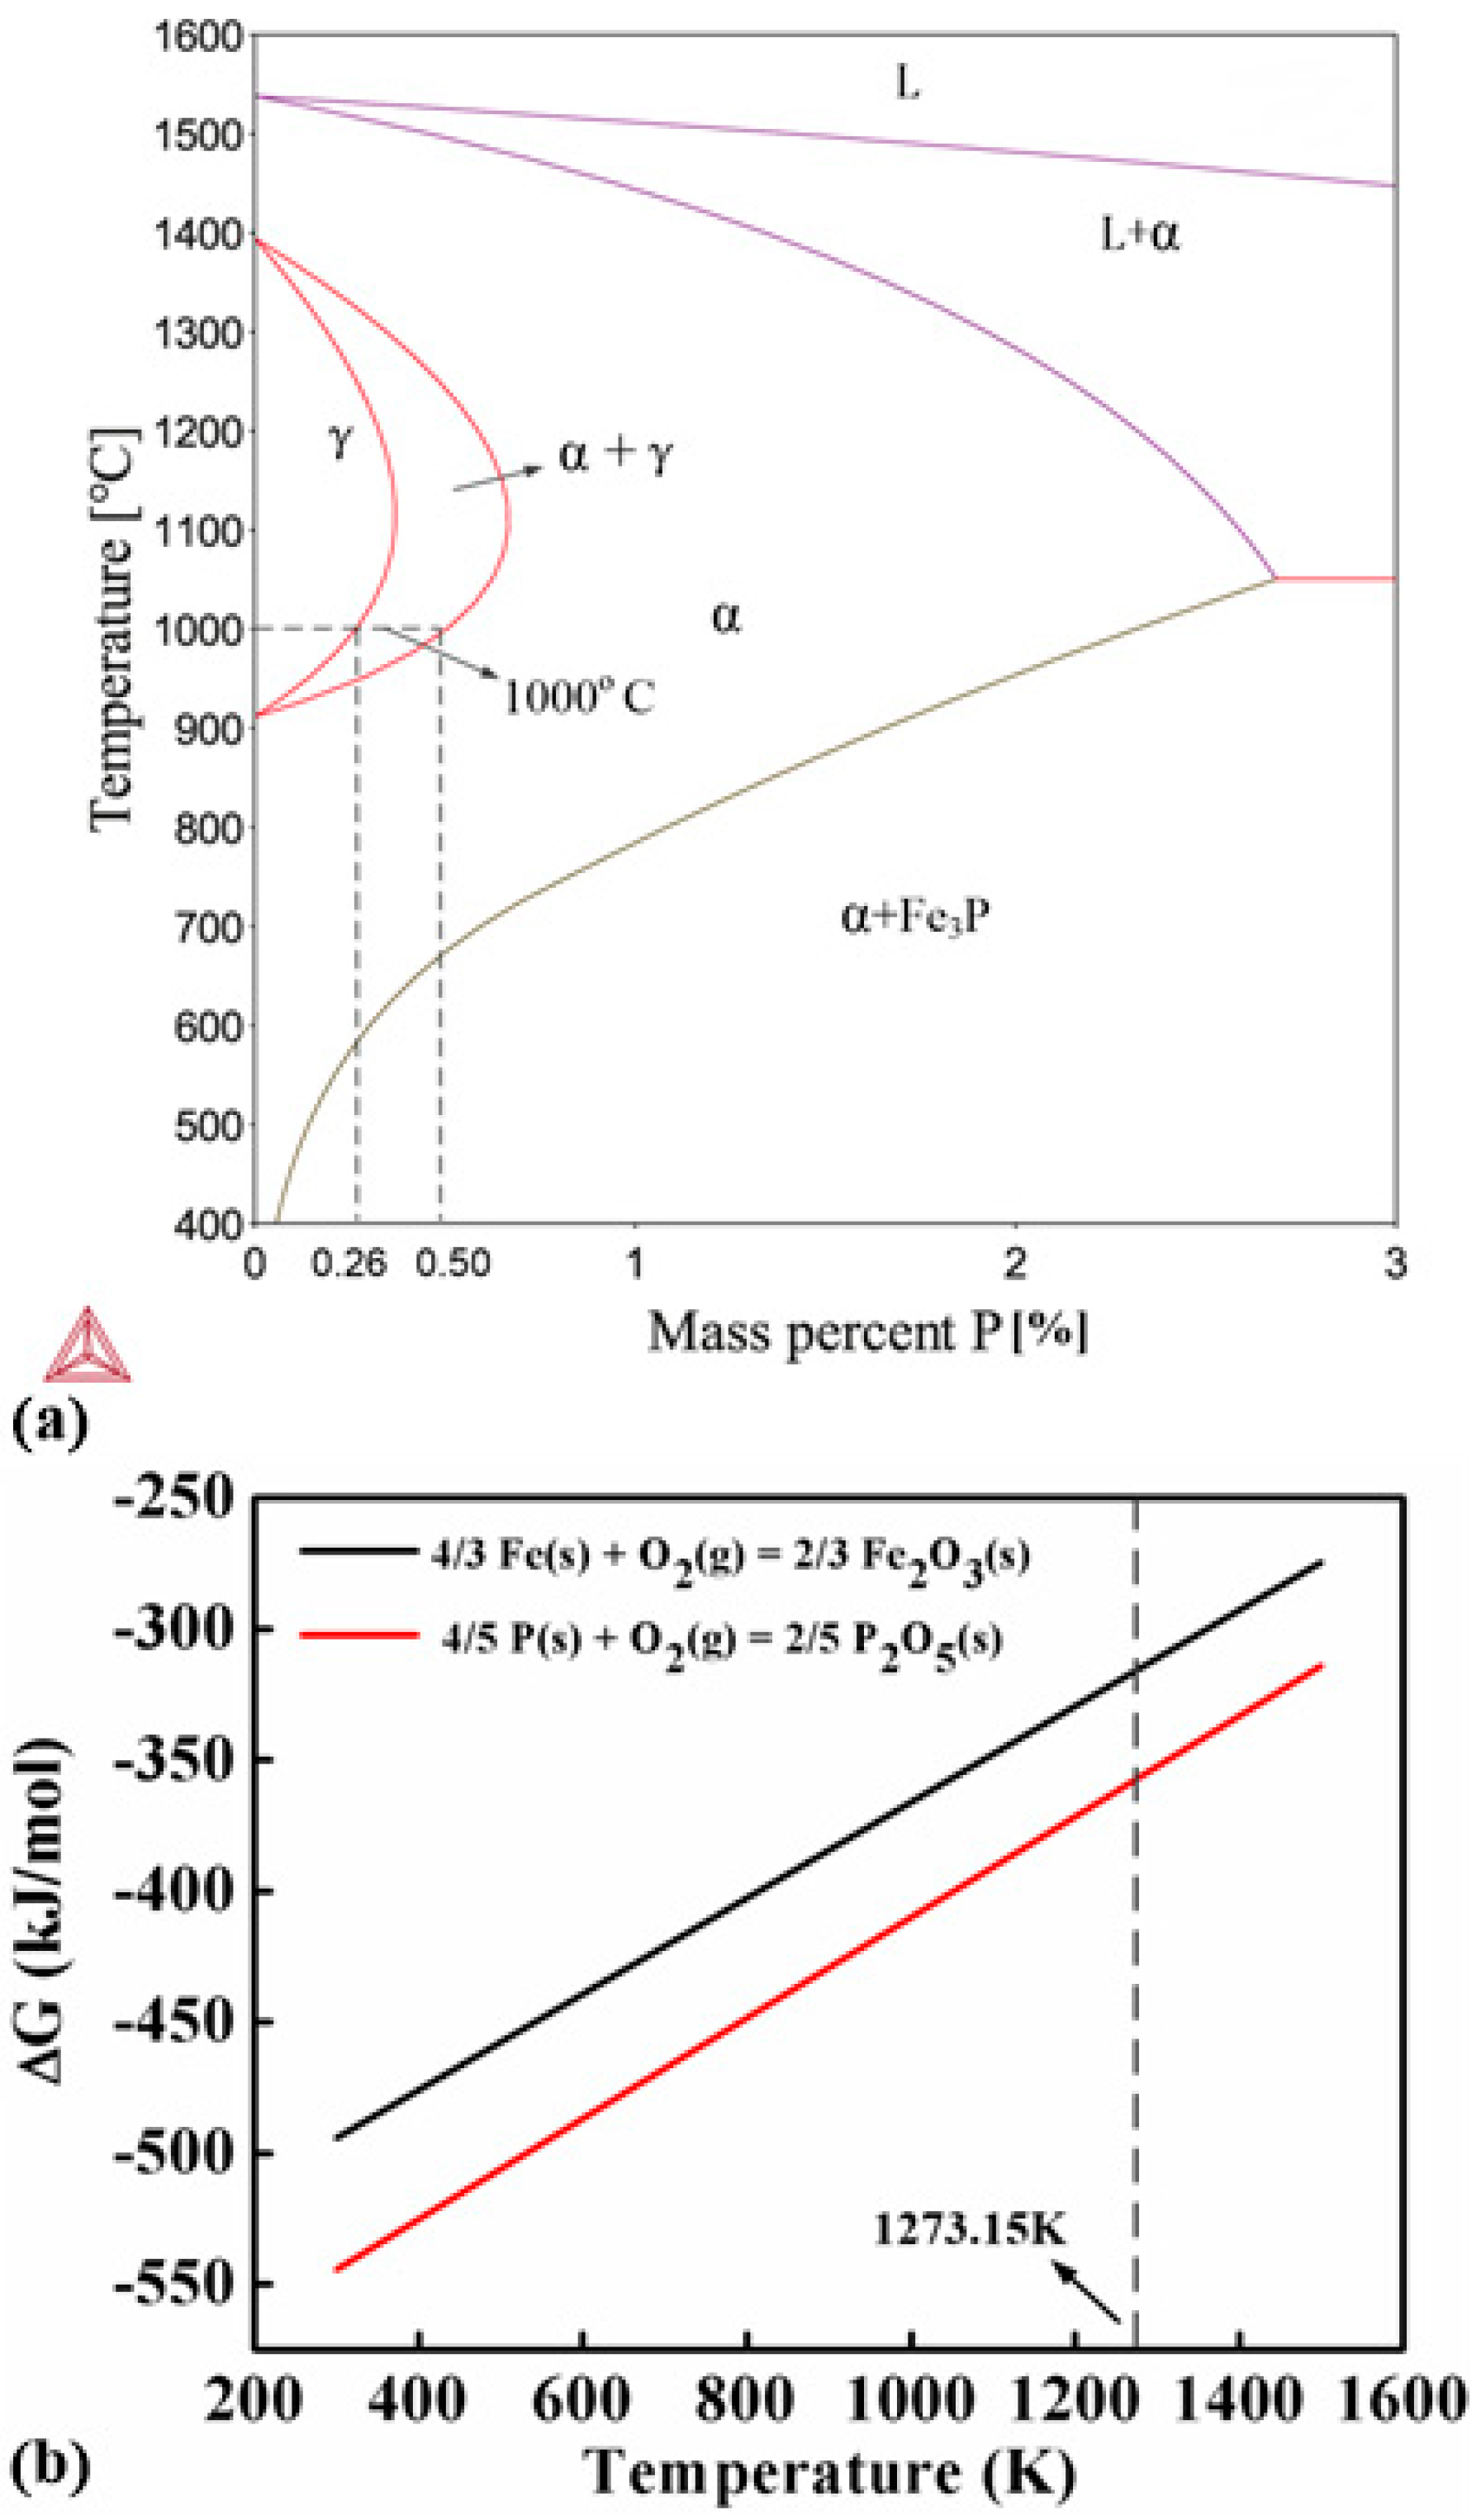
The experimental results show that the addition of small amount of Fe3P can significantly improve the sinterability of the carbonyl powder. Figure 7 shows a binary phase diagram of Fe-P. Phosphorous is a ferrite stabilizer which can reduce the austenite area in the Fe-P phase diagram. It suggests that the Fe-P alloys with P content higher than 0.5% contain no austenite at the sintering temperature (1000 °C). The self-diffusion coefficient of Fe and inter-diffusion coefficient of allying elements are much higher in ferrite than in austenite. Therefore, it is expected that the addition of Fe3P can benefit the sintering by preventing the formation of austenite. This claim has been confirmed by the experiment results. The sintering densities of all the P-containing samples are much higher than the P-free sample (Figure 3). The influence of P on the sintering of carbonyl powder is clearly revealed by the thermal analysis. Without the addition of Fe3P, carbonyl powder exhibits ferrite-austenite transformation at 912 °C. As a result, the sintering shrinkage is interrupted in the heating stage and a sudden dimension change is observed in the cooling stage at the transformation temperature in the DIL curve (Figure 4a). Accordingly, the DSC curve of the P-free sample exhibits an endothermic peak corresponding to the ferrite-austenite transformation as well.
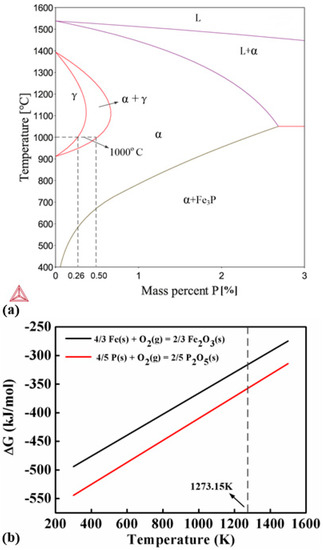
Figure 7.
(a) Fe-P binary phase diagram showing that the ferrite can be stabilized by P addition and (b) Gibbs free energies ΔG of the oxidation reactions of Fe and P suggesting that P is more prone to oxidization than Fe at the sintering temperature.
The thermal analysis indicates that the ferrite-austenite transformation can be successfully suppressed by the addition of P. The transformation peak is still not seen in the DIL curves of all the P-containing samples, although endothermic peaks are found in the DSC curves of the samples containing 0.8 and 1.0 wt.% P (labelled by the broken elliptical line in Figure 4b. The peaks are significantly smaller compared to that in the P-free sample, implying that only a small amount of austenite is formed in the two samples during sintering. Moreover, the endothermic peaks completely disappear in the samples containing 1.2 and 1.4 wt.% P.
However, the sintering density does not increase monotonously with increasing P addition. As a result, the Fe-1.4 wt.% P and Fe-1.6 wt.% P samples have sintering densities lower than the Fe-1.2 wt.% P sample. The unexpected low sintering densities of the two samples with high P contents are presumably caused by the formation of P-containing oxides in them on the one hand. Table 4 lists the changes of enthalpy ΔH and entropy ΔS corresponding to the following reactions.
Table 4.
The changes of enthalpy ΔH, entropy ΔS, and Gibbs free energy ΔG corresponding to the oxidation reactions of Fe and P.
The letters s and g indicate the states of the substances in the reactions. Based on the data in Table 4, changes of Gibbs free energy ΔG of the two reactions can be calculated and plotted in Figure 7b. The results show that the ΔG of the oxidization reaction between P and O is smaller than that between Fe and O at 1000 °C, suggesting that P is easier to get oxidized than Fe at the sintering temperature. Therefore, P-containing oxides tend to form in the samples with high P-contents. Furthermore, according to the Fe-P phase diagram shown in Figure 7a, the solubility of P in Fe decreases exponentially with temperature and becomes quite low at RT. Phosphorous is more likely to precipitate from the samples with high P content and aggregates along the grain boundary, and subsequently reacts with oxygen to form oxides. Therefore, the Fe-1.2 wt.% P sample exhibits the highest sintering density and has few P-containing oxide particles. Because the P-containing oxide particles can hinder the movement of domain walls, they increase the coercivity and degrade the magnetic properties of the samples containing 1.4 and 1.6 wt.% P. As a result, the Fe-1.2 wt.% P sample possesses the best soft magnetic properties among all the samples.
5. Conclusions
Green parts of Fe-x P (x = 0, 0.6, 0.8, 1.0, 1.2, 1.4, and 1.6 wt.%) are fabricated by doping carbonyl powder with different amounts of Fe3P. They were used to investigate the influence of Fe3P addition on the sintering behaviors and magnetic properties of the sintered carbonyl powder. All the P-containing samples sintered at 1000 °C for 2 h had sintering densities higher than the P-free sample. The thermal analysis reveals that the sintering process of the P-free sample is interrupted at ~912 °C when the sample is transformed from ferrite to austenite. The ferrite can be stabilized with the involvement of P. Therefore, the ferrite-austenite transformation can be successfully suppressed, and the high diffusion coefficient of the ferrite ensures that the sintering proceeds continuously throughout the whole furnace cycle. However, the sintering density does not increase monotonously with the P addition, and excessive P addition can form oxide particles which have adverse effects on the magnetic properties. As a result, the Fe-1.2 wt.% P sample exhibits the highest relative density (7.66 g/cm3), the lowest coercive force (172 A/m) and the highest magnetic induction (768 mT) after sintering.
Author Contributions
R.M. and P.Y. conceived and designed the experiments; R.M., K.Y., L.L., and H.J. performed experiments; R.M., S.Y., and K.Y. analyzed the data; P.Y. contributed reagents/materials/analysis tools; R.M. and P.Y. wrote the main paper.
Funding
This research was funded by the Project of Shenzhen Science and Technology Innovation Committee (SGLH20161212155758670) in China.
Acknowledgments
This work is supported by the Project of Shenzhen Science and Technology Innovation Committee (SGLH20161212155758670) in China.
Conflicts of Interest
The authors declare no conflict of interest.
References
- Chauhan, A.; Vaish, R. Magnetic material selection using multiple attribute decision making approach. Mater. Des. 2012, 36, 1–5. [Google Scholar] [CrossRef]
- Chaurasia, S.K.; Prakash, U.; Misra, P.S.; Chandra, K. Development of P/M Fe-P soft magnetic materials. Bull. Mater. Sci. 2012, 35, 191–196. [Google Scholar] [CrossRef]
- Das, J.; Chandra, K.; Misra, P.S.; Sarma, B. Novel powder metallurgy technique for development of Fe-P-based soft magnetic materials. J. Magn. Magn. Mater. 2008, 320, 906–911. [Google Scholar] [CrossRef]
- Ma, J.; Qin, M.; Zhang, L.; Zhang, R.; Tian, L.; Zhang, X.; Qu, X. Preparation of high performance sintered soft magnetic alloy by metal injection molding. Mater. Chem. Phys. 2013, 138, 444–448. [Google Scholar] [CrossRef]
- Muthuchamy, A.; Kumar, R.; Annamalai, A.R.; Agrawal, D.K.; Upadhyaya, A. An investigation on effect of heating mode and temperature on sintering of Fe-P alloys. Mater. Charact. 2016, 114, 122–135. [Google Scholar] [CrossRef]
- Shokrollahi, H. The magnetic and structural properties of the most important alloys of iron produced by mechanical alloying. Cheminform 2010, 41, 3374–3387. [Google Scholar] [CrossRef]
- Shokrollahi, H.; Janghorban, K. Soft magnetic composite materials (SMCs). J. Mater. Process. Technol. 2012, 189, 1–12. [Google Scholar] [CrossRef]
- Jafari, S.; Beitollahi, A.; Eftekhariyekta, B.; Kanada, K.; Ohkubo, T.; Gopalan, R.; Herzer, G.; Hono, K. Microstructural and magnetic properties study of Fe-P rolled sheet alloys. J. Magn. Magn. Mater. 2014, 358–359, 38–43. [Google Scholar] [CrossRef]
- Ma, J.; Qin, M.; Tian, L.; Zhang, L.; Khan, D.F.; Ding, X.; Qu, X.; Zhang, H. Effect of Fe3P addition on magnetic properties and microstructure of injection molded iron. J. Magn. Magn. Mater. 2016, 397, 240–246. [Google Scholar] [CrossRef]
- Silveyra, J.M.; Illeková, E.; Coïsson, M.; Celegato, F.; Vinai, F.; Tiberto, P.; Moya, J.A.; Cremaschi, V.J. High performance of low cost soft magnetic materials. Bull. Mater. Sci. 2011, 34, 1407–1413. [Google Scholar] [CrossRef]
- Adler, E.; Pfeiffer, H. Influence of grain-size and impurities on magnrtic-properties of soft magnetic alloy 47.5 Percent Ni-Fe. IEEE Trans. Magn. 1974, 10, 172–174. [Google Scholar] [CrossRef]
- Jiles, D.C. Recent advances and future directions in magnetic materials. Acta Mater. 2003, 51, 5907–5939. [Google Scholar] [CrossRef]
- Chuang, M.S.; Lin, S.T. Effect of phosphorous addition on the grain growth of Fe–50 wt.%Ni alloys. Scripta Mater. 2002, 47, 321–326. [Google Scholar] [CrossRef]
- Hao, H.; Mo, W.; Lv, Y.; Ye, S.; Gu, R.; Yu, P. The effect of trace amount of Ti and W on the powder metallurgy process of Cu. J. Alloys Compd. 2016, 660, 204–207. [Google Scholar] [CrossRef]
- Trivedi, S.; Mehta, Y.; Chandra, K.; Mishra, P.S. Effect of carbon on mechanical properties of powder-processed Fe-0.35%P alloys. Bull. Mater. Sci. 2010, 33, 625–632. [Google Scholar] [CrossRef]
- Da, S.S.; Jung, I.D.; Kim, H.J.; Park, S.J. Development of powder injection molding process for sintered soft magnet with the addition of Fe-17 at.% P powder. Metal Powder Rep. 2017, 73, 38–45. [Google Scholar]
- Shokrollahi, H.; Janghorban, K. Different annealing treatments for improvement of magnetic and electrical properties of soft magnetic composites. J. Magn. Magn. Mater. 2007, 317, 61–67. [Google Scholar] [CrossRef]
- Lee, S.M.; Kang, S.J.L. Theoretical analysis of liquid-phase sintering: Pore filling theory. Acta Mater. 1998, 46, 3191–3202. [Google Scholar] [CrossRef]
- Tian, L.; Qin, M.; Ma, J.; Zhang, L.; Zhang, X. High magnetic performance of metal injection-molded pure iron using δ phase sintering. Mater. Lett. 2014, 121, 145–148. [Google Scholar] [CrossRef]
- Chuang, M.S.; Lin, S.T. Effects of phosphorus addition on the magnetic properties of sintered Fe-50 wt.% Ni alloys. J. Mater. Eng. Perform. 2003, 12, 23–28. [Google Scholar] [CrossRef]
- Ding, J.; Li, Y.; Chen, L.F.; Deng, C.R.; Shi, Y.; Chow, Y.S.; Gang, T.B. Microstructure and soft magnetic properties of nanocrystalline Fe-Si powders. J. Alloys Compd. 2001, 314, 262–267. [Google Scholar] [CrossRef]
- Ma, J.; Qin, M.; Lin, Z.; Zhang, R.; Qu, X. Microstructure and magnetic properties of Fe–50%Ni alloy fabricated by powder injection molding. J. Magn. Magn. Mater. 2013, 329, 24–29. [Google Scholar] [CrossRef]
- Ma, J.; Qin, M.; Zhang, L.; Zhang, R.; Tian, L.; Zhang, X.; Li, X.; Qu, X.; Khan, D.F. Magnetic properties of Fe–50%Ni alloy fabricated by metal injection molding. Mater. Des. 2013, 51, 1018–1022. [Google Scholar] [CrossRef]
- Páez-Pavón, A.; Jiménez-Morales, A.; Rodriguez-Arbaizar, M.; Carreño-Morelli, E.; Torralba, J.M. Sintering optimisation of Fe-Si soft magnetic materials processed by metal injection moulding. Powder Metall. 2017, 60, 112–117. [Google Scholar] [CrossRef]
- Yaglo, G.I.; Ev, V.M.V.; Panasyuk, O.A. Effect of alloying impurities and conditions of heat treatment of iron-based powder materials and their magnetic properties. Powder Metall. Met. Ceram. 1995, 33, 37–39. [Google Scholar] [CrossRef]
- Sharma, D.; Chandra, K.; Misra, P.S. Design and development of powder processed Fe-P based alloys. Mater. Des. 2011, 32, 3198–3204. [Google Scholar] [CrossRef]
- Shin, D.S.; Oh, J.W.; Kim, H.J.; Park, S.J. Microstructural and core loss behaviors of addictive Fe-17 at% P based on Fe-3.5 wt% Si alloys in powder injection molding. J. Alloys Compd. 2018, 749, 758–762. [Google Scholar] [CrossRef]
- Bas, J.A.; Calero, J.A.; Dougan, M.J. Sintered soft magnetic materials. Properties and applications. J. Magn. Magn. Mater. 2003, 254, 391–398. [Google Scholar] [CrossRef]
- Zhao, G.; Wu, C.; Yan, M. Enhanced magnetic properties of Fe soft magnetic composites by surface oxidation. J. Magn. Magn. Mater. 2016, 399, 51–57. [Google Scholar] [CrossRef]
- Daudt, N.F.; Santos, T.L.S.d.; Limberger, I.F.; Seeger, R.L.; Dorneles, L.S.; Binder, C.; Schaeffer, L. Highly porous Fe-2 wt%P alloy produced by plasma assisted debinding and sintering of injection-molded parts. Mater. Lett. 2018, 231, 163–166. [Google Scholar] [CrossRef]
- Tebib, W.; Alleg, S.; Greneche, J.-M.; Sunol, J.J. Thermal stability of the nanocrystalline Fe-8P (wt.%) powder produced by ball milling. Phosphorus Sulfur Silicon Relat. Elem. 2018, 193, 500–506. [Google Scholar] [CrossRef]

© 2019 by the authors. Licensee MDPI, Basel, Switzerland. This article is an open access article distributed under the terms and conditions of the Creative Commons Attribution (CC BY) license (http://creativecommons.org/licenses/by/4.0/).