Abstract
With the demand of high-quality steel and miniaturization of the special steel production, single snorkel vacuum refining process has been widely concerned in China recently, because of its simple structure and good performance of degassing and decarburization. In this study, a water model experimental system and a three-dimensional mathematical model based on two-fluid multiphase flow model have been built to analyze the refining efficiency limitation of the single snorkel vacuum refining furnace from the flow pattern and gas distribution. The results showed that there is a limited gas flow rate, and beyond this flow rate the gas column deviates to the wall and the redundant bubbles escape from the free surface, which will not further improve the refining efficiency and will lead to the erosion of the snorkel. In this case, the limited flow rate is 900 NL/h. Furthermore, the fluctuation of the free surface and the different structural parameters have significant effects on the flow field in single-snorkel vacuum refining furnace (SSF).
1. Introduction
With uninterruptedly increasing demand for highly clean steel, vacuum processes have been applied widely and developed rapidly in the steelmaking process. Among the various refining equipment, the RH (RH is a molten steel refining technology developed by Rheinstahl-Heraeus company) vacuum device has been widely used in the production of interstitial free and ultra-low-carbon steels. RH system is composed of a vacuum vessel, a ladle, an up-leg snorkel, and a down-leg snorkel as shown in Figure 1a, and the gas blow comes from the up-leg when it is working. Although the application of large RH device was a great success, the RH vacuum degassing refining furnace below 80 t have some problems, such as refining efficiency decrease, slag bonding, and so on. Recently in China, with the ever-increasing demand of the miniaturization of special steel production, the single snorkel vacuum refining process, which is similar to the RH process, has attracted much attention owing to its simple structure, superior performance of degassing, and decarburization processes. The single-snorkel vacuum refining furnace (also known as SSF in literature) was originally developed by Zhang [1] as novel secondary refining to produce bearing steel back in the 1970s. The single-snorkel vacuum refining furnace consists of a single snorkel, a vacuum vessel, and a ladle with an eccentric blowing nozzle at the bottom where the schematic diagram is shown in Figure 1b. Throughout the process, argon gas is eccentrically injected into the molten steel from the blowing nozzle of the ladle. Driven mainly by the buoyancy force, the dispersed argon gas bubbles flow vertically through the molten steel and enter into the vacuum chamber. Such vertical bubbly flow structure drives the molten steel to continuously circulate between the ladle and the vacuum vessel. More importantly, the introduction of argon gas bubbles also facilitates the decarburization, desulphurization, degassing, and chemical composition homogenization process which ensures the quality of the product.
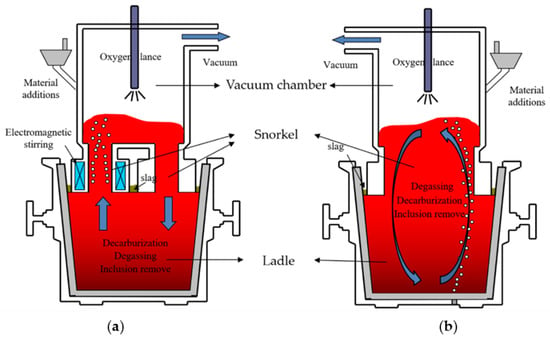
Figure 1.
Schematic of typical vacuum refining furnace (a) RH; (b) single-snorkel vacuum refining furnace (SSF).
As we all know, RH refining process is widely used in modern steel production. Although the structure of SSF is similar to RH, the refining principles of SSF are obviously different from RH, as the metallurgical characteristics of RH cannot be directly used for SSF. In SSF, the bubble-driven flow field and mixing characteristics involve complex two-phase flow structure and sophisticated interfacial heat and mass transfer as well as chemical reactions. Starting from the 1990s, numbers of research works have been devoted to investigate the performance and characteristics of the SSF. A number of hydrodynamic models have been constructed to study the metallurgical characteristics of the SSF [2,3,4,5,6,7]. Cheng et al. [2,3] studied the kinetics of deoxidization and the slag entrapment behavior of SSF using the water model experiment, and the expression of deoxidization rate and gas blowing flow rate of critical slag entrapment have been obtained. Wang et al. [4] measured the circulation flow rate of the SSF water model and investigated the influence of different parameters on the circulation flow rate. Qin et al. [5] studied the effect of alloy addition method on the mixing time of SSF with the water model experiment. Zhao and Wang et al. [6,7] studied the kinetics of decarburization of SSF using the water model experiment and gave the expression of deoxidization rate. Furthermore, some plant testing of SSF have been done by some researchers in China. The metallurgical function including decarburization and desulphurization were analyzed by Duan et al. [8,9,10] based on an 80 t SSF in Shanxi Taigang Stainless Steel Company (Taiyuan, China). A few numerical models have been built to study the SSF. Qin et al. [11] have built a numerical model to study the flow field in SSF, but did not give the key details about the model. Another mathematical model has been built by Yang et al. [12] to attain the optimal configuration and operation parameter of the previous 80-ton single snorkel vacuum refining furnace.
Meanwhile, another vacuum degassing refining equipment named as a revolutionary degassing activator (simplified as REDA) had been independently developed by Nippon Steel Corporation in Japan in 1991, the basic configuration and refining principles of which have no obvious differences with that of SSF. The metallurgical effects of REDA have been investigated [13,14,15,16,17,18,19,20]. The flow structure and decarburization behavior in REDA were studied by Miyamoto et al. [15] with a water model experimental system. After that, a 175-ton and a 330-ton REDA was developed as well [16,17]. In 1999, the REDA technology was adopted to produce stainless steel [18,19]. Furthermore, a 2D mathematical model for REDA has been built to by Mondal et al. [20] to study the fluid flow and mixing behavior.
In summary, despite much research effort have been dedicated in the past years, the flow characteristics, metallurgical function, as well as the underlying physics of the SSF remain largely elusive. This could also be the main barrier hindering the industrialization of SSF in China. The majority of the investigations have been focused on experimental measurements in the water model, and the development of a generic mathematical model which can capture the fundamental flow structure and the performance of the SSF under various operating conditions is still very limited in literature. Whether the SSF in China or the REDA in Japan, they both show good performance in decarburization and desulphurization.
Among the limited models available in the literature, the numerical scheme proposed by Yang et al. could be one of the most complete models for the given problem. In Yang et al.’s model [12], the Euler-Euler two-phase flow model coupling DPM was used to simulate the fluid flow in an 80-ton single snorkel vacuum refining furnace. Base on this model, the influence of Ar blowing flow rate, blowing position, the diameter of the snorkel, and the snorkel immerging depth to the flow field has been studied, and the optimal value of these parameters were figured out. The results were helpful to understand the flow structure of SSF. Nonetheless, their model did not consider the deformation and the influence of the molten steel free surface in the vacuum chamber. Theoretical speaking, when the argon gas bubbles degas from the free surface, it also generates a wave which will propagate and deform the shape of the free surface; affecting the overall flow structure and its associated mixing characteristics. Aiming to remedy the drawback of their model, the objectives of the present study are twofold: (i) to construct a SSF water model for experimental measurements and investigate the significance of the waves on the free surface and its associated influence on the overall flow structure; particularly on the mixing time under various gas injection flow rate; and (ii) to develop a generic mathematical model based on the Euler multiphase framework to capture the effect of the free surface and its associated flow pattern in the SSF and validate the predicted mixing time against experimental measurement.
2. Mathematical Modeling
The main challenge in modelling the complex flow structure in the SSF is the co-existence of three different phases: (i) a dispersed gas phase for argon bubbles as the main drive of circulation and interfacial processes; (ii) a continuum liquid phase for the molten steel; and (iii) a continuum gas phase for the air-argon gas mixture in the vacuum chamber. In order to assess the performance of the SSF, it is essential to capture the interfacial momentum transfer between argon bubbles and molten steel and the shape and location of the free surface in the vacuum chamber that effects the circulation as well as the hydraulic pressure within the system. On this ground, this study proposed a numerical model based on the Euler-Euler multiphase modeling framework. For validation against measurements from the water model, flow is considered as isothermal in the model. Details of the mathematical models are presented below.
2.1. Euler-Euler Two-Fluid Model
Numerical simulations presented in this study are based on the two-fluid Euler-Euler multiphase model. The two-fluid model, treating both the gas and liquid phase as continua, solves two sets of conservation equations governing mass and momentum which are written for each phase as follows:
Continuity equation of the liquid phase
Continuity equation of the gas phase
Momentum equation of the liquid phase
Momentum equation of the gas phase
In Equation (4), Fgl represents the total interfacial force, is the gravity acceleration vector, P is the pressure, and are the density of gas and liquid phase, respectively, is the velocity of gas phase, is the viscosity of gas phase, and is the phase fraction of the gas phase. It is noted from above equation that closure law is required to determine the momentum transfer of the total interfacial force.
2.2. Momentum Transfer
The interfacial momentum transfer exhibits a dominant effect in the multiphase momentum equation. The total interfacial forces considered in the present study can be categorized into three terms: Drag, lift, and virtual mass force.
The inter-phase momentum transfer between gas and liquid due to the drag force resulted from shear is described as:
where Ai is the interfacial area and CD is the drag force coefficient; in this work, the Schiller-Naumann drag model [21] was used, and in this model; CD can be evaluated by correlation of several distinct Reynolds number regions for individual bubbles as follows:
Due to velocity gradients in radial and azimuthal directions, bubbles rising in a liquid are subjected to a lateral lift force, which is known to be responsible for the segregation of small and larger bubbles in bubbly flows [22] as that in the single snorkel furnace and can be described as:
where the lift coefficient CL, which depends on the Eötvös number-dependent correlation proposed by Tomiyama et al. [23,24]. For Fluent software, the Tomiyama lift force model lightly modified by Frank et al. [25] can be expressed as:
where Reg is the bubble Reynolds number and Eo′ is a modified Eötvös number based on the long axis of the deformable bubble dh:
The variable dh is the maximum bubble horizontal dimension that can be evaluated by using the empirical correlation of Wellek et al. [26]:
where σ is the surface tension, g is gravity, and dg is the bubble diameter.
The virtual mass force accounts for relative acceleration, and the inertia of the liquid mass encountered by the accelerating bubbles exerts a virtual mass force, which is given by
where CVM is the virtual mass force coefficient, which was given by default value 0.5.
2.3. User-Defined Scalar (UDS) Transport Model
As the flow reaches a steady state, a user-defined scalar (UDS) was added to simulate the solute transport. It is assumed that the UDS only transports in the liquid phase and the equation in the multiphase flow can be written as:
where χ is the value of UDS and Γl is the diffusion coefficient fixed by experiment in the present work. The UDS was added at the position where on the free surface of the ladle as the experiment did. Meanwhile, the UDS variable was monitored by two monitor points. In order to compare the concentration curves between experimental and numerical simulations, we use normalized concentration in this literature, which is given by
where is the normalized concentration, is the concentration at the time of t, and is the steady concentration; and the mixing time was determined as the time when the gaps between the normalized concentration were less than 5%.
2.4. Experimental Setup
In order to validate the mathematical model and determine the initial bubble size in the SSF, a one-fourth scale water model was established based on the similarity theory. The gas flow rate was determined according to the modified Froude number of the water model and the prototype. The modified Froude number is expressed as , where and are the density of liquid phase and gas phase, respectively. The water model system is composed of a rotameter, high-speed camera, Electro conductivity testing system, and single-snorkel vacuum refining furnace water model. The schematic of the physical model of the single-snorkel vacuum refining furnace is shown in Figure 2. The parameters of the SSF water model are shown in Table 1. The N2 (25 °C, 1 atm) was chosen to simulate argon gas in the real equipment, and the gas was injected into the liquid from a nozzle made of the porous mullite. The mullite used in the experiment is the same as the real SSF. During the experiment, the saturated brine was added to the liquid from the free surface of the ladle as flow reaches to be steady and the position of two monitor points are as shown in Figure 2. Two conductivity meters connected to computers were used to measure the curves of the conductivity change caused by solute transport. Then, the concentration of the sodium chloride solution changing with the time, which was used to calculate the mixing time and to validate the numerical model, was obtained from the measured conductivity quantities.
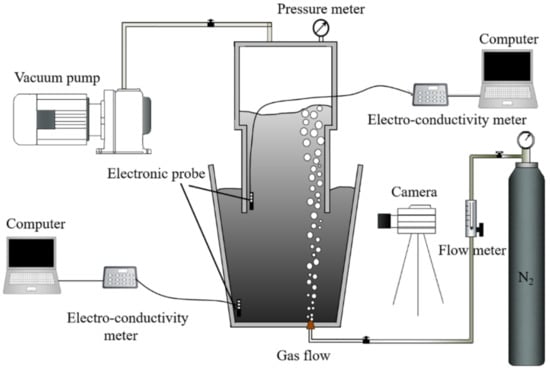
Figure 2.
Schematic of single-snorkel vacuum refining furnace (SSF) water model experiment system.

Table 1.
Geometrical parameter of single snorkel furnace.
2.5. Numerical Details
For the two-fluid model, solutions to the transport equations governing the conservation of mass and momentum for each phase were obtained via the commercial CFD software Fluent computer code. One of the meshes and the boundary conditions are shown in Figure 3. All the meshes for different injection positions were set to the same grid density to avoid the influence of mesh size. The number of cells was between 280,000 to 320,000 for the various cases after grid independent check. All the cases were carried out by transient simulations, and the double-precision solver was used. For all flow conditions, reliable convergence criterion based on the RMS (root mean square) residual of 1.0 × 10⁻⁴ was adopted for the termination of numerical calculations.
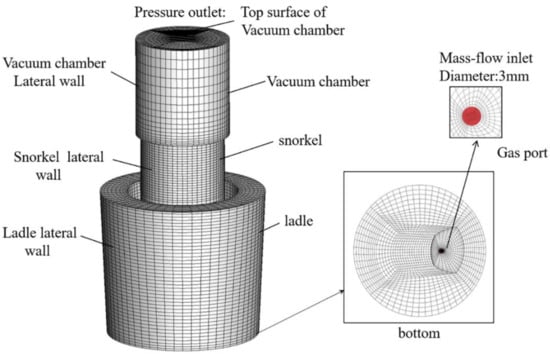
Figure 3.
Mesh and boundary condition.
In order to validate the numerical model, the computational domain is based on the SSF water model. No slip boundary condition was used at the ladle, snorkel, and vacuum vessel walls. At the inlet of nozzles, the velocity of the gas-liquid mixture was given as input with the void fraction of liquid phase to be zero. The inlet velocity relative to 360, 540, 720, 900, and 1080 NL/h gas flow rate has been investigated in this study. The output is at the top of the vacuum vessel, and an opening condition was considered. The initial liquid level height was 1.1 m, and the liquid phase fraction was defined as 1 in the calculation domain below free surface. The initial diameter of the bubbles was determined to 3 mm based on the experiment, as showed in Figure 4. Euler-Euler two-fluid model is the general case of multiphase flow, where each fluid has its own velocity field, turbulence field, and two sets of governing equations for momentum were solved. In the present study, the generic CFD code ANSYS Fluent was employed as a platform for Euler-Euler two-fluid flow computation. For gas-liquid two-phase flow, the numerical investigation revealed that the standard k-ε model predicted an unrealistically high gas void fraction peak close to wall [27]. So, the RNG k-ε turbulence model [28] was used in the present model, which is accurate for rapidly strained flows and swirling flows are improved. Moreover, it also provides an analytically-derived differential formula for effective viscosity that accounts for low-Reynolds number effects.
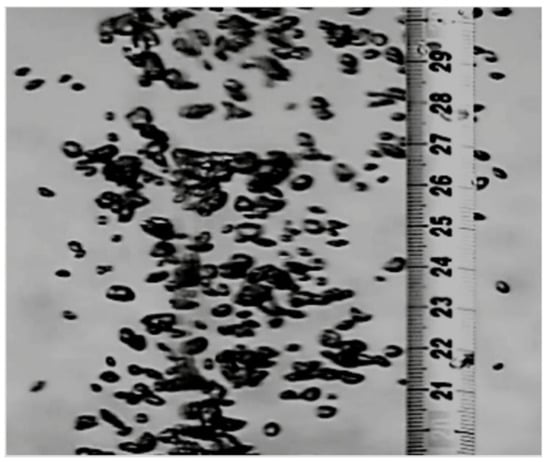
Figure 4.
Experimental visualization of gas bubbles near the inlet (The minimum scale is millimeter).
3. Results and Discussion
3.1. Validation of Numerical Model
3.1.1. Fluctuation
During the experiment, the fluctuation of the free surface can be observed obviously as shown in Figure 5a, and with the increasing of gas injection flow rate and vacuum degree in the vacuum vessel, the fluctuation becomes strong. It is obvious the fluid flow will become more turbulent and complicated due to the fluctuation. Therefore, in the present mathematical model, the fluctuation of the free surface was considered; Figure 5b shows the numerical results.

Figure 5.
Fluctuation on the free surface (a) experimental and (b) simulation.
Figure 6 shows the bubble behavior and fluctuation of free surface at different gas blowing flow rate. It can be seen that with the increase of gas blowing flow rate, the amplitude of fluctuation become larger, and the trajectory of bubbles move to the wall, and some bubbles flow away from the gap between ladle and snorkel at largest gas blowing flow rate.
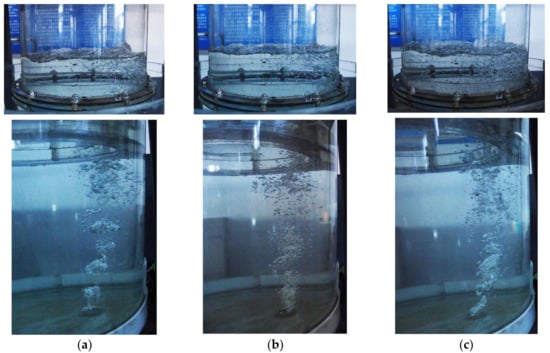
Figure 6.
Picture of bubble motion in SSF water model (a) 360 NL/h; (b) 900 NL/h; (c) 1080 NL/h.
3.1.2. Comparison of Mixing Time
In order to validate the mathematical model, the normalized concentration of the sodium chloride solution changing with the time from the experimental test and numerical calculation was compared at different gas injection flow rate as showed in Figure 7. In the picture, it can be seen that the concentration of the sodium chloride solution changing with the time from the experiment agrees well with that from the numerical simulation. But they still have lightly difference, which should be caused by two reasons: (1) the time average turbulence model which cannot capture the slightly turbulent fluctuation was used in this present model, so the curve from the simulation is smoother; (2) the collection and breakup of the bubbles were neglected. All these will be investigated in future work.
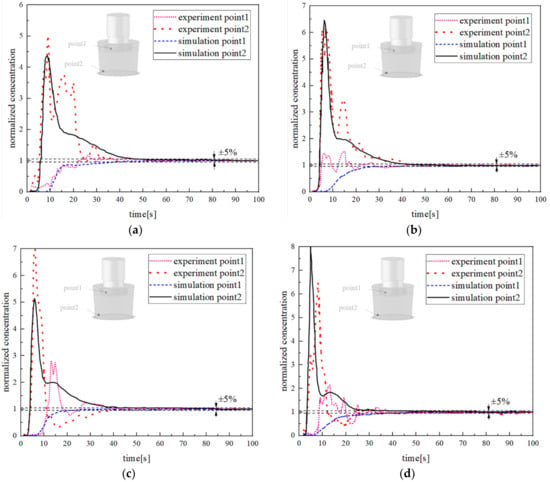
Figure 7.
Comparison of the concentration of the sodium chloride solution changing with the time from the experimental test and numerical calculation at different gas injection flow rate; (a) 360 NL/h; (b) 720 NL/h; (c) 900 NL/h; (d) 1080 NL/h.
Based on the data of experiment and simulation, the mixing time at different gas injection flow rate was achieved as shown in Figure 8. From the figure, it can be seen that with the increase of the gas injection flow rate the mixing time decrease firstly, and then keep steady. The changing trend is different from that in RH vacuum degassing device due to different mechanism. For the RH, the diameter of the up-leg is small, and when the gas blowing flow rate is big enough the bubbles occupy the most space of the up-leg and the interaction between bubbles becomes stronger which cause the loss of buoyancy power, then lead to the decreasing of circulation flow rate of RH as mentioned in literature [29].
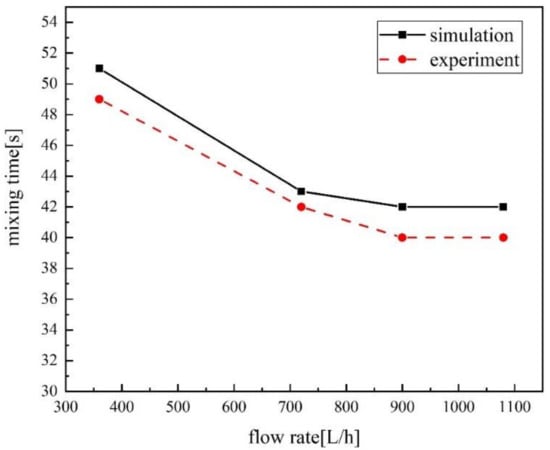
Figure 8.
Experimental and numerical mixing time at different gas injection flow rate.
On the contrast, for the SSF, on one hand, the diameter of the snorkel is big; on the other hand, the blowing method is bottom blowing, which causes the bubble’s path to be long, so, there is no gas congestion phenomenon in SSF. Then, what is the reason for the stabilization of mixing time when gas blowing flow rate is large enough for SSF? We can find the answer in Figure 6. It is obvious with the increasing of the gas blowing flow rate, bubble columns move to the wall of SSF, and when gas flow rate large enough, the redundant bubbles escape from the gap between the ladle and snorkel. At this time, it is invalid to reduce the mixing time by increasing the flow rate.
3.2. Flow Field
3.2.1. Comparison of Flow Field
Figure 9 compared the flow patterns got from numerical simulation in this study with that from Yang et al.’s results. It can be seen that the flow patterns have a big difference, which is because the free surface was not considered in Yang’s model. From the present results, we can see that fluid flow upward to the free surface driven by the gas bubbles injected from the eccentric nozzle, then turns to the opposite side of the immerged snorkel when it reaches the free surface, and goes downward. Nevertheless, for Yang’s result, the fluid velocity flows beyond the free surface. Obviously, the predicted velocity field seems to be more realistic in the present model.
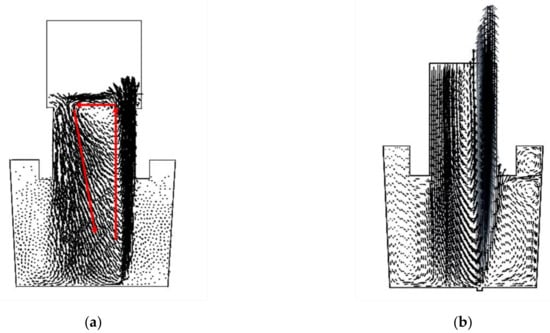
Figure 9.
Comparison of the flow field based on different model (a) present model; (b) Yang’s model.
3.2.2. Flow Field in SSF
Figure 10 shows the flow field and gas distribution on the main section of the SSF with different gas injection flow rate. When the gas flow rate is 540 NL/h, the impacting length is about 0.67 m below the free surface and the “dead zone” where the velocity is low is large. With the increase of the gas flow rate, the impacting length increases and the “dead zone” decreases. In another word, the circulation flow rate of SSF increases due to the higher gas flow rate. Nonetheless, when the gas injection flow rate reaches 1080 NL /h, it can be observed that the gas bubble column deviates from the wall due to the larger circulation velocity. Consequently, it results in part of gas flows away from the free surface of the ladle; decreasing the gas usage efficiency and also increasing the erosion of the snorkel.
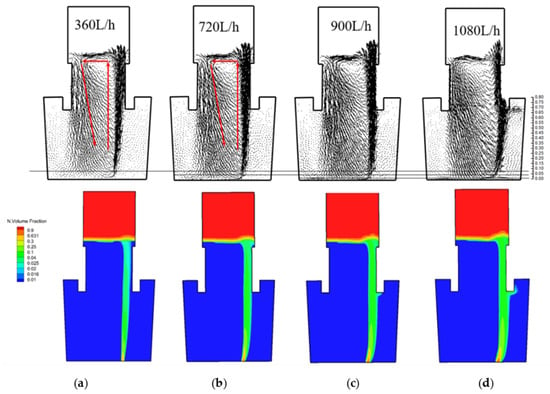
Figure 10.
Flow field and gas distribution of SSF with different gas injection rate; (a) 360 NL/h; (b) 720 NL/h; (c) 900 NL/h; (d) 1080 NL/h.
3.3. Mixing Time of SSF
In order to research the influence of different structural parameters on mixing time, we try to change the injection position and the diameter of the immerged snorkel. Figure 11 is the normalized concentration changing with time as gas injection flow rate is 900 NL /h and the diameter of the immerged snorkel is 425 mm. Figure 12 is the normalized concentration changing with time as gas injection flow rate is 900 NL /h and the gas injection position is 1/3R.
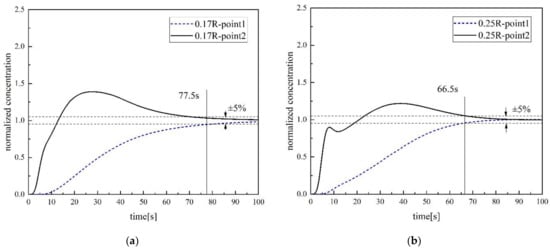
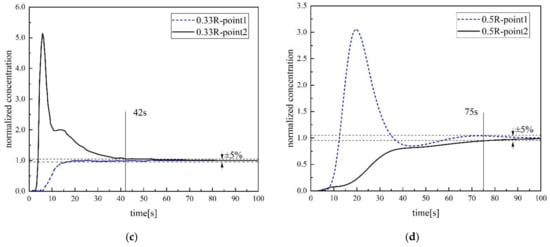
Figure 11.
Normalized concentration changing with time at different gas injection position; (a) 0.17R; (b) 0.25R; (c) 0.33R; (d) 0.5R.
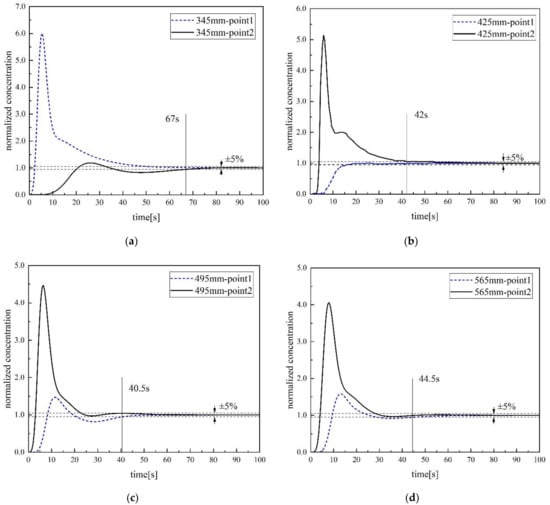
Figure 12.
Normalized concentration changing with time at different diameter of single snorkel; (a) 345 mm; (b) 425 mm; (c) 495 mm; (d) 565 mm.
Figure 13a,b is the mixing time changing with different injection position and the diameter of the immerged snorkel. In Figure 13a, the predicted results show that the gas injection position has a significant effect on the overall mixing time. When the port position is close to (i.e., 0.15R to 0.25R) or far away (i.e., 0.5R) from the center of the bottom ladle, it poses substantially long mixing time (i.e., ranging from 65 to 78 s) to the system. The increased mixing time could be attributed to behavior of the circulating flow. When the injection is close to the center (i.e., 0.5R to 0.25R), the circulating flow structure is not sufficient to provide mixing for the whole ladle. On the other hand, when the injection is far away from the center (i.e., 0.5R), the gas bubble plume might cause some of the bubbles escape from the system via the free surface of the ladle. It is also worth noting that an optimum injection location could reduce the mixing time. This could be also a subject of future optimization study. In Figure 13b, for a relatively small inner diameter (i.e., less than 495 mm), the predicted results show that the mixing time decreases as the inner diameter of single snorkel increases. One should also notice that the diameter of the single snorkel is limited by the size of the ladle and its impact on the slag. For the given flow rate of 900 NL/h, diameter larger than 495 mm might results in a decrease of the mixing efficiency. Under such a scenario, in order to reduce the mixing time, higher gas flow rate should be employed.
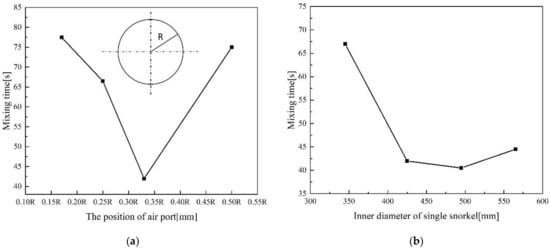
Figure 13.
The mixing time with different structural parameters (a) with different gas injection position; (b) with different diameter of submerged snorkel.
4. Conclusions
In this study, a water model experimental system and a three-dimensional mathematical model based on the two-fluid multiphase flow model have been built to study the mixing and flow pattern of single snorkel vacuum refining furnace. The fluid flows upward to the free surface driven by the gas bubbles, form an uplift at the free surface, which caused the surface fluctuation, then influence the whole flow field. There is a limited gas flow rate, and beyond this flow rate, the gas column deviates to the wall and the redundant bubbles escape from the free surface, which will not further improve the refining efficiency and will lead to the erosion of the snorkel. In this case, the limited flow rate is 900 NL/h. Some improvements of changing design parameters have also been investigated in this study, including the gas injection flow rate and the diameter of the immerged snorkel. Bubble interaction should also be considered in future work.
Author Contributions
Methodology, F.Q.; validation, J.L. and Z.L.; writing—original draft, F.Q.; writing—review and editing, B.L and S.C.P.C.
Funding
This research was funded by National Key R&D Program of China, grant number 2017YFB0304000 and the Open Research Fund of Key Laboratory for Ferrous Metallurgy and Resources Utilization of Ministry of Education, Wuhan University of Science and Technology, grant number FMRU201503.
Conflicts of Interest
The authors declare no conflict of interest.
References
- Zhang, J. Research and Development Group of Single Snorkel Vacuum Refining Furnace with Ar Blowing: Experimental results of a Single Snorkel Vacuum Refining Furnace with Ar Blowing. Dalian Spec. Steel 1978, 1, 5–26. [Google Scholar]
- Cheng, G.G.; Zhang, J.; Yang, N.Z. Dynamic Model of Deoxidation for Bearing Steel Treated with Single–snorkel Refining Furnace. Spec. Steel 1994, 15, 22–25. [Google Scholar]
- Cheng, G.G.; Zhang, J.; Tong, F.S. An Oil–water Model for Slag Entrainment in Melting Bath of Vacuum Refining Unit with Single Snorkel. Spec. Steel 1994, 15, 27–30. [Google Scholar]
- Wang, C.; Zhang, J.; Yang, N.Z. Investigation on Water Modelling of Flow Field and Circulation Flow Rate for Single Snorkel Refining Furnace. Spec. Steel 1998, 19, 12–15. [Google Scholar]
- Qin, Z.; Zhu, M.T.; Cheng, G.G. A Study on Water Model for Alloy Adding Pattern and Mixing Characteristics of Single Snorkel Refining Furnace. Spec. Steel 2010, 19, 5–7. [Google Scholar]
- Zhao, J.L.; Zhang, J.; Cheng, G.G. Water Model Experiment on the Single Nozzle Oxygen–blowing Refining Furnace. Res. Iron Steel 1992, 20, 10–14. [Google Scholar]
- Wang, H.; Zhao, J.; Cheng, G.G. Water Model of Decarburization for Refining Furnace with a Single Snorkel. J. Anhui Univ. Technol. 2005, 22, 623–626. [Google Scholar] [CrossRef]
- Duan, J.P.; Zhang, Y.L.; Yang, X.M. Experiment Research on Decarburization Technology of 80t Single Snorkel Vacuum Refining Equipment. Iron Steel 2011, 46, 21–25. [Google Scholar]
- Duan, J.P.; Zhang, Y.L.; Yang, X.M. Desulphurization Behavior of an 80t Multifunctional Single Snorkel Vacuum Refining Furnace. Steelmaking 2011, 27, 44–48. [Google Scholar]
- Duan, J.P.; Zhang, Y.L.; Yang, X.M. Analysis of Commercial production Test on Metallurgical Functions of an 80t Single Snorkel Vacuum Refining Furnace. Spec. Steel 2012, 19, 26–29. [Google Scholar]
- Qin, Z.; Pan, H.W.; Zhu, M.T. Modeling Study on Flow Behaviors of Molten Steel in Single Snorkel Refining Furnace. Iron Steel 2011, 46, 22–25. [Google Scholar]
- Yang, X.M.; Zhang, M.; Wang, F. Mathematical Simulation of Flow Field for Molten Steel in an 80–ton Single Snorkel Vacuum Refining Furnace. Steel Res. Int. 2012, 83, 52–82. [Google Scholar] [CrossRef]
- Aoki, H.; Kitamura, S.; Miyamoto, K. Development of New Secondary Refining Process–READ. Ironsteelmaker 1999, 26, 17–21. [Google Scholar]
- Kitamura, S.; Aoki, H.; Miyamoto, K.; Furuta, H.; Yamashita, K.; Yonezawa, K. Development of a Novel Degassing Process Consisting with Single Large Immersion Snorkel and a Bottom bubbling ladle. ISIJ Int. 2000, 40, 455–459. [Google Scholar] [CrossRef]
- Miyamoto, K.; Aoki, H.; Kitamura, S. Comparison of the Vacuum Degasser Characteristics by Water Model. CAMP–ISIJ 1998, 11, 756. [Google Scholar]
- Aoki, H.; Furuta, H.; Hirashims, N. Experimental Result of 175ton Vacuum Degasser by Large Snorkel with Bottom Gas Bubbling. CAMP–ISIJ 1998, 11, 757. [Google Scholar]
- Aoki, H.; Furuta, H.; Fujiwara, K. Improvement of 350ton DH to New Type Vacuum Degasser by Large Snorkel with Bottom Gas bubbling. CAMP–ISIJ 1998, 11, 758. [Google Scholar]
- Sugano, H.; Shinkai, A.; Kato, K. Steelmaking of Stainless Steel by New Type Vacuum Degasser. CAMP–ISIJ 1999, 12, 747. [Google Scholar]
- Miyamoto, K.; Sugano, H.; Shinkai, A.; Kato, K.; Kitamura, S.; Yamashita, K. Reaction Behavior Stainless Steel in New Type Vacuum Degasser (Development of New Type Vacuum Degasser (REDA–5)). CAMP–ISIJ 1999, 12, 748. [Google Scholar]
- Mondal, M.K.; Maruoka, N.; Gupta, G.S.; Nogami, H.; Kitamura, S.; Shibata, H. Study of Fluid Flow and Mixing Behaviour of a Vacuum Degasser. Trans. Indian Inst. Met. 2012, 65, 321–331. [Google Scholar] [CrossRef]
- Schiller, L.; Naumann, A. A drag coefficient correlation. Z. Ver. Deutsch. Ing. 1935, 77, 318–320. [Google Scholar]
- Diaz, M.E.; Montes, F.J.; Galan, M.A. Influence of the lift force closures on the numerical simulation of bubble plumes in a rectangular bubble column. Chem. Eng. Sci. 2009, 64, 930–944. [Google Scholar] [CrossRef]
- Tomiyama, A.; Shimada, N.; Galan, M. A numerical method for bubbly flow simulation based on a multi-fluid model. J. Press. Vessel Technol. 2001, 123, 510–516. [Google Scholar] [CrossRef]
- Tomiyama, A.; Tamai, H.; Zun, I.; Hosokawa, S. Transverse migration of single bubbles in simple shear flows. Chem. Eng. Sci. 2002, 57, 1849–1858. [Google Scholar] [CrossRef]
- Frank, T.; Zwart, P.J.; Krepper, E.; Prasser, H.-M.; Lucas, D. Validation of CFD models for mono- and polydisperse air–water two-phase flows in pipes. Nucl. Eng. Des. 2008, 238, 647–659. [Google Scholar] [CrossRef]
- Wellek, R.M.; Agrawal, A.K.; Skelland, A.H.P. Shape of liquid drops moving in liquid media. AIChE J. 1966, 12, 834–1032. [Google Scholar] [CrossRef]
- Cheung, C.P.; Yeoh, G.H.; Tu, J.Y. On the modelling of population balance in isothermal vertical bubbly flows-Average bubble number density approach. Chem. Eng. Process. 2007, 46, 742–756. [Google Scholar] [CrossRef]
- Yakhot, V.; Orszag, S.A.; Thangam, S.; Gatski, T.B.; Speziale, C.G. Development of turbulence models for shear flows by a double expansion technique. Phys. Fluids A Fluid Dyn. 1992, 4, 1510–1520. [Google Scholar] [CrossRef]
- Zhu, M.Y.; Sha, J.; Huang, Z.Z. Numerical Simulation of Molten Steel Flow in a RH Degasser. Acta Metall. Sin. 2000, 36, 1175–1178. [Google Scholar]
© 2019 by the authors. Licensee MDPI, Basel, Switzerland. This article is an open access article distributed under the terms and conditions of the Creative Commons Attribution (CC BY) license (http://creativecommons.org/licenses/by/4.0/).