Article

Evolution of White Etching Bands in 100Cr6 Bearing Steel under Rolling Contact-Fatigue

by
Hanwei Fu
1,* and
Pedro E. J. Rivera-Díaz-del-Castillo
2
1
School of Materials Science and Engineering, Beihang University, No. 37 Xueyuan Road, Haidian District, Beijing 100083, China
2
Department of Engineering, Engineering Building, Lancaster University, Lancashire LA1 4YW, UK
*
Author to whom correspondence should be addressed.
Metals 2019, 9(5), 491; https://doi.org/10.3390/met9050491
Submission received: 31 March 2019 / Revised: 20 April 2019 / Accepted: 23 April 2019 / Published: 27 April 2019
(This article belongs to the Special Issue Bearing Steels)

Abstract

:
The formation of white etching bands (WEBs) occurs at the subsurface of rolling contact-fatigued bearing inner rings, exhibiting microstructural decay detrimental to bearing life. Despite the fact that WEBs have been observed in bearing steels for nearly 70 years, the understanding of WEB formation is still limited and mostly qualitative. Therefore, a systematic investigation is carried out in this research to reveal the evolution of WEBs with respect to the number of contact cycles. WEBs formed at different stages are reproduced by full-scale bearing RCF tests with predetermined numbers of cycles. Multi-scale characterisation techniques such as optical microscopy, micro-indentation, scanning and transmission electron microscopy and atomic force microscopy are conducted on the microstructural alterations to study the development and microstructure of WEBs. WEBs are found in the absence of dark etching regions which is attributed to the heat treatment. With an increasing number of cycles, WEBs grow in number density and in all three dimensions, and their formation is found to be controlled by the maximum shear stress component. Ferrite bands within WEBs that contain dislocation cells manifest accumulated plastic strain in the material. Based on the characterisation results, the evolution of plastic strain under RCF is quantified.

Graphical Abstract

1. Introduction

The formation of white etching bands (WEBs) occurs in martensitic 100Cr6 bearing steels at very high stress cycles (usually > 10 8 cycles) during rolling contact-fatigue (RCF) testing [1,2]. They manifest the instability of the material at the late stages of bearing life, exhibiting typical martensite decay [3,4,5,6]. WEBs are always found at the subsurface of a fatigued bearing inner ring. According to the Hertzian elastic contact theory [7], the stress distribution under rolling contact is unique, where the shear stress components peak at the subsurface, and therefore, it is generally believed that WEBs are induced by subsurface shearing [5,8,9]. Nonetheless, the stress component that is responsible for WEB formation is still unclear [9]. As the name indicates, WEBs can be revealed by Nital etchant and exhibit white contrast under optical microscopy (OM) with a long and thin band-like shape. If observing from the circumferential section of a fatigued bearing inner ring (the section parallel to the over-rolling direction (ORD) at the contact centre), as shown in Figure 1a, WEBs are inclined at a shallow angle with respect to the ORD. Many researchers [4,5,8,9] argued this angle to be 30 , although it may be altered by the local stress level. Besides, WEBs are found parallel to the contact surface in the axial section (the section perpendicular to the ORD) as presented in Figure 1b.
The structure of WEBs was revealed by transmission electron microscopy (TEM) [3,6]. A WEB consists of a ferrite band and lenticular carbides (LCs) adjacent to it. It is generally accepted that LCs are re-precipitated by consuming the carbon from ferrite bands [3,8,9]. The microstructure of ferrite bands, on the other hand, is composed of carbide-free dislocation cells [6], which resembles that caused by severe plastic deformation (SPD) [10,11,12]. The mechanism of such carbon segregation during the WEB formation process was recently explained and modelled by Fu et al. [6] with a novel dislocation-assisted carbon migration theory based on the Cottrell atmosphere theory [13]. According to the theory, gliding dislocations under cyclic loading act as vehicles transporting carbon from ferrite bands to their boundaries where LC precipitation occurs. Further chemical analysis indicated the composition of LCs is close to cementite. Due to carbon depletion in ferrite bands, the hardness of ferrite bands is lower than the parent matrix as detected by micro-indentation tests [14,15], while LCs are supposed to be a hard phase in the material. Such microstructural heterogeneities may favour crack initiation and thus are detrimental to bearing life. Moreover, experimental evidence [4] showed the interfaces between ferrite bands and LCs are the weak points of the microstructures upon loading.
Apart from the discussion on the formation mechanisms of WEBs, the development of WEBs is strongly associated with the extent of material decay under RCF. It was experimentally [3,16] proved that WEB formation can be accelerated by increasing contact pressure and operation temperature, and that WEBs evolve in size, number density and formation depth range with respect to the number of stress cycles. However, the relationship between WEB evolution and RCF testing conditions has not been comprehensively understood, and more importantly, WEBs manifest key factors that are crucial for RCF analysis, such as subsurface stress distribution and accumulated subsurface plastic strain [17]. In terms of bearing life analysis, the occurrence of WEBs increases the uncertainty in bearing life prediction as they affect the material response when cracks are formed. As pointed out by Hamdia et al. [18], the variations in matrix properties and local stress alter fracture energy fundamentally. Therefore, it is of great importance to study the evolution of microstructural alterations during WEB formation and the corresponding property changes so that key inputs for the uncertainty analysis of bearing failure can be obtained [19]. In this research, WEBs formed at different stages are reproduced by RCF tests with predetermined number of cycles; multi-scale characterisation is carried out on the WEBs; and a detailed stress and strain analysis is conducted.

2. Experiment

2.1. Material and Heat Treatment

The material studied in this research is 100Cr6 bearing steel with the composition listed in Table 1.
Standard heat treatment was applied to harden the RCF samples. The material was first austenitised at 860 C before quenched in a salt bath, and then tempered at 220 C for 4 h. The final hardness of the material was approximately 720 HV.

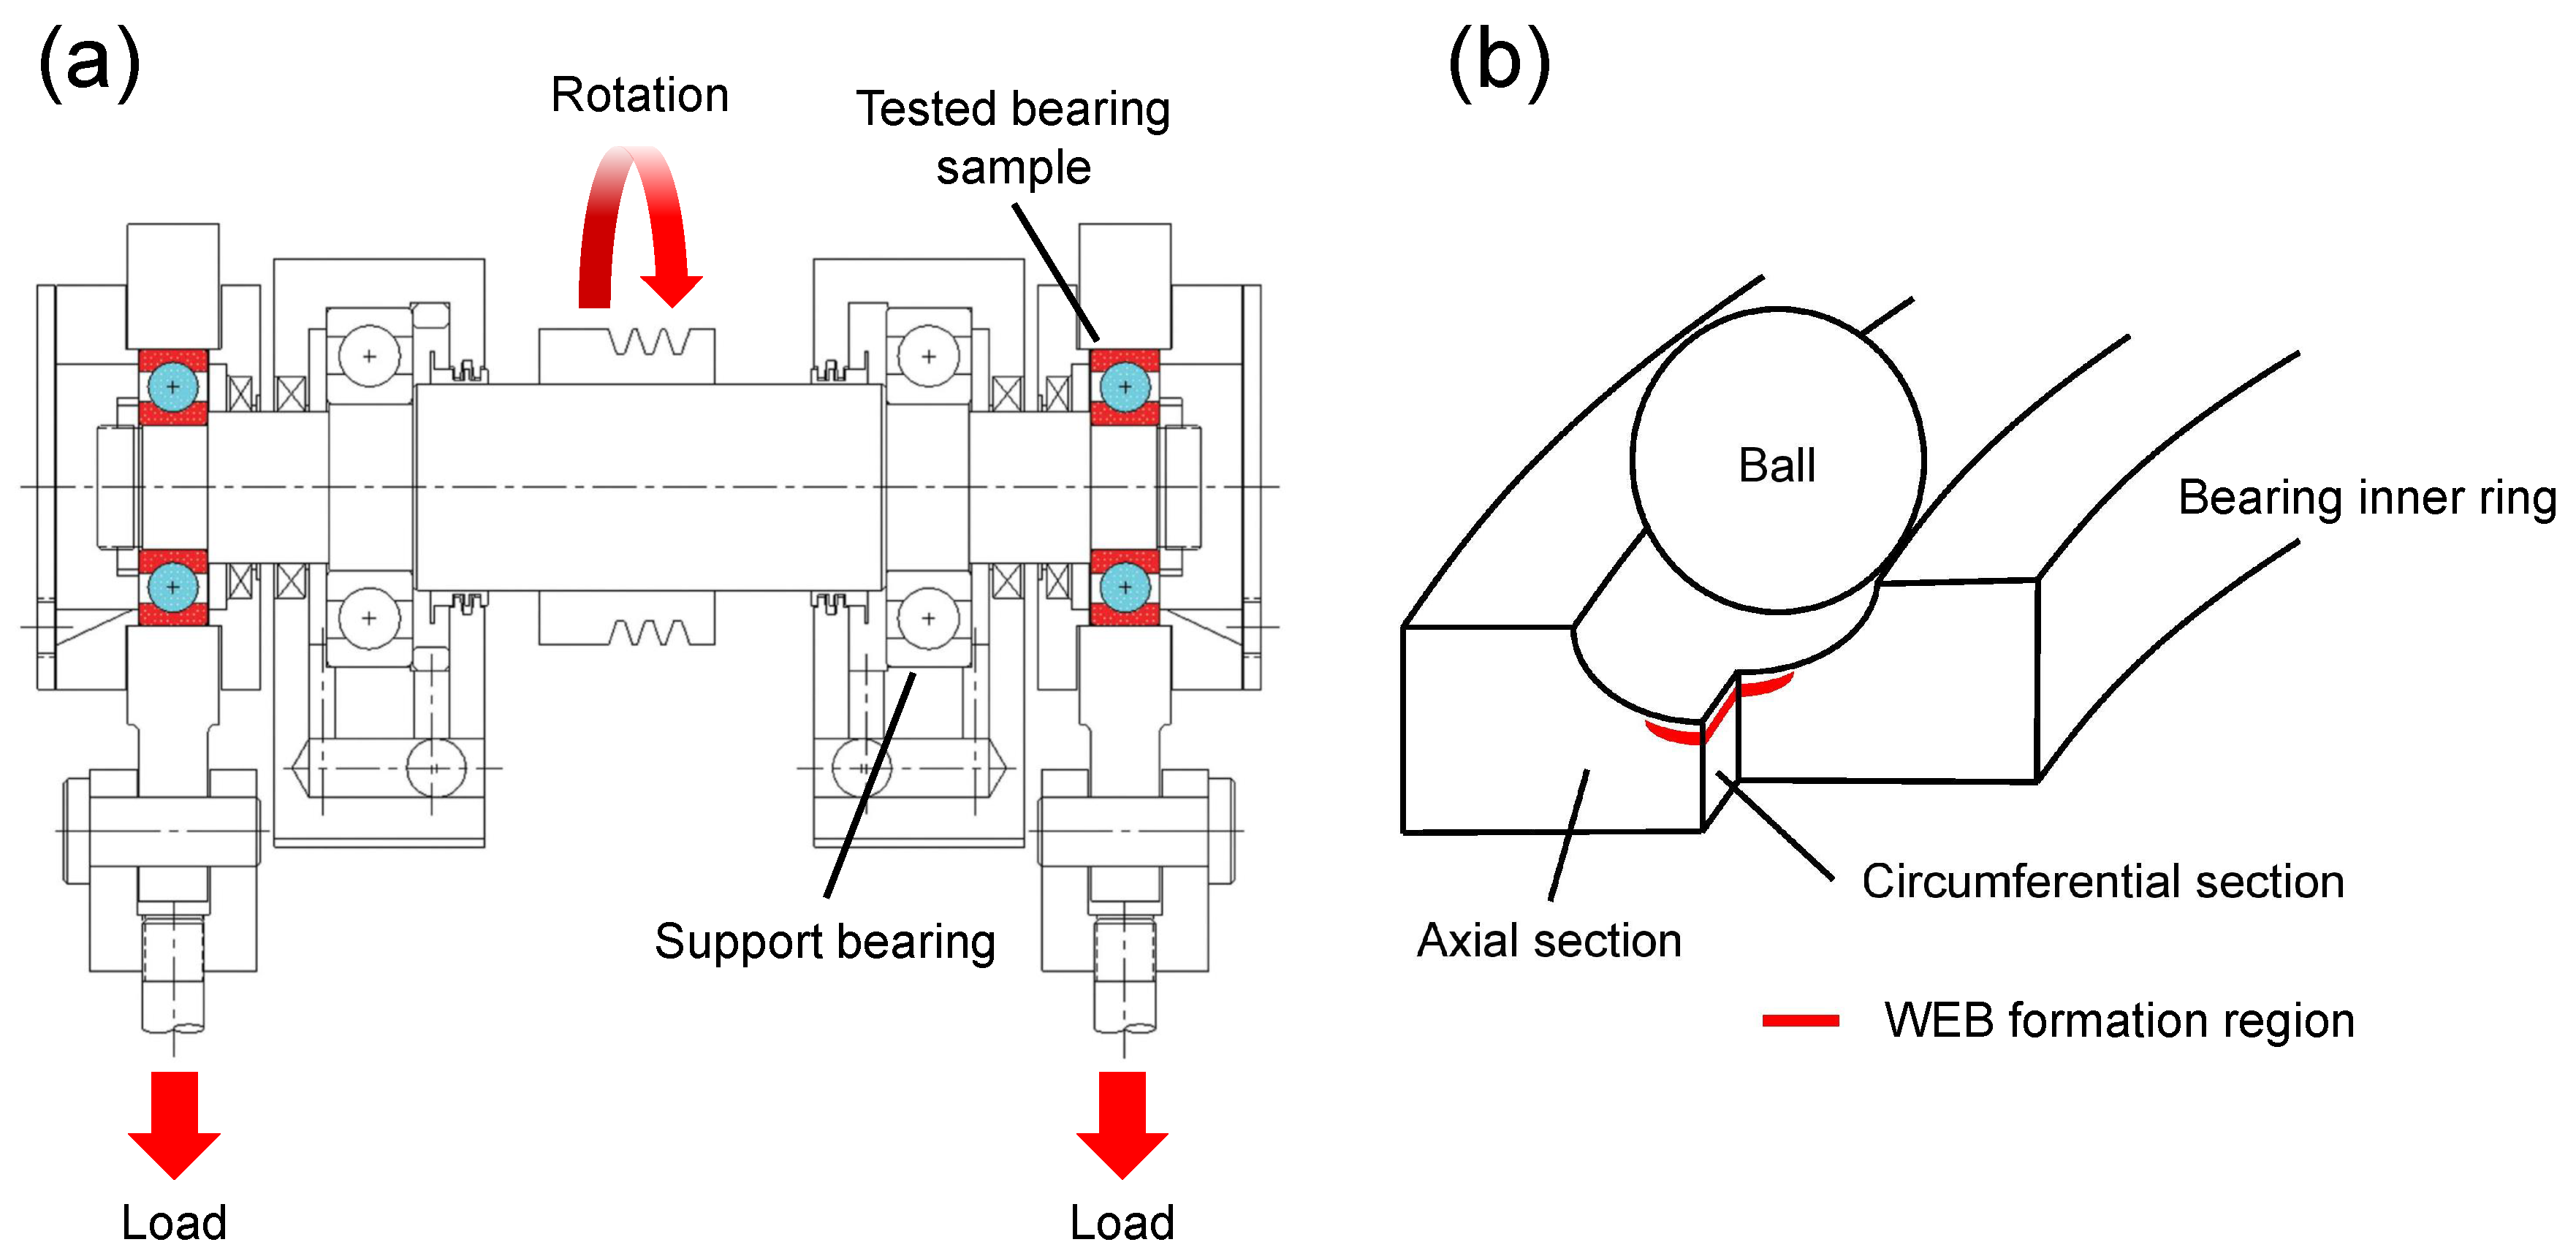
2.2. Rolling Contact-Fatigue Tests

Full-scale bearing tests were carried out on 3 through-hardened 6309 type deep groove ball bearings, using a SKF R2 test rig (Figure 2a). A radial load was applied to the balls and the resultant contact pressure was 3.3 GPa. The rotational speed of the motor was 6000 revolutions per minute, resulting in a stress cycle frequency of 30,000 cycles per minute. The outer ring was fixed during the tests such that the operational temperature was measured to be 70 C. The tests were suspended at 5 × 10 8 , 1 × 10 9 and 2 × 10 9 , respectively, in order to produce the microstructural alterations at different fatigue stages. The tests were conduced at a well lubricated condition where sliding was eliminated and pure rolling contact took place. The fatigued bearing inner rings were cut to show their axial and circumferential sections for further investigation (Figure 2b).

2.3. Characterisation: Microindentation and Microscopy

For all the sectioned surfaces, a standard metallographic surface preparation procedure was followed. The surfaces were first ground with SiC papers from coarse to fine grit sizes to remove deep scratches, and then polished with 6 μ m and 1 μ m diamond paste to reach a mirror finish. Finally, the surfaces were polished with a 0.3 μ m alumina suspension to remove the surface stress introduced during grinding and polishing. The surfaces for microscopic investigation were etched with 2% Nital to reveal the microstructure, while the microindentation tests were performed before etching.
Microindentation tests were performed with a Qness hardness tester on the circumferential sections of the samples, in order to obtain hardness evolution along the depth below contact surface. A Knoop indentation tip was employed for accurate hardness evolving trends. During each indentation test, the tip was loaded 0.1 kg with a holding time of 10 s and then unloaded. After the indentation, the computer automatically measured the long axis of the indent using a 650× optical microscope and calculated the hardness value. The result was directly converted from HK0.1 to HV0.1. The hardness tests were conducted in the form of indent rows, where in each row the first indent started from 30 μ m below contact surface and the following indents extended every 30 μ m along the depth for 600 μ m. At least six rows were repeated on each sample for averaging.
A variety of microscopic methods were employed to study the formation of WEBs. Optical microscopy (OM) was carried out with a Leica DM2500M microscope on all Nital etched samples at various magnifications to observe the distribution of WEBs. Scanning electron microscopy (SEM) was carried out with an FEI Nova NanoSEM 450 SEM for single WEB characterization. Dimensional information of WEBs, i.e., length, width and thickness were statistically analysed. Atom force microscopy (AFM) was carried out with a Bruker Nanoscope Multimode microscope at the intermittent contact mode, to study the chemical property difference between WEBs and the matrix. To further study the microstructural nature of WEBs, TEM was performed using an FEI Technai F20 TEM. The lamellar TEM sample containing a WEB section was prepared in an FEI Helios NanoLab workstation.

3. Results

3.1. Web Distribution and Hardness Evolution

Figure 3a–c present the OM images at the subsurface of the three samples after microindentation test, along with the corresponding Vickers hardness variation ( Δ HV) with respect to the depth. WEBs inclined ∼21 to the over-rolling direction (ORD) were observed in all the three samples. This inclination angle is slightly lower than previously reported observations (∼30 ). In each sample, the region between the two dotted lines corresponds to where WEBs were observed. It can be clearly seen that with increasing number of cycles, the WEB formation region gradually broadens on both sides, indicating the nucleation of new WEBs. Moreover, the size and number density of WEBs also significantly increased with the number of cycles. The detailed information of WEB growth is presented in Figure 4. As for the hardness curves, all the three samples exhibit material hardening at the subsurface with the highest hardness being found at around 120 μ m depth. This suggests that one of the shear stress components, which also peak at the subsurface, is responsible for work hardening of the bearing steel undergoing RCF. Although run for various numbers of cycles, the magnitudes of hardness increase in the three samples are similar, 25–30 HV, which might be the saturation point of work hardening at this stress level. After the peaking point of hardness increase, the samples run for 5 × 10 8 cycles 1 × 10 9 cycles both show gradual hardness decrease until reaching the parent matrix hardness magnitude; the formation of WEBs in these two samples does not seem to have significant influence on hardness measurement. However, distinct material softening can be observed in the sample run for 2 × 10 9 cycles, and the softening region agrees with the WEBs formation region. This is quite understandable as the area fraction of the soft WEB microstructure, which is decided jointly by the size and number density of WEBs, must exceed a critical extent before the softening effect of WEBs can be detected by the indents.
Figure 4 presents the statistical results of the dimensional information of WEBs with respect to the number of cycles. The length (l) and spacing of WEBs were measured from the circumferential sections of the samples using OM and the thickness (h) of WEBs were measured from the circumferential sections using SEM, whilst the width (w) of WEBs were measured from the axial sections using OM. Figure 4a–c indicate that with increasing number of stress cycles, WEBs grow in all the three dimensions and Figure 4d indicates the nucleation of new WEBs under RCF.

3.2. Web Structure

The structure of WEBs was revealed by SEM. Figure 5a shows a WEB consisting of a ferrite band (sketched by the dished lines) and a reprecipitated LC. This structure agrees with the reports from the literature. A closer observation of the WEB at a higher magnification is presented in Figure 5b, where the ferrite band microstructure after Nital etching becomes clear. It seems that the ferrite band microstructure is composed of numerous equalaxed subunits, which is quite different from the surrounding matrix microstructure containing typical martensitic plate-like features.
The topographic information of WEB formation regions after etching with Nital was revealed by AFM. Figure 6a,b show the imaging and corresponding 3-dimensional morphology of a bunch of WEBs. If taking the matrix height as reference, a number of long and thin stripes exhibiting relatively high magnitudes of height can be distinguished, similar to the primary θ carbides. The geometry of these stripes indicates them to be LCs. Adjacent to the LCs are bands exhibiting negative values of height, which hence corresponds to ferrite bands. A quantitative analysis of the morphology was conducted along the vector line drawn in Figure 6a with the result being presented in Figure 6c. The microstructural features encountered by the line path are also indexed accordingly. It can be concluded that the resistances to Nital etching of the microstructural features in the material, which are determined by their chemical properties, follow such a sequence: primary θ -carbides ≃ LCs > matrix > ferrite bands, which follows the descending trend of carbon content in these features.
Figure 7a is an SEM image of a TEM lamella lifted out from the sample run to 2 × 10 9 cycles. A WEB cross section can be found inside it. TEM characterisation results of this lamella with various magnifications are presented in Figure 7b–d. According to Figure 7b,c, a ferrite band is sandwiched by two LCs; the ferrite band contains a large number of dislocation cells, indicating severe plastic deformation occurrence. The size of the dislocation cells are measured to be with a size of 174 ± 73 nm. Also, large θ -carbides and nano-sized precipitates which were initially distributed in the parent matrix are found absent inside the ferrite band, suggesting their dissolution upon plastic deformation; surrounding the WEB is the deformed matrix, where the martensitic microstructure is slightly distorted by plastic strain. Figure 7d shows the details of the cellular structure in the ferrite band. dislocations are observed in both cell interiors and cell walls; dislocation clusters can be found as well.

4. Discussion

4.1. Webs without Dark Etching Region Formation

The evolution of WEBs in 100Cr6 bearing steel undergoing RCF is systematically investigated in this research. Contrary to the previous understanding that WEBs are formed on the top of fully developed dark etching regions (DERs) [3,4,5,20,21], the WEBs observed in all the three samples in this research are formed in the absence of DERs. The reason why DERs were eliminated should be attributed to heat treatment. Compared to the previous reports on DER formation in 100Cr6, the material studied in this research was tempered at a higher temperature (220 C vs. 160 C) and for a longer time (240 min vs. 60–90 min); the severer tempering leads to more mature precipitates and consequently poorer coherence between the precipitates and the matrix [22]. A recent study [23] shows that DER formation is caused by the continuous growth of pre-existing precipitates, which is triggered by the dislocation-assisted carbon migration mechanism; therefore in this case such carbon migration might be blocked by the poorly bonded precipitate/matrix interface. Nonetheless, the hardness of the matrix may be a key factor in terms of WEB appearance. Due to the fact that DERs soften the martensitic matrix, in the reported 100Cr6 samples containing DERs the matrix hardness can drop from initially 820 HV to as low as 650 HV [5], and WEBs are frequently found nucleated on the top of fully developed DERs. Whereas in this research, the initial hardness of the steel after heat treatment was about 720 HV, and WEBs were nucleated directly in the matrix, although slight work hardening occurred prior to their formation. Hence a reasonable speculation is that there exists a threshold hardness of around 720 HV below which WEBs can be formed, and that as long as this threshold hardness is achieved, either by DER formation or by heat treatment, WEB formation becomes feasible.

4.2. Stress Analysis

As generally accepted, WEB appearance is associated with subsurface shearing, although the responsible shear stress component requires further analysis. In Figure 8a, the centre of the contact ellipse is defined as the original point (O); the rolling direction is defined as y axis; and the depth direction is defined as z axis. Hence the interested plane in terms of WEB formation is the y z plane. The stress state under rolling contact-fatigue can be calculated by Hertzian elastic contact theory [7]. Figure 8c presents the evolution trends of the orthogonal shear stress ( τ y z ) and the maximum shear stress ( τ m a x ) along the z direction, both of which peak at the subsurface. Figure 8d,e present the 2-dimensional distributions of these shear stress components in the y z plane. It should be noted that at a certain depth the peak values of τ y z occur on the two sides of the z axis, with the same magnitude but the opposite directions. Whereas τ m a x exhibits a symmetric distribution with respect to the z axis with the maximum occurring along the z axis.
Comparing Figure 8c with Figure 3a–c, it is interesting to find that at the subsurface the work hardening region agrees with the τ y z profile and the WEB formation region agrees with the τ m a x profile. Moreover, the broadening of the WEB formation region, i.e., the shift of the upper and lower boundaries, with increasing number of cycles follows the τ m a x profile, as shown in Figure 9a. Each pair of boundaries points to a critical stress level for WEB nucleation under a given number of cycles. Nonetheless, the WEB formation cannot be broadened unlimitedly. As WEB formation is a manifestation of plastic deformation, the broadening of WEB formation region should stop at where the applied shear stress equals the yield shear strength ( τ Y ) of the material, which was measured by tensile test to be 0.74 GPa [6]. According to Fu et al. [6], the development of WEBs can be theoretically predicted by the following two equations:
d l L C d N C V θ C V b = Δ γ b 3 π 2 1 3 A D k T N ˙ 2 3 C V b ,
λ C V 0 = l L C = l L C C V θ + λ l L C C V b ,
where l L C denotes the thickness of lenticular carbides, N denotes the number of stress cycles, C V θ and C V b denote the carbon concentrations in a lenticular carbide and its adjacent ferrite band, respectively, Δ γ denotes the local plastic shear strain per stress cycle, b denotes the magnitude of Burgers vector, A denotes the interaction energy between a carbon atom and a dislocation strain field, D denotes the diffusion coefficient of carbon atoms in body-centred cubic iron, k denotes the Boltzmann constant, T denotes temperature and N ˙ denotes rotational speed, λ denotes the width of a fully developed WEB, and C V 0 denotes the overall carbon concentration of the steel. Equation (1) describes the carbon flux equilibrium during LC precipitation process and Equation (2) describes the mass conservation of carbon. The values of the constants are listed in Table 2.
The model introduces a term WEB% to account for the extent of WEB growth. Based on the model, Figure 9b presents the calculated growth curves for the WEBs located at the boundaries of the WEB formation regions in the three samples, all ending at 6–7%. These completion points agree with the experimental observations and the agreement between the three samples further justifies the relationship between the magnitude of applied stress and the number of stress cycles required for WEB appearance as described by the proposed model.

4.3. Plastic Strain Analysis

The OM results indicate that WEBs exhibit a plate-shape in three dimensions, as schematically shown in Figure 8b. After the saturation of work hardening, the formation of localised WEBs seems to be the sole means to accommodate the accumulated plastic strain introduced by cyclic loading. Therefore, the magnitude of global accumulated plastic strain can be estimated through the volume fraction of WEBs in the volume of interest. Considering the stress-affected region under the testing stress level with the depth range being approximately 100–677 μ m and combining the statistical data presented in Figure 4, the estimated volume fractions of WEBs in the stress-affected region of the three samples are 0.11%, 0.7% and 1.35% respectively. The TEM results suggest that the accumulated plastic deformation is undertaken by dislocation cell formation in ferrite bands. It is generally thought that dislocation cell size ( d c ) is inversely proportional to dislocation density ( ρ ), i.e., d c = κ ρ [24], where κ is the coefficient of proportionality. The magnitude of κ for ferrite can be calculated based on a thermodynamic approach [24]:
κ = 24 π ( 1 ν ) ( 2 + ν ) 1 2 + T Δ S G b 3 ,
where ν is the Poisson’s ratio and Δ S is the statistical entropy associated to dislocation glide. By inputting the material constants listed in Table 2 and the RCF testing conditions, κ is calculated to be 13.1217. Given the average dislocation cell size in ferrite bands to be 174 nm, the dislocation density in ferrite bands ( ρ b ) is estimated to be 5.69 × 10 15 m 2 . The dislocation density of the steel at the onset of plastic deformation ( ρ Y ) can be estimated based on the yield strength ( σ Y ) through the Taylor’s equation: σ Y = α M G b ρ Y , where α is a material constant, M is the Taylor factor and G is the shear modulus. The values of these constants are listed in Table 2 The dislocation density evolution is a consequence of plastic deformation, which can be described by the Kocks-Mecking equation [25]:
d ρ d γ = k 1 b ρ f ρ ,
where γ is the plastic shear stress, k 1 and f are material constants that control dislocation multiplication and annihilation, respectively, the values of which are also listed in Table 2. Using Equation (4), the plastic strain occurring in ferrite bands that leads to the dislocation density increase from ρ Y to ρ b is estimated to be 1.38. Hence the evolution of accumulated plastic shear strain ( γ a ) in the stress-affected region with respect to the number of stress cycles is plotted in Figure 10. The estimation of accumulated local plastic strain combining with the Hertzian stress analysis can be further incorporated into professional multiscale failure modelling frameworks such as coarse-grained (CG) model [26] and extended finite element methods (XFEM) [27] to enhance their accuracy.

5. Conclusions

The evolution of WEBs in rolling contact-fatigued 100Cr6 bearing steel was systematically investigated. Full-scale bearing tests suspended at 5 × 10 8 , 1 × 10 9 and 2 × 10 9 cycles were conducted to reproduce the microstructural alterations at different stages for comparison. The WEBs were studied by multi-scale characterisation along with detailed stress and strain analysis. Several conclusions can be drawn from this research as follows:
  • In contrary to some previous studies, WEBs in this research are formed in the absence of DERs. The heat treatment resulting in the precipitates that are poorly bonded to the matrix is believed to be the cause of DER elimination. It is proposed that DERs are not formed in 100Cr6 bearing steel with a hardness lower than 720 HV after heat treatment.
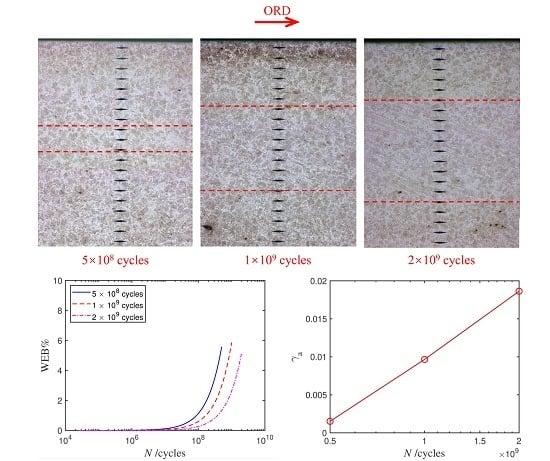
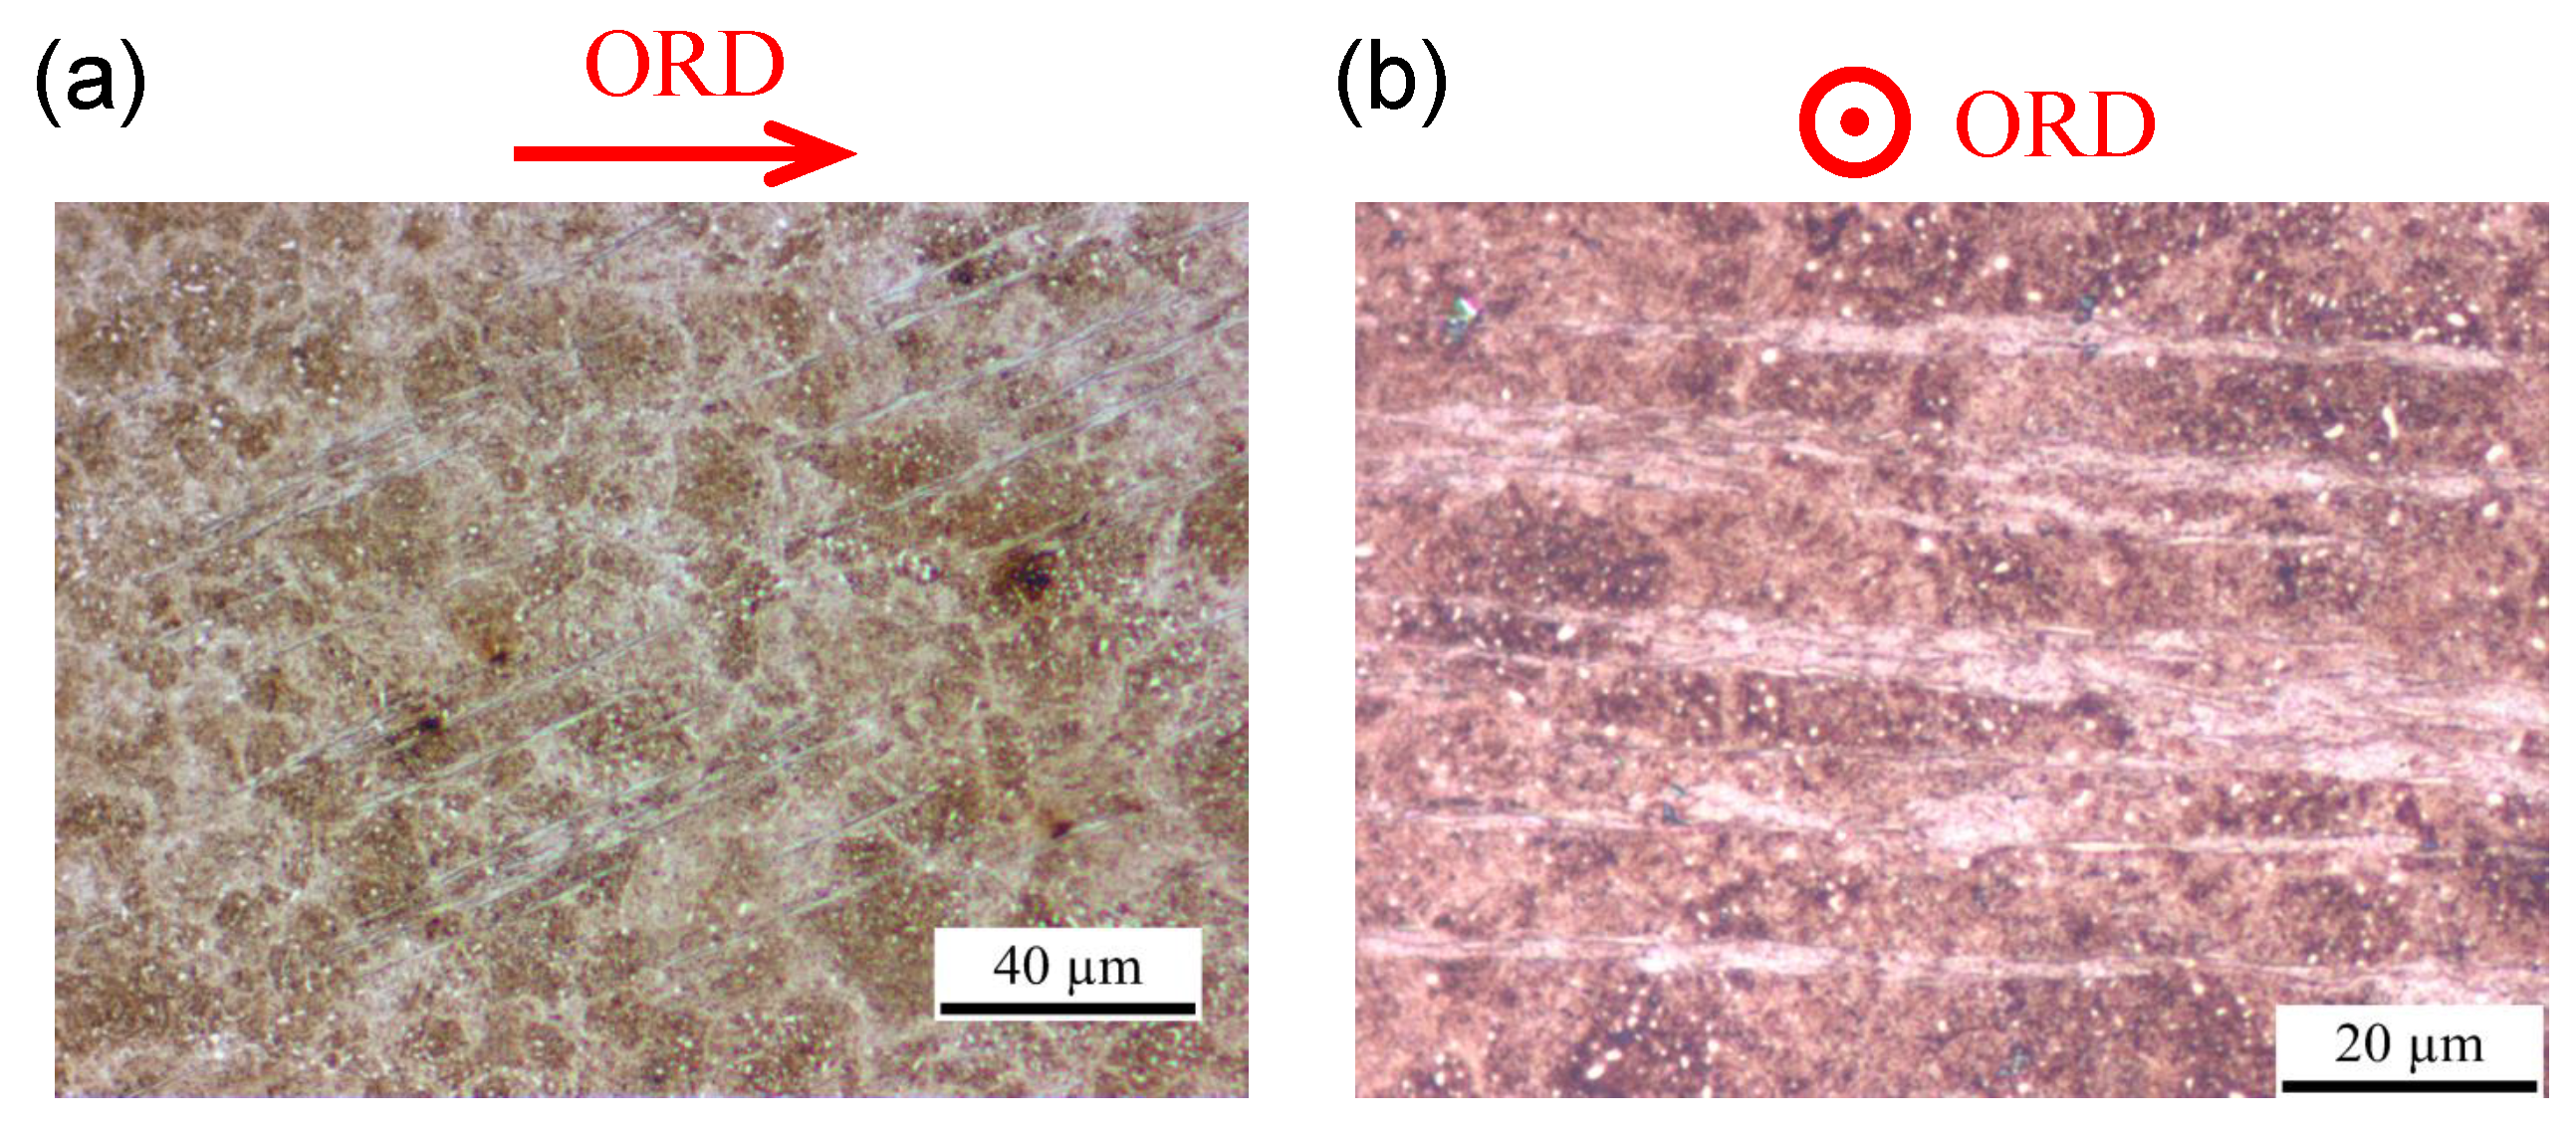
  • OM clearly shows that plate-like WEBs grow in all three dimensions and in number density at the subsurface of rolling contact-fatigued bearing inner ring with increasing number of cycles. Micro-indentation results indicate an obvious hardness decrease of approximately 50 HV in the sample run to 2 × 10 9 cycles as a consequence of WEB formation.
  • During RCF, work hardening is controlled by orthogonal shear stress component and reaches a saturation (25–30 HV hardness increase) at the early stage of bearing life; while WEB formation is dominated by maximum shear stress with the WEB formation region being gradually broadened along the depth with increasing number of cycles.
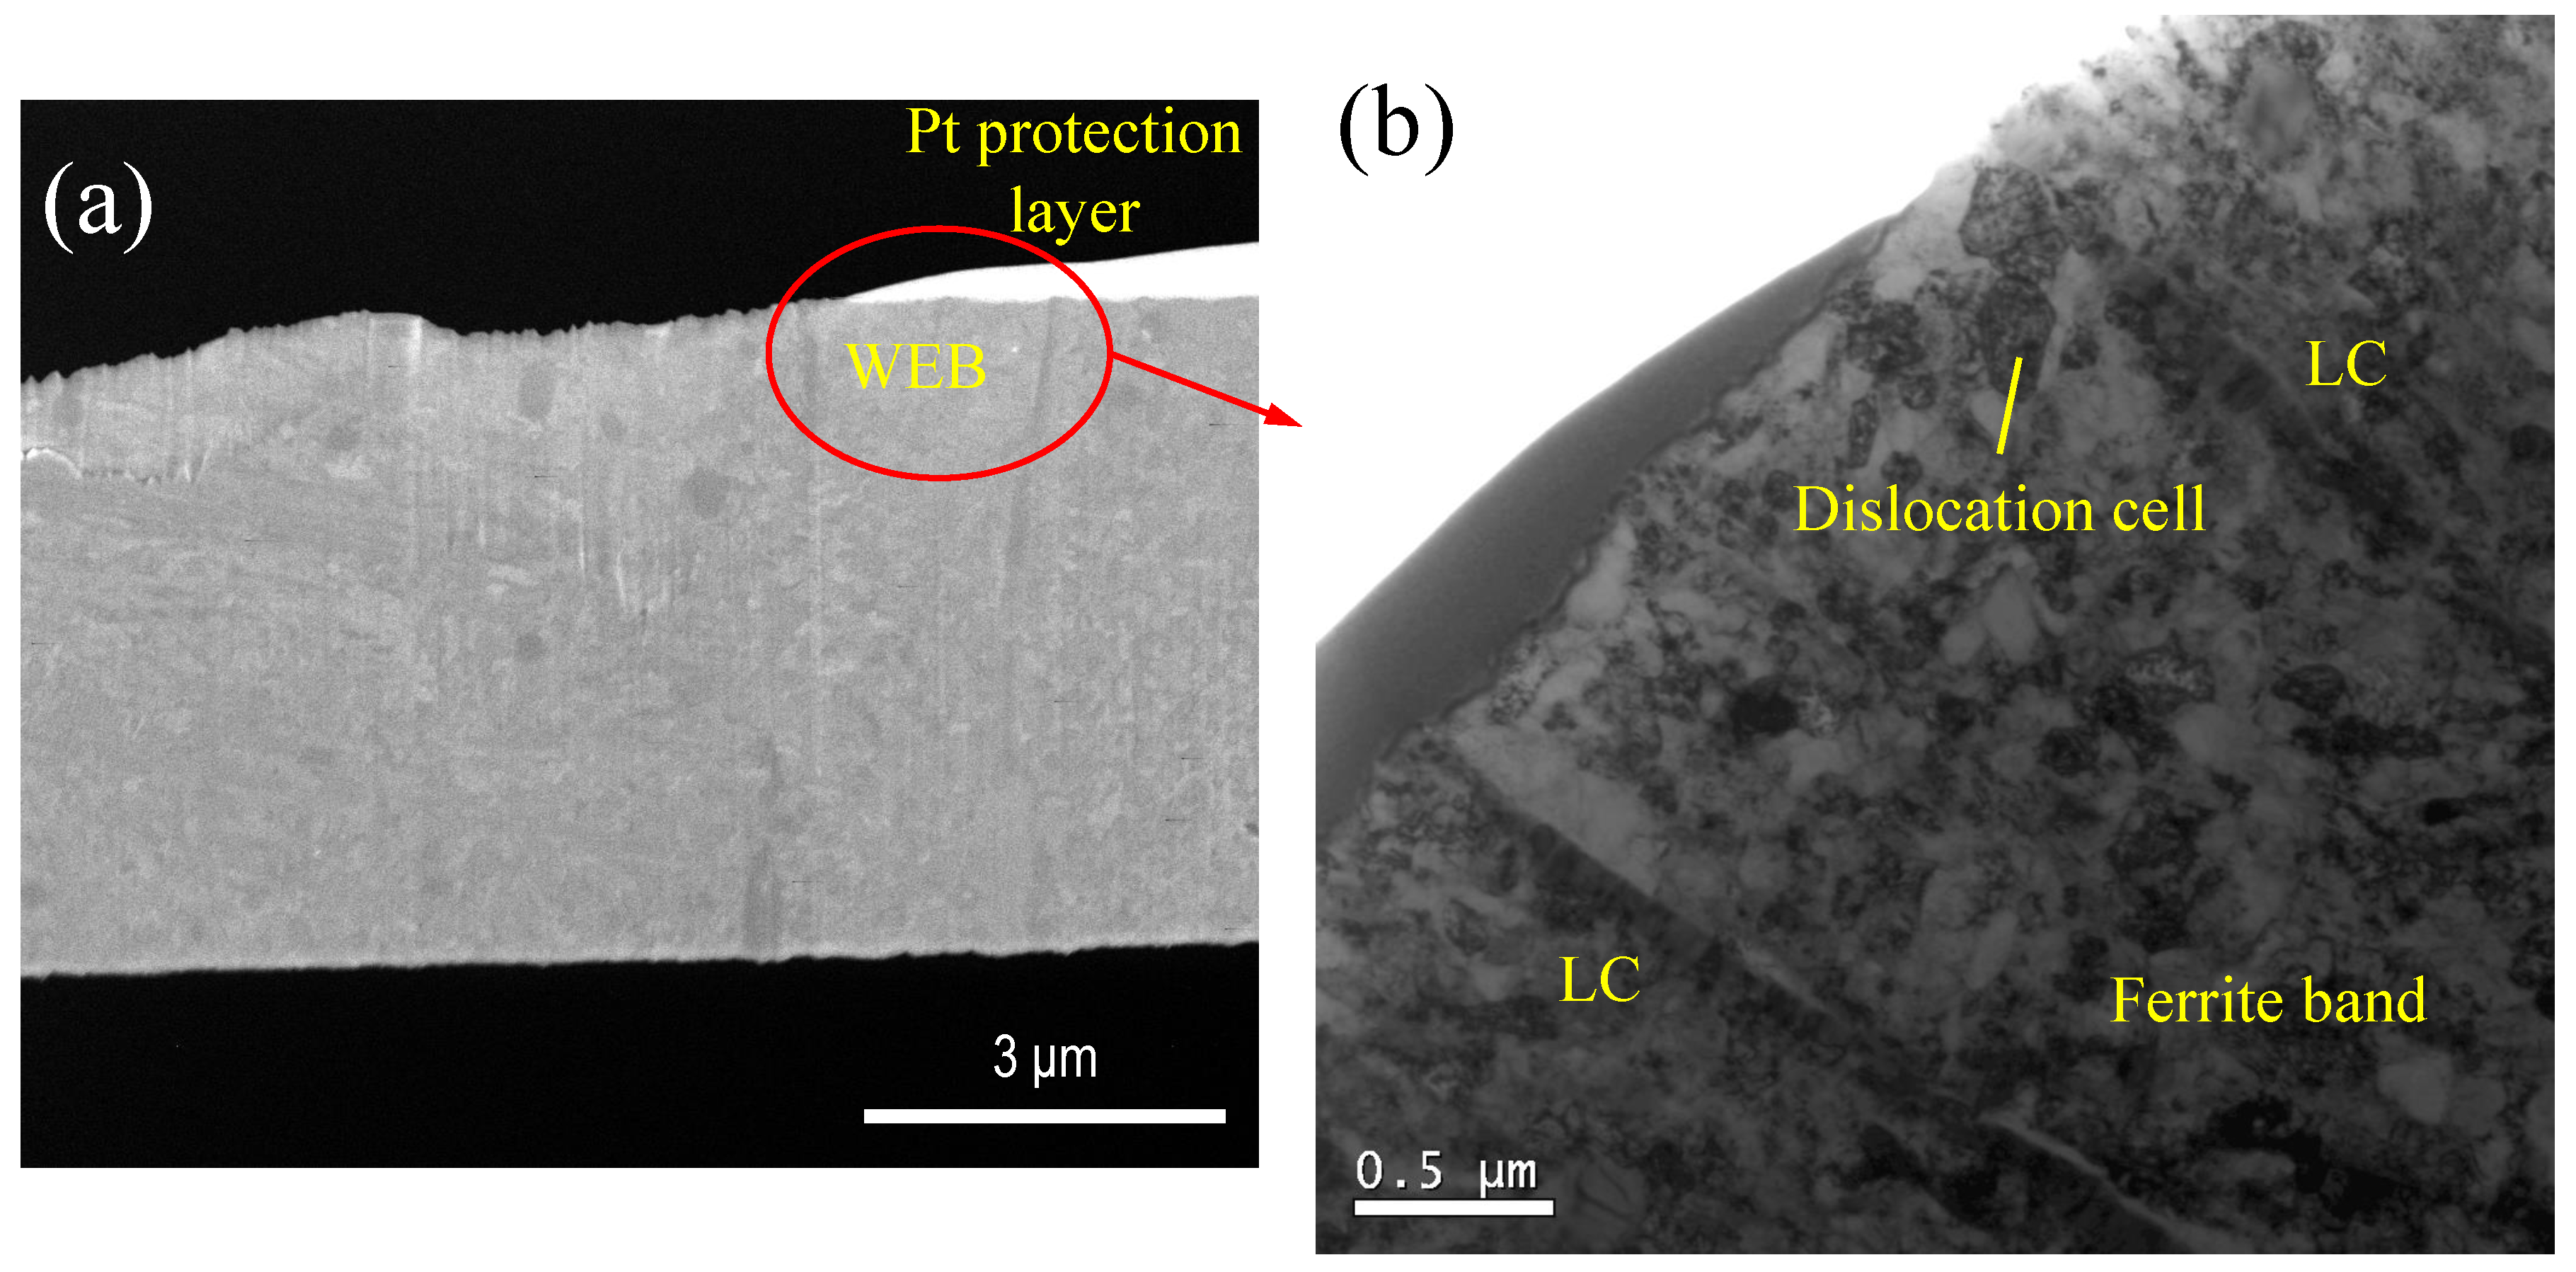
  • A WEB consists of a ferrite band and LCs adjacent to it. AFM reveals the order of the resistant to Nital etchant of the microstructural features in the steel to be primary θ -carbides ≃ LCs > matrix > ferrite bands, which suggests that carbon improves the etching resistance of the features.
  • TEM shows that ferrite bands contains dislocation cells with their average size to be 174 nm, indicative of plastic deformation.
  • WEBs manifest the accumulated plastic strain induced by RCF. Based on the characterisation results, the dislocation density in ferrite bands is theoretically estimated to be 5.69 × 10 15 m 2 , and the magnitudes of accumulated plastic strain in the three samples with the increasing number of cycles are estimated to be 0.001518, 0.00966 and 0.01863, respectively.

Author Contributions

Methodology, experimental, data analysis, coding and writing–original draft preparation, H.F.; writing–review and editing, conceptualisation and supervision of work, P.E.J.R.-D.-d.-C.

Funding

This research was funded by Beihang top young talent support program under Grant No. KG12079901 and by SKF Engineering & Research Center. The Royal Academy of Engineering funded P.E.J.R.-D.-d.-C.

Acknowledgments

The authors are grateful to J.L. for the fruitful discussions. The authors would also like to express gratitudes to J.J.R. for the assistance on AFM operation.

Conflicts of Interest

The authors declare no conflict of interest. The funder had no role in the design of the study; in the collection, analyses, or interpretation of data; in the writing of the manuscript. The funder approved the publication of the results.

Abbreviations

The following abbreviations are used in this manuscript:
RCFRolling contact-fatigue
WEBsWhite etching bands
DERsDark etching regions
LCsLenticular carbides
OMOptical microscopy
SEMScanning electron microscopy
TEMTransmission electron microscopy
AFMAtomic force microscopy

References

  1. Warhadpande, A.; Sadeghi, F.; Evans, R.D. Microstructural Alterations in Bearing Steels under Rolling Contact Fatigue Part 1—Historical Overview. Tribol. Trans. 2013, 56, 349–358. [Google Scholar] [CrossRef]
  2. Kang, J.H.; Hosseinkhani, B.; Rivera-Díaz-del Castillo, P.E.J. Rolling contact-fatigue in bearings: Multiscale overview. Mater. Sci. Technol. 2012, 28, 44–49. [Google Scholar] [CrossRef]
  3. Swahn, H.; Becker, P.C.; Vingsbo, O. Martensite decay during rolling contact-fatigue in ball bearings. Metall. Trans. A 1976, 7, 1099–1110. [Google Scholar] [CrossRef]
  4. Martin, J.A.; Borgese, S.F.; Eberhardt, A.D. Microstructural Alterations of Rolling—Bearing Steel Undergoing Cyclic Stressing. J. Fluids Eng. 1966, 88, 555–565. [Google Scholar] [CrossRef]
  5. Bush, J.J.; Grube, W.L.; Robinson, G.H. Microstructural and residual stress changes in hardened steel due to rolling contact. Trans. ASM 1961, 54, 390–412. [Google Scholar]
  6. Fu, H.; Galindo-Nava, E.; Rivera-Díaz-del Castillo, P.E.J. Modelling and characterisation of stress-induced carbide precipitation in bearing steels under rolling contact-fatigue. Acta Mater. 2017, 128, 176–187. [Google Scholar] [CrossRef]
  7. Johnson, K. Contact Mechanics; Cambridge University Press: Cambridge, UK, 1987. [Google Scholar]
  8. Buchwald, J.; Heckel, R.W. An analysis of microstructural changes in 52100 steel bearings during cyclic stressing(Microstructural changes in 52100 steel bearing inner rings during cyclic stressing, obtaining thickening rate data on white-etching regions and lenticular carbides). ASM Trans. Q. 1968, 61, 750–756. [Google Scholar]
  9. Polonsky, I.A.; Keer, L.M. On white etching band formation in rolling bearings. J. Mech. Phys. Solids 1995, 43, 637–669. [Google Scholar] [CrossRef]
  10. Grabulov, A.; Petrov, R.; Zandbergen, H.W. EBSD investigation of the crack initiation and TEM/FIB analyses of the microstructural changes around the cracks formed under rolling contact fatigue (RCF). Int. J. Fatigue 2010, 32, 576–583. [Google Scholar] [CrossRef]
  11. Grabulov, A.; Ziese, U.; Zandbergen, H.W. TEM/SEM investigation of microstructural changes within the white etching area under rolling contact-fatigue and 3-D crack reconstruction by focused ion beam. Scr. Mater. 2007, 57, 635–638. [Google Scholar] [CrossRef]
  12. Fu, H.; Rivera-Díaz-del Castillo, P.E.J. A unified theory for microstructural alterations in bearing steels under rolling contact-fatigue. Acta Mater. 2018, 155, 43–55. [Google Scholar] [CrossRef]
  13. Cottrell, A.H.; Bilby, B.A. Dislocation theory of yielding and strain ageing of iron. Proc. Phys. Soc. A 1949, 62, 49. [Google Scholar] [CrossRef]
  14. Österlund, R.; Vingsbo, O. Phase changes in fatigued ball bearings. Metall. Trans. A 1980, 11, 701–707. [Google Scholar] [CrossRef]
  15. Ochi, T.; Kusano, Y. Change in Microstructure and Properties in the Rolling Contact Fatigue of Bearing Steel. Nippon Steel Tech. Rep. 1999, 80, 19–25. [Google Scholar]
  16. Zwirlein, O.; Schlicht, H. Rolling contact-fatigue mechanisms—Accelerated testing versus field performance. Roll. contact-fatigue Test. Bear. Steels 1982, 771, 358–379. [Google Scholar]
  17. Voskamp, A.P. Material response to rolling contact loading. J. Tribol. 1985, 107, 359–364. [Google Scholar] [CrossRef]
  18. Hamdia, K.M.; Silani, M.; Zhuang, X.; He, P.; Rabczuk, T. Stochastic analysis of the fracture toughness of polymeric nanoparticle composites using polynomial chaos expansions. Int. J. Fract. 2017, 206, 215–227. [Google Scholar] [CrossRef]
  19. Vu-Bac, N.; Lahmer, T.; Zhuang, X.; Nguyen-Thoi, T.; Rabczuk, T. A software framework for probabilistic sensitivity analysis for computationally expensive models. Adv. Eng. Softw. 2016, 100, 19–31. [Google Scholar] [CrossRef]
  20. Jones, A.B. Metallographic observations of ball bearing fatigue phenomena. In Proceedings of the STP70-EB Symposium on Testing of Bearings, West Conshohocken, PA, USA, 24–28 June 1946; pp. 35–52. [Google Scholar] [CrossRef]
  21. Lund, T. Structural alterations in fatigue-tested ball-bearing steel. Jemkonter A 1969, 153, 337–343. [Google Scholar]
  22. Barrow, A.T.W.; Kang, J.H.; Rivera-Díaz-del Castillo, P.E.J. The ϵηθ transition in 100Cr6 and its effect on mechanical properties. Acta Mater. 2012, 60, 2805–2815. [Google Scholar] [CrossRef]
  23. Fu, H.; Song, W.; Galindo-Nava, E.I.; Rivera-Díaz-del Castillo, P.E.J. Strain-induced martensite decay in bearing steels under rolling contact-fatigue: Modelling and atomic-scale characterisation. Acta Mater. 2017, 139, 163–173. [Google Scholar] [CrossRef]
  24. Galindo-Nava, E.I.; Rivera-Díaz-del Castillo, P.E.J. A thermodynamic theory for dislocation cell formation and misorientation in metals. Acta Mater. 2012, 60, 4370–4378. [Google Scholar] [CrossRef]
  25. Galindo-Nava, E.I.; Sietsma, J.; Rivera-Díaz-del Castillo, P.E.J. Dislocation annihilation in plastic deformation: II. Kocks-Mecking Analysis. Acta Mater. 2012, 60, 2615–2624. [Google Scholar] [CrossRef]
  26. Budarapu, P.R.; Gracie, R.; Yang, S.W.; Zhuang, X.; Rabczuk, T. Efficient coarse graining in multiscale modeling of fracture. Theor. Appl. Fract. Mech. 2014, 69, 126–143. [Google Scholar] [CrossRef]
  27. Talebi, H.; Silani, M.; Bordas, S.P.; Kerfriden, P.; Rabczuk, T. A computational library for multiscale modeling of material failure. Comput. Mech. 2014, 53, 1047–1071. [Google Scholar] [CrossRef]
  28. Bhadeshia, H.K.D.H.; Honeycombe, R. Steels: Microstructure and Properties; Butterworth-Heinemann: Oxford, UK, 2011. [Google Scholar]
Figure 1. Formation of WEBs in a bearing inner ring observed from the circumferential section (a) and the axial section (b).
Metals 09 00491 g001
Figure 2. RCF testing. (a) Schematic of SKF R2 RCF test rig. (b) Schematic of a bearing inner ring showing where WEBs can be observed.
Metals 09 00491 g002
Figure 3. Hardness profiles and corresponding OM images for the samples run to (a) 5 × 10 8 , (b) 1 × 10 9 and (c) 2 × 10 9 cycles.
Metals 09 00491 g003
Figure 4. Statistical measurements of WEB length (a), width (b), thickness (c) and spacing (d) in the three samples. The error bars represent standard deviation.
Metals 09 00491 g004
Figure 5. SEM images of WEBs. (a) Typical WEB structure. (b) Ferrite band microstructure.
Metals 09 00491 g005
Figure 6. AFM characterisation on WEBs formed in the sample run to 2 × 10 9 cycles. (a) 2-dimensional AFM image of WEBs. (b) Topographic image of the WEBs shown in (a). (c) Height measurements of microstructural features along the arrowed line in (a).
Metals 09 00491 g006aMetals 09 00491 g006b
Figure 7. FIB/TEM characterisation on a WEB. (a) TEM lamella containing a WEB prepared by FIB. (bd) TEM images of the WEB at different magnifications.
Metals 09 00491 g007aMetals 09 00491 g007b
Figure 8. Stress analysis for WEB formation. (a) Schematic of rolling contact defining the coordinate system. (b) Schematic of a plate-like WEB. (c) Orthogonal and maximum shear stress components along the centre line of rolling contact. (d) Distribution of orthogonal shear stress in y z plane. (e) Distribution of maximum shear stress in y z plane.
Metals 09 00491 g008
Figure 9. WEB appearance analysis. (a) Critical stress for WEB appearance in the samples indexed by the boundaries of WEB formation region. (b) Calculated development extent of WEBs located at the boundaries of WEB formation region.
Metals 09 00491 g009
Figure 10. Evolution of accumulated plastic strain as a result of WEB formation with respect to the number of cycles.
Metals 09 00491 g010
Table 1. Composition of 100Cr6 in this research (all values in wt%).
FeCCrMnSiCuNiMoAl
Balanced0.971.380.280.280.210.180.060.04
Table 2. Values of the material constants used for calculation.
ConstantValue
C V θ 3.36 × 10 27 m 3
b0.2876 nm
A3 × 10 30 Nm 2 [13]
D4.11 × 10 19 m 2 s 1 [28]
k1.38 × 10 23 m 2 kgs 2 K 1
ν 0.33
Δ S 8.98 × 10 22 JK 1 [24]
G80 GPa
α 0.3
M3
k 1 0.0287 [25]
f0.6601 [25]

