Grain Refinement of Hypereutectic Immiscible Cu-50Cr Alloy during Rapid Melting and Solidification Induced by High Power Density Laser Beams

Abstract
:1. Introduction
2. Experiments
2.1. Material and Methods
2.2. Characterization
2.3. Interruption Capability and Withstanding Voltage Tests
3. Results
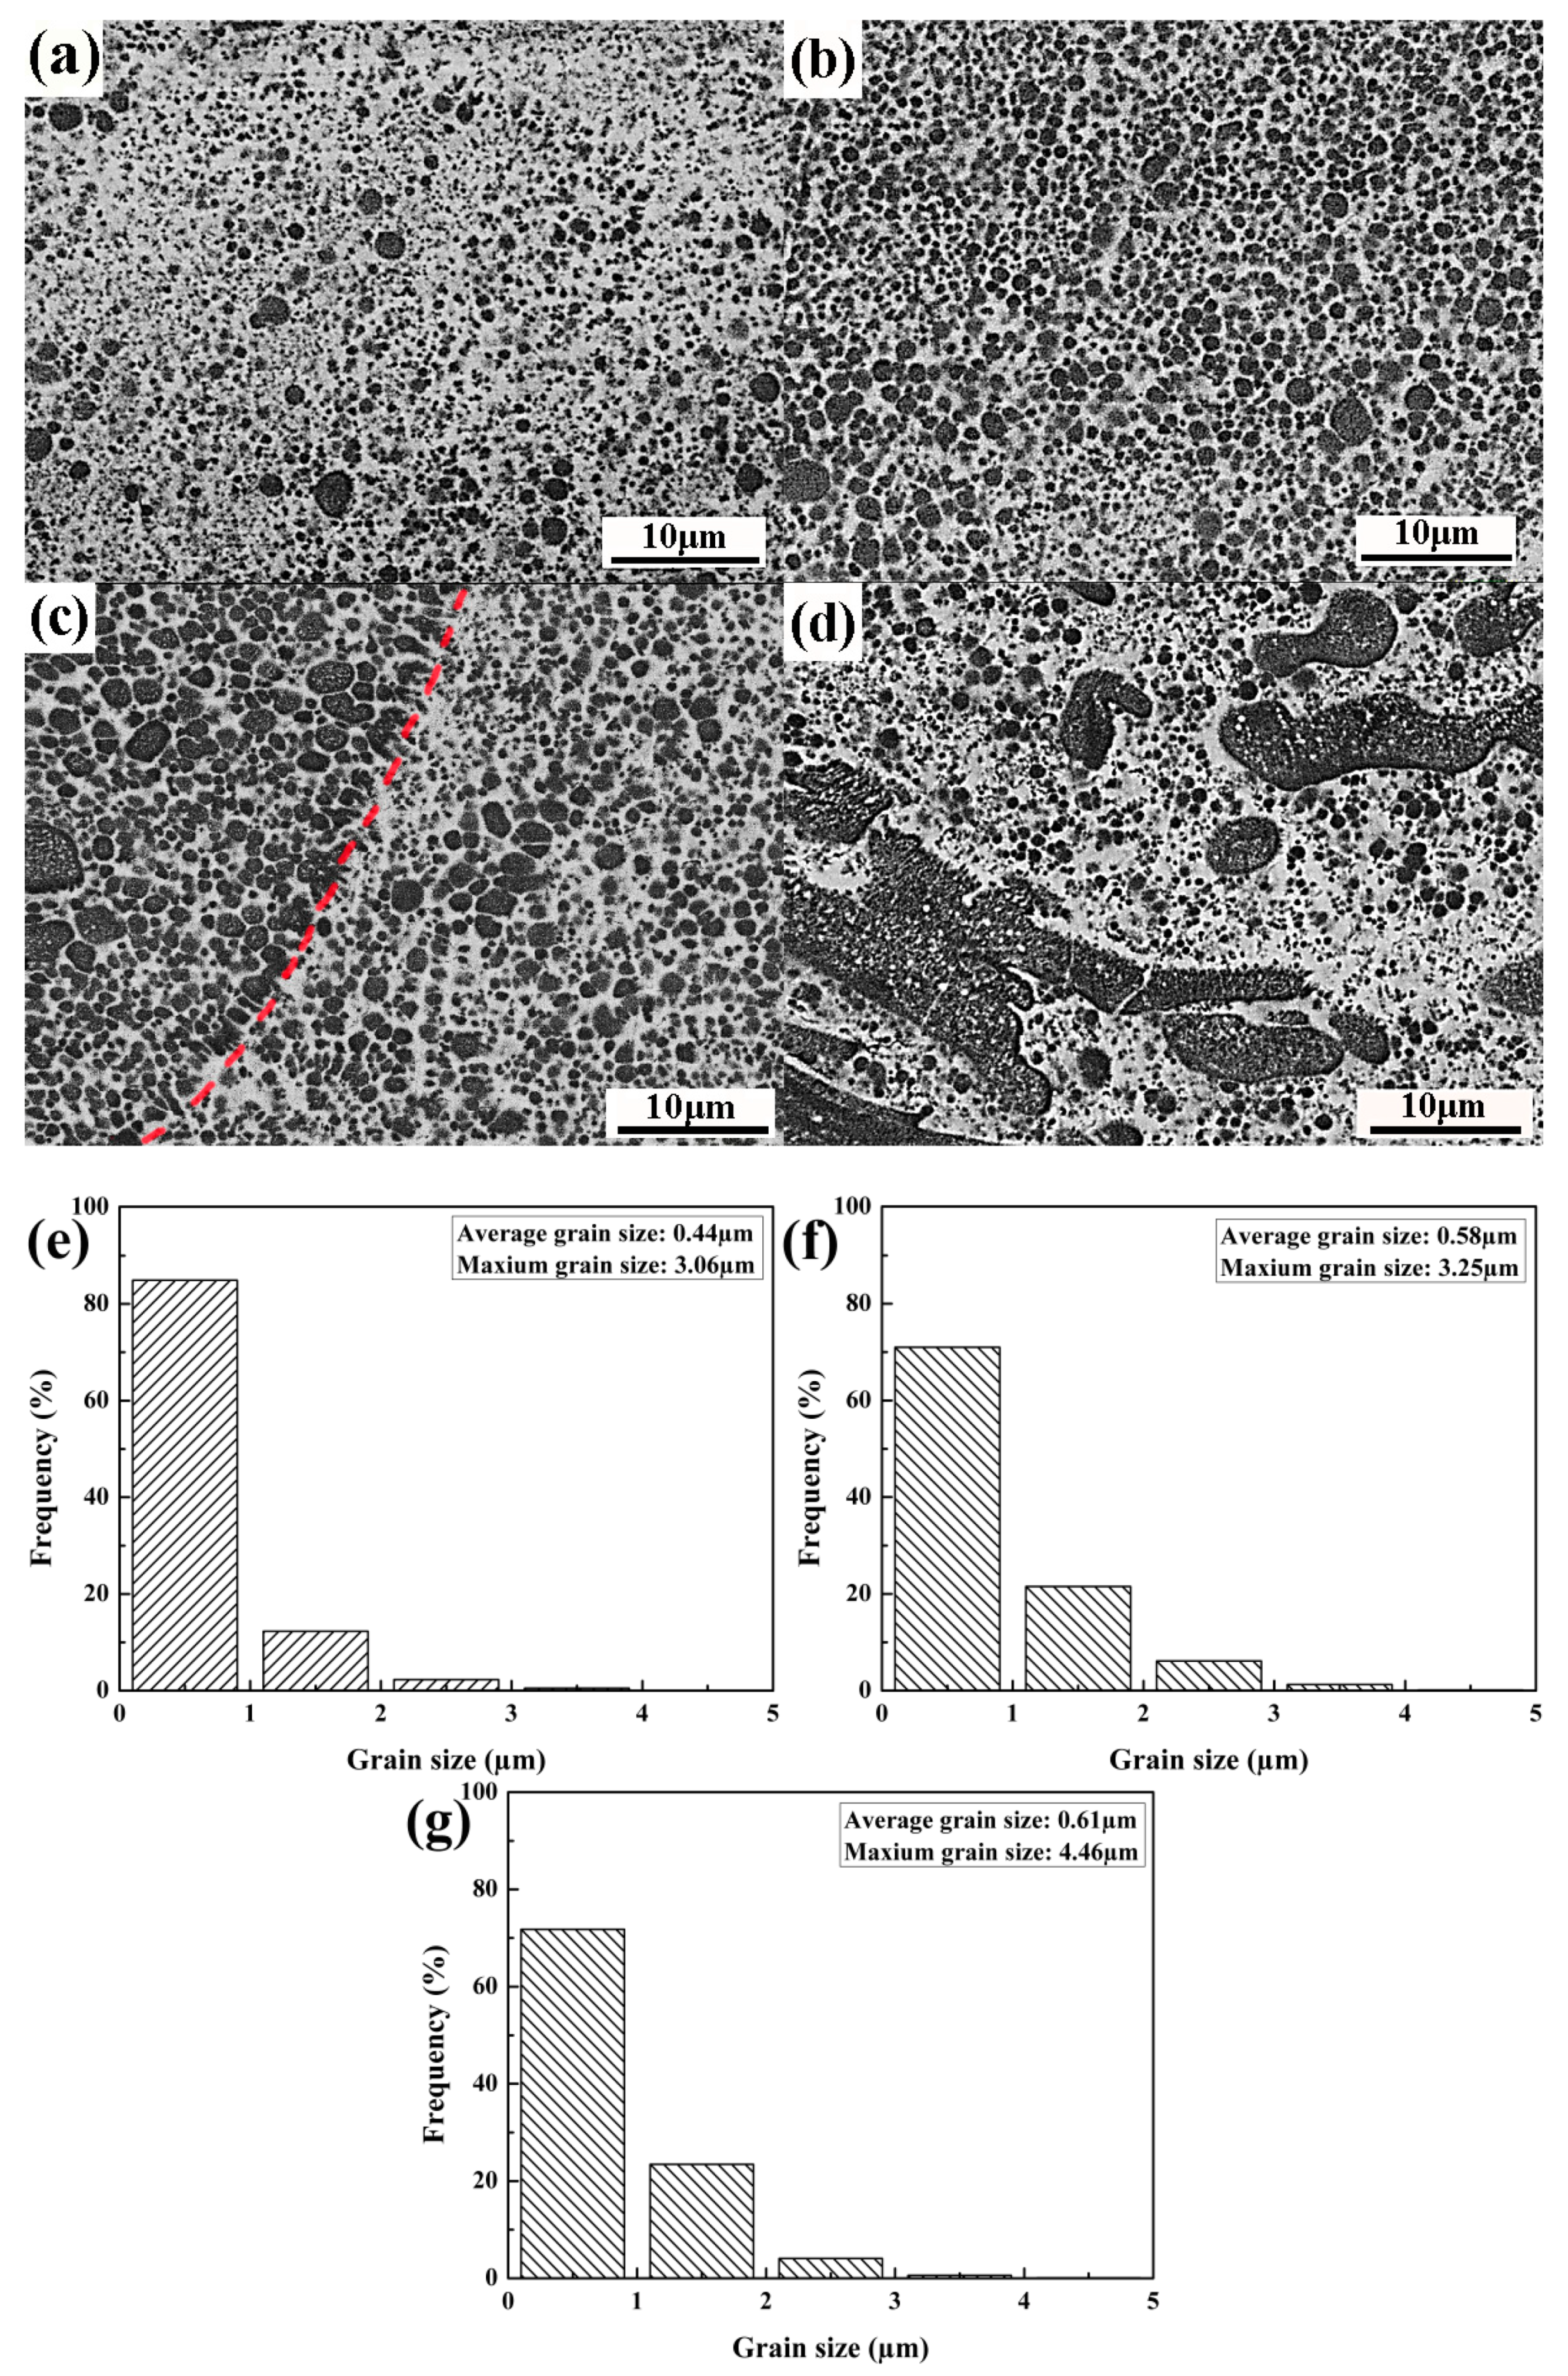
3.1. Microstructure
3.2. Parametric Results
3.3. Property
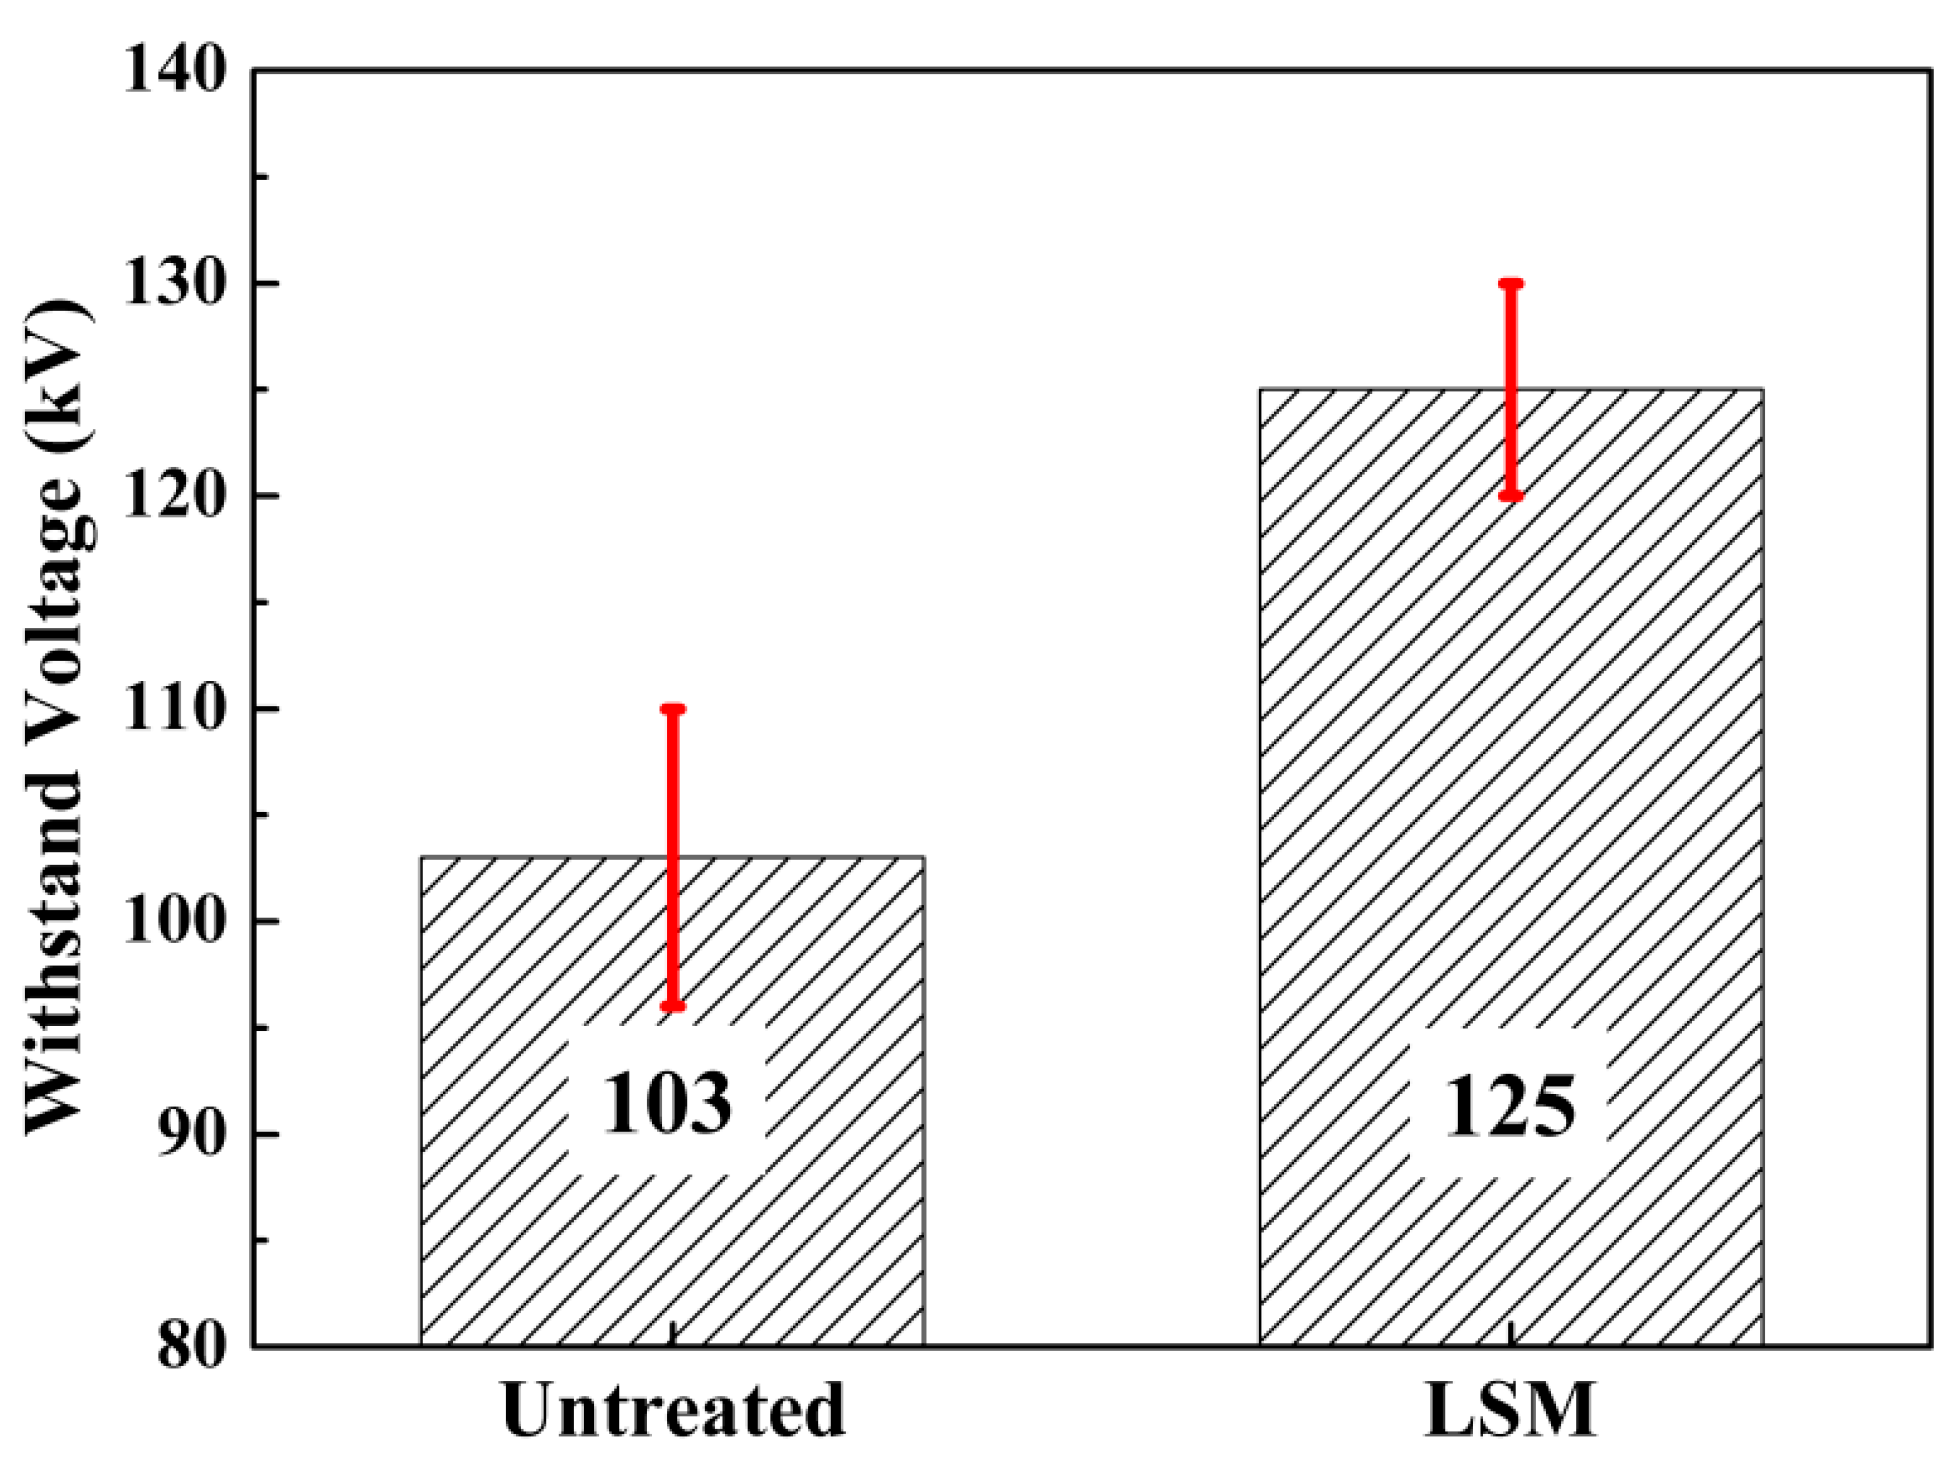
3.3.1. Withstanding Voltage
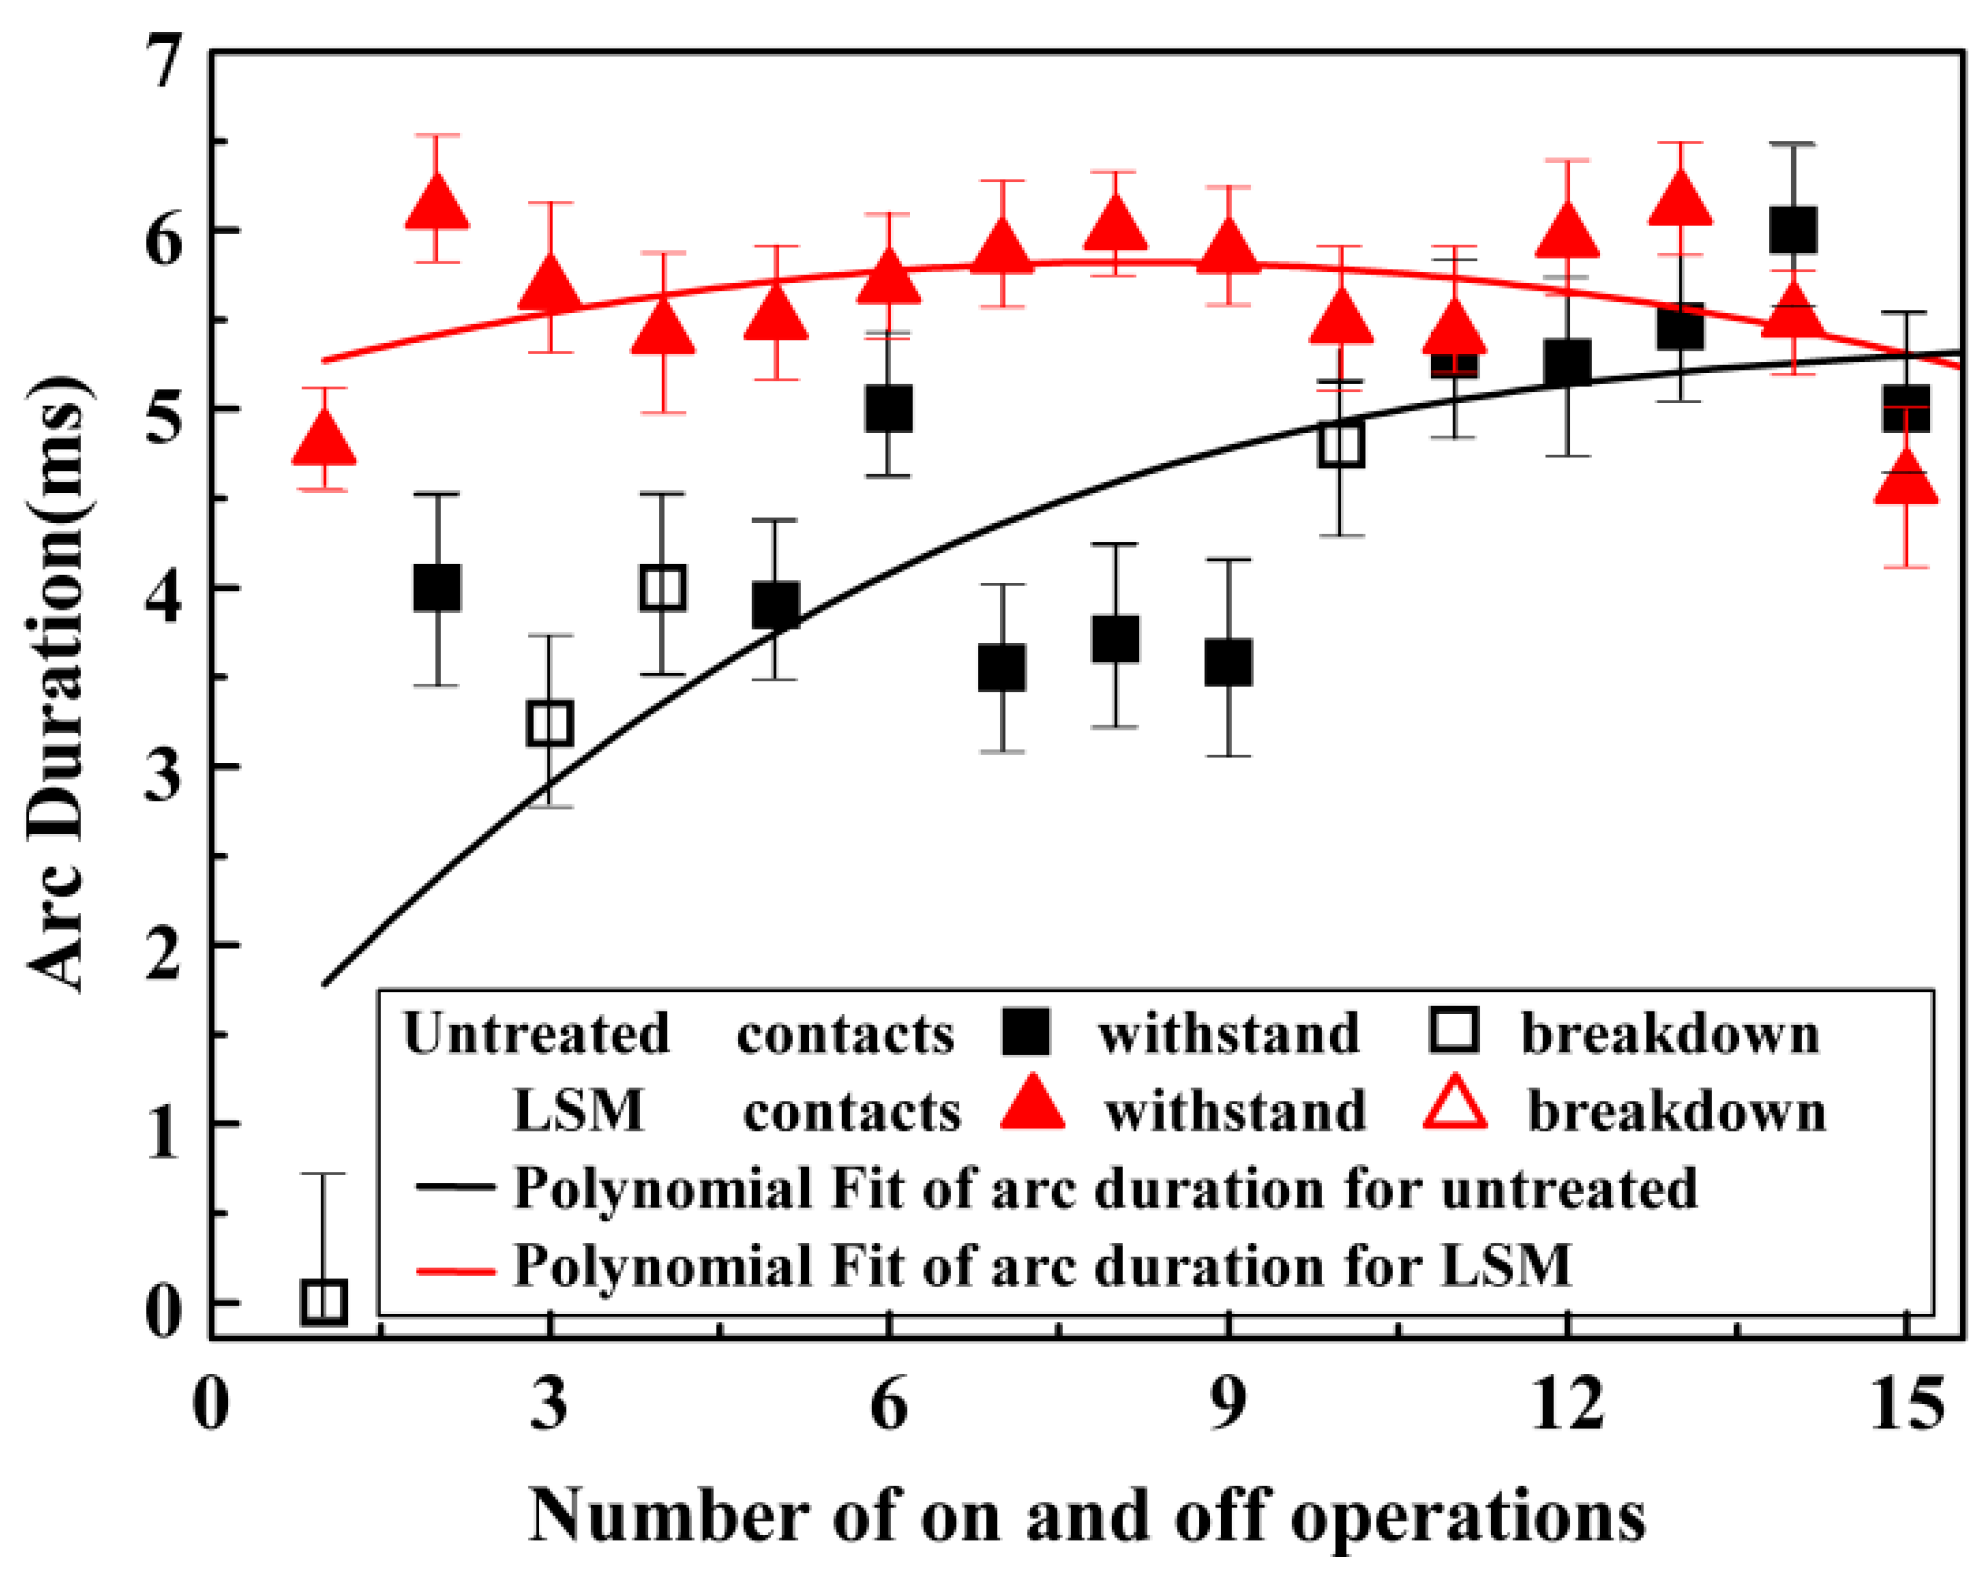
3.3.2. Interruption Capability
4. Discussion
4.1. Parametric Study
4.2. Microstructure Evolution
4.3. Withstanding Voltage and Interruption Capability
5. Conclusions
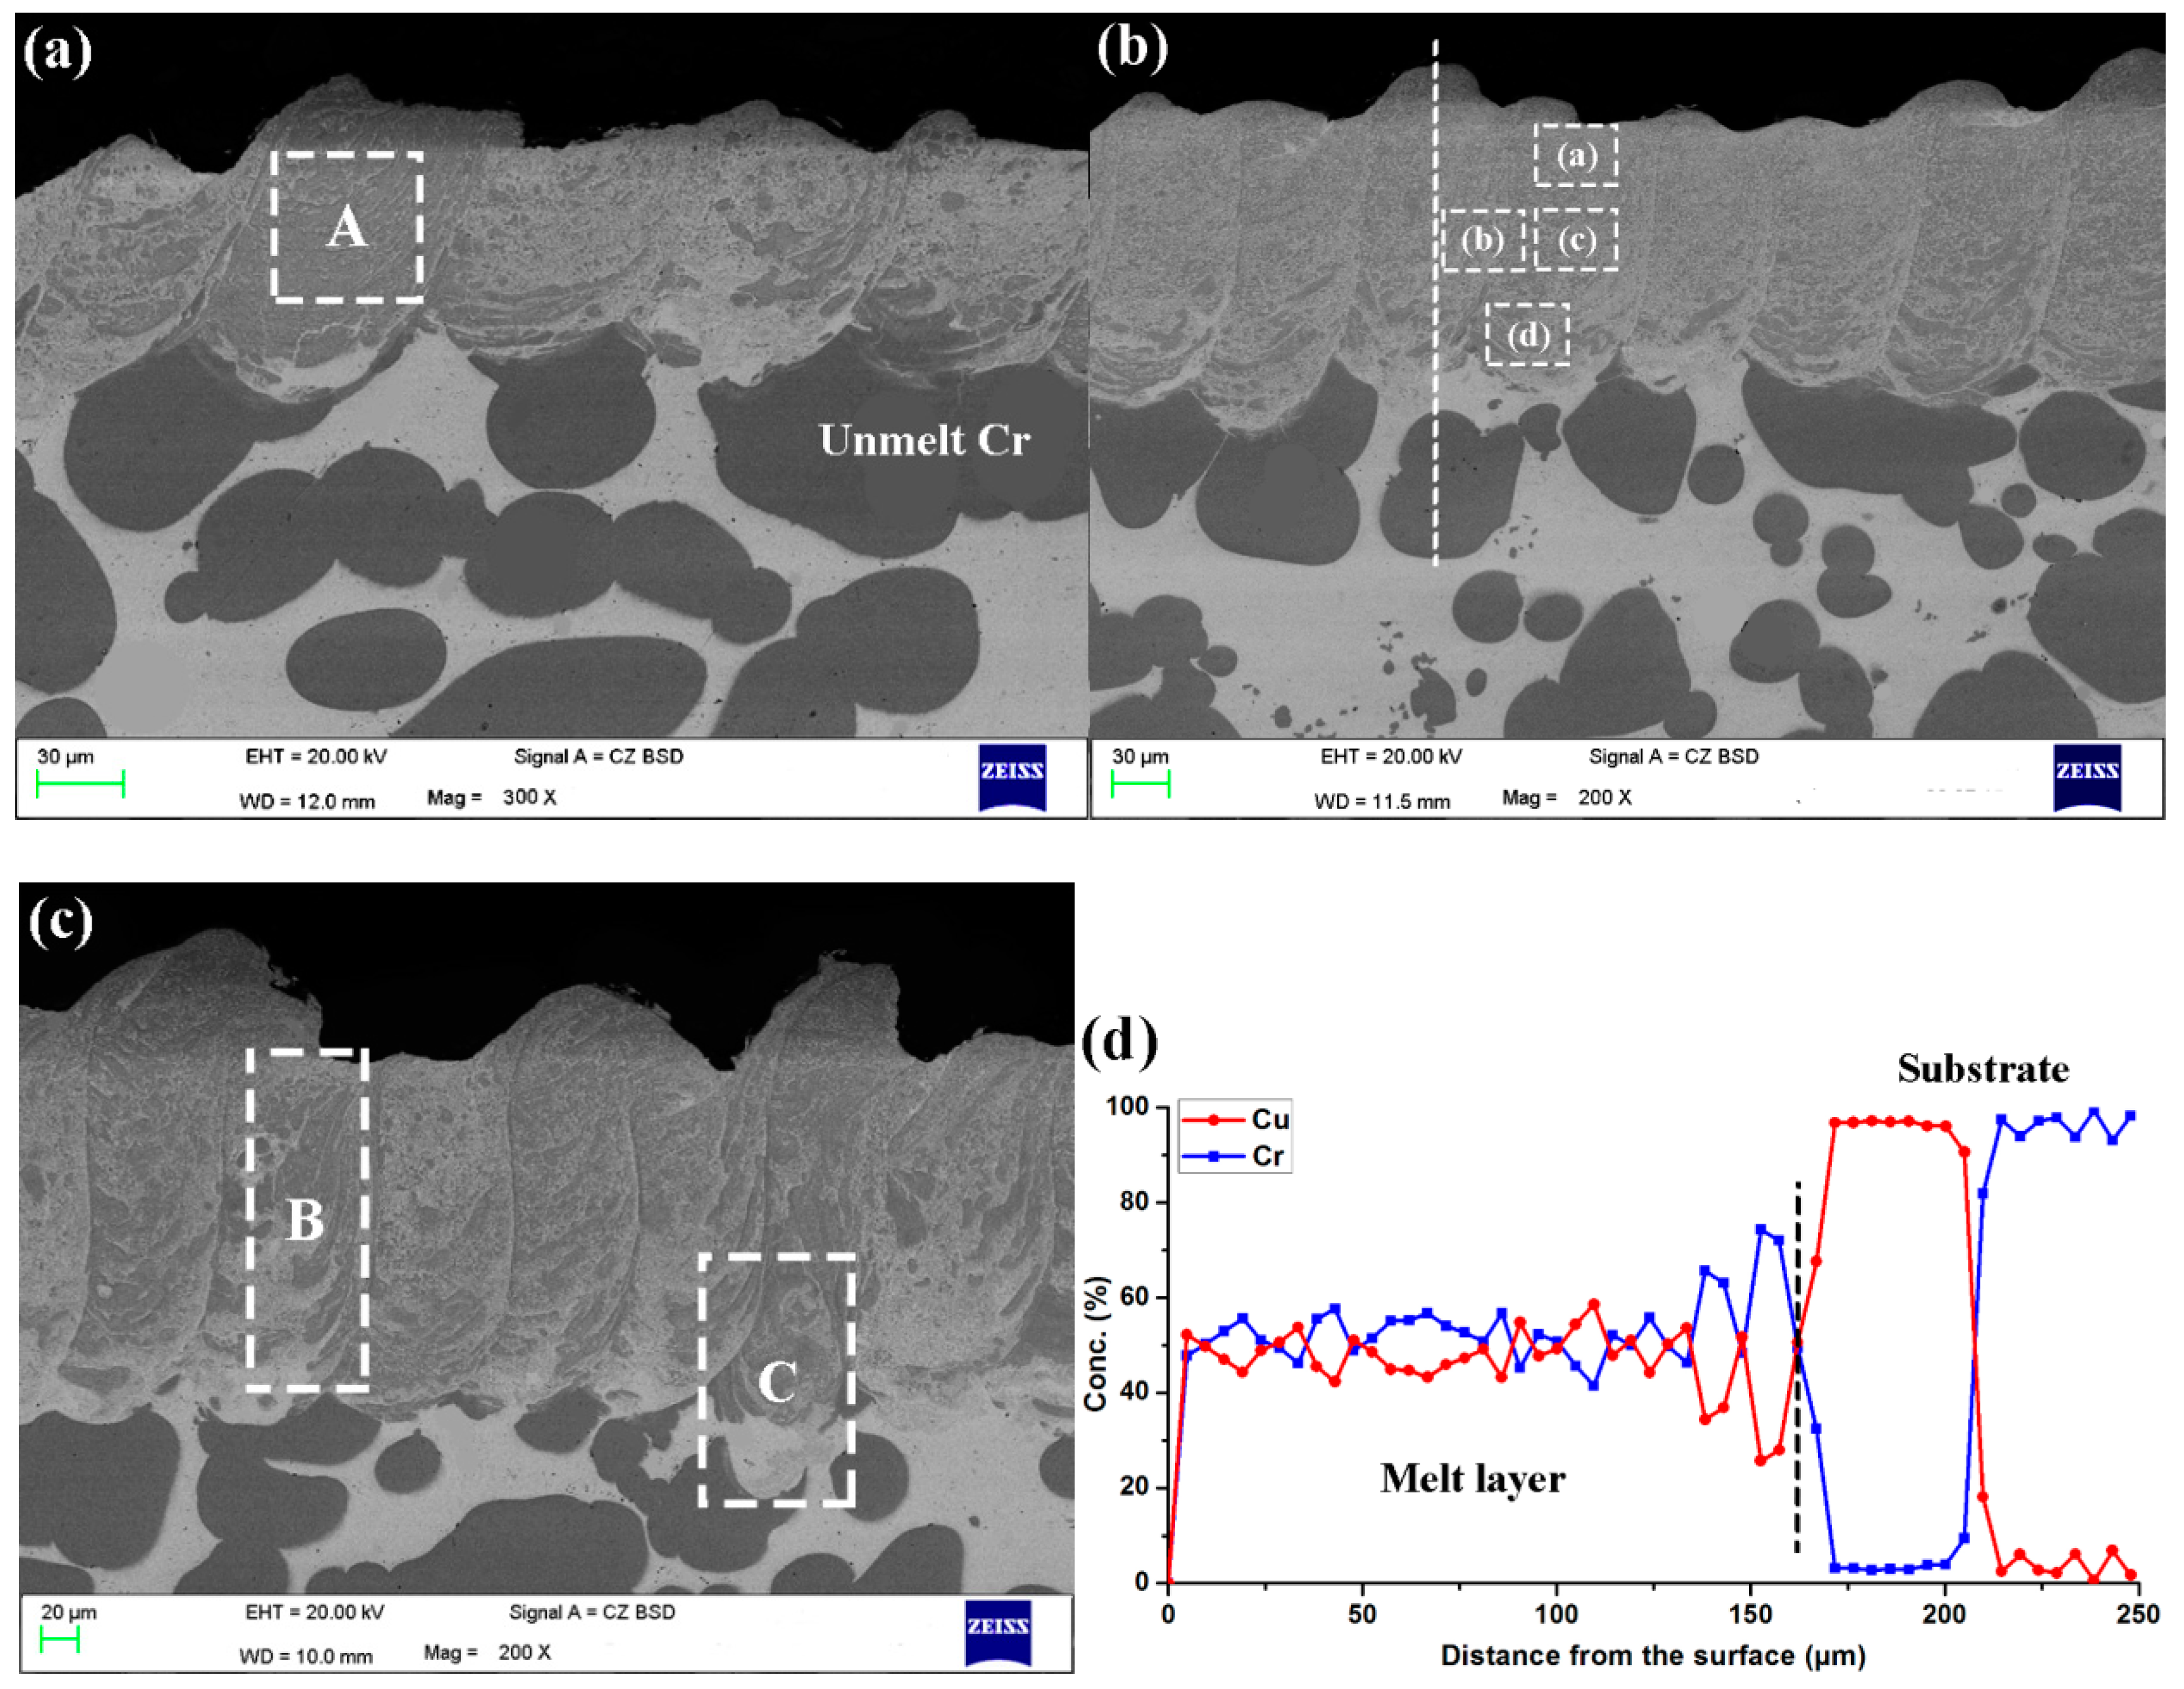
- The average diameter of the Cr phase was effectively refined from ~100 μm to ~1 μm and dispersed in the melt layer with a thickness of up to 150 μm.
- In order to obtain a dispersed and refined microstructure, the optimal laser energy density was from 43 MJ/m2 to 56 MJ/m2.
- The gathering tendency for the Cr spheroids induced by LPS was suppressed by the high cooling rate (7.29 × 10⁶ K/s) during the LSM process.
- The withstanding voltage of the LSM contacts increased to 125 kV, which was 21% higher than the untreated. The arc duration increased by 33%, resulting in 15 successful successive switching off operations.
Author Contributions
Funding
Acknowledgments
Conflicts of Interest
References
- Slade, P.G. The Vacuum Interrupter: Theory, Design and Application; CRC Press: New York, NY, USA, 2008. [Google Scholar]
- Slade, P.G. Advances in material development for high power vacuum interrupter contacts. IEEE Trans. Compon. Packag. Manuf. Technol. 1994, 17, 96–106. [Google Scholar] [CrossRef]
- Heitzinger, F.; Kippenberg, H.; Saeger, K.E.; Schroder, K.H. Contact materials for vacuum switching devices. IEEE Trans. Plasma Sci. 1993, 21, 447–453. [Google Scholar] [CrossRef]
- Chang, Y.; Zheng, W.; Zhou, Z.; Zhai, Y.X.; Wang, Y.P. Preparation and performance of Cu-Cr contact materials for vacuum switches with low contact pressure. J. Electron. Mater. 2016, 45, 5647–5654. [Google Scholar] [CrossRef]
- Kuskov, K.V.; Rogachev, A.S.; Vadchenko, S.G.; Shkodich, N.F.; Rouvimov, S.; Shchukin, A.S.; Illarionov, E.V.; Kudryashov, V.A.; Mukasyan, A.S. Resistance of microcrystalline and nanocrystalline Cu/Cr pseudo alloys. J. Alloys Compd. 2018, 750, 811–818. [Google Scholar] [CrossRef]
- Zhang, C.; Wang, Y.; Yang, Z.; Guo, Y.; Ding, B.J. Microstructure and properties of vacuum induction melted CuCr25 alloys. J. Alloys Compd. 2004, 366, 289–292. [Google Scholar] [CrossRef]
- Sun, Z.B.; Wang, Y.H.; Guo, J.; Zhu, Y.M.; Song, X.P.; Zhu, R.H. Liquid and solid phase separation during melt spinning and annealing in melt-spun Cu–Cr ribbons. Mater. Sci. Eng. A 2007, 452, 411–416. [Google Scholar] [CrossRef]
- Gao, J.; Wang, Y.P.; Zhou, Z.M.; Kolbe, M. Phase separation in undercooled Cu-Cr melts. Mater. Sci. Eng. A 2007, 449, 654–657. [Google Scholar] [CrossRef]
- Cooper, K.P.; Ayers, J.D.; Malzahn Kampe, J.C.; Feng, C.R.; Locci, I.E. Microstructural evolution and thermal stability in rapidly solidified high-chromium-containing copper alloys. Mater. Sci. Eng. A 1991, 142, 221–233. [Google Scholar] [CrossRef]
- Pere, B.V.; Joachim, G.; Jan, H.; Stefanie, S.; Julio, C.D.S.; Peter, C.; Norbert, S.; Guillermo, R. Inducing Stable α + β Microstructures during Selective Laser Melting of Ti-6Al-4V Using Intensified Intrinsic Heat Treatments. Materials 2017, 10, 268–282. [Google Scholar]
- Ratke, R.; Diefenbach, S. Liquid immiscible alloys. Mater. Sci. Eng. R Rep. 1995, 15, 263–347. [Google Scholar] [CrossRef]
- Curiotto, S.; Pryds, N.H.; Johnson, E.; Battezzati, L. Effect of cooling rate on the solidification of Cu58Co42. Mater. Sci. Eng. A 2007, 449–451, 644–648. [Google Scholar] [CrossRef]
- He, J.; Zhao, J.Z.; Ratke, L. Solidification microstructure and dynamics of metastable phase transformation in undercooled liquid Cu-Fe alloys. Acta Mater. 2006, 54, 1749–1757. [Google Scholar] [CrossRef]
- Sun, Z.; Guo, J.; Song, X.; Zhu, Y.M.; Li, Y. Effects of Zr addition on the liquid phase separation and the microstructures of Cu–Cr ribbons with 18–22 at. % Cr. J. Alloys Compd. 2008, 455, 243–248. [Google Scholar] [CrossRef]
- Zhou, Z.M.; Wang, Y.P.; Gao, J.; Kolbe, M. Microstructure of rapidly solidified Cu-25wt% Cr alloys. Mater. Sci. Eng. A 2005, 398, 318–322. [Google Scholar] [CrossRef]
- Wei, X.; Wang, J.; Yang, Z.; Yu, D.; Song, X.; Ding, B.; Yang, S. Liquid phase separation of Cu-Cr alloys during the vacuum breakdown. J. Alloys Compd. 2011, 509, 7116–7120. [Google Scholar] [CrossRef]
- Fink, H.; Gentsch, D.; Heil, B.; Schnettler, A. Conditioning of Series Vacuum Interrupters (VIs) for Medium Voltage by Applying High-Frequency (HF) Current to Increase the Dielectric Strength of VIs. IEEE Trans. Plasma Sci. 2007, 35, 873–878. [Google Scholar] [CrossRef]
- Momeni, S.; Guschelbauer, R.; Osmanlic, F.; Körner, C. Selective electron beam melting of a copper-chrome powder mixture. Mater. Lett. 2018, 223, 250–252. [Google Scholar] [CrossRef]
- Zhou, Z.M.; Chai, L.J.; Xiao, Z.P.; Tu, J.; Wang, Y.; Huang, W. Surface modification of Cu-25Cr alloy induced by high current pulsed electron beam. Trans. Nonferrous Met. Soc. China 2015, 25, 1935–1943. [Google Scholar] [CrossRef]
- Hauf, U.; Kauffmann, A.; Kauffmann-Weiss, S.; Feilbach, A.; Boening, M.; Mueller, F.E.H.; Hinrichsen, V.; Heilmaier, M. Microstructure formation and resistivity change in CuCr during rapid solidification. Metals 2017, 7, 478. [Google Scholar] [CrossRef]
- Si, S.H.; Zhang, H.; He, Y.Z.; Li, M.X.; Guo, S. Liquid phase separation and the aging effect on mechanical and electrical properties of laser rapidly solidified Cu100−xCrx alloys. Metals 2015, 5, 2119–2127. [Google Scholar] [CrossRef]
- Hirose, A.; Kobayashi, K.F. Surface alloying of copper with chromium by CO2 laser. Mater. Sci. Eng. A 1994, 174, 199–206. [Google Scholar] [CrossRef]
- Majumdar, J.D.; Manna, I. Laser surface alloying of copper with chromium: I. Microstructural evolution. Mater. Sci. Eng. A 1999, 268, 216–226. [Google Scholar] [CrossRef]
- Majumdar, J.D.; Manna, I. Laser surface alloying of copper with chromium: II Improvement in mechanical properties. Mater. Sci. Eng. A 1999, 268, 227–235. [Google Scholar] [CrossRef]
- Cui, X.G.; Cheng, X.N.; Xu, X.J.; Lu, J.Z.; Hu, J.D.; Wang, Y.M. Microstructure and tensile properties of the sub-micron and nano-structured Al produced by laser surface melting. Mater. Sci. Eng. A 2010, 527, 7400–7406. [Google Scholar] [CrossRef]
- Silva, M.R.; Gargarella, P.; Gustmann, T.; Filho, W.J.B.; Kiminami, C.S.; Eckert, J.; Pauly, S.; Bolfarini, C. Laser surface remelting of a Cu-Al-Ni-Mn shape memory alloy. Mater. Sci. Eng. A 2016, 661, 61–67. [Google Scholar] [CrossRef]
- Zhang, Y.Z.; Tu, Y.; Xi, M.Z.; Shi, L.K. Characterization on laser clad nickel based alloy coating on pure copper. Surf. Coat. Technol. 2008, 202, 5924–5928. [Google Scholar] [CrossRef]
- Xu, Z.M.; Li, J.G.; Li, J.S.; Fu, H.Z. Mechanical properties and resistivity of continuous casting copper single crystals. Chin. J. Nonferrous Met. 1999, 9, 577–581. [Google Scholar]
- Attar, H.; Calin, M.; Zhang, L.C.; Scudino, S.; Eckert, J. Manufacture by selective laser melting and mechanical behavior of commercially pure titanium. Mater. Sci. Eng. A 2014, 593, 170–177. [Google Scholar] [CrossRef]
- IEC 62271-100. High-Voltage Switch-Gear and Control-Gear. Part 100: Alternating Current Circuit-Breakers; International Electrotechnical Commission (IEC): Geneva, Switzerland, 2017. [Google Scholar]
- Jacob, K.T.; Priya, S.; Waseda, Y.A.; Metallkd, Z. Thermodynamic study of liquid Cu-Cr alloys and metastable liquid immiscibility. Z. Met. 2000, 91, 594–600. [Google Scholar]
- He, J.; Mattern, N.; Tan, J.; Kaban, I.; Wang, Z.; Ratke, L.; Kim, D.H.; Kim, W.T.; Eckert, J. A bridge from monotectic alloys to liquid-phase-separated bulk metallic glasses: Design, microstructure and phase evolution. Acta Mater. 2013, 61, 2102–2112. [Google Scholar] [CrossRef]
- Ashby, M.F.; Easterling, K.E. The transformation hardening of steel surfaces by laser beams-I. hypo-eutectoid steels. Acta Mater. 1984, 32, 1935–1948. [Google Scholar] [CrossRef]
- Zhou, S.F.; Dai, X.Q.; Wang, C.X.; Xie, M.; Yang, J.X.; Li, Z.Y. Phase separated characteristics and soft magnetic properties of [Cu0.6(FeCrC)0.4]100−xSix immiscible composites by laser induction hybrid cladding. J. Alloys Compd. 2018, 732, 740–747. [Google Scholar] [CrossRef]
- Zhang, L.T.; Yu, G.; He, X.; Li, S.X.; Wang, X. Phase separated characteristics affected by cooling rate of immiscible Cu-Cr alloy by laser surface melting. J. Alloys Compd. 2019, 772, 209–217. [Google Scholar] [CrossRef]
- Lamperti, A.; Ossi, P.M.; Rotshtein, V.P. Surface analytical chemical imaging and morphology of Cu–Cr alloy. Surf. Coat. Technol. 2006, 200, 6373–6377. [Google Scholar] [CrossRef]
- Kawano, H. Theoretical evaluation of the effective work functions for positive-ionic and electronic emissions from polycrystalline metal surfaces. Appl. Surf. Sci. 2008, 254, 7187–7192. [Google Scholar] [CrossRef]
- Rieder, W.F.; Schussek, M.; Glatzle, W. The influence of composition and Cr particle size of Cu/Cr contacts on chopping current, contact resistance and breakdown voltage in vacuum interrupters. IEEE Trans. Compon. Packag. Manuf. Technol. 1989, 12, 273–283. [Google Scholar] [CrossRef]
- Jttner, B. Cathode spots of electric arcs. J. Phys. D Appl. Phys. 2001, 34, R103–R123. [Google Scholar] [CrossRef]
- Wang, Y.; Zhang, C.; Zhang, H.; Ding, B.; Lu, K. Effect of the microstructure of electrode materials on arc cathode spot dynamics. J. Phys. D Appl. Phys. 2003, 36, 2649–2654. [Google Scholar] [CrossRef] [Green Version]
- Wu, J.W.; Wang, Y.; Wang, J.M. Study on electron diffusion process and arc radius of vacuum arc. High-Volt. Appar. 1997, 3, 8–11. [Google Scholar]


| Material | Chemical Element (wt%) | Density (g/cm3) | Hardness (HB) | |||
|---|---|---|---|---|---|---|
| Cr | Cu | O | N | |||
| Cu-Cr(50) | 47–52 | Bal. | ≤0.05 | ≤0.05 | ≥7.90 | ≥80 |
| Sample | Ave, Arc Duration (ms) | Max, Arc Duration (ms) | Min, Arc Duration (ms) | Standard Deviation of Arc Duration |
|---|---|---|---|---|
| Untreated | 4.2 | 5.5 | 0 | 1.4 |
| LSM | 5.6 | 6.2 | 4.6 | 0.4 |
| Material | Density (103 kg/m3) | Latent Heat of Melting/(J·m−3) |
|---|---|---|
| Cu | 8.9 | 1.82 × 10⁹ |
| Cr | 7.2 | 2.89 × 10⁹ |
| Cu-50Cr | 7.9 | 1356 K: 0.5 × 1.82 × 109 |
| 2133 K: 0.5 × 2.89 × 109 |
© 2019 by the authors. Licensee MDPI, Basel, Switzerland. This article is an open access article distributed under the terms and conditions of the Creative Commons Attribution (CC BY) license (http://creativecommons.org/licenses/by/4.0/).
Share and Cite
Zhang, L.; Yu, G.; Tian, C.; He, X.; Li, S. Grain Refinement of Hypereutectic Immiscible Cu-50Cr Alloy during Rapid Melting and Solidification Induced by High Power Density Laser Beams. Metals 2019, 9, 585. https://doi.org/10.3390/met9050585
Zhang L, Yu G, Tian C, He X, Li S. Grain Refinement of Hypereutectic Immiscible Cu-50Cr Alloy during Rapid Melting and Solidification Induced by High Power Density Laser Beams. Metals. 2019; 9(5):585. https://doi.org/10.3390/met9050585
Chicago/Turabian StyleZhang, Litian, Gang Yu, Chongxin Tian, Xiuli He, and Shaoxia Li. 2019. "Grain Refinement of Hypereutectic Immiscible Cu-50Cr Alloy during Rapid Melting and Solidification Induced by High Power Density Laser Beams" Metals 9, no. 5: 585. https://doi.org/10.3390/met9050585