Abstract
Pure chemical reagents Fe2O3, Al2O3, and Ca(OH)2 were used to investigate the formation of calcium ferrite in the solid state. The phase composition of the prepared samples was determined using X-ray powder diffraction and by SEM. The TG-DSC analysis was performed to analyze the decomposition behavior and formation of calcium ferrites. The formation rate of calcium ferrite was determined by in-situ X-ray diffraction (XRD) and by the K-value method. The X-ray diffraction analysis was performed using Pt as the internal standard for application of the K-value method. The formation of Ca2Fe2O5 (C2F) occurred much earlier than the formation of CaFeO4 (CF). C2F and CF were formed at approximately 600 °C and 700–800 °C, respectively. With an increase of Al2O3 content, there was a tendency to decrease the melting temperature. There was a heating scheme in this study (i.e., 10 °C per minute to 1250 °C under a flowing atmosphere of high-purity air). The total amount of CF increased with an increase of the Al2O3 content, and the Al2O3 content reaching the maximum value of CF was 1.4%. As the Al2O3 content increased from 1.4% to 2.8%, the total amount of CF reduced slightly. When the Al2O3 concentration was greater than 2.8%, the content of CF generated significantly decreased with the increase of Al2O3.
1. Introduction
Currently, with increasing costs and decreasing profits, iron and steel enterprises are facing tremendous pressure to survive. Low cost smelting has become an important strategy for these enterprises to extricate from the predicament. The guiding ideology of reducing the consumption of traditional production using the fine material route has not been adapted to the current situation and high-quality iron ore resources are shrinking, and therefore this limited material is commanding higher prices. Consequently, a new fine material concept has been proposed which aims to lower costs by considering energy and resource consumption. Currently, in many enterprises, instead of high-quality iron ore, iron ore with high alumina is widely put into production due to its low price. China imports several million tons of high alumina iron ore from Australia, India, South East Asia, and Africa every year, driven by the continued massive growth of steel production in China which is expected to continue for years to come [1]. Theory and practice have demonstrated that alumina cannot be reduced in a blast furnace, therefore, it cannot stain the hot metal and does no harm to steelmaking. The presence of alumina in iron ore mainly affects the sinter and slag properties, which leads to difficulties and instability during the blast furnace operation. Increased levels of high aluminum ore during ironmaking leads to problems which include decreased grade of the sinter, metallurgical performance deterioration, reduced blast furnace permeability in smelting, increased slag ratio, and increased coke rate [2,3]. Without finding solutions to these problems, the production costs will continue to increase. Accordingly, rational and efficient use of high aluminum ore has become an urgent issue for the steel enterprises.
In past decades, many studies have been conducted on the effect of aluminum on sintering production, the sintering ore quality, and blast furnace smelting and operation. Some countermeasures have been proposed for sinter production and blast furnace smelting of materials with high alumina content. However, the majority of these controlling strategies were proposed to address specific production conditions, without considering the action of alumina, which has led to less than ideal results when indiscriminately applied. The silicoferrite of calcium and aluminum (SFCA) phases are considered the most desirable bonding phases in iron ore sinter because of their high reducibility [4], high mechanical strength, and low reduction degradation [5,6], all of which are significant factors in determining the productivity and efficiency of the blast furnace. The theoretical system of formation characteristics, microstructure, and metallurgical properties of the main binder phase of sintered ore with high aluminum content remains poorly understood.
Many studies have focused on the properties of calcium ferrite bonding phases, stability, and solid solution limits of SFCA as the major phase in high basicity iron-ore sinter. SFCA was found to be stabilized with the Fe2O3-CaO-Al2O3-SiO2 (FCAS) quaternary, along a plane that connects CF3, CA3, and C4S3 (CCC plane) by Patrick [7,8]. Machida et al. measured the viscosity of melted liquid composed of iron ores and reagents and calculated the viscosity of suspension [9]. Sukenaga investigated viscosity changes of CaFeO4 (CF)-based slags with melting time [10]. Pownceby et al. studied the formation mechanism of calcium ferrite using in-situ X-ray diffraction (XRD), and found that quartz did not react at all with CaO and Fe2O3, remaining essentially inert until SFCA and SFCA-I began to form near 1050 °C. The formation of SFCA-I was associated with the reaction of Fe2O3, C2F, and SiO2. SFCA was initially formed by a reaction of CF, CFA-phase, and SiO2, and its initial formation was related to the formation of CS and a melt phase [11]. Pownceby also determined the reaction sequences involved in the formation of SFCA using in-situ X-ray diffraction (XRD) and determined the content of SFCA by Rietveld-based quantitative phase analysis [12]. Their study indicated that the formation of SFCA was dominated by the solid-state reactions, mainly in the CaO-Fe2O3 system. Kang et al. studied the influence of the oxygen partial pressure on the final sinter phases [13]. Much attention has been given to factors that affect the structure of SFCA including chemical composition, sinter basicity, and the maximum sintering temperature [14]. With an increased availability of Al2O3 iron ore, the influence of Al2O3 on the formation of SFCA during sintering is of interest. Takayuki et al. found that the effects of adding Al2O3 on the formation rate of calcium ferrite melt were to increase the melting rate and reduce the liquid formation temperature of the sample in the calcium ferrite system by the coal ash melting examination method (JIS M 8801-10) [15]. Sinha and Ramna reported that Al2O3 had a predominant effect on the microhardness of hematite and magnetite phases [16]. The effect of Al2O3 on the pore structure of experimental compact sinters was investigated by Lu, Holmes and Manuel. They thought the pore area increased drastically, and the pore shape became more irregular as alumina increased from 1.6% to 2.4% [17]. Kasai et al. examined the assimilation behavior of different iron ores and limestone with different size ranges using a differential thermal analysis (DTA) technique [18]. The results showed that the Al2O3 from different mineralogical phases influenced the endothermic peak, resulting in an incongruent melting of SFCA, suggesting that different sources of alumina may alter the composition of SFCA.
As the major bonding phase, the quantity and quality of calcium ferrite determined the metallurgical properties of the sinter, and therefore it is very important to study the formation of calcium ferrite and its microstructure characteristics. In this study, a new method was used to calculate the content of SFCA. The objective of this study was to investigate the influence of different Al2O3 concentrations on the formation of calcium ferrites by solid-state reaction using TG-DSC (Thermogravimetric Analysis and differential scanning calorimetry) and SEM. Other studies have mainly controlled the content of SiO2 and Al2O3 to study SFCA, but few studies have investigated SFCA by adding pure CF.
2. Experiments
2.1. Starting Sinter Mixture Preparation
The pure chemical reagents Fe2O3, Al2O3, and Ca(OH)2 were used as test materials. Considering the stability of CaO in the mixture under 600 °C and eliminating the weighing error caused by water absorption of CaO, Ca(OH)2 was used instead of CaO. The reagents were mixed with acetone at the desired ratio and ground using a mortar and pestle to ensure homogeneity. The sample compositions of the solid-state reaction experiments are shown in Table 1.

Table 1.
Sample compositions of solid-state reaction experiments by addition of Ca(OH)2 at a 1:1 molar ratio of n(Fe2O3) to n(CaO).
All the tests and experiments reported in this study were carried out in air atmosphere. In the TG-DSC tests, mixed powders were directly used as test samples. All the tests were carried out with a Q600 SDT TG-DSC thermal analyzer (TA Instruments, New Castle, USA) using a heating rate of 20 °C/min from room temperature to 1523 K.
The samples were mixed for 30 min using a three-dimensional mixer (Sujia Powder Machinery Co., Ltd., Shanghai, China), to ensure homogeneity of composition and particle size. Mixed powders of 3–5 μm particle size accounted for more than 90% of the samples. The mixed powders were pressed into columns with a diameter of 6 mm and a length of 21–25 mm in a stainless module under a pressure of 15 MPa. The samples were heated in a muffle furnace. The temperature adjacent to the crucible was measured using a Pt/PtRh13 pct thermocouple connected to the top of the muffle furnace. For experiments where the samples were held at the desired temperature for 90 min, the temperature fluctuation range was controlled accurately between ±5 K. The samples were water quenched and then crushed, and a small piece was collected from each sample and prepared for scanning electron microscopy-energy dispersive spectroscopy (SEM-EDS). Quantitative chemical microanalyses of the phases were performed by SEM-EDS (FEI company, Hillsboro, OR, USA) and chemical compositions of the various mineralogical constituents were evaluated.
A FEI Quanta 400 field emission environmental SEM (FEI Corporation, Hong Kong, China) was employed in this study and the SEM was operated at an accelerating voltage of 30 kV and a working distance of 10 mm. Energy-dispersive spectroscopy (EDS) was performed on this instrument using a Bruker X-Flash 5010 Si-drift EDS detector (Bruker AXS, Madison, WI, USA).
2.2. In-Situ XRD
In-situ XRD experiments were performed using a SmartLab diffractometer (Rigaku, Tokyo, Japan) that incorporated a sensitive detector allowing simultaneous collection of up to 160° 2θ of diffraction data. The X-ray tube was operated at 45 kV and 200 mA. A tungsten resistance strip was equipped to heat the samples. The sinter sample mixture was prepared and placed into the corundum crucible, which was 15 mm in diameter and 0.8 mm in height. To reduce the error of corundum crucible, a platinum sheet with 15 mm diameter was padded at the bottom of the crucible.
The temperature of the samples was increased at a heating rate of 20 K·min−1 from 298 K to 1423 K (approaching the decomposition temperature of CF) during the CF phase formation. The temperature was measured using a Pt/PtRh10% thermocouple placed under the platinum pad. In-situ XRD data were collected throughout the heating procedure, with individual datasets recorded at an interval of 50 °C from 973 K to 1423 K.
2.3. Quantitative Method of the Mineralogical Phase
In quantitative X-ray diffraction phase analysis, for the internal standard method, the doping method [19] requires standard substance to be added to the sample to make the working curve and the added standard phase leads to more overlapping opportunities for the spectral lines. Although no standard phase is needed for the external standard method, it has lower measuring accuracy as compared with the internal standard method. The quantitative phase analysis method without standard and the Rietveld full-pattern fitting method are superior in accuracy; the Rietveld full-pattern fitting method is suitable for the quantitative analysis of complex samples. The K-value method is easy to understand and operate, each method has clear physical interpretation and operation steps, and it is suitable for samples with few phase types. In our experiment, considering the explicit phase composition and easy obtainability of the pure measuring phase calcium ferrite (CF), the matrix flushing method, usually called K-value method, was applied. The content of the measured mineral phase is described as follows:
where, XJ and XS are the mass fractions of the measured phase and reference phase, respectively, and and are the strongest diffraction peak intensity of the measured phase and the inner standard phase, respectively. K is the reference intensity, which is independent of the amount and only corresponding to the type of inner standard substance. In this method the inner standard substance is mixed with the measured sample as a cleaning agent to “clean” off the matrix effect. The cleaning agent is actually the internal standard substance with characteristics of high purity, good chemical stability, and without the preferred orientation. A variety of reagents were tried, and consequently, the platinum was proven to meet the experimental demands as the cleaning reagent.
To obtain the K value, pure calcium ferrites were prepared in the laboratory according to the following process. The pure reagents Ca(OH)2 (99.99% purity) and Fe2O3 (α-Fe2O3, 99.99% purity) were mixed evenly at a molar ratio of 1:1 for 30 min, then pressed into a cylinder shape under 10 MPa to obtain a homogenous sample. The samples were heated from room temperature to 1200 °C with a heating rate of 20 °C/min in the muffle furnace, holding for 8 h in air atmosphere to react completely and generate pure calcium ferrites. The samples were pulverized in a vibration mill.
Five standard samples composing of CF, Pt, and Fe2O3 were carefully prepared according to the desired ratio as shown in Table 2 to eliminate possible measuring error.

Table 2.
Chemical composition of standard samples.
Through XRD pattern at room temperature, the diffraction peak intensity ratio corresponding to the chemical composition was obtained. According to the definition of K: , make linear fitting to get the slope, which represented the K value at room temperature, named K1. The XRD patterns show that the diffraction peak intensity of Pt at high temperature is different from the diffraction peak intensity of Pt at room temperature, while the diffraction peak shape of Fe2O3 has no evident change. Accordingly, this difference can be revised through the ratio of at 25 °C and 700 °C, named K2, the reference intensity K = K1/K2. Using Equation (1), the content of CF in the sample can be determined.
3. Results and Discussion
3.1. The TG-DSC Analysis of Sintering Mixture with Different Al2O3 Content
Figure 1 shows the TG-DSC curves of the samples at various Al2O3 contents (0, 1.4%, 2.8%, 4.2%, and 5.6%). The molar ratio of Ca(OH)2 and Fe2O3 in these five tests is 1:1. As temperature increases from room temperature to 1250 °C, three endothermic peaks mainly appear in order. For these five tests, an obvious endothermic peak appears at around 400 °C, where the decomposition reaction of Ca(OH)2 occurs. Comparing the dehydration temperatures of Ca(OH)2 with different Al2O3 contents shows that an increase in the amount of Al2O3 has no effect on the decomposition of Ca(OH)2, and this finding reflects that no reaction between Al2O3 and CaO happens at this temperature.
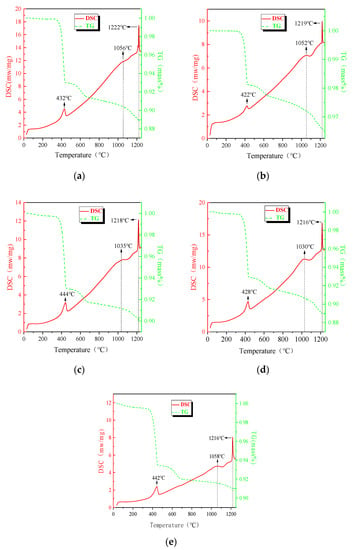
Figure 1.
Curves of the mixed powders with different Al2O3 contents. (a) 0, (b) 1.4%, (c) 2.8%, (d) 4.2%, (e) 5.6%.
As the temperature increases from the ending temperature of Ca(OH)2 decomposition to about 1000 °C , no obvious endothermic or exothermic peak appears, and the DSC curve goes up but not evenly. Because there are only a few Al2O3 in the sample, the effect of the formation of CaO·Al2O3 and CaO·2Al2O3 are ignored. Accordingly, the uneven going up perhaps contributes to the slow formation of C2F (Ca2Fe2O5) which is an endothermic reaction. This result was also proven by Yin [20]. Another reason is the heat capacity of C2F (Ca2Fe2O5) is much larger than that of calcium oxide and ferric oxide [21], leading to an increase in the overall heat capacity of the mixed sample.
As the temperature increases, there is a small peak that appears at around 1050 °C on the DSC curves for all samples. The temperature range of the peak is where the calcium ferrites generate rapidly, and the temperature of the peak point represents the maximal generation speed temperature. The peak point temperature is different from that of Yin, who reported the peak point temperature at around 985 °C. The increase of the peak temperature attributes to the thermal hysteresis phenomena caused by the higher heating rate, 20 K/min versus 10 K/min. According to the results analyzed by PeakFit software (Informer Technologies, Inc., Version 4.04), when the Al2O3 content is lower than 4.2%, the endothermic peak area varies in accordance with the Al2O3 content in the mixture, indicating that with an increase of Al2O3, the amount of calcium ferrite is promoted. Meanwhile, the maximal generation speed temperature of calcium ferrite decreases when Al2O3 content increases, implying that Al2O3 plays a positive role in the generation of calcium ferrite. Increasing the Al2O3 content to 5.6%, the amount of calcium ferrite reduces and the maximal generation speed temperature increases, and Al2O3 begins to reveal a negative effect on the formation of calcium ferrite. The third endothermic peak corresponds to the melting process of calcium ferrite. As the Al2O3 content increases, there is a tendency to decrease the melting temperature. Aluminum solid solution calcium ferrite is the main binder phase of high alkalinity sinter, which has a low melting point phase. Because its content increases greatly with the increase of aluminum content, the content of the low melting point binder phase is high under high aluminum conditions [22].
Figure 2 shows the TG-DSC curves for different concentrations of Al2O3 with 50% CF addition, and the third endothermic peak in the figure is the one located at about 1220 °C. The CF addition reduces the temperature of the maximum production rate of the calcium ferrite and sample melting. The endothermic peak area decreased, which indicates that the addition of CF decreases the maximum formation rate of the calcium ferrite.

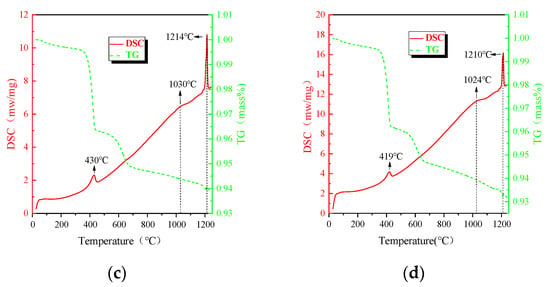
Figure 2.
TG-DSC curves of the mixed powders with different Al2O3 concentrations and CF at 50%. (a) 0, (b) 1.4%, (c) 2.8%, (d) 4.2%.
3.2. Phase Evolution
For the tested samples, the possible chemical reactions during heating are listed as follows:
Ca(OH)2(s) → CaO (s) + H2O(g)
CaO(s) + Al2O3(s) → CaO · Al2O3(s)
CaO(s) + 2Al2O3(s) → CaO · 2Al2O3(s)
2CaO(s) + Fe2O3(s) → Ca2Fe2O5(s)
CaO(s) + Fe2O3(s) → CaFe2O4(s)
Referring to published inorganic thermodynamic data, the Gibbs free energy and temperature variation curves of reaction type (2) to reaction type (5) were calculated and are shown in Figure 3 The Gibbs free energy of the 4 groups were negative and increased with an increase of temperature. Ca2Fe2O5 is the most easily formed, and CaFe2O4 is the most difficult to form.
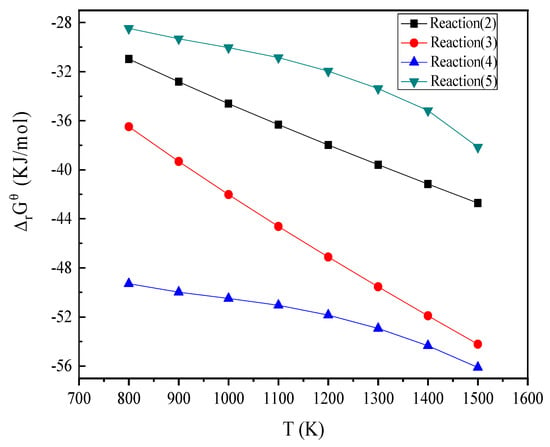
Figure 3.
The Gibbs free energy and temperature variation curves of the reaction type (2) to reaction type (5) over the range 800 K to 1500 K (527 °C to 1227 °C).
It is clearly seen by the b-2 in Figure 4 that taking the particles of CaO as the center, CaO is surrounded by C2F and wrapped with CF. C2F occurs first by the reaction between CaO and Fe2O3, and C2F and CF are generated subsequently. CF is not directly generated, which is consistent with the research of Xiang Ding et al. [23].
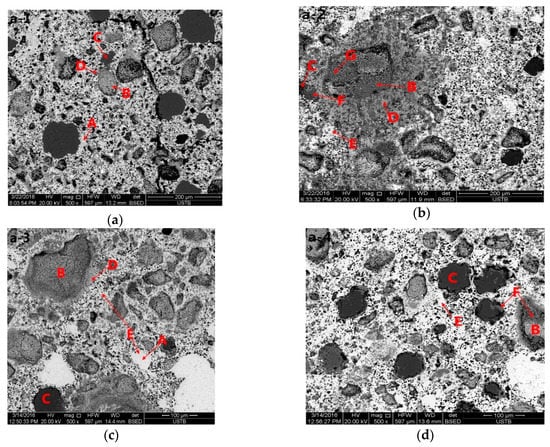
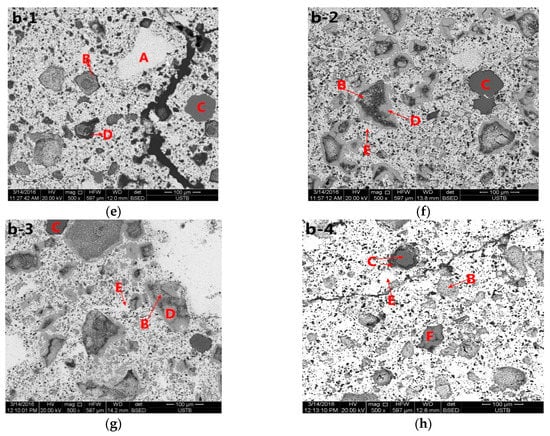
Figure 4.
Backscattered electron micrograph of the product of the heat/quench experiment performed at different temperatures for 90 min under air atmosphere, showing Al2O3, Fe2O3, CaO, CF, C2F, C2A, and CFA. (a–d), a1–a4, 5.6%Al2O3, (e–h), b1–b4, 1.4% Al2O3, 1—900 °C, 2—1000 °C, 3—1100 °C, 4—1200 °C, A—Fe2O3, B—CaO, C—Al2O3, D—C2F, E—CF, F—C2A, G—CFA).
To compare the effects of different amounts of Al2O3 on the morphology of calcium ferrite, electron microscopy was performed on samples containing 1.4% Al2O3 or 5.6% Al2O3, as shown in Figure 4. From a structural perspective, the needle-like C2F was produced by the reaction of CaO and Fe2O3 at 1000 °C, and the shape of C2F differed from that at 900 °C. The melt vermicular calcium ferrite CF occurred by the reaction of C2F and Fe2O3. The needlelike calcium ferrite decreased at 1100 °C, and the melt vermicular calcium ferrite CF increased. The acicular calcium ferrite C2F disappeared as the temperature increased to 1200 °C.
3.3. Effect of Al2O3 Content on Formation Rate of CF
The calcium ferrites were prepared and subjected to XRD analysis. The results (Figure 5) show that the XRD pattern of the prepared sample fits well with that of CaO-Fe2O3 in the standard PDF card, and that other impurity peaks are not obvious. These findings reflect that the prepared sample is composed of pure calcium ferrite, meeting the demands of standard sample used for determining the reference intensity, K.
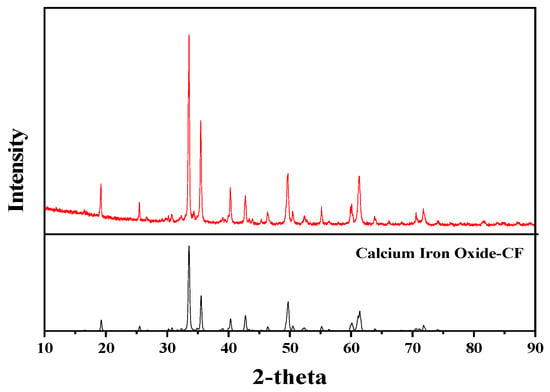
Figure 5.
X-ray diffraction (XRD) patterns of samples and CaO-Fe2O3 in standard PDF card.
The XRD patterns at room temperature of five standard samples (the chemical compositions of the samples are listed in Table 2) are shown in Figure 6. The value of ICF/IPt, the area ratio of the strongest peak of CF and Pt, was obtained using PeakFit software. According to the definition of K, ICF/IPt and XCF/XPt should show a basic linear relationship, as shown in Figure 7. K1 is the slope of the fitting line according to the formula and its value is 0.08292. Because the peak shape of Pt at room temperature is different from that at high temperature, it needs to be modified. On the basis that Fe2O3 hardly reacts at 700 °C and has the same peak shape at 700 °C and room temperature, consequently, the K at high temperature was modified by the aid of the peak intensity of Fe2O3. Figure 8 shows the relationship of IF/IPt between room temperature and 700 °C, where the slope named K2 indicates the value of . According to Figure 8, K2 is 0.73499. Furthermore, the modified K at high temperature can be obtained through K = K1/K2, and the result is 0.112818.
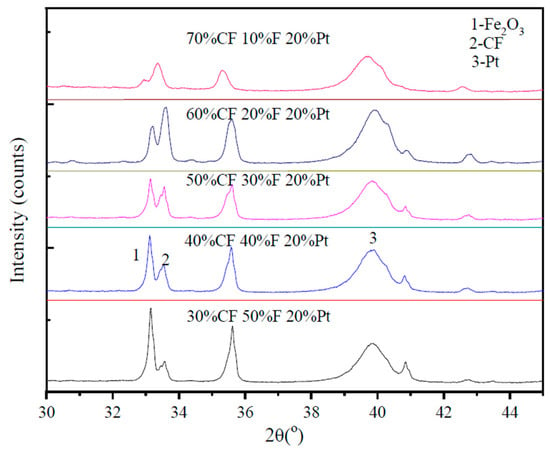
Figure 6.
The X-ray diffraction patterns of standard samples.

Figure 7.
The relationship between the accumulation intensity ratio ICF/IPt of the diffraction peak and the mass fraction ratio XCF/XPt at room temperature.

Figure 8.
Relationship between the accumulation intensity ratio ICF/IPt of the diffraction peak at room temperature and 700 °C.
In-situ XRD patterns of samples with different Al2O3 contents were collected every 50 °C from 700 °C to 1150 °C as shown in Figure 9. The peak of CF emerges at about 800 °C and the intensity enhances gradually as the roasting temperature increased. Correspondingly, the peak intensity of Fe2O3 decreases. CF occurred at 700–800 °C as indicated by the X-ray diffraction patterns, which differs from the study by Scarlett. Scarlett et al. reported that the formation of C2F and CF were observed at approximately 750 °C and 1000 °C, respectively. However, that study used a different heating scheme (10 °C per minute to 600 °C, and then, 5 °C per min to approximately 1260 °C under a flowing atmosphere of high-purity air). They reported that the occurrence of CF started at about 968–979 °C (varied with the addition of Al2O3) by using a heating rate of 20 °C/min from 25 °C to 600 °C and 10 °C/min from 600 °C to 1350 °C under a continuous gas flow of N2 and O2 (pO2 = 5 × 10⁻³ atm).
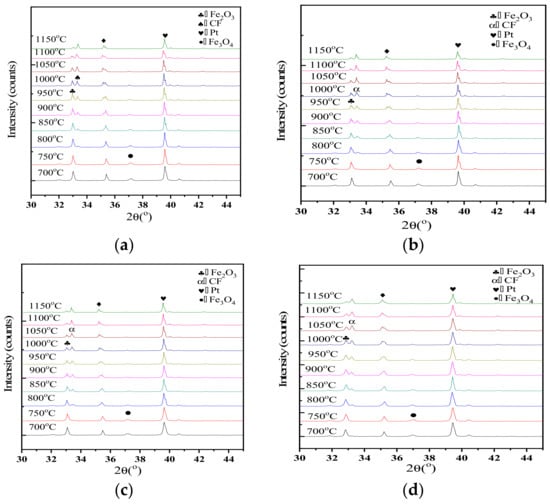
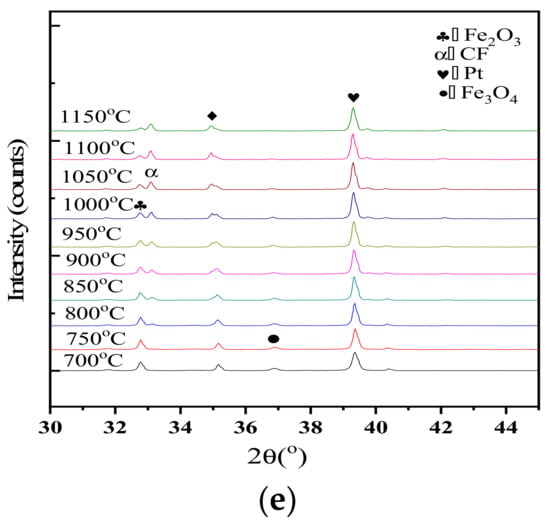
Figure 9.
In-situ XRD data collected for samples with different Al2O3 concentrations over the range 973 K to 1423 K (700 °C to 1150 °C) and 30° < 2θ < 45°, showing the formation of CF. (a) 0 Al2O3, (b) 1.4% Al2O3, (c) 2.8% Al2O3, (d) 4.2% Al2O3, (e) 5.6% Al2O3.
A set of straight lines following the data in Figure 10 were generated using OrginPro8 software (Microcal Co., Northampton, MA, USA), and the average generation rates of CF in the temperature range of 800–1150 °C were obtained. The generation rates were 0.185%/°C, 0.218%/°C, 0.171%/°C, 0.194%/°C, and 0.157%/°C corresponding, respectively, to the different Al2O3 content of 0, 1.4%, 2.8%, 4.2%, and 5.6%. The total amount of CF increased with an increase in Al2O3 levels, and the Al2O3 concentration for the maximum value of CF was 1.4%. As Al2O3 content increased from 1.4% to 2.8%, the total amount of CF reduced slightly. At Al2O3 levels greater than 2.8%, the content of CF generated significantly decreased with an increase of Al2O3 content. With an increase of Al2O3 content, the chemical composition of the composite calcium ferrite ore also changed greatly. When the Al2O3 content increased from 1.5% to 3.0%, the chemical composition changed from 7.7CaO·13.6Fe2O3·Al2O3·3.4SiO2 to 4.8CaO·11.4Fe2O3·Al2O3·2SiO2 [24]. With an increase of Al2O3 content, the activity of Al2O3 increases, and it is most similar to Fe2O3 in this system. The thermodynamics is more strongly combined with that of Fe2O3. Under the push of this chemical difference, it is easy to enter simple CF or C2F [25], forming the aluminum solid solution composite calcium ferrite.

Figure 10.
Comparison of samples with different Al2O3 concentrations on the conversion rate of CF at different temperatures.
The reaction (6) is obtained by combining reactions (2) + (5). The reaction (7) is obtained by combining reactions (3) + (5); The reaction (8) is obtained by combining the reactions (5) + (5). The reactions (6–8) are as follows:
2CaO(s) + Al2O3(s) + Fe2O3(s) → CaO·Al2O3(s) + CaFe2O4(s)
2CaO(s) + 2Al2O3(s) + Fe2O3(s) → CaO·2Al2O3(s) + CaFe2O4(s)
2CaO(s) + 2Fe2O3(s) → 2CaFe2O4(s)
The free energy of Gibbs decreased with increasing amounts of Al2O3 from the thermodynamic point of view, as shown in Figure 11. When the Gibbs free energy of the reaction was lower, the reaction occurred more easily. As the concentration of Al2O3 increased, there was an increased formation of CF. This is in accordance with the findings of other investigators [26,27], who reported an increase in the formation of calcium ferrite for sinters prepared with the addition of Al2O3.
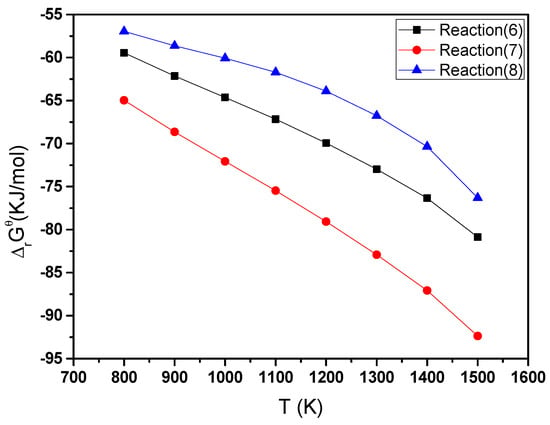
Figure 11.
The Gibbs free energy and temperature variation curves of the reaction type (6) to reaction type (8) over the range 800 K to 1500 K (527 °C to 1227 °C).
High Al2O3 concentrations will hinder the reaction of CaO and Fe2O3 from the point of view of dynamics analysis. At concentrations of Al greater than 2.8%, the dynamics have a significant influence on the reaction, more than thermodynamic effects.
4. Conclusions
Three pure chemical reagents (Fe2O3, Al2O3, and Ca(OH)2) were used to study the formation of calcium ferrite in solid state. Phase composition of the samples was determined using X-ray powder diffraction and by SEM. In addition, TG-DSC analysis was also used to determine the decomposition behavior and formation of calcium ferrites at different Al2O3 concentrations at temperatures ≤1250 °C. The formation rate of calcium ferrite was determined by in-situ XRD and by the K-value method.
The following conclusions were drawn from the results:
- (1)
- Both Ca2Fe2O5 and CaFe2O4 were formed at different concentrations of Al2O3. The formation of Ca2Fe2O5 (C2F) occurred much earlier than CaFeO4(CF). The C2F and CF formed at approximately 600 °C and 700–800 °C, respectively. As Al2O3 increased, the melting temperature decreased.
- (2)
- Pt was used as an internal standard because the chemical properties of Pt at high temperatures are stable, allowing the application of the K-value method: XJ = , K = 0.112818.
- (3)
- The total amount of CF increased with an increase of Al2O3 concentration, and the Al2O3 content at the maximum value of CF was 1.4%. As the amount of Al2O3 increased from 1.4% to 2.8%, the total amount of CF reduced slightly. At greater than 2.8% Al2O3, the concentration of CF generated significantly decreased as Al2O3 increased.
- (4)
- The free energy of Gibbs decreased with increasing amounts of Al2O3 from the thermodynamic point of view. As the concentration of Al2O3 increased, there was increased formation of CF.
Author Contributions
Conceptualization, Y.P.; Data curation, J.W.; Formal analysis, Q.X.; Investigation, H.Z.; Resources, J.S.; Supervision, Z.Z.; Writing – review & editing, K.B.
Funding
The authors gratefully acknowledge the financial support from the National Key Research and Development Program (No. 2016YFB0601304).
Conflicts of Interest
The authors declare no conflict of interest.
References
- Zhang, Z.L.; Li, Q.; Zou, Z.S. Reduction properties of high alumina iron ore cold bonded pellet with CO–H2 mixtures. Ironmak. Steelmak. 2014, 41, 561–567. [Google Scholar] [CrossRef]
- Kumar, C.U.; Ramana, R.V.; Ali, S.; Das, A.K. Quality of sinter in the light of blast furnace performance. J. Technol. Adv. Tata Steel India 1995, 20–25. [Google Scholar]
- Hino, M.; Kumano, A.; Shimizuno, K.; Nagasaka, T. Simulation on the formation, dripping and penetration behavior of primary oxide melt in the pyrometallurgical process. Proceedings of Yazawa International Symposium on Metallurgical and Materials Processing: Principles and Technologies, San Diego, CA, Chile, 2–6 March 2003; pp. 861–880, ISBN 0-87339-546-8. WOS:000182493000071. [Google Scholar]
- Bristow, N.J.; Waters, A.G. Role of SFCA in promoting high-temperature reduction properties of iron ore sinters. Trans. Inst. Min. Metall., Sect. C 1991, 100, C1–C10. [Google Scholar]
- Shigaki, I.; Sawada, M.; Gennai, N. Increase in Low-temperature Reduction of Iron Ore Sinter due to Hematite-alumina Solid Solution and Columnar Calcium Ferite. Trans. Iron Steel Inst. Jpn. 1986, 26, 503–511. [Google Scholar] [CrossRef]
- Park, T.J.; Choi, J.S.; Min, D.J. In Situ Observation of Crystallization in CaO-Fe2O3 System with Different Cooling Rates and Chemical Compositions Using Confocal Laser Scanning Microscope. Metall. Mater. Trans. B 2018, 49, 2174–2181. [Google Scholar] [CrossRef]
- Pownceby, M.I.; Patrick, T.R.C. Stability of SFC (silico-ferrite of calcium) solid solution limits, thermal stability and selected phase relationships within the Fe2O3-CaO-SiO2 (FCS) system. Eur. J. Miner. 2000, 12, 455–468. [Google Scholar] [CrossRef]
- Patrick, T.R.C.; Pownceby, M.I. Stability of silico-ferrite of calcium and aluminum (SFCA) in air-solid solution limits between 1240 °C and 1390 °C and phase relationships within the Fe2O3-CaO-Al2O3-SiO2 (FCAS) system. Metall. Mater. Trans. B 2002, 33, 79–89. [Google Scholar] [CrossRef]
- Machida, S.; Nushiro, K.; Ichikawa, K.; Noda, H.; Sakai, H. Experimental evaluation of chemical composition and viscosity of melts during iron ore sintering. ISIJ Int. 2005, 45, 513–521. [Google Scholar] [CrossRef]
- Sukenaga, S.; Gonda, Y.; Yoshimura, S.; Saito, N.; Nakashima, K. Viscosity measurement of calcium ferrite based slags during structural relaxation process. ISIJ Int. 2010, 50, 195–199. [Google Scholar] [CrossRef]
- Scarlett, N.V.Y.; Pownceby, M.I.; Madsen, I.C.; Christensen, A.N. Reaction sequences in the formation of silico-ferrites of calcium and aluminum in iron ore sinter. Metall. Mater. Trans. B 2004, 35, 929–936. [Google Scholar] [CrossRef]
- Webster, N.A.S.; Pownceby, M.I.; Madsen, I.C.; Kimpton, J.A. Silico-ferrite of calcium and aluminum (SFCA) iron ore sinter bonding phases: new insights into their formation during heating and cooling. Metall. Mater. Trans. B 2012, 43, 1344–1357. [Google Scholar] [CrossRef]
- Kang, H.; Choi, S.; Yang, W.; Cho, B. Influence of oxygen supply in an iron ore sintering process. ISIJ Int. 2011, 51, 1065–1071. [Google Scholar] [CrossRef][Green Version]
- Ce, L.; Leung, W. Factors influencing the bonding phase structure of iron ore sinters. ISIJ Int. 2003, 43, 1393–1402. [Google Scholar] [CrossRef]
- Maeda, T.; Nishioka, K.; Nakashima, K.; Shimizu, M. Formation rate of calcium ferrite melt focusing on SiO2 and Al2O3 component. ISIJ Int. 2004, 44, 2046–2051. [Google Scholar] [CrossRef]
- Sinha, M. Effect of variation of alumina on the microhardness of iron ore sinter phases. ISIJ Int. 2009, 49, 719–721. [Google Scholar] [CrossRef]
- Lu, L.; Holmes, R.J.; Manuel, J.R. Effects of alumina on sintering performance of hematite iron ores. ISIJ Int. 2007, 47, 349–358. [Google Scholar] [CrossRef]
- Kasai, E.; Saito, F. Note differential thermal analysis of assimilation and melt-formation phenomena in the sintering process of iron ores. ISIJ Int. 1996, 36, 1109–1111. [Google Scholar] [CrossRef]
- Popović, S.; Gržeta-Plenković, B.; Balić-Žunić, T. The doping method in quantitative X-ray diffraction phase analysis. Adden. J. Appl. Crystallograph. 1983, 16, 505–507. [Google Scholar] [CrossRef]
- Yin, J.; Lv, X.; Xiang, S.; Bai, C.; Yu, B. Influence of CaO Source on the Formation Behavior of Calcium Ferrite in Solid State. ISIJ Int. 2013, 53, 1571–1579. [Google Scholar] [CrossRef]
- Dalun, Y. Handbook of Practical Inorganic Thermodynamic Data, 2nd ed.; Metallurgy Industry Press: Beijing, China, 2002; ISBN 7-5024-3055-5. [Google Scholar]
- Na, Y.; Chao, X.; Li, Wu. Z. Mineral phase composition of different Al content sinter and its influence on metallurgical properties (in Chinese). Multipurp. Utili. Miner. Res. 2018, 05, 143–146. [Google Scholar] [CrossRef]
- Ding, X.; Guo, X.M. The formation process of silico-ferrite of calcium (SFC) from binary calcium ferrite. Metall. Mater. Trans. B 2014, 45, 1221–1231. [Google Scholar] [CrossRef]
- Jibing, L.; Liaosha, L. Influence of Al2O3 on Sinter for Its Phase Compositions and Properties in Equilibrium (in Chinese). J. Anhui Univ. Technol. 2009, 26, 333–337. [Google Scholar] [CrossRef]
- Xingmin, G. Calcium Ferrite Formation and Its Mineralogy during Sintering (in Chinese); Metallurgical Industry Press: Beijing, China, 1999; ISBN 9787502423612. [Google Scholar]
- Price, C.; Wasse, D. In Developments in Ironmaking Practice; Iron and Steel Inst.: London, England, 1972; pp. 32–52. [Google Scholar]
- Matsuno, F.; Nishikida, S.; Ikesaki, H. Strength Deterioration of Samples of Iron Ore-5–10% CaO Systems during the Reduction at 550 °C in 30% CO-N2 Gas. Trans. Iron Steel Inst. Jpn. 1984, 24, 275–783. [Google Scholar] [CrossRef]
© 2019 by the authors. Licensee MDPI, Basel, Switzerland. This article is an open access article distributed under the terms and conditions of the Creative Commons Attribution (CC BY) license (http://creativecommons.org/licenses/by/4.0/).