Article

Nucleation and Growth of Iron Whiskers during Gaseous Reduction of Hematite Iron Ore Fines

State Key Laboratory of Advanced Metallurgy, University of Science and Technology Beijing, Xueyuan Road No.30, Haidian district, Beijing 100083, China
*
Author to whom correspondence should be addressed.
Metals 2019, 9(7), 750; https://doi.org/10.3390/met9070750
Submission received: 18 June 2019 / Revised: 1 July 2019 / Accepted: 2 July 2019 / Published: 4 July 2019

Abstract

:
A high-temperature confocal scanning laser microscope and an online reduction–water quenching experiment system were used to systematically study the generation of iron whiskers during the reduction of hematite ore particles with CO/CO2 gas. The "blooming" phenomenon of the surface during the reduction of iron ore particles was found in this experiment. The orientation of the grain on the longitudinal section of an iron whisker was measured to be uniform by applying the electron back-scattered diffraction technique, which proved that the iron whiskers are most likely to exist in single crystal form. According to the in-situ online experimental video, the average diffusion flux of iron atoms when the layered iron completely covers the surface of the ore particle is about 0.0072 mol/(m2·s). While the iron atom diffusion flux at the root of the iron whisker during the pre-growth process is much larger than the flux when the layered iron is produced, which are defined to be 0.081 mol/(m2·s), 0.045 mol/(m2·s), 0.013 mol/(m2· s), and 0.0046 mol/(m2·s), respectively during the four stages of the growth of an iron whisker. The quantitative relationship between the chemical driving force and the whisker growth is established as Δ G θ + R T ln p CO 2 p CO + 2 n 0.056 r ρ E s T = 0 .

Graphical Abstract

1. Introduction

With the gradual depletion of high-quality lump iron ore resources around the world, the efficient use of fine ore resources obtained after mineral processing has received wide attention in the iron-making industry [1,2,3,4]. Getting rid of the process of sintering and agglomeration, the direct reduction process using iron ore fines directly has many advantages such as high efficiency, energy saving, and environmental protection. Non-blast furnace iron-making processes that can directly treat iron ore fines include smelting reduction processes of HIsmelt [5], HIsarna [6], Flash iron-making technology (FIT) [7], and direct reduction processes of Finex [8], Finmet [9]. However, the high-temperature smelting reduction process requires the reduction of ore fines at temperatures above 1573 K, which is very likely to cause melting problems of mineral powders and erosion of refractory materials [10]. The low-temperature direct reduction process avoids the melting of the particles, but there are also problems like particle agglomeration and long reduction period. According to previous studies [11], iron whiskers produced on the surface of the particles during the low-temperature gas-based reduction of iron ore fines cause the sticking problem of the material bed. Therefore, in-depth analysis of iron whisker generation and the microscopic reduction process of iron ore particles has far-reaching significance for solving the problems of sticking and low efficiency during low-temperature gas-based reduction of iron ore fines.
Whisker is very common, it can be found in electronic components [12] and it can be produced during vapor deposition [13], reduction of iron oxide [14], and cooling of wustite (Fe1-xO) [15]. Some whiskers such as carbide [16], nitride [17], oxide [18], etc., are used for the preparation of composite materials due to their high elastic modulus and other characteristics, thereby improving the toughness of the material [19,20]. However, sometimes whiskers can cause problems, such as metal whiskers in electronic components can cause short circuit [12], iron whiskers produced during gas-based reduction of iron ore fines will cause the agglomeration of iron ore particles.
The process of producing iron whiskers on the surface of iron ore particles involves various physical and chemical factors, so the process is very complicated, and there is still no clear understanding of it. Some researchers have done some work on this, but most of them used off-line observation to study, which cannot achieve the monitoring of the whole reduction process, so some important information may be lost. The high-temperature confocal scanning laser microscope (HCSLM) was employed in this study to realize the monitor of the whole reduction process. So far, hardly any information can be found on the crystallization characteristics of iron whiskers. Then the crystallization characteristics of iron whiskers were characterized by the electron back-scattered diffraction (EBSD) technique in this study. To understand the distribution of iron nuclei in the internal part of iron ore particles during reduction, the vertical furnace water quenching experiment was carried out. Afterward, the internal evolution of iron ore particles was summarized by observing the particles’ cross-section offline. Combining the experimental phenomena obtained in this study and the research results in the literature, some arguments have been made to make certain contributions to the analysis of the characteristics and formation mechanism of iron whiskers in the reduction process of iron ore fines.
It is generally believed that the generation of iron whiskers is determined by the reduction process of wustite. For the reduction mechanism of wustite, there are mainly the following hypotheses: Hayes et al. [21,22] suggested that the iron whisker is caused by the bursting of the iron layer. While Rist [23] proposed the counterbalance theory between reduction rate and diffusion velocity at a macro level. Kohl et al. [24] believed that oxygen atoms diffused through the metallic iron layer to the gas-solid reaction interface. Hayes et al. [22] indicated that CO completes the de-oxidation reaction at the Fe/Fe1-xO interface through the carbon deposition-carburizing process, and H2 diffuses through the metallic iron layer to the Fe/Fe1-xO interface to complete the de-oxidation reaction. In this paper, part of Krőger–Vink’s [25] mechanism was used to the theoretical derivation, and some insights on the mechanism of the nucleation of metallic iron and the generation of layered iron/iron whiskers are proposed.

2. Experimental

2.1. Material

The Brazilian iron ore particles (CVRD) with the diameter of 105–150 µm were used in the experiment as their lamellar structure is conducive to find particles with a flat surface under the microscope. The composition of the Brazilian iron ore is listed in Table 1, which was analyzed by the XRF method. And the total iron content was rechecked with the titration method. Figure 1 displays its result of the XRD test, which was carried out with the X-ray diffractometer (SmartLab produced by Rigaku, Tokyo, Japan). The SiO2 phase in the Brazilian iron ore exists in the form of independent particles (darker particles in Figure 2) separate from the hematite phase. The scanning electron microscope (SEM) and the energy dispersive spectrometer (EDS) tests were carried out with the MLA-250 made by FEI, Hillsboro, OR, USA). The hematite particles are found to be similar to pure Fe2O3 particles.

2.2. In-Situ Online Observation of the Reducing Process of Iron Ore Particles

The in-situ online observation experiment was carried out with the high-temperature confocal scanning laser microscope (HCSLM) system (VL2000DX-SVF17SP-SVF15FTC made by lasertec, Yokohama, Japan), as shown in Figure 3. It consists of two main functional systems: The high temperature stage system and the observation system. Due to the shorter wave length of the laser compared to natural light, the depth of field for the HLSCM system is deeper than normal optical microscope. Deeper depth of field helps to achieve more detailed information of the sample [26].
Firstly, some iron ore particles were scattered over a flat alumina crucible (1 mm in height and 8 mm in diameter). Then the crucible was put into the micro-furnace in the high-temperature stage (HTS). The HTS was sealed and the water cooling system was turned on before starting the heating program. The argon gas as an evacuation gas was piped into the HTS with the flow rate of 30 mL/min during the whole heating period. The ore particles with a flat surface were chosen as the observation subjects under the confocal scanning laser microscope with the magnification of 2000X. The heating rate was 50 K/min. When the temperature had reached the target temperature for 5 min the argon gas was changed with the CO/CO2 mixture gas, which had a flow rate of 30 mL/min. Then the isothermal reduction behavior of a single iron ore particle was photographed with a camera and recorded with a video software. Finally, the gas was changed back to argon gas after an experiment and the HTS was cooled down at the rate of 50 K/min. Five reduction temperatures (973 K, 1073 K, 1173 K, 1273 K, 1373 K) and three reducing atmospheres (75% CO + 25% CO2, 85% CO + 15% CO2, 95% CO + 5% CO2) were used in the experiment. A total of 15 experiments were performed.

2.3. Online Quenching and Offline Characterization

In order to study the intermediate state of the reduction process, a reduction–online water quenching experiment system was designed. The detailed description of this apparatus is in our previous study [26]. A thin layer of iron ore particles was evenly distributed on a rounded alumina plate. The alumina plate was hung onto the electromagnetic suspension device using a molybdenum wire. Then the flange on the upper part of the furnace tube and the water quenching system at the lower part of the furnace were installed before setting and starting the heating program. The argon gas was continuously piped into the tube with the flow rate of 500 mL/min before the object temperature was reached and the argon gas was changed to reducing gas (500 mL/min). Cutting off the power supply of the electromagnetic hanging device and releasing the hot hanging plate into the quenching tank, the initial state of the fractional reduced ore particles remained. It was determined that the water quenching operation of the EDS energy spectrum will not lead to the oxidation of the surface of reduced ore particles. The experimental conditions are listed in Table 2.
The cooled fractional reduced ore particles were removed from the water quenched tank and then dried in a dry box at low temperature (363 K) followed by a series of offline tests such as SEM, EBSD (the electron back-scattered diffraction-crystalign made by Bruker, Germany), etc. After inlayed in electro-conductive resin, the ore particles were pretreated with mechanical grinding and polishing, and then the surface stress layer was eliminated by argon ion polishing. Finally, EBSD detection was carried out.

3. Results and Discussion

3.1. The In-Situ Online Observation

3.1.1. The “Blooming” Phenomenon on the Surface of Particles

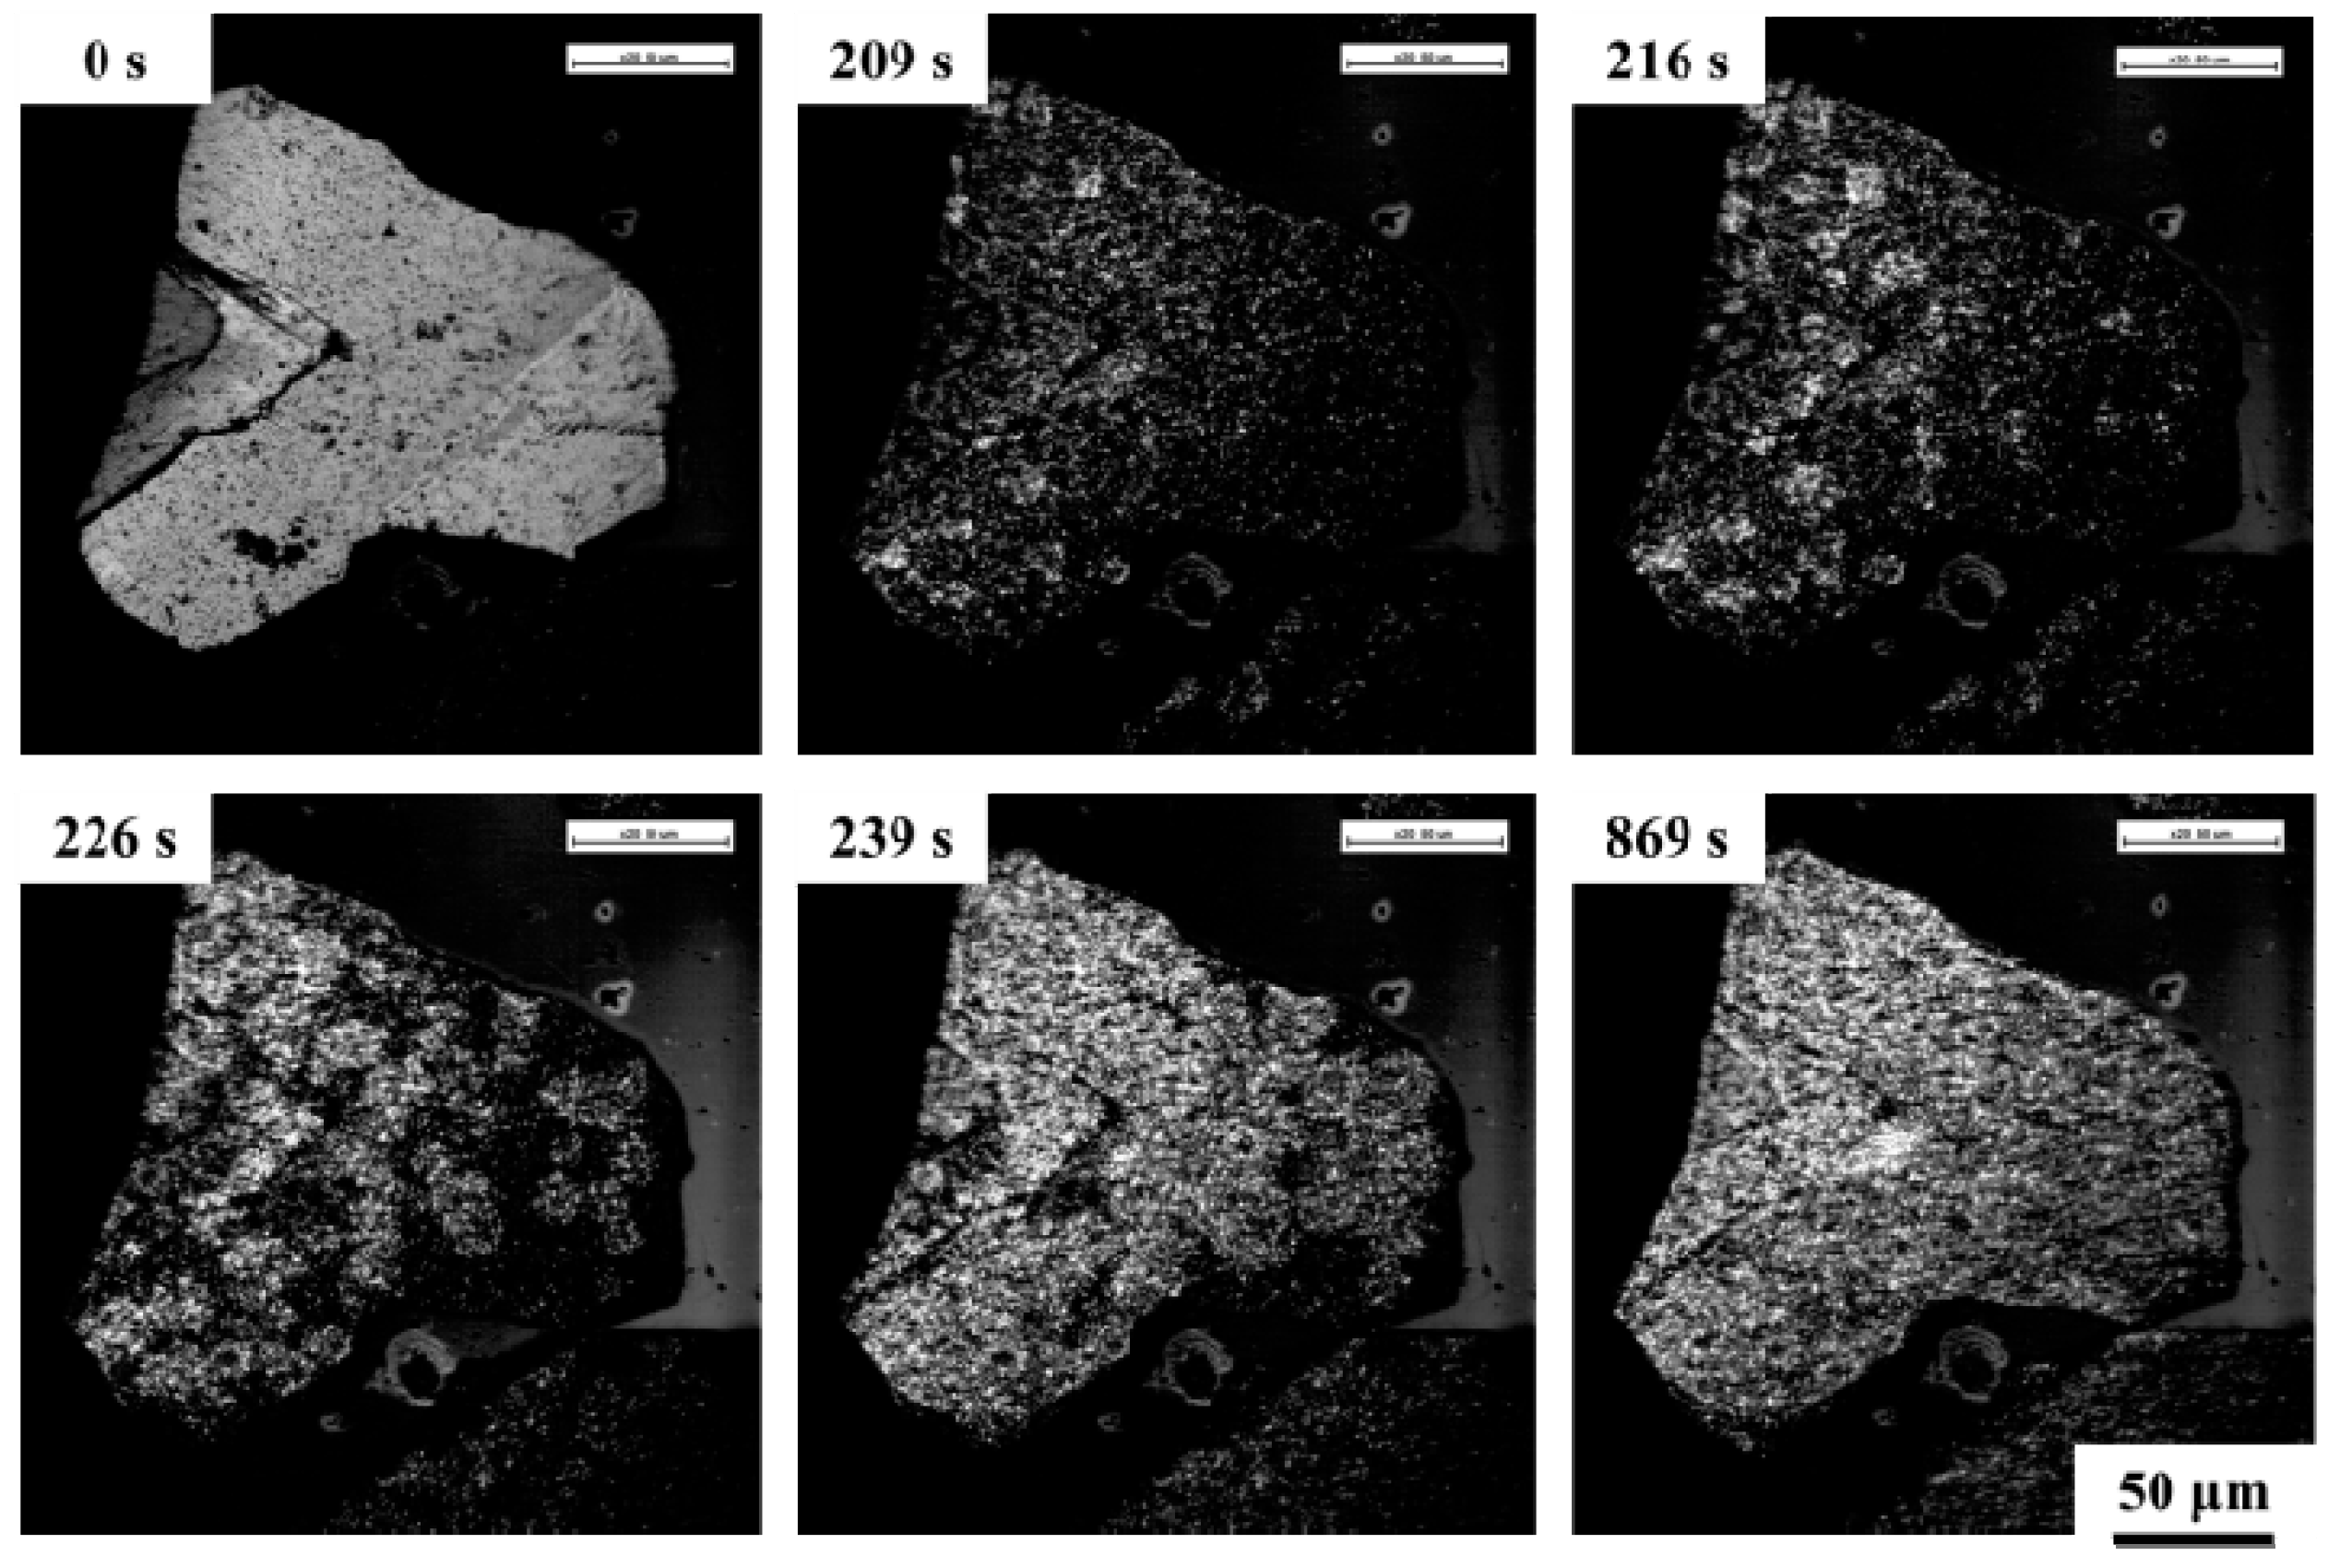
The in-situ online observation of the evolution of particle surface morphology during the reduction of Brazilian iron ore particles with a lamellar structure was carried out by the HCSLM device. After the iron ore particles were contacted with the reducing gas, the smooth surface of the particles gradually became rough and porous. After that, the aggregation of metallic iron on the surface of the particles was observed, similar to the phenomenon of "blooming", which rapidly developed from the center point outwards (Figure 4). As shown in Figure 5, the surface of the iron ore particles is covered with metallic iron after “blooming”. Therefore, the “blooming” phenomenon was caused by the formation of layered iron. The relevant arguments are discussed in Section 4. At the same time, the appearance and growth process of the iron whiskers can also be recorded in real time through video recording. It can be seen that the iron whiskers were produced only after the reduction reaction had proceeded to a certain extent, and emerged almost synchronously with the accumulation of surface metallic iron. The iron whiskers continuously grew from the roots, and the growth rate gradually decreased. The surface morphology of the iron ore particles in the late stage of the reduction was basically no longer changed.

3.1.2. The Growth of Iron Whiskers

Under certain reducing conditions, the iron whiskers can be seen on the surface of iron ore particles, as shown in Figure 6. When the reduction temperature was 973 K and the reducing atmosphere was 75% CO + 25% CO2, the surface morphology of the ore particles did not change much during the initial 130 s reduction. The iron whiskers appeared at 130 s and continued to grow thereafter. Gradually, its growth rate slowed down, and the surface of the ore particles became rough and porous. Due to the growth of the whiskers at the bottom of the ore particles, the ore particles constantly moved during the reduction process. It can be seen that the iron whiskers have certain strength during the growth process, so the entire particles can be easily lifted. Due to the high strength of the iron whiskers, the intertwining of the iron whiskers between different particles causes the sticking problem during the fluidized reduction process of iron ore fines. The crystallization characteristics of metallic iron whiskers have been studied in depth in the later part of this paper.

3.1.3. Influence of Temperature, Atmosphere, and Other Factors

The surface morphology of the iron ore particles observed under different experimental conditions is shown in Figure 7. It can be seen from the two subfigures that the iron whiskers are easily produced at the conditions of lower reduction temperatures and lower CO concentrations. On the contrary, the layered iron morphology is more likely to be produced at the conditions of higher reduction temperatures and higher CO concentrations. The reasons for this phenomenon will be discussed later.

3.2. The Online Quenching Experiments

3.2.1. Evolution of Surface Morphology

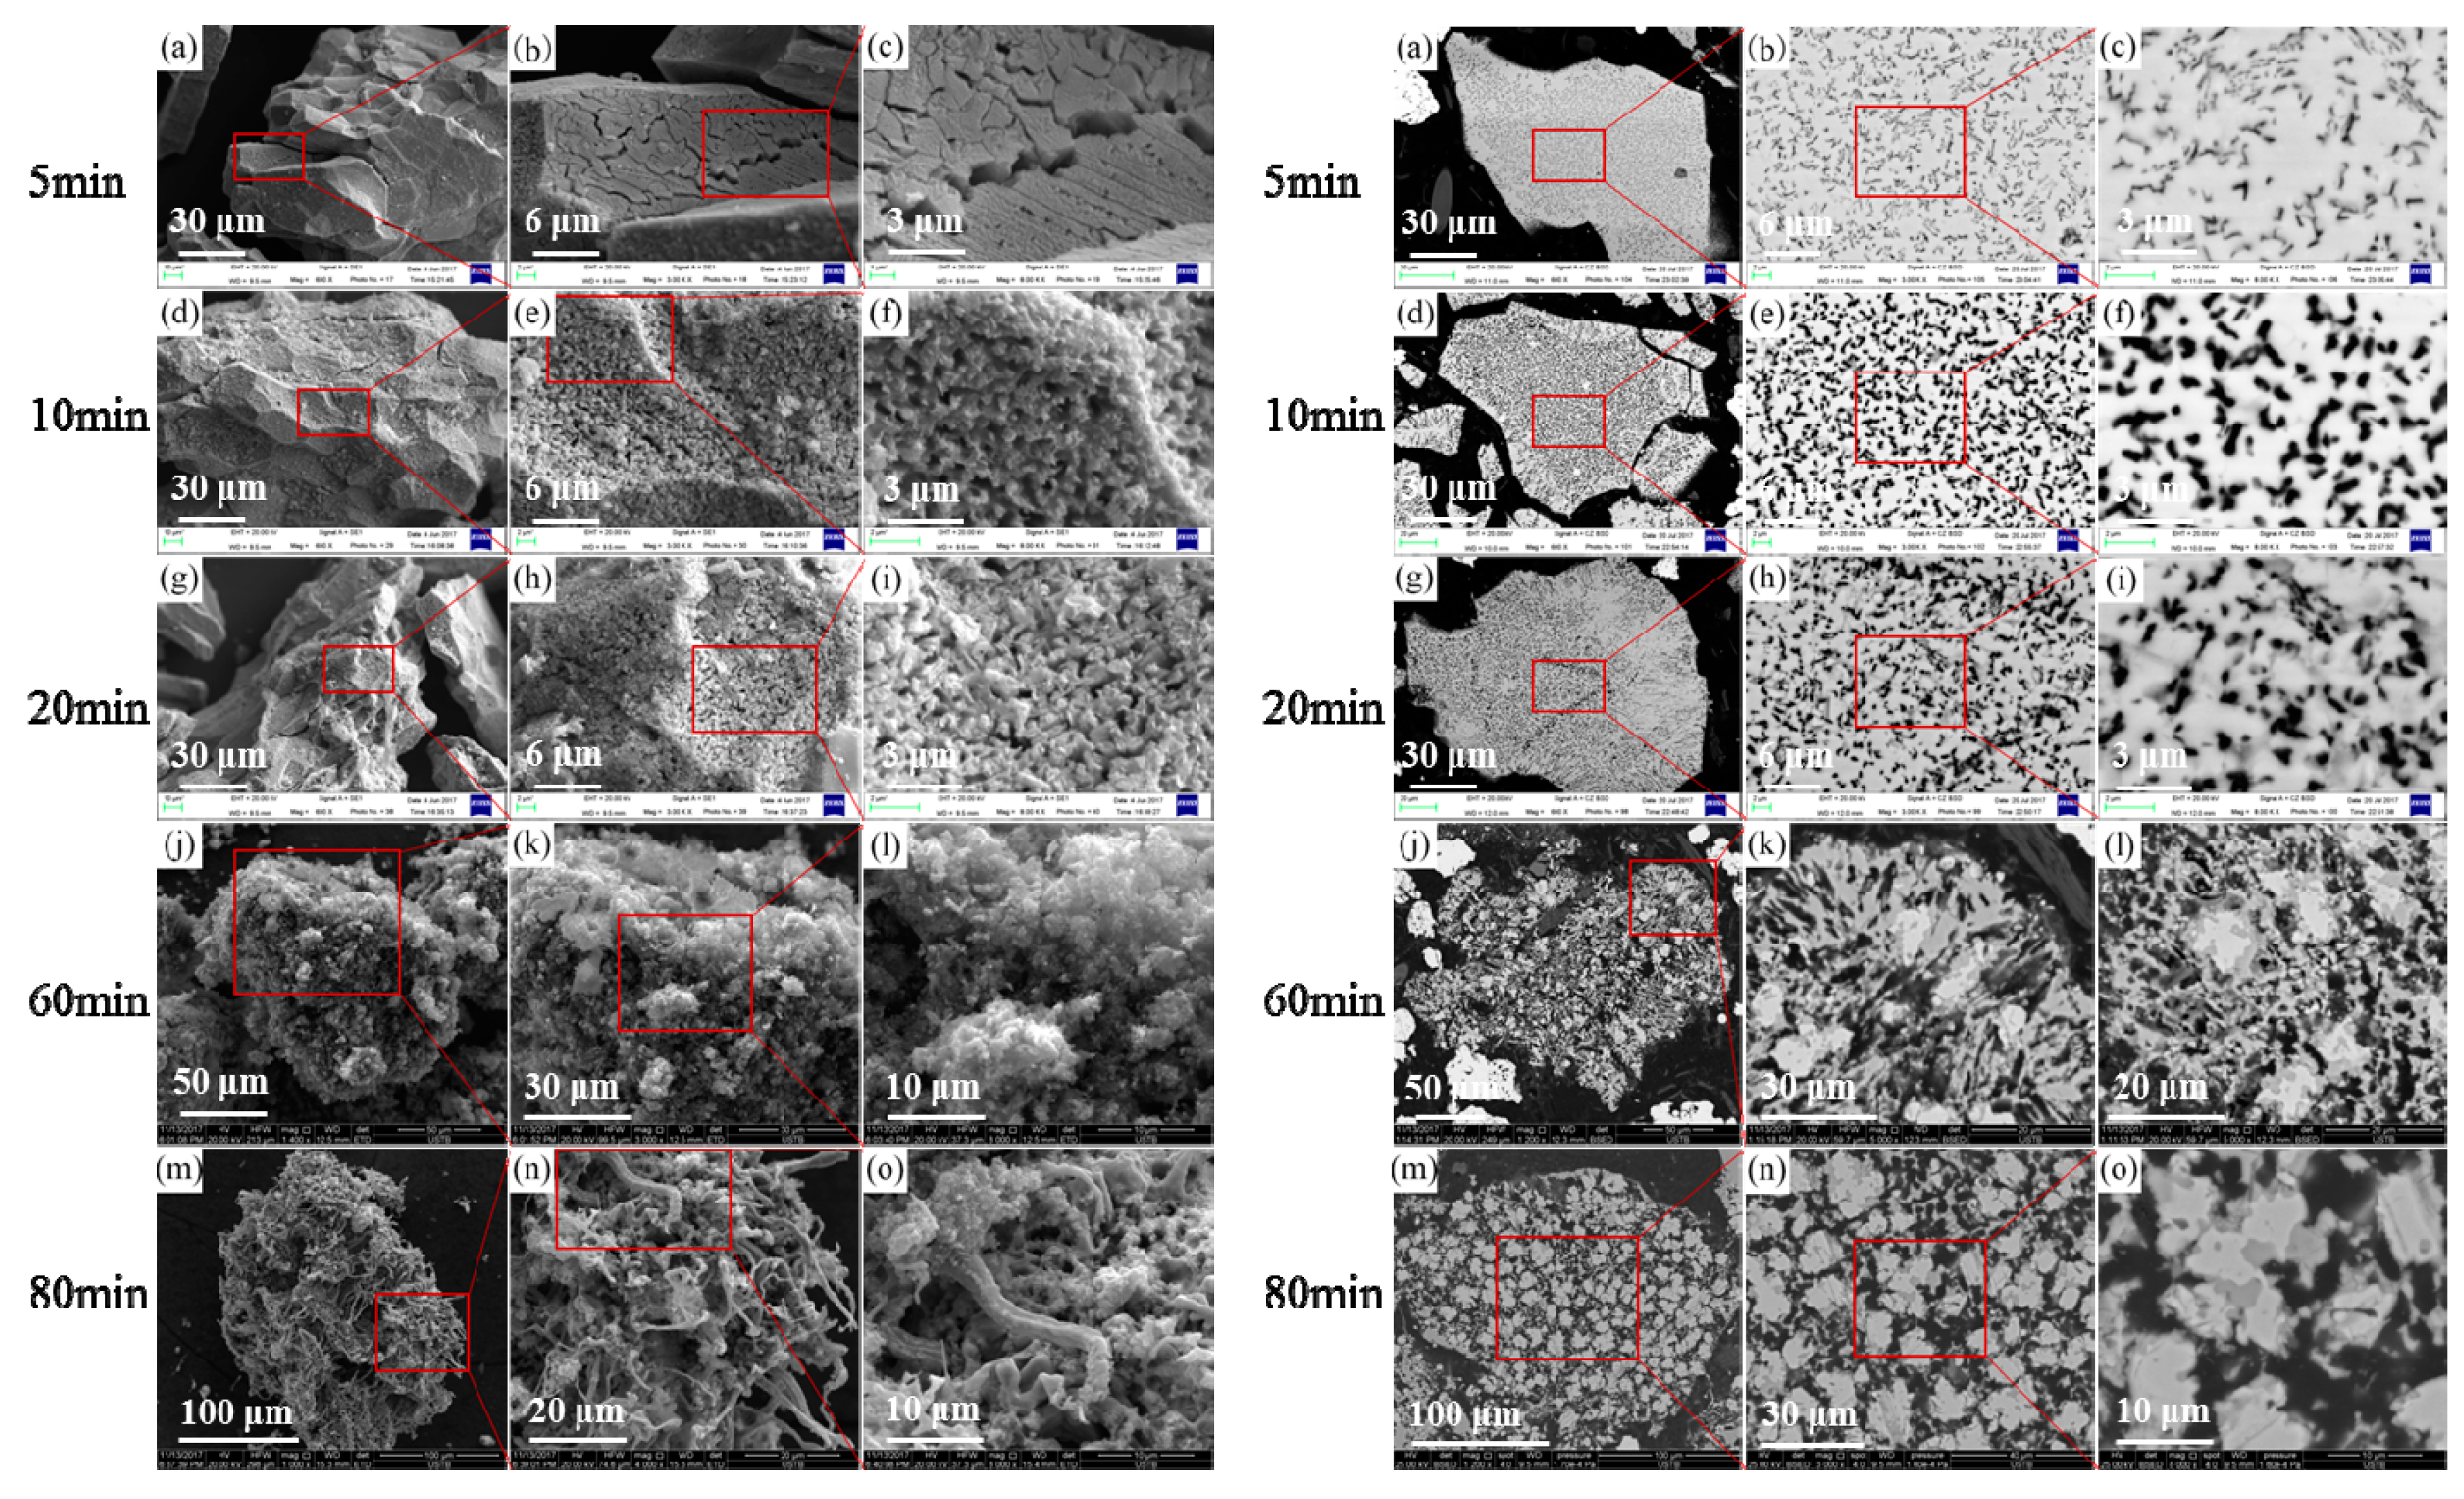
After the reduction and online water quenching operation, the samples were dried and adhered to the conductive paste and the morphology of the particles was observed under an SEM. The microscopic observation results are shown in Figure 8, Figure 9 and Figure 10. After reduction for 5 min, pores and cracks appeared on the surface of the iron ore particles due to the volume shrinkage during the de-oxygenation from Fe2O3 lattice. As the reduction process progressed, the pore size on the surface of the particles gradually increased, and as the reduction temperature increased, the pore size also increased. The iron whiskers appeared on the surface of the ore particles in the late stage of reduction, and the diameter of the whiskers increased with the increase of reduction temperature.

3.2.2. Evolution of Cross-Section Morphology

The iron ore particles obtained after water quenching were embedded in the resin, polished and placed in an SEM to observe the cross-sectional morphology. It can be seen that there were pores with different shapes inside the ore particles in the initial stage of the reaction, which are long, angular and irregular, and the length was about 0.2~2 µm. In the initial stage of reduction, no metallic iron was formed. As the reduction time was prolonged, the pore size inside the particle gradually increased, and the point-like metallic iron crystal nuclei gradually appeared inside the particle. The number of metallic iron crystal nuclei gradually increased, and after the completion of the reaction, they exist in the formed a network inside the particles. As shown in Figure 8m, Figure 9m and Figure 10m, a metallic iron "shell" is left in the outer layer of the particle at the late stage of the reduction, and iron whiskers are attached to the outer surface of the iron shell. The reasons for the formation of this morphology will be analyzed in the discussion section. It can be seen from the cross-sectional view of the particle that the pore depth on the surface of the particle was small, and the pores only existed on the surface layer of the particle and did not penetrate into the inside part.

3.3. Crystallization Characteristics of Iron Whiskers

The sample of No. 11 in Table 2 was subjected to EBSD detection. As shown in Figure 11, the crystal orientation data distribution on the longitudinal section of the iron whisker in the pole figure and the inverse pole figure was relatively concentrated, which indicates that the crystal orientation of each place on the longitudinal section of the iron whisker tends to be uniform. Moreover, it was calculated that the Euler angle orientation difference in the longitudinal section of the iron whisker was less than 10°. It has been proved that iron whiskers are most likely to exist in single crystal form. Theoretically, metallic iron exists in the form of α-iron in the body-centered cubic structure below 1185 K, and its close-packed direction is {111}, so the iron whiskers preferentially extend in the {111} direction. Fe1-xO is also in cubic structure, the iron whiskers grow along the {111} direction of the Fe1-xO lattice [15].

4. Discussions

4.1. Reduction Mechanism of the Hematite Iron Ore Fines

The mineral powder used in this paper is the hematite iron ore fines. The conversion from Fe2O3 to Fe3O4 and to Fe1-xO is very rapid compared with the process of conversion from Fe1-xO to Fe. Before the iron whiskers are produced, the ore particles are reduced to the Fe1-xO phase, and there is no Fe2O3 or Fe3O4 phase, so the next reduction process can be regarded as a single interface reduction reaction of the Fe1-xO phase [27]. In this paper, the theory of the reduction mechanism of the Fe1-xO phase proposed by Krőger–Vink [25] was implemented. Accordingly, the process of gaseous reduction of Fe1-xO phase was divided into six stages: (1) Migration of the CO molecules to the surface, (b) adsorption of CO gas onto the Fe1-xO surface, (c) reduction at the Fe/Fe1-xO interface, (d) migration of V Fe and 2 h · in Fe1-xO, (e) removal of CO2 gas from the Fe1-xO surface, and (f) diffusion of CO2 gas near the Fe1-xO surface. The entire reduction reaction process can be expressed as CO ad + O + V Fe + 2 h · = CO 2 , where V Fe is a divalent iron ion hole, h · is an electron hole. Since the Fe1-xO phase is a cation-deficient structure, there are iron ion holes. When iron atoms are formed due to the loss of oxygen atom through the reaction at the Fe1-xO/gas interface, these newly formed iron atoms can be accommodated into the iron ion holes present in Fe1-xO through diffusion. As the de-oxidation reaction on the surface of the ore particles progresses, the ion hole content in the Fe1-xO phase gradually decreases, that is, the value of x gradually approaches zero.
The chemical energy of the system increased with the iron ion super-saturation of the Fe1-xO phase [28]. Because of the increased iron ion mobility and instability caused by the presence of defects such as grain boundaries or dislocations, the metallic iron nucleus will preferentially appear in some locations such as grain boundaries and dislocations inside the Fe1-xO phase [29]. That is, the reaction Fe Fe 1 x O = Fe + V Fe + 2 h · occurs to produce a new Fe1-xO/Fe reaction interface. The iron ion holes and electron holes generated in the reaction diffused toward the surface of the interface of Fe1-xO/gas, thereby ensuring the continuous progress of the reduction reaction at the surface. Defects, such as dislocations, can be formed during the crushing of oxide samples or as a result of phase transformations, e.g., Fe2O3 to Fe3O4, Fe3O4 to Fe1-xO [28]. The interfacial reaction at Fe1-xO/Fe interface can occur at a position very close to the surface of the ore particles. Due to the uniformity of the non-stoichiometric nature of the Fe1-xO phase in the ore particles under high temperature, the metallic iron nuclei can also generate inside the ore particles as shown in Figure 8, Figure 9 and Figure 10.

4.2. Diffusion and Nucleation of Iron Atoms during Reduction

The "blooming" phenomenon observed in the in-situ online experiment is the formation process of the metallic iron layer on the surface of the ore particles. Since the formation speed of the metallic iron phase is determined by the diffusion speed of the iron atom at the Fe1-xO/Fe interface, the diffusion flux of iron atoms during the formation of layered iron can be evaluated according to the rate of "blooming". The effect of temperature on the density of metallic iron was neglected, the density and the thickness of the layered iron was set at 8700 kg/m3 and 3 µm, respectively (measured by the SEM observation of the cross-section of the ore particles obtained by the water quenching experiment). By observing the video of the in-situ online observation, the radius of the layered iron was found to increase from r0 to r1 during the time t0 s to t1 s, and the diffusion flux of the iron atom can be calculated by the following Equation:
J ¯ = ( π r 1 2 π r 0 2 ) × d × ρ 0.056 × Δ t × ( π r 1 2 π r 0 2 + 2 π r 1 × d )
where J ¯ is the diffusion flux of the iron atom (mol/(m2·s)), d is the metallic iron layer thickness (m), ρ is the metallic iron density (kg/m3), and Δt is the time variable (t1t0, s). According to the experimental data under the condition of 1073 K with 85% CO + 15% CO2 (Figure 4), the radius r of the layered iron circle at different time variables Δt was collected from the video image, then the average diffusion flux of iron atoms at different time variables was calculated by the Equation (1). Three different layered iron circle data were tracked and plotted, as shown in Figure 12. The fitting Equation was obtained by fitting the curve in the graph:
J ¯ = 0.224 Δ t 0.846
When the surface observed by the ore fine particles was completely covered by the metallic iron layer, the average diffusion flux of the iron atom at this time was calculated and compared with the average diffusion flux value obtained by extrapolation using the Equation (2). The calculation process is as follows: As shown in the video images in Figure 4, the first metallic iron nucleus appeared at t0 = 203 s and the upper surface of the ore particles was completely covered by metallic iron at 261 s. The area of the upper surface of the particle was estimated as an equilateral triangle, and the side length L of the triangle was measured as 200 µm, then the area S is 30.5/4 × L2 = 1.73 × 10⁻⁸ m2. The average diffusion flux when the surface of the iron ore particles was completely covered by metallic iron is:
S × d × ρ/[0.056 × Δt × (S + 3L × d)] = 1.73 × 10−8 × 3 × 10−6 × 8700/[0.056 × (261–203) × (1.73 × 10−8 + 3 × 200 × 10−6 × 3 × 10−6] = 0.0078 mol/(m2·s). This value is very close to the extrapolated value of the average diffusion flux (0.0072 mol/(m2·s)) calculated by Equation (2) when Δt = 58 s.
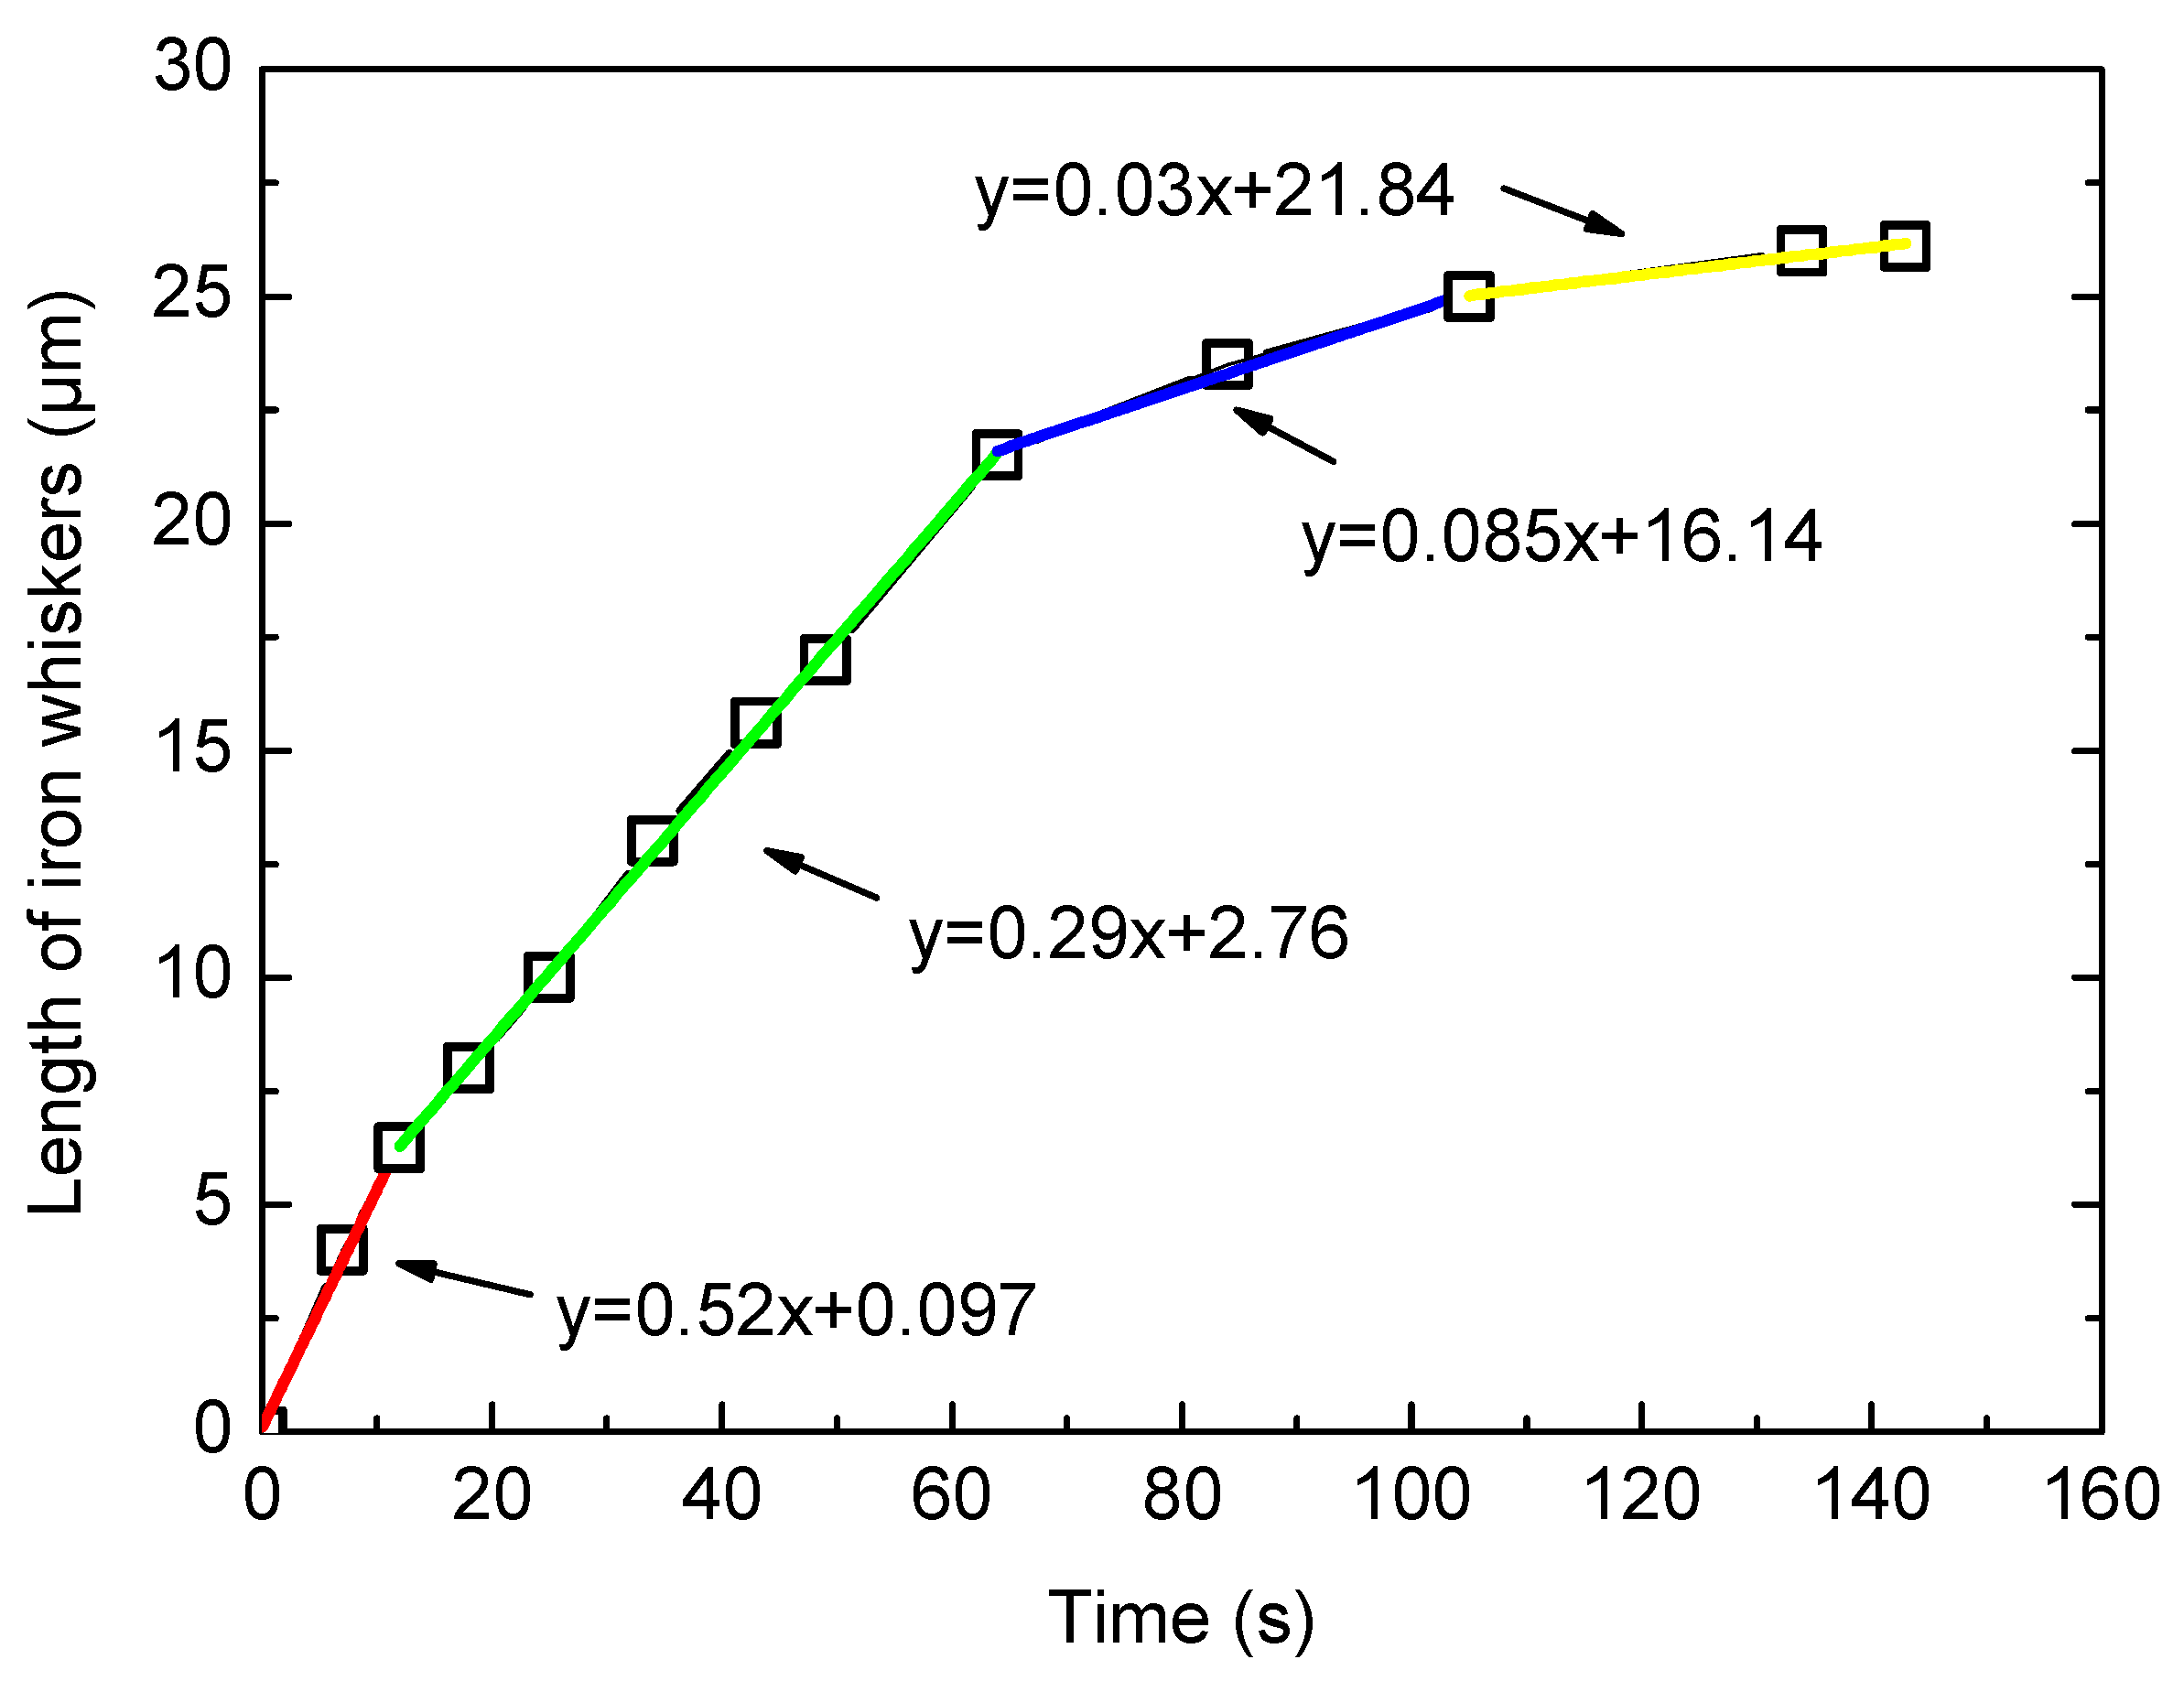
According to Figure 6, which is a frame from the experimental video, the iron atom diffusion flux during the growth of the iron whiskers was estimated. The iron whisker in the circle mark in Figure 6 was monitored. The diameter D of the iron whisker was 3 µm. Assuming that the iron whiskers were of uniform diameter, the whisker cross-sectional area S is π(D/2)2 = 7.07 × 10⁻¹² m2. The whisker appeared at 109 s. The relationship between the diffusion flux J (mol/(m2·s)) of iron atoms and the growth rate v (µm/s) of whiskers can be expressed as J = S × v × ρ/S/0.056 = v × ρ/0.056. The relationship between the length of the iron whisker and the growth time was obtained by measuring the image in the in-situ online experiment, which is shown in Figure 13 (the time when the iron whisker began to appear was set as the time origin in the figure). A piecewise fitting of the first order was performed on the data in the graph, and the slope of the fitting equation was the growth rate of the iron whisker. Therefore, according to the Equation J = v × ρ/0.056, the diffusion fluxes of the iron atoms in the four stages of growth in Figure 13 were: 0.081 mol/(m2·s), 0.045 mol/(m2·s), 0.013 mol/(m2·s), and 0.0046 mol/(m2·s), respectively. It can be seen that the iron atom diffusion flux at the root of the iron whisker during the early growth period is much larger than that of the iron atom when the layered iron is generated. In this experiment, the growth rate of the iron whisker began to slow down substantially after 60 s.
Wagner [30] proposed the following Equation for the study of the growth of metallic whiskers on metal oxides or sulfides:
n Me ( diffusion ) 4 A Π C Me D Me r f Me ln a Me I a Me Π
where n Me : the rate of metal transport (mol/s); A Π : The total contact area between oxide and metal (m2); C Me : The concentration of metal ions (mol/m3); D Me : The self-diffusion coefficient (m2/s); f Me : The correlation factor; a Me I : The activity of metallic atoms in metallic oxides; a Me Π : The activity of metallic atoms in metal phase. The diffusion flux of the metallic iron atom obtained from Equation (3) is:
J 4 C Me D Me r f Me ln a Me I a Me Π
Referring to the relevant arguments in Section 4.3, it can be considered that the driving force of promoting the growth of iron whiskers is equal to the driving force of chemical reactions. It is known that the equilibrium constant of the reaction Fe1-xO + CO = (1-x) Fe + CO2 at equilibrium state with the reduction temperature of 1073 K and a reducing atmosphere of 75% CO + 25% CO2 is K = 0.567 [31]. Namely, R T ln a Me I a Me Π = ( R T ln K θ + R T ln p CO 2 p CO ) = R T ln ( 0 . 567 + 25 75 ) = R T ln 1 . 11 , then: a Me I a Me Π = 1.11. The values of other parameters are as follows: The radius of iron whisker r = 1.5 × 10⁻⁶ m, C Me = ρ/0.056 = 8700/0.056 = 1.5 × 10⁵ mol/m3, D Me = 5.8 × 10⁻¹³ m2/s, f Me = 0.82 [15]. According to the Equation (4), the diffusion flux J of the metallic iron during the growth of the metallic iron whiskers is 0.029 mol/(m2·s). This value is close to the diffusion flux of the iron atoms in the second and third stages calculated in the in-situ online experiment, as shown in Figure 13. Hayashi et al. [15] studied the generation of iron whiskers on the surface of supersaturated Fe1-xO. The growth rate of iron whiskers was determined experimentally and also estimated by the Wagner Equation. However, the growth rate of iron whiskers obtained in his study is much smaller than the growth rate of iron whiskers in this study. The reason for this difference is the presence of a driving force for the growth of iron whiskers by reducing gas in this study.

4.3. The Generating Mechanism of Layered Iron and Iron Whiskers

The de-oxidation reaction in the Fe1-xO phase and the generation of the metallic iron nucleus are shown in Figure 14a and the angle formed between the Fe1-xO/Fe interface and the metallic-iron/gas-phase interface is defined as the angle θ.
Before the appearance of iron whiskers, the concentration of iron atoms in the Fe1-xO phase is increasing (that is the “x” in Fe1-xO approaches 0 continuously) and when it reaches a certain level, the metallic iron nucleuses are formed firstly at the grain boundaries of the particle surface, the surface of internal cracks or where lattice defects are dense [32]. The appearance of the iron nucleus on the surface of the ore particles causes the generation of a new Fe1-xO/Fe interface and the metallic-iron/gas-phase interface. The new interface consumes the accumulated energy in the Fe1-xO phase, and the production of metallic iron promotes the reaction Fe Fe 1 x O = Fe + V Fe + 2 h · . Thereby, the cation holes and electron holes are continuously supplied to the reduction reaction interface ensuring the continuity of the reduction reaction.
The formation of layered iron and iron whiskers is determined by the relationship between the rate of chemical reaction and the diffusion rate of cation and electron holes. The diffusion rate of cation and electron holes is determined by temperature alone. The higher the temperature is, the higher the rate of diffusion. The rate of chemical reaction is determined by the combination of temperature and CO concentration. The high temperature and high CO concentration contribute to the increase of chemical reaction rate. Under the condition of high temperature and high CO concentration, the rate of chemical reaction is greater than the diffusion rate of cation and electron holes from the interface of the distant Fe1-xO/Fe interface to the de-oxidation reaction interface. At this time, the angle θ is below 90° [25]. The Fe1-xO/Fe interface of the metallic iron nucleus preferentially develops closer to the de-oxidation reaction interface, that is, preferentially extends the interface laterally, rather than expanding into the interior of the particle. Then the growth of layered iron appears macroscopically on the particle surface, which is the cause of “blooming” phenomenon, as shown in Figure 14b. Under the conditions of high temperature and low CO concentration or low temperature and high CO concentration, the rate of chemical reaction is less than the diffusion velocity of cation and electron holes from the distant Fe1-xO/Fe interface to the de-oxygen reaction interface. At this time, the angle θ is close to 90° and the Fe1-xO/Fe interface of the metallic iron nucleus expands to the inside of the particle very quickly. The increase of the volume of the metallic iron nucleus will increase the interfaces of Fe1-xO/Fe and Fe/gas, and since the angle θ is large, the iron nucleus expands to the inside of the particle, and the new Fe1-xO/Fe interface increases. Since the energy consumed to produce the new Fe1-xO/Fe interface is much greater than the energy consumption of the new Fe/gas-phase interface, according to the lowest energy theory, when the Fe1-xO/Fe interface increases to a certain extent, the metallic iron will overcome the surface tension and produce protrusions on the surface of metallic iron nuclei. Then the protrusions will develop into iron whiskers, continuously expanding the new interface of Fe/gas-phase and releasing the energy accumulated in the Fe1-xO phase, as shown in Figure 14c. Under the condition of producing layered iron, since the formation rate of the new Fe/gas-phase interface is close to the formation rate of the new Fe1-xO/Fe interface, the surface of the metallic iron nucleus is less prone to produce protrusions or iron whiskers.
The driving force of the chemical reaction is reflected in the accumulation of energy in the Fe1-xO and the metallic iron nucleus. During the growth of iron whiskers, the driving force that promotes the formation of the Fe1-xO/Fe interface will be released at the new Fe/gas-phase interface. At this point, the growth of the new Fe1-xO/Fe interface will be temporarily stagnant. Moreover, the stored energy of the Fe1-xO phase during whisker growth is almost constant. If the energy fluctuation in Fe1-xO is neglected, it can be considered that the driving force for promoting the growth of the iron whisker is equal to the driving force of the chemical reaction. For every 1 mol of metallic iron atoms produced:
Δ G + 2 π r n 0.056 π r 2 ρ E s T = 0
where ΔG is the Gibbs free energy change of the chemical reaction under the corresponding reaction conditions, which is the driving force of the chemical reaction, r is the radius of an iron whisker (m), n is the number of iron whiskers, and ρ is the density of metallic iron (kg/m3), E s T is the surface energy of the iron whiskers per unit surface area (J/m2). The Equation (5) can be converted into:
Δ G θ + R T ln p CO 2 p CO + 2 n 0.056 r ρ E s T = 0
For a certain temperature, the value of E s T is fixed. According to the Equation (6), when the temperature is 973 K, a decrease in the radius of the iron whisker or an increase in the number of iron whiskers may occur as the CO concentration increases. According to the theory of surface tension, for a solid with certain deformation ability, its surface energy can be considered to be equal to the surface tension [33]. Metallic iron has a softening property at high temperature, that is, it can be deformed, so it can be considered that the surface energy of the iron whisker is equal to its surface tension. When the CO concentration is 75%, theoretically, the value of E s T will decrease with the increase of reduction temperature. According to the above experimental results, the iron whisker radius increased as the reduction temperature increased. According to Equation (6), this phenomenon indicates that the number of iron whiskers will rise rapidly as the reduction temperature increases. The value of E s T decreases as the reduction temperature increases, that is, the surface tension of the metallic iron decreases. Then the contact angle δ at the root of the whisker will increase as shown in Figure 14d, which is the cause of an increase in the diameter of the iron whisker. This results in the formation of conical shape at the root of the whisker at higher temperatures.

4.4. External Influence Factors of Iron Whiskers

The generation of iron whiskers is affected by internal factors such as chemical reactions and diffusion as mentioned above and is also externally affected by doping elements and physical isolation. Halim et al. [34] found that the whisker structure disappeared in the reduction of MgO doped wustite compacts. The smaller size of Mg2+ ion relative to Fe2+ ion hindered the lattice expansion and slowed down the diffusion rate of iron ions, so the whisker growth was inhabited. The presence of CaO increased the total porosity and promoted the formation of iron whiskers because it causes lattice distortion due to the larger diameter of Ca2+ (0.99 Å) than Fe2+ (0.75 Å) [35,36]. The presence of SiO2 decreased the total porosity due to the formation of fayalite (Fe2SiO4) and other glassy or crystalline silicate types [34], which stopped the iron nucleation near the surface of ore particles and thereby prevented the formation of iron whiskers.
Gransden et al. [37] studied the coating of metal oxides on the surface of iron ore particles to inhibit the sticking problem, and found that the coating has a physical inhibition effect on the formation of iron whiskers. The coating hindered the diffusion of metallic iron to the surface of the particles, thereby hindering the generation of iron whiskers. Grain boundaries and dislocations provide diffusion channels for iron ion and cation holes, thus the diffusion coefficient of iron atoms to the iron nucleus increases. The high values of iron concentration and chemical energy make these places more prone to the generation of iron whiskers [28]. Defects such as dislocations can be caused by mechanical disruption or phase transitions. In Zhao’s study [38], it was found that the iron whiskers preferentially appeared at cracks in the iron oxide phase.

4.5. The Reduction Process of a Single Iron Ore Particle

According to the phenomena observed in the in-situ observation and water quenching experiments, the reduction process of a single iron ore particle can be summarized. After the reducing gas is in contact with the ore particles, the oxygen atoms are continuously taken away from the surface of the particles. Due to the decrease of the oxygen atom concentration on the surface of the particles, the oxygen atoms inside the particles continuously diffuse to the periphery of the particles, and the iron atoms without oxygen coordinating on the surface diffuse into the interior of the particles. With the continuation of the de-oxidation process, the ore fines gradually change from the Fe2O3 phase to the wustite phase. Due to the volume shrinkage caused by the crystal transformation, uniformly distributed pores begin to appear inside the iron ore particles, as shown in Figure 8, Figure 9 and Figure 10. Then the pore size inside the particle gradually becomes larger, and the entire particle is gradually reduced to the wustite phase. The process described above is very rapid compared to the reduction of wustite to metallic iron, it only takes 3–4 min in this study.
Due to the rapid reduction of the surface of the particles, a very thin layer of metallic iron is firstly formed on the surface of the particles. This layer offers huge diffusion resistance to oxygen atoms from inside the particles in reaching the reaction surface. This causes a decrease in the rate of de-oxygen reaction and causes an increase in the diffusion potential of oxygen atoms near the surface of the particles. As the internal oxygen concentration of the particles decreases, some metallic iron nuclei form around the pores. The production of metallic iron nucleus helps to provide more atom holes for the diffusion of iron atoms on the surface of the particles, thereby producing an autocatalytic effect on the formation reaction of metallic iron [39]. Finally, the oxygen in the entire particle is completely taken away by the reducing gas, the network-connected metallic iron crystals form inside the particle and a metallic iron shell remains in the outer layer of the particle. With the increase of the reduction temperature (973–1173 K), the fluidity of the metallic iron becomes more and more remarkable, so that it is easier to form a metallic iron layer on the surface of the particle, and finally it remains as a “metallic iron shell”. Moreover, as the temperature increases, the atomic diffusion rate inside the iron ore particles increases, thereby shortening the transition time of Fe2O3 to the Fe1-xO phase, and the pore size inside the particles is also enlarged, as shown in Figure 15.

5. Conclusions

Through systematic research on the gas-based reduction process of hematite ore fines and the mechanism of metallic iron production, the following conclusions are drawn:
(1) The “blooming” phenomenon appearing on the surface of the iron ore particles during the reduction process is caused by the formation of layered iron. The average diffusion flux of iron atoms when the layered iron completely covers the surface of the ore particle is about 0.0072 mol/(m2·s).
(2) The formation of layered iron and iron whiskers is determined by the relationship between the rate of de-oxidation reaction and the diffusion rate of cation and electron holes. Iron whiskers are likely to occur when the diffusion of cation and electron holes are faster, and layered iron forms when the chemical reaction rate is faster.
(3) The iron atom diffusion flux at the root of the iron whisker during the pre-growth process is much larger than the flux when the layered iron is produced. As time goes on, the growth rate of iron whiskers decreases rapidly.
(4) The chemical reaction can provide a driving force for the production of metallic iron whiskers. The increase of the surface energy after the appearance of the iron whiskers causes the energy accumulated in the iron nucleus and the Fe1-xO phase to be released. The value of the surface tension (surface energy) of the iron nucleus at high temperatures affects the morphology of the iron whiskers.

Author Contributions

L.G. designed the experiments, analyzed the results and wrote this manuscript. S.Z. and Q.B. helped performing some experiment works. J.G. and Z.G. gave some constructive suggestions on this work and helped desigining the experiments.

Funding

This research was funded by the Natural Science Foundation of China (No.51804030 and No.51604020), the Key Projects of the State Key Research and Development Plan (No. 2016YFB0601304). The authors would also thank the support of the China Scholarship Council.

Conflicts of Interest

The authors declare no conflict of interest.

References

  1. Schenk, J.L. Recent Status of Fluidized Bed Technologies for Producing Iron Input Materials for Steelmaking. Particuology 2011, 9, 14–23. [Google Scholar] [CrossRef]
  2. Yuan, Z.; Sohn, H.Y. Re-Oxidation Kinetics of Flash Reduced Iron Particles in O2-N2 Gas Mixtures Relevant to a Novel Flash Ironmaking Process. ISIJ Int. 2014, 54, 1235–1243. [Google Scholar] [CrossRef]
  3. Xing, L.Y.; Zou, Z.S.; Qu, Y.X.; Lei, S. Gas-Solid Reduction Behavior of In-Flight Fine Hematite Ore Particles by Hydrogen. Steel Res. Int. 2019, 90, 1800311. [Google Scholar] [CrossRef]
  4. Sabat, K.C.; Murphy, A.B. Hydrogen Plasma Processing of Iron Ore. Metall. Mater. Trans. B 2017, 48, 1561–1594. [Google Scholar] [CrossRef]
  5. Davis, M.P.; Dry, R.J.; Schwarz, M.P. The Role of CFD Modeling in Development of the HIsmelt Process. In Proceedings of the ISS Tech Conference, Indianapolis, IN, USA, 27–30 April 2003; pp. 201–214. [Google Scholar]
  6. Sripriya, R.; Peeters, T.; Meijer, K.; Zeilstra, C.; Van der Plas, D. Computational Fluid Dynamics and Combustion Modelling of HIsarna Incinerator. Ironmak. Steelmak. 2016, 43, 192–202. [Google Scholar] [CrossRef]
  7. Chen, F.; Mohassab, Y.; Jiang, T.; Sohn, H.Y. Hydrogen Reduction Kinetics of Hematite Concentrate Particles Relevant to a Novel Flash Ironmaking Process. Metall. Mater. Trans. B 2015, 46, 1133–1145. [Google Scholar] [CrossRef]
  8. Thaler, C.; Tappeiner, T.; Schenk, J.L.; Kepplinger, W.L.; Plaul, J.F.; Schuster, S. Integration of the Blast Furnace Route and the FINEX®-Process for Low CO2 Hot Metal Production. Steel Res. Int. 2012, 83, 181–188. [Google Scholar] [CrossRef]
  9. Hillisch, W.; Zirngast, J. Status of Finmet Plant Operation at BHP DRI. J. Steel Times Int. 2001, 98, 231–237. [Google Scholar] [CrossRef]
  10. Sarkar, R.; Sohn, H.Y. Interactions of Alumina-based and Magnesia-based Refractories with Iron Melts and Slags: A Review. Metall. Mater. Trans. B 2018, 49, 1860–1882. [Google Scholar] [CrossRef]
  11. Guo, L.; Yang, Z.R.; Gao, J.T.; Zhong, Y.W.; Guo, Z.C. Effect of Coating Mg(OH)2 with Heterogeneous Deposition Method on Sticking During Fluidized Bed Reduction of Iron Ore. ISIJ Int. 2016, 56, 736–743. [Google Scholar] [CrossRef]
  12. Zhang, P.G.; Zhang, Y.M.; Sun, Z.M. Spontaneous Growth of Metal Whiskers on Surfaces of Solids: A Review. J. Mater. Sci. Technol. 2015, 31, 675–698. [Google Scholar] [CrossRef]
  13. Brenner, S.S.; Sears, G.W. Mechanism of Whisker Growth—III Nature of Growth Sites. Acta Metall. 1956, 4, 268–270. [Google Scholar] [CrossRef]
  14. Wang, H.T.; Sohn, H.Y. Effects of Reducing Gas on Swelling and Iron Whisker Formation during the Reduction of Iron Oxide Compact. Steel Res. Int. 2012, 83, 903–909. [Google Scholar] [CrossRef]
  15. Iguchi, Y.; Uyeda, Y.; Goto, K.; Hayashi, S. In Situ Observation of Nucleation and Growth of Iron Whiskers from Supersaturated Wustite. Oxid. Met. 1994, 42, 103–108. [Google Scholar] [CrossRef]
  16. Sciti, D.; Pienti, L.; Fabbriche, D.D.; Guicciardi, S.; Silvestroni, L. Combined Effect of SiC Chopped Fibers and SiC Whiskers on the Toughening of ZrB2. Ceram. Int. 2014, 40, 4819–4826. [Google Scholar] [CrossRef]
  17. Mashhadi, M.; Mearaji, F.; Tamizifar, M. The Effects of NH4Cl Addition and Particle size of Al Powder in AlN Whiskers Synthesis by Direct Nitridation. Int. J. Refract. Met. Hard Mater. 2014, 46, 181–187. [Google Scholar] [CrossRef]
  18. Chen, S.H.; Zhang, D.F.; Li, J.Q.; Sun, G. In-situ Formation of MGO Whiskers on the Surface of Magnesium Alloy Powders. Powder Technol. 2014, 253, 677–680. [Google Scholar] [CrossRef]
  19. Yan, P.K.; Ma, Z.X.; Gao, Y.J. Overview of Progress in Magnesium Carbonate Wiskers. China Non-Met. Miner. Ind. 2009, 23, 23–25. [Google Scholar]
  20. Cao, M.L.; Zhang, C.; Lv, H.F.; Xu, L. Characterization of Mechanical Behavior and Mechanism of Calcium Carbonate Whisker-reinforced Cement Mortar. Constr. Build. Mater. 2014, 66, 89–97. [Google Scholar] [CrossRef]
  21. El-Geassy, A.A.; Nasr, M.I.; Hessien, M.M. Effect of Reducing Gas on the Volume Change During Reduction of Iron Oxide Compacts. ISIJ Int. 1996, 36, 640–649. [Google Scholar] [CrossRef]
  22. John, D.S.; Matthew, S.P.; Hayes, P.C. The Breakdown of Dense Iron Layers on Wustite in CO/CO2 and H2/H2O Systems. Metall. Mater. Trans. B 1984, 15, 701–708. [Google Scholar] [CrossRef]
  23. Nicolle, R.; Rist, A. The Mechanism of Whisker Growth in the Reduction of Wustite. Metall. Mater. Trans. B 1979, 10, 429–438. [Google Scholar] [CrossRef]
  24. Kohl, H.K.; Engell, H.J. Uber Die Reduktion Von Wustit Mit Wasserstoff. Archiv für das Eisenhüttenwesen 1963, 34, 411–418. [Google Scholar] [CrossRef]
  25. Toru, Y.; Tomoya, N.; Kazuhiro, N.; Kazuhiro, N. In-Situ Observation of Fe0.94O Reduction at High Temperature with the use Optical Microscopy. Metall. Mater. Trans. B 2007, 38, 185–191. [Google Scholar] [CrossRef]
  26. Guo, L.; Gao, J.T.; Zhong, S.P.; Bao, Q.P.; Guo, Z.C. In Situ Observation of Iron Ore Particle Reduction Above 1373 K by Confocal Microscopy. J. Iron Steel Res. Int. 2019, 26, 32–41. [Google Scholar] [CrossRef]
  27. Bahgat, M.; Sasaki, Y.; Iguchi, M.; Ishii, K. The Effect of Grain Boundaries on the Surface Rearrangement During Wustite Reduction Within its Range of Existence. ISIJ Int. 2005, 45, 657–661. [Google Scholar] [CrossRef]
  28. John, D.S.; Matthew, S.P.; Hayes, P.C. Establishment of Product Morphology during the Initial Stages of Wustite Reduction. Metall. Mater. Trans. B 1984, 15, 709–717. [Google Scholar] [CrossRef]
  29. Bahgat, M.; Sasaki, Y.; Hijino, S.; Iguchi, M.; Ishiiet, K. The Effect of Grain Boundaries on Iron Nucleation During Wustite Reduction Process. ISIJ Int. 2004, 44, 2023–2028. [Google Scholar] [CrossRef]
  30. Wagner, C. Fundamental Consideration of the Reduction of Oxides and Sulfides. In Physical Chemistry of Steelmaking; The MIT Press: Cambridge, MA, USA, 1962; pp. 19–26. [Google Scholar]
  31. Roine, A. HSC 5.1 Chemical Recation and Equilibrium Software with Extensive Thermochemical Database; Outokumpu: Helsinki, Finland, 2002. [Google Scholar]
  32. Sasaki, Y.; Bahgat, M.; Iguchi, M.; Ishii, K. The Preferable Growth Direction of Iron Nuclei on Wustite Surface during Reduction. ISIJ Int. 2005, 45, 1077–1083. [Google Scholar] [CrossRef]
  33. Yun, Z.Z. Surface and Interface Physics; University of Electronic Science and Technology Press: Chengdu, China, 1993; p. 190. [Google Scholar]
  34. Halim, K.; Bahgat, M.; El-Kelesh, H.A.; Masret, M.I. Metallic Iron Whisker Formation and Growth during Iron Oxide Reduction: Basicity effect. Ironmak. Steelmak. 2009, 36, 631–640. [Google Scholar] [CrossRef]
  35. Kasabgy, T.E.; Lu, W.K. The Influence of Calcia and Magnesia in Wustite on the Kinetics of Metallization and Iron Whisker Formation. Metall. Mater. Trans. B 1980, 11, 409–414. [Google Scholar] [CrossRef]
  36. Iguchi, Y.; Goto, K.; Hayashi, S. Surface Segregation of Calcium Oxide in Wustite and its Effects on the Reduction. Metall. Mater. Trans. B 1994, 25, 405–413. [Google Scholar] [CrossRef]
  37. Gransden, J.F.; Sheasbu, J.S. The Sticking of Iron Ore during Reduction by Hydrogen in a Fluidized Bed. Can. Metall. Q. 1974, 13, 649–657. [Google Scholar] [CrossRef]
  38. Zhao, Z.L.; Tang, H.Q.; Guo, Z.C. In Situ Observation and Mechanism Research of the Influence of CaO on the Growth of Iron Whiskers under CO Atmosphere. J. Univ. Sci. Technol. Beijing 2011, 33, 817–822. [Google Scholar] [CrossRef]
  39. Han, F.L. Reduced Iron Powder from Mill Scale. Powder Metall. Technol. 2001, 19, 33–44. [Google Scholar] [CrossRef]
Figure 1. XRD pattern of the Brazilian iron ore particles.
Metals 09 00750 g001
Figure 2. Cross section images and EDS results of the Brazilian iron ore particles: (a) Overview of the sample; (b) hematite particle in big magnification; (c) silica particle in big magnification.
Metals 09 00750 g002
Figure 3. Sketch and real product maps of the high-temperature laser scanning confocal microscope (a): Sketch map, (b): Real product map).
Metals 09 00750 g003
Figure 4. The “blooming” phenomenon during in-situ online observation experiment: 1073 K with 85% CO + 15% CO2.
Metals 09 00750 g004
Figure 5. The EDS result of the particle surface after “blooming” happened.
Metals 09 00750 g005
Figure 6. The growth of iron whiskers during in-situ online observation experiment: 1073 K with 75% CO + 25% CO2.
Metals 09 00750 g006
Figure 7. The relationship between reduction conditions and surface morphology of iron ore particles (W stands for whisker, L stands for layered iron. (a) Reduction time vs. temperature, (b) temperature vs. proportion of CO in reducing gas).
Metals 09 00750 g007
Figure 8. Microscopic observation of the particle surface morphology (left column) and the cross-section morphology (right column) of the iron ore particles after reduction at 973 K in 95% CO + 5% CO2 atmosphere.
Metals 09 00750 g008
Figure 9. Microscopic observation of the particle surface morphology (left column) and the cross-section morphology (right column) of the iron ore particles after reduction at 1073 K in 95% CO + 5% CO2 atmosphere.
Metals 09 00750 g009
Figure 10. Microscopic observation of the particle surface morphology (left column) and the cross-section morphology (right column) of the iron ore particles after reduction at 1173 K in 95% CO + 5% CO2 atmosphere.
Metals 09 00750 g010
Figure 11. The EBSD results in the longitudinal section of iron whiskers.
Metals 09 00750 g011
Figure 12. The average diffusion flux of iron atoms at different time variables.
Metals 09 00750 g012
Figure 13. The relationship between the length of the iron whisker and the growth time.
Metals 09 00750 g013
Figure 14. Schematic diagram of the reduction process of the Fe1-xO phase (a) and the mechanism on the generation of metallic iron (b,c,d).
Metals 09 00750 g014
Figure 15. Schematic diagram of the evolution process of a single particle reduction.
Metals 09 00750 g015
Table 1. Compositions of the Brazilian iron ore particles.
ComponentTFeFe2O3FeOSiO2CaOMgOAl2O3
Content68.08Bal.0.212.260.0460.110.32
Table 2. Conditions of the online quenching experiments.
No.Temperature/KReduction Time/minReducing AtmosphereGas Flow/(ml/min)
1973595% CO + 5% CO2500
21073595% CO + 5% CO2500
31173595% CO + 5% CO2500
49731095% CO + 5%CO2500
510731095% CO + 5% CO2500
611731095% CO + 5% CO2500
79732095% CO + 5% CO2500
810732095% CO + 5% CO2500
911732095% CO + 5% CO2500
109736095% CO + 5% CO2500
1110736095% CO + 5% CO2500
1211736095% CO + 5% CO2500
139738095% CO + 5% CO2500
1410738095% CO + 5% CO2500
1511738095% CO + 5% CO2500