Article

Hot Ductility of TiNb IF Steel Slab after Hot Torsion Testing

1
Institute of Materials and Quality Engineering, Faculty of Materials, Metallurgy and Recycling, Technical University of Košice, Letná 9, 042 00 Košice, Slovakia
2
Faculty of Materials Science and Technology, VŠB–TU Ostrava, 17. listopadu 2172/15, 708 00 Ostrava-Poruba, Czech Republic
3
Institute of Physics, Faculty of Science, Pavol Jozef Šafárik University in Košice, 041 80 Košice, Slovakia
4
Institute of Materials Research, Slovak Academy of Science, 040 01 Košice, Slovakia
5
Material & Metallurgical Research Ltd., 703 00 Ostrava, Czech Republic
*
Authors to whom correspondence should be addressed.
Metals 2019, 9(7), 752; https://doi.org/10.3390/met9070752
Submission received: 4 June 2019 / Revised: 29 June 2019 / Accepted: 1 July 2019 / Published: 4 July 2019

Abstract

:
The aim of the work was to evaluate the hot ductility loss in TiNb stabilized IF steel directly from the continuously-cast slab using hot torsion testing (plastometry) in the temperature range 600–1250 °C according to the basic programme, and also after temperature cycling. A good match of the temperature dependences of number of turns to failure (Nf) and intensity of deformation Se was confirmed. In both cases, the existence of three temperature areas with decrease in plasticity to a minimum was confirmed. The two-stage temperature cycling according to the CT1150 and CT900 programmes mostly resulted in a decrease in plasticity compared to the basic programme. The most significant effect of cycling was related to the CT900 programme below the maximum plasticity in the base programme at 850 °C. A less pronounced decrease was observed for CT1150 cycling below the maximum plasticity in the base program at 1050 °C. In the case of CT1150 cycling, more complex particles were observed at the fractures compared with the basic programme, namely carbonitrides of Ti and Nb in combination with oxisulfides respectively, then Ti nitrides with oxisulfides or oxides and, in addition, complex (Fe,Nb)P4, (Ti,Nb)3S4 type particles. Their mean size determined statistically using TEM was much finer, only 20 nm versus 42 nm in the basic programme. Similarly, CT900 cycling revealed finer particles with an average size of 37 nm compared to 105 nm in the basic programme. The observed particles were Al oxides, Ti(N,C) and (Ti,Nb)2S, in contrast to the particles probably of TiFe and FeMnS in the basic programme. The decrease in plasticity corresponded to the finer particles, newly created in the temperature cycling.

1. Introduction

In actual practice, the production of interstitial-free steel (IF steel) with a low content of free carbon is still in development. This type of steel is widely used in the automotive industry for its special properties, in particular its exceptional deep-drawing capability [1]. The first industrial production of IF steel started 40 years ago, and in the last 20 years the market demand for this steel has grown compared to standard low-carbon steel. Generally, in this IF steel the content of interstitial-forming elements (C and N) is limited in the production technology under the level of 0.003 wt. % through vacuum treatment and alloying with Ti and Nb. Microalloying elements form precipitates of carbides and nitrides and the matrix is then free of interstitial-forming elements [2]. By means of microalloying elements such as Ti and Nb the atoms of carbon and nitrogen are bonded in the interstitial positions in the ferrite grains as TiC or TiN particles, increasing the deep-drawing properties of the IF steel. It is also known that nitrides are more stable than carbides. In their work Ghosh et al. [2] observed the following precipitates in high strength intersticial free steels, commonly known as IFHS steels: TiN, TiS, Ti4C2S2, MnS, CuS, TiC, Fe(Ti+Nb)P/FeTiP, FeTi. Currently TiN can form in liquid as well as in solid state, which means it forms during steel solidification and continuous casting and is very stable. These TiN precipitates are often associated with Al2O3 inclusions, or in many cases sulphide precipitates are present on the TiN particles. In thermodynamic terms, TiC is formed in the ferrite phase stability temperature range (~700–900 °C). FeTiP-type ternary phosphide is observed only in the higher strength types of IF steel (IFHS), and in bath-annealed IFHS steel it has been observed quite frequently, whereas in continuous-annealed IFHS steel it is rarely observed due to the very short annealing time. According to Reference [2] there is competition between TiC and FeTiP formation during batch annealing. FeTiP may become more stable than TiC in dependence on P and Ti content, and thus can degrade the deep drawability.
Hot ductility can be defined as the quantum of deformation the material can absorb at the defined high temperature without damage [3]. Strain at critical temperatures can result in generation of defects, e.g., transverse cracks during continuous casting. These defects can cause damage in the following operations, e.g., defects during billet forging, or pressing of other semi-products which are sensitive to defect formation [4,5,6,7]. The hot ductility loss in steel during cooling after casting can be divided into three main temperature zones [8,9,10,11]: hot ductility loss near to the solidus line (Zone I), loss in the high temperature zone of stable austenite in the temperature range from 1200 to 900 °C (Zone II), and in the embrittlement zone in the temperature range of phase transformation γ → α or α → γ in the range from 900 to 600 °C (Zone III). Zone III can be further divided into the low temperature zone of austenite in the range from 900 °C to Ac3, Ar3 (Zone III A) and the zone of phase transformation γ → α or α → γ (Zone III B).
Ductility loss in Zone II (1200–900 °C) is caused first by precipitation of fine sulphides, oxides and particles based on microalloying elements, and also by segregation of impurities into the austenite grain boundaries [8,11,12,13]. In the lower temperature zone at austenite temperature (over 950 °C), contraction can cause cracks and fractures in low-carbon steel due to the ductile fracture mechanism, or intercrystalline fracture if the As content is higher [14]. In low temperature austenite Zone III A (900 °C–Ac3, Ar3) over the phase transformation the plastic properties are influenced by the process of dynamic recrystallization and static and dynamic precipitation of inclusions and particles based on microalloying elements in the austenite grain boundaries [4,8]. In the zone at temperatures less than 900 °C the loss of ductility is caused by changes in physical properties and is natural [14]. It is the cohesion degradation of austenite grain boundaries caused by precipitation of proeutectoid ferrite in these boundaries [7,10,15,16]. Fractures are ductile intercrystalline with low reduction of area [14]. The ductility loss in Zone III B austenite transformation to ferrite is caused first of all by the formation of a proeutectoid ferrite film in the austenite grain boundaries, by the movement of grain boundaries and intergranular precipitation of particles [8,11,12,13]. Hot ductility loss is influenced besides the chemical composition, macro- and micro-structure and presence of detrimental impurities, also by external factors such as temperature, strain rate, thermal history and cooling rate [8,11,17]. The hot ductility loss in low-alloyed Nb steel is caused by sulphur segregation in grain boundaries and by the presence of Nb(C,N) particles, which increase the strength of the matrix. Ductility loss in the austenite grain boundaries can be prevented by reaction of S and Mn forming MnS and softening the matrix with coarse precipitates Nb(C,N) [18]. In Reference [10], the decrease in hot ductility with the increase in Nb content was shown for HSLA steel. The lowest hot ductility was found in the low temperature austenite zone from 800 to 900 °C and in the phase transformation zone γ → α 700 to 750 °C. The ductility loss in the low temperature austenite zone was caused by Nb(C,N) precipitation in the austenite grain boundaries below the temperature of 1000 °C. Hot ductility loss in the phase transformation zone γ → α was the result of stress concentration in ferrite, as well as the control of hot ductility by the proeutectoid ferrite layer thickness around the austenite grains. Better hot ductility in steel alloyed with Nb can be achieved by decreasing the N content [4,10], or by the addition of small amounts of Ti, to remove N by forming TiN [10]. In steel production the straightening of continuously-cast semis usually takes place in the temperature range from 950 to 750 °C [19]. Hot ductility loss is marked in the zone of stable austenite with the decrease in size and interparticle distance for Nb(C,N) [4,10]. Two mechanisms are known which explain the hot ductility loss: the micro-cracks coalescence mechanism [4,10] and the mechanism of slip in grain boundaries [20]. In the process of continuous casting, the particles Nb(C,N) formed in the matrix induce austenite strengthening, and the precipitates formed in the grain boundaries build a precipitate-less zone along the austenite grain boundaries. In the condition of external stress coming from the technology of continuous casting, this results in the concentration of stress into the softer precipitation-free zone and causes decohesion along the interface of precipitates Nb(C,N) and austenite grain boundaries. Intergranular fracture is formed by coalescence of micro-cracks which form along the austenite grain boundaries [10,15,21]. Formation and appearance of fine precipitates in the austenite grain boundaries in synergy with the slip mechanism leads to increase in embrittlement on the austenite grain boundaries, with the final effect of material integrity loss [20].
High temperature embrittlement is affected, besides basic factors such as temperature, deformation and cooling rate, stress state and steel characteristics, also by temperature history before deformation, i.e., temperature cycling. In C-Mn-Nb-Al steel, with increasing the thermal cyclic amplitude the minimal plasticity visibly deepens [22]. The deterioration in plasticity was confirmed by El-Wazri et al. [23] in NbTi steel using thermal cycling according to a physical casting simulation as compared to a conventional isothermal test. The authors believe that the critical minimum temperature after subcooling (Tmin) leads to ferrite formation at the grain boundaries, which probably enhances the rate of formation of precipitates with Nb, and this causes a decrease in hot ductility. In addition, in the case of repeated phase transformation, the number of precipitates at the grain boundaries is further increased, again decreasing the plasticity.
Many authors have dealt with the issue of high-temperature steel embrittlement. In their research, they found that the decrease in ductility during cooling generally degraded the quality of cast semi-finished products [4,5,6,7,8,11]. For the study of high-temperature steel embrittlement the methods of hot tensile testing [7,11,14,19], torsion testing [8,24,25,26] and later continuous-casting simulations [27] are mostly used. In the tensile tests, the in situ recasting of samples is usually applied before the testing itself to obtain a representative cast structure. This method is used to recreate as much as possible the technological and temperature parameters of continuous casting under laboratory conditions, and then metallographically evaluate the reasons for the decrease in plasticity to a minimum at the observed deformation temperature. Later this “continuous-casting simulator” can simulate the thermomechanical loading cycles corresponding to continuous-casting conditions such as bending and straightening of the strand, and simulate periodic cooling and reheating as well as bulging of the strand shell between rolls [27]. For the elimination of experimental problems in the tensile testing with in situ solidification, the researchers [28] used a solidified slab and the tensile testing was performed with a simulator of casting, but without recasting. They confirmed the plasticity improvement in C-Al-Nb-Ni-Ti steel at a minimum of 800 °C due to reduction in grain size γ due to a double-phase transformation in the temperature history simulating the bending operation.
The hot torsion testing applied in this study is mostly used to accurately determine the deformation characteristics of hot formed metals, but this testing has also been applied to determine the hot plasticity expressed by the number of turns until fracture Nf, even for samples obtained directly from continuously-cast slabs, whose structure is similar to that directly after solidification [25,26]. In torsion testing, the great advantage is the possibility of achieving large deformations under varying temperature and rate conditions, while the torsion can be performed continuously up to the limit state of formability (up to break), or intermittently [29,30]. Another advantage is the possibility of using deformation rates over a wide range from 10−3 to 101 s−1 [29]. In an earlier work [31], the temperature interval of minimum plasticity occurrence in the austenitic region and in the field of phase transformation of NbVTi microalloyed steel after tensile testing and in hot torsion testing was compared with samples obtained directly from the slab. It was shown that the temperature intervals of minimum plasticity were almost the same in both tests. Comparison of both testing results revealed a sensitive detection of embrittlement at high temperatures. In addition, the plasticity of material can be evaluated through a parameter such as the deformation intensity in the plastometric test.
The results of several mentioned works suggest that precipitation of particles is one of the reasons for hot ductility loss in microalloyed steels. Hot ductility can be negatively influenced also by external factors, such as thermal cycling, which can occur during straightening or unbending operations in continuous casting (the unbending temperature falls in the temperature interval 700–1100 °C [23]).
Nowadays less attention is paid to hot ductility loss analyses of IF steel stabilized with microalloying in thermal cycling conditions. The aim of this work was consequently to determine the hot ductility loss and then evaluate the reasons for embrittlement in TiNb IF steel at the observed critical deformation temperatures directly from the continuously-cast slab using hot torsion testing in the temperature range 600–1250 °C according to the basic programme, and also after thermal cycling in the austenite temperature zone as well as in the near temperature range of the phase transformation γ → α.

2. Materials and Methods

We analysed the slab pulled by standard pulling rate 1.02 m/min from TiNb IF steel. Chemical composition of analysed slab is shown in Table 1. The width of slab was 1220 mm. Steel phase transformation temperatures as determined by dilatometry from columnar area of the slab were the following: Ac1 = 939 °C, Ac3 = 978 °C, Ar1 = 880 °C, Ar3 = 925 °C [32].
Test rods machined to working diameter 6 mm and working length 50 mm were used for hot ductility torsion tests. They were cut out along the slab width on the small radius “r” side in the pulling direction. The samples for the basic programme (BP) were taken from the left marginal cut-out V (samples V1, V3 to V6, V8 to V10) and from the centre cut-out labelled X or Y (samples X2 to X7 and Y9), while for the thermal cycling programme (CT) the samples were taken from the centre cut-out labelled Y (samples Y1 to Y8) and from the right marginal cut-out Z (samples Z1 to Z9). They were taken from the zone of columnar dendrites in such a way that axes of test rods were 34 mm deep under the slab surface. High temperature torsion testing device SETARAM was used for testing in the MATERIAL & METALLURGICAL RESEARCH Ltd. in Ostrava—Vítkovice in temperature range 600–1250 °C. The strain rate applied for all tests was from 4 to 8 × 10⁻³ s−1. This strain rate corresponded roughly with the strain rates applied during straightening operations in the process of continuous casting. Hot ductility, by this device, is characterized as the number of turns (revolutions) to failure (Nf). In addition, the intensity of Se deformation was determined, namely the boundary limit of deformation intensity of the Sef (or the intensity of steady flow deformation) and the deformation intensity in Sep peak in terms of works [29,30,33]. Standard test conditions were as follows: solution annealing at 1375 °C for 0.75 min, hold on deformation temperature for 1 min, cooling from the solution annealing temperature to the test temperature with cooling rate 4 °C/s, and testing strain rate from 4 to 8 × 10⁻³ s−1. Heating, cooling and testing was done generally in argon atmosphere, outside the quenched samples. Quenching in water of selected samples was done to determine particles precipitation at deformation temperature. The initial conditions of the hot torsion testing with cycling of temperatures were identical with basic programme conditions and cycling itself was performed in the stable austenite temperature zone (CT1150) under the conditions given in Table 2 and also by cycling near the temperature range of the phase transformation γ → α (CT900) as in Table 3.
Selected fractured surfaces were analysed and the fracture morphology defined with the use of scanning electron microscope (SEM) JEOL 7000F (JEOL Ltd., Tokyo, Japan) with Energy-dispersive X-ray (EDX) analyzer. Transmission electron microscope (TEM) JEOL 2100F UHR (JEOL Ltd., Tokyo, Japan) was used to analyse the particles with the employment of carbon replicas extracted from the surface of metallographic sample obtained from longitudinal cut of test rod, fractured by hot test in torsion. The extraction was localized 5 mm deep in the plane under the fracture line. The samples were processed by a common metallographic method. The replicas were electrolyte separated in 5% Nital. EDX analysis with Silicon drift detector (SDD) X-max 80 (Oxford Instruments, Tubney Woods, UK) was used to identify particles along with electron diffraction of extraction replicas. Furthermore, statistic evaluation of particles from TEM images was used in research as in Reference [34]. Linear size of particles 2r was assessed.

3. Results and Discussion

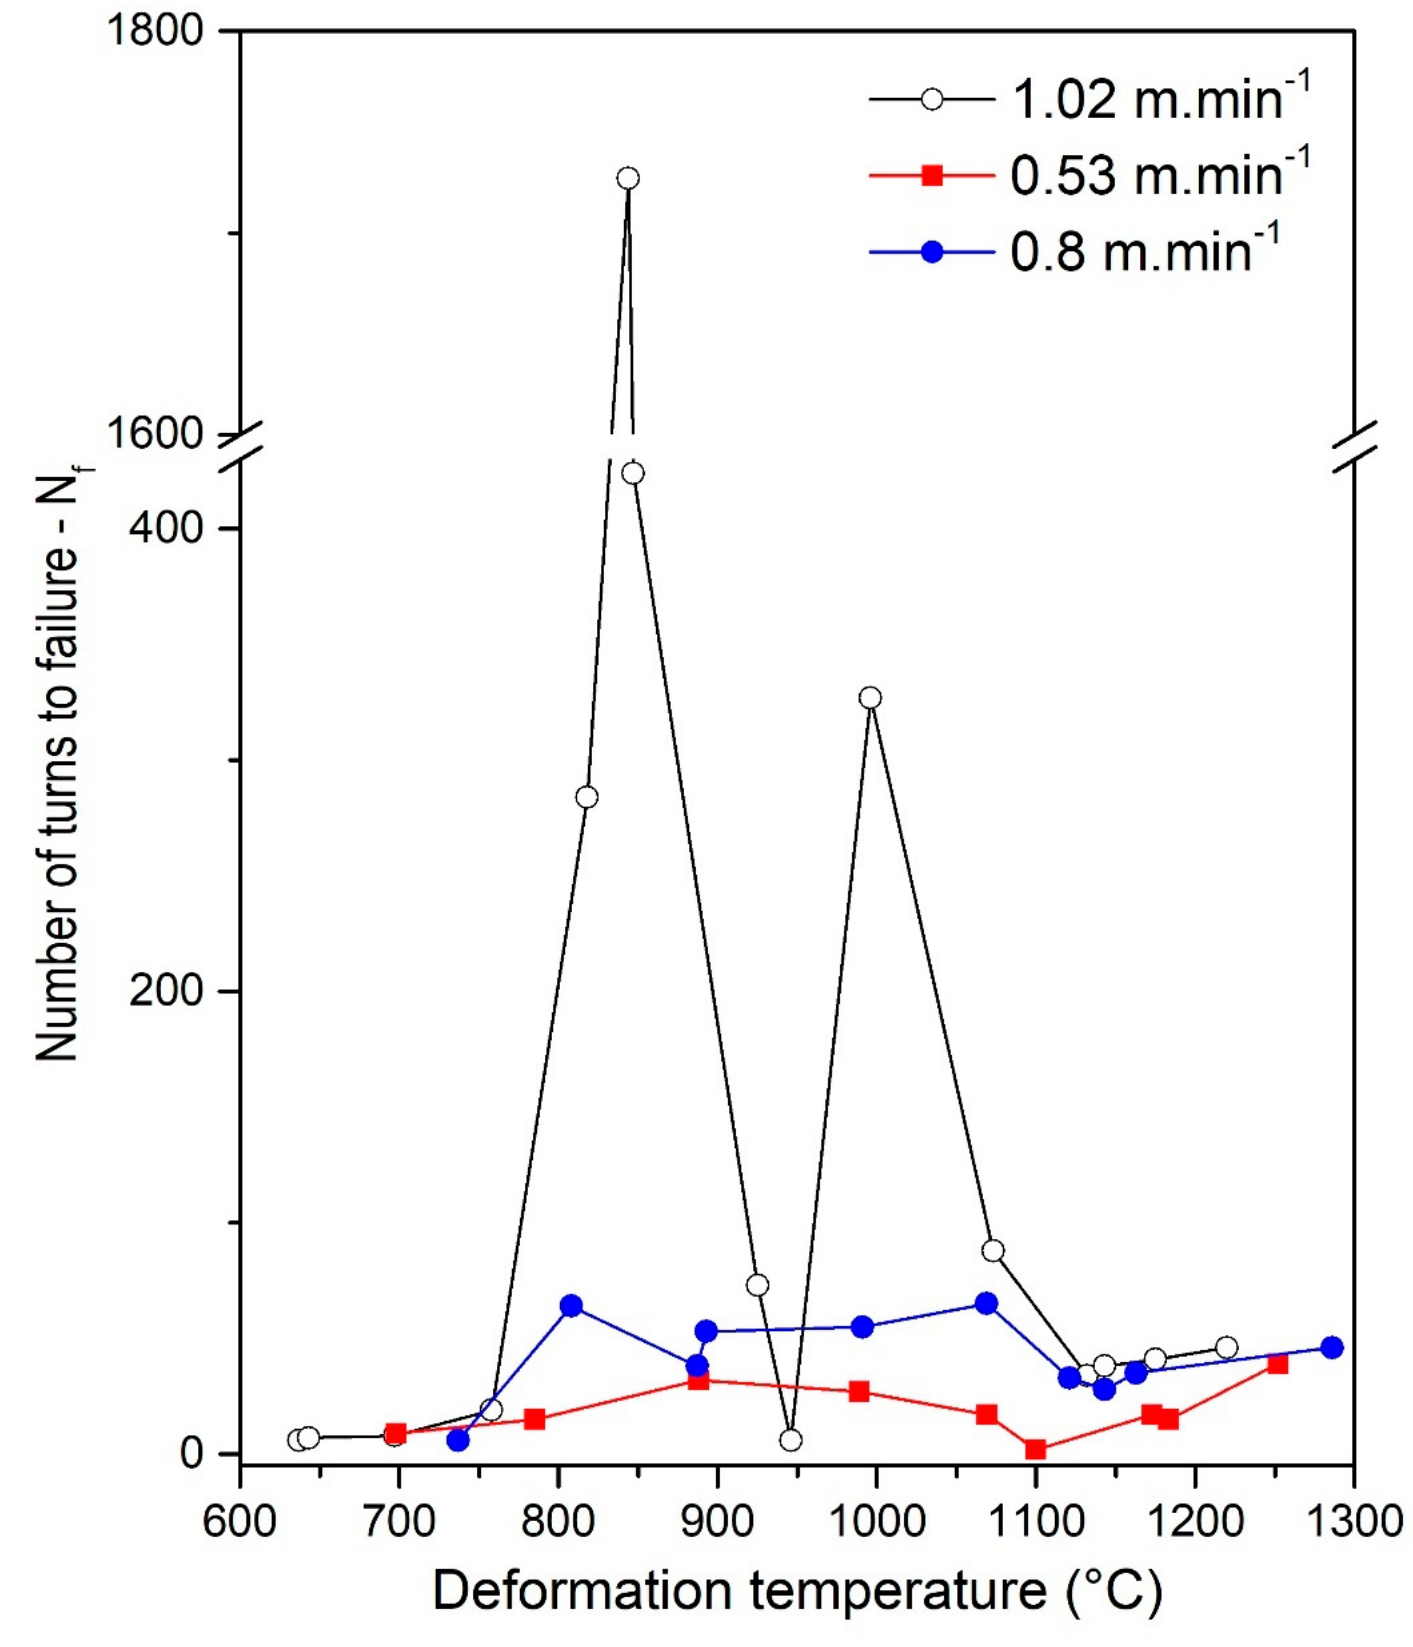
3.1. Hot Ductility According to the Basic Programme

Results of the hot torsion testing according to the basic programme (BP) for continuously cast TiNb IF steel slab obtained in the temperature range from 600–1250 °C are listed in Table 4. The ability of analysed steel to be plastically deformed at high temperatures was evaluated by the number of turns to failure (Nf) and the deformation intensity of Se. Some test rods had fractured during torsion tests, but due to contact and high temperature they meld back, usually in one point of the fracture perimeter. These rods were then fractured by tensile loading at ambient temperature, and they are labelled in the list in Table 4 by an asterisk *. In testing of test rods V5, V6, X5, V9, where there was the assumption of results with high numbers of turns to failure and long testing for their high ductility, the testing was stopped before actual fracture. The rods were then fractured by tensile loading at ambient temperature 20 °C. These samples are in Table 4 marked with ^*. Only one sample rod X2 was fractured in the test device in the Ar atmosphere, without meld and without quench. Some rods (Y9, X7, X4) after the test and final fracture in torsion were quenched into water and are marked with ~. For the sake of the water quench these samples were tested without Ar atmosphere.
Dependence of number of turns to failure (Nf) on the test temperature after hot torsion testing according to the basic programme (BP) is shown in Figure 1a. The existence of three zones with hot ductility loss was confirmed. Plastometric torsion tests showed that in the austenite temperature range the plasticity was reduced over a wide temperature range of approx. 100 °C with minimum turns Nf = 38 at 1143 °C and in the quenched state at temperature 1132 °C with number of turns to failure 33.7. Hot ductility loss was recorded in ferrite zone at low temperatures in the wide range from 758 to 637 °C. The smallest number of turns to failure 5.5 was recorded at test temperature 637 °C and in the quenched state at a temperature 643 °C with number of turns to failure 7.3. Low plasticity with minimum value of turns to failure 72.8 was detected near phase transformation γ → α at temperature 925 °C and also in quenching state with even smaller number of turns only 6.2 at 946 °C. Maximum hot ductility was recorded in the dependence of Nf on test temperature in ferrite zone with temperature range from 818 °C to 847 °C and also in the stable austenite zone at 996 °C.
These results of torsion testing in the conditions of reaustenitisation at 1375 °C are very similar to the temperature dependence of area reduction according to Papillon et al. [27] at a temperature range of 600–1250 °C during a hot tensile test on in situ solidified samples and directly cooled to the test temperature for similar TiNb IF steel (0.033% Ti, 0.03% Nb, Mn/S = 30). The loss in ductility in the austenite zone according to this work is between 1250–880 °C, then below 880 °C good ductility is shown until reaching 780 °C, after which it dropped to a minimum at 680 °C. In the torsion testing with a greater number of testing temperatures, the austenitic area additionally showed a slight plasticity peak at 996 °C. The marked maximum plasticity was then at 844 °C, roughly copying the course of dependence in the tensile testing with a subsequent drop to a minimum of 637 °C.

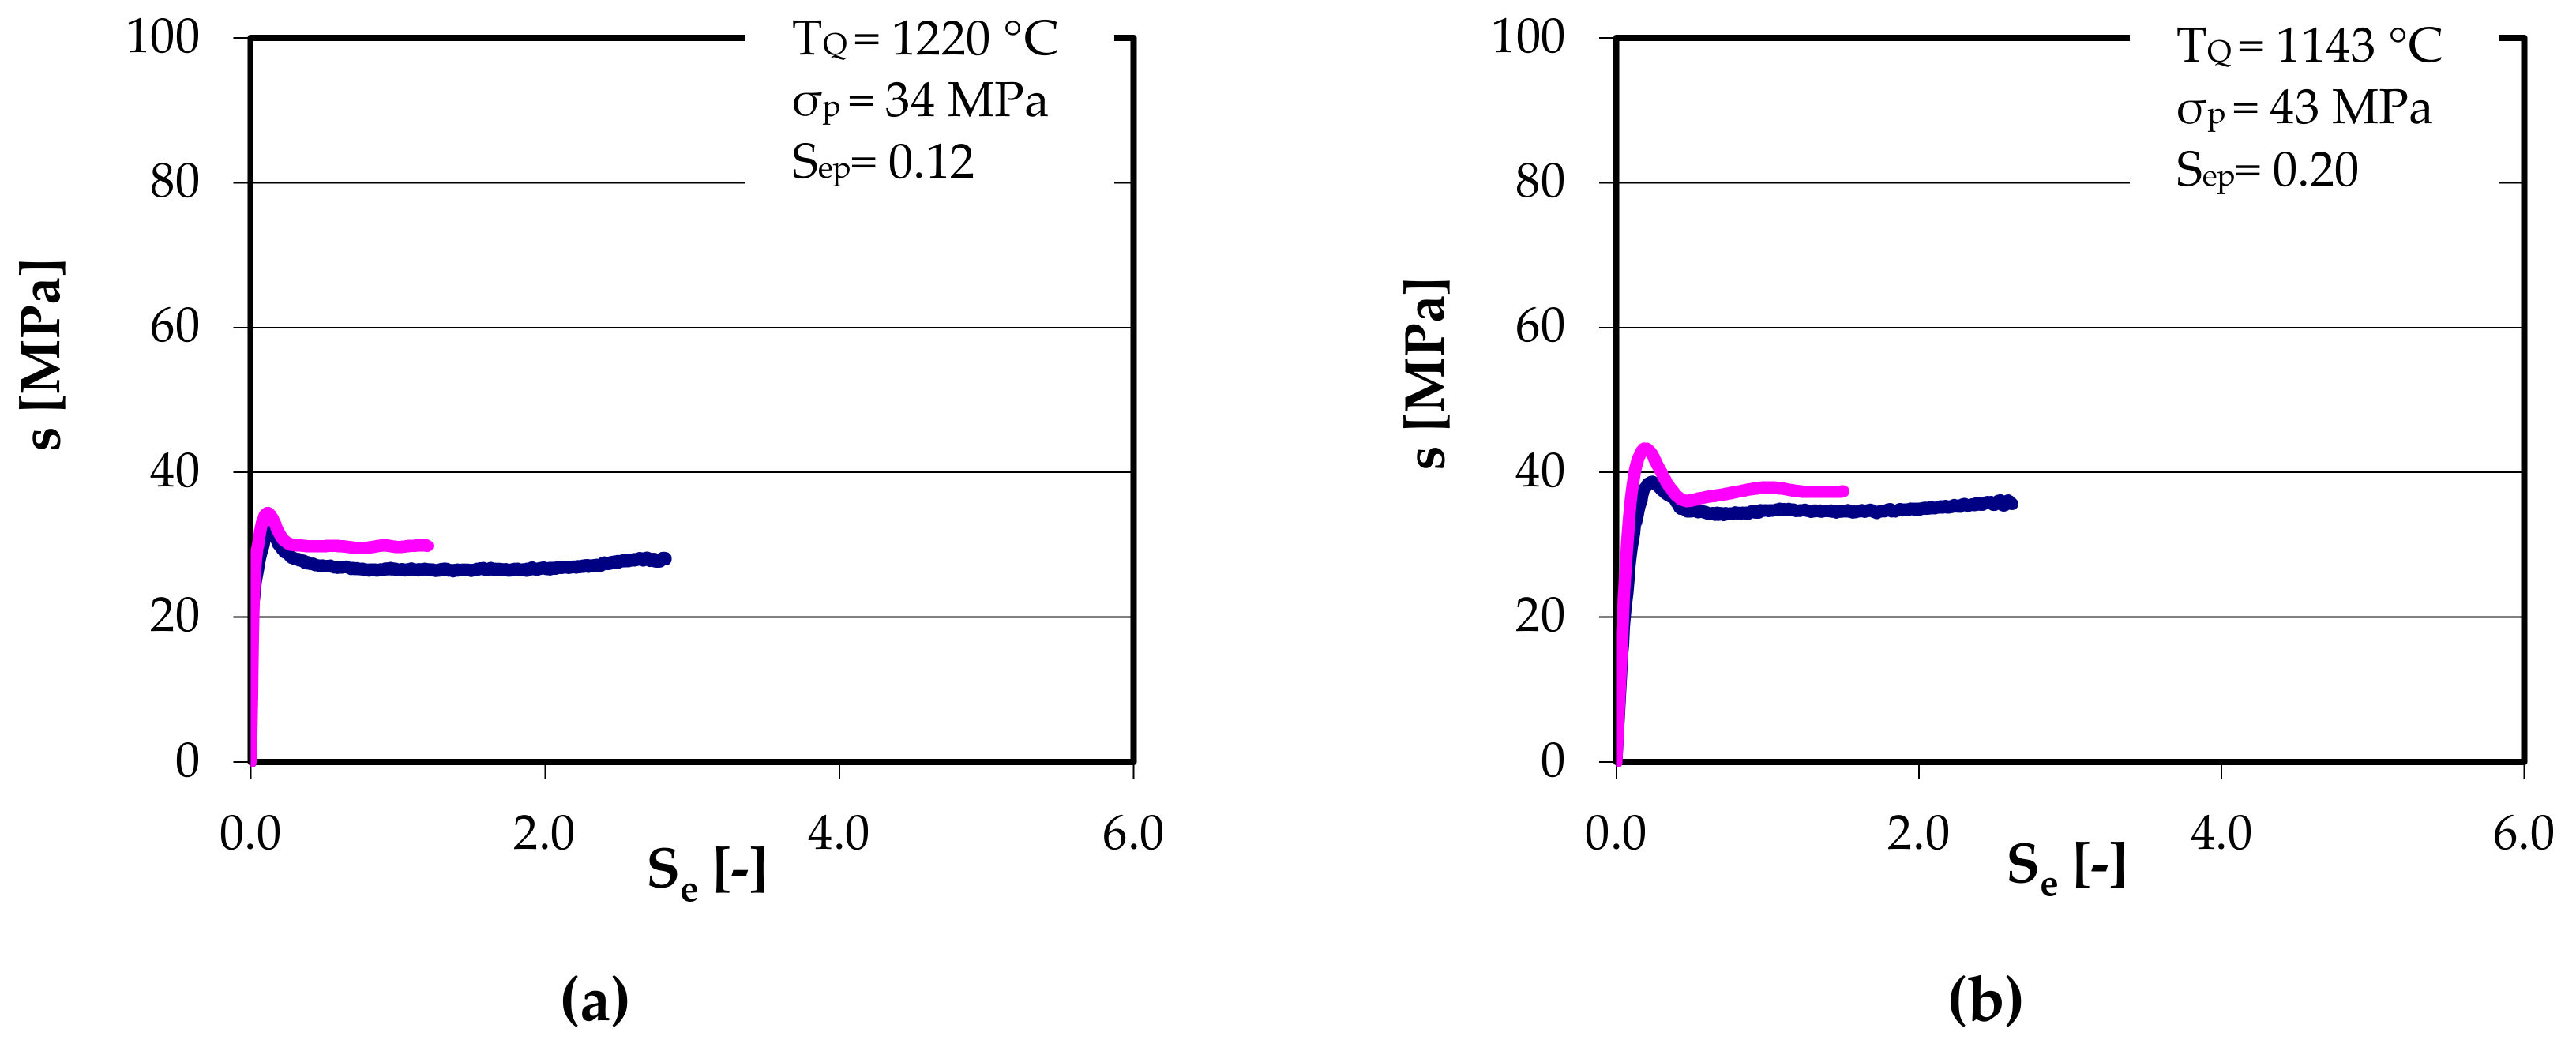
3.2. Deformation Intensity Se

Figure 1b illustrates the dependence of deformation intensity on deformation temperature. It showed that the dependence of deformation intensity Se on deformation temperature partially follows the dependence of the number of turns to failure Nf likewise on the temperature outside quenched samples (Y9, X7, X4). That is, in the temperature regions with a minimum number of Nf turns, minimum deformation intensity was also recorded, which confirms that at those temperatures the ability of the steel to become plastically deformed is critically reduced. The curve for stress and temperature dependence of IF steel in the temperature range 1250–600 °C confirms that the deformation resistance of material increases with decreasing temperature (Figure 1c) with the exception of temperature range 950–850 °C, where its slight decrease was recorded, apparently due to phase transformation γ/α.
The dependence of stress on deformation intensity at selected high temperatures Se, where plasticity was high or minimum, is documented in Figure 2a–f. The appearance of curves at high temperatures of 1220 and 1143 °C (Figure 2a,b) is very similar, i.e., after reaching peak voltage (peak voltage σp) where the intensity of deformation at peak Sep is present, a slight voltage drop occurs then and its stabilization at σess value in terms of works [29,30,33]. At 996 °C, the appearance of the curve (Figure 2c) starts to slightly differ from the previous two ones. Nevertheless, according to the appearance of curves at temperatures of 1220, 1143 and 996 °C, it can be assumed that at these high temperatures the recovery and subsequent dynamic recrystallization occurred in the region of stable austenite, regardless of whether the plasticity was high with a high number of revolutions until fracture Nf (sample X3, sample V9), or reached the minimum (sample X9). In addition, at the temperature of 996 °C (Figure 2c), a slight increase in stress occurs after a short stress stabilization on σess which may indicate the precipitation processes associated with hardening. Deformation intensity Se and stress σ in case of samples X3, X9, V9 slightly rises with a decrease in deformation temperature. With another drop of temperature to 925–818 °C, the appearance of curves in Figure 2d,e is characterized by very low values of intensity of the deformation on the peak, i.e., after reaching maximum stress of 0.08, or 0.05. Subsequently, the deformation intensity increases and the stress drops until it stabilizes. The recovery and subsequent dynamic recrystallization are still ongoing in the range of given temperatures. At the lowest deformation temperature, i.e., 637 °C the appearance of the curve indicates only material recovery (Figure 2f), i.e., after reaching the stress peak, it is then maintained at an approximate value without a stress drop. From the course of all the curves it further follows that with decreasing the test temperature, the stress necessary for torsion deformation is gradually increased, for example peak stress σp from 34 MPa at 1220 °C to 324 MPa at 637 °C.

3.3. Effect of Thermal Cycling on Hot Ductility

The results of plastometric hot torsion testing according to one degree (1°) and two-degree (2°) programme of cycling temperature conditions are shown in Table 5. Comparison of the test results of the basic programme and the 2° programme of temperature cycling CT900 and CT1150 is shown in the graph of the temperature dependence of the number of turns until fracture in Figure 3. The two-step cycling of temperatures in IF steel tends to decrease plasticity compared to the basic programme (BP) conditions, except for the deformation at the temperatures of 950 °C (CT1150, sample Y7) and 750 °C (CT900, sample Z4), as documented in Figure 3. The most significant effect of two-stage cycling (CT900) on the plasticity drop was recorded below the maximum plasticity in BP in the area near the phase transformation from the number of turns of 1726.9 at 850 °C in the BP (sample V6) to only 195 turns at 850 °C (Z6), and also below the maximum plasticity in BP in the austenite area from 326.8 turns at 1050 °C (V9) to only 95.4 turns at 1050 °C (Y4), Figure 3. The impact of one-degree cycling to number of turns at selected temperatures was not remarkable compared with two-degree cycling.

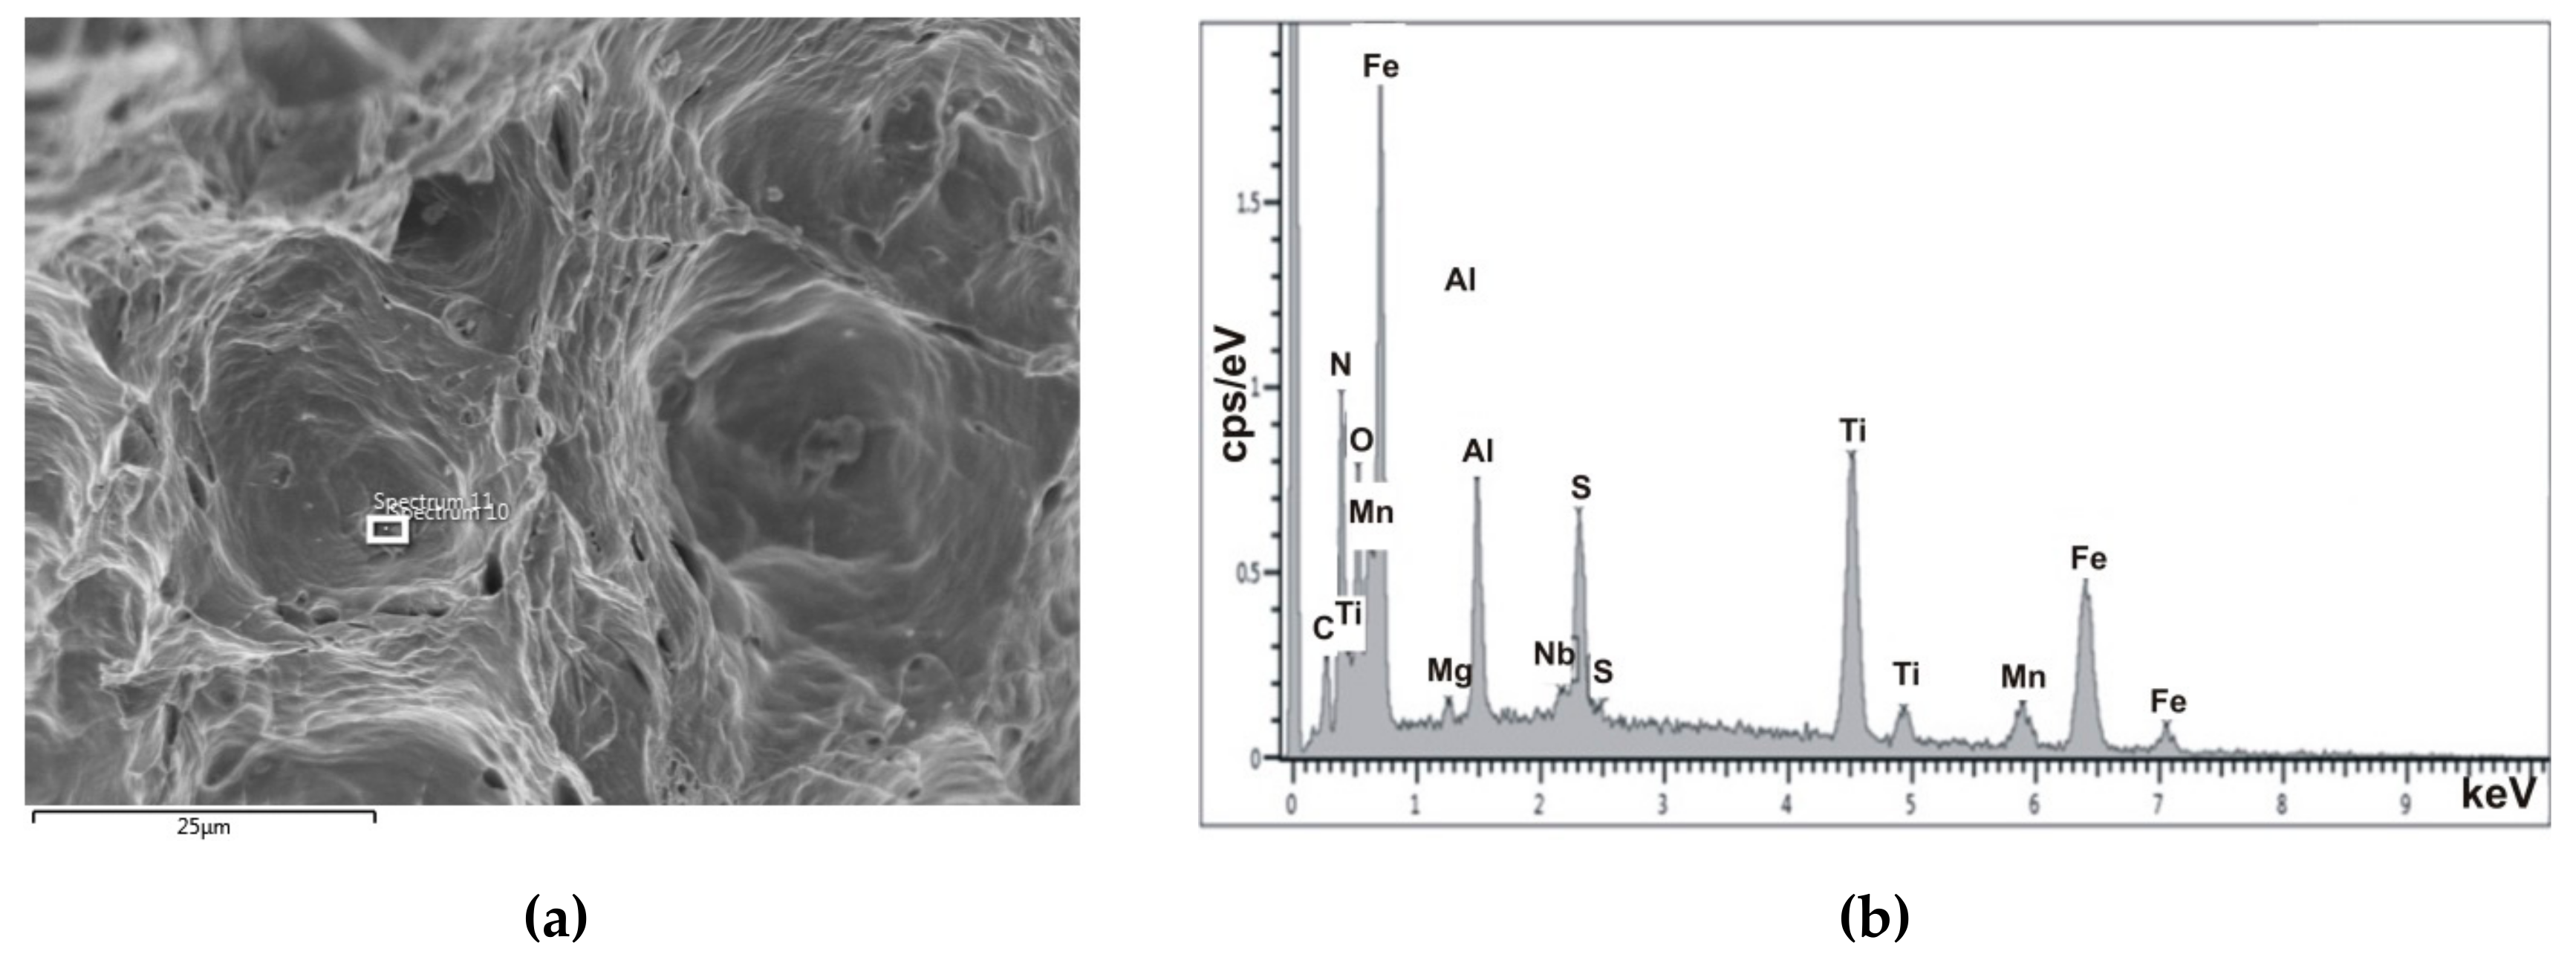
3.4. Hot Ductility Behaviour and Mechanism of Embrittlement for Hot Torsion Testing According to the Basic Programme

The fracture surfaces obtained from plastometric torsion testing, with respect to its specific conditions, usually have three morphologically different areas from the macroscopic and the SEM points of view: the area affected by torsion, the area of fracture completed during tensile testing at ambient temperature (additional fracture), and the interface between the two areas. Fracture surfaces of selected samples were evaluated by SEM from the temperature area of minimum plasticity. The morphology of these fractures in all samples is constituted by dimples of transcrystalline ductile fracture (DTDF), with differences such as shape and depth of dimples which are connected with particular deformation temperature and location in the fracture (i.e. whether it is the area of torsion and the like, etc.). Rarely, melting occurs.
On the fracture of sample X4 from austenitic area with a minimum of turns to failure (Nf = 33.7) at 1132 °C with subsequent quenching, the occurrence of square-shaped particles was found on the surface of oxidized fracture (Figure 4a), and EDX analysis proved them to be particles with Ti, O, N with smaller content of Fe, Nb, Al (Figure 4b). On the fracture surface of sample X2 moreover, in the temperature zone of stable austenite (1175 °C) with low content of Nf = 41 turns, but without quenching, local melting was also confirmed (Figure 5). EDX analysis confirmed the presence of Al, Ti, Mn, O. The decrease in ductility in the stable austenite temperature zone can be attributed mainly to precipitation of fine complex oxides with particles based on microalloys, probably (Ti,Nb)N. Moreover, the segregation of impurities to the austenite grain boundaries cannot be excluded, as found in References [7,11,19]. Moreover, melting was confirmed (Figure 5). TEM analysis and statistical evaluation of particle size in the quenched sample X4 previously confirmed the average size of 42 nm [35], however the greatest proportion of particles was in the range of 30–39 nm.
Low ductility in the temperature zone of ferrite occurred in a wide temperature interval 600–700 °C. Minimum ductility was recorded at the number of turns 5.5 (sample V1). SEM analysis showed the presence of irregular-shaped particles at the bottom of dimples stretched in the shear direction on the basis of Ti, Fe, N with small content of Nb, Mn and S (Figure 6a,b). These are probably particles of MnS, TiN and/or (Ti,Nb)xSy. The average particle size obtained from the TEM analysis was 41 nm, with the largest proportion (29%) of 20–29 nm particles but also with a relatively high proportion (26%) of particles of 10–19 nm [35]. Decreased ductility in the ferrite temperature zone, as also described in Reference [25], was enhanced with higher density of precipitated soft particles on the basis of Ti, Nb with high density of dislocation mesh [25,26]. Precipitation of AlN particles cannot be excluded either, namely in combination with sulphur in the form of sulphonitrides on the grain boundaries.
Embrittlement was also recorded close to the temperature zone of γ/α phase transformation with ductility minimum at 946 °C and number of turns to fracture 6.2 (sample X7). SEM analysis revealed the occurrence of angular and oval particles at the bottom of deeper dimples on the basis of Fe, Mn, O with lower content of S, C, Ti, i.e., probably particles of complex oxisulphides, or MnS as well as TiC and/or TixSy. (Figure 7a,b). In this sample the observed average linear size of particles was 41 nm with the majority of them sized 20 to 29 nm [35]. The reason for embrittlement in this narrow temperature interval near the γ/α phase transformation can be seen in the above-mentioned fine particles, as well as in the formation of ferrite mesh film on the boundaries of original γ grains. The shift of boundaries and intercrystalline precipitation of particles cannot be excluded either, as in Reference [15].
In the maximum plasticity area much larger average size of particles was confirmed, reaching 105 nm [35]. SEM analysis revealed in the temperature region near to maximum plasticity (sample X5) very deep dimples of cratered features and fine dimples on the periphery, Figure 8a. EDX analysis confirmed the presence of Fe, Ti, Mn at the bottom of deep dimples (Figure 8b), probably precipitates of FeTi, as in Reference [2] and the presence of Fe, Mn, S, probably FeMnS at the bottom of fine dimples.
Our results show that the average size of particles in all three temperature zones of embrittlement in the basic programme was similar, i.e., 42, 41 and 41 nm, respectively. From the point of view of the greatest number of particles present, the tendency for occurrence of larger particles 30–39 nm was confirmed in the embrittlement in the austenite temperature zone, compared with smaller particles in the interval 20–29 nm or 10–19 nm in the ferrite temperature zone. The presence of thicker particles in the sample with minimum ductility in the austenite temperature zone explains the better ductility expressed as 33.7–45.6 turns to fracture in contrast with embrittlement in the ferrite temperature zone with 5.5–8.4 turns to fracture (Table 4).

3.5. Influence of Thermal Cycling on Hot Ductility Behaviour and Embrittlement Mechanism

In a programme of 2° of temperature cycling in austenite temperature range (CT1150) the plasticity decreased significantly at 1050 °C to the number of revolutions 95.4 (sample Y4) compared to maximum plasticity in austenite with 326.8 turns (sample V9) in basic programme (Figure 3). During temperature cycling, large dimples (DTDF) were shallower and wider with more pronounced wrinkling of the walls. They were lined with very fine aligned dimples (Figure 9a). On the bottom of these large dimples, more complex particles than BP were identified, such as carbonitrides Ti and Nb in combination with oxisulphides (Figure 9a,b) or respectively Ti nitrides with oxisulfides, otherwise oxides. These particles apparently caused the sample to brittle after cycling compared to the basic programme, where only Ti-based particles and complex sulphides were found. Moreover, in TEM analysis, a diffraction pattern was obtained from P, Fe, Nb, Ti, O, Cu based spherical particle (Figure 10a), which confirmed it is complex particle (Fe,Nb)P4 (Figure 10b). Diffraction pattern of another complex particle based on S, Cu, Ti, O, Nb, Fe referred to complex (Ti,Nb)3S4 particle (Figure 11a,b). For the statistical evaluation of particles size, a total of 160 particles were evaluated in sample Y4. Their size was in the range of 2–106 nm (Figure 12a). Particles were mostly fine with a rare occurrence of large particles. Most particles were in the range of 0–9 nm, with their occurrence of up to 45%. A high proportion of 23% were particles in the range of 10–19 nm. The average particle size in the sample was 20 nm. This is much smaller than the particle size of 42 nm in the basic programme, which also seems to promote deterioration of plasticity in terms of work [11].
The two-stage cycling of temperatures according to CT900-2° brought a very significant decrease of plasticity compared to basic programme with Nf = 1726 (sample V6) decreasing to only Nf = 195.5 after cycling (sample Z6), Figure 3. This was manifested by the presence of shallow large dimples of transcrystalline ductile fracture (DTDF) and they were lined with very fine dimples. At the bottom of large dimples, the presence of Al oxides was confirmed (Figure 13a,b). By TEM analysis, particles of mostly spherical shape and uneven distribution were observed. There are also clusters of spheroidal particles based on Fe, O or O, Cu. From a spherical Ti, S, Nb based particle (Figure 14, particle a), a diffraction pattern was obtained (Figure 15a). This is a (Ti,Nb)2S particle. From particle (Figure 14, particle b) based on N, Ti, C, a diffraction pattern was obtained (Figure 15b). This is a Ti(N,C) particle. Only the Ti-based particles were identified in the BP, and FeMnS particles were confirmed in the mesh formed from the fine dimples.
In terms of particle size measurement, a total of 244 particles were evaluated in this sample Z6. Their size was in the range of 2–148 nm, Figure 12b. Most particles were in the range of 0–9 nm, with a share of 31.7 %. A high proportion of up to 26 % is also represented by particles in the range of 10–19 nm. The particles were mostly fine with few exceptions from 150 to 212 nm. The average particle size in the sample was 37 nm. Even smaller average size of 18 nm was detected on Z9 sample with smaller number of turns of 89.7 after the same temperature cycling, but after the sample was quenched. In Figure 12c, the particle size and relative velocity dependence for the quenched Z9 sample is shown. A total of 528 particles were measured in the sample. Their size was in the range of 2–81 nm. Most particles were in the range of 0–9 nm, their share being 51.4 %. The particles were mostly fine with a rare particle size range of 90 to 217 nm. The average particle size in the sample was 18 nm. This means that, even at this stage (sample Z6) after cycling in a region close to the γ/α phase transformation, a much smaller average particle size of 37 nm was found (Figure 12b), and even 18 nm after quenching–sample Z9 (Figure 12c) versus sample (V6) from the basic programme with an average size of 105 nm.
These results suggest that the particle size significantly influences plasticity even after cycling of temperatures. The presence of smaller particles responsible for the deterioration in plasticity compared to the basic programme can be attributed to the nucleation of new precipitates in subcooling during repeated phase transformation according to both programmes (Table 2 and Table 3). These results confirm the authors’ assumption [23] that sudden subcooling from the maximum temperature at phase transformation γ/α supports nucleation of new precipitates at the γ/α interface due to low interstitial solubility in ferrite compared to austenite. Sample Z9 (Table 3), which was quenched directly from the test temperature after plastometric testing, also revealed the formation of new particles. The average size of the precipitates was only 18 nm, with up to 51% occurrence of even smaller particles of ≤ 9 nm (Figure 12c). This means that in this test, the particles formed during repeated phase transformation directly at 850 °C were fixed. Sample Z6 represents the state without quenching (Table 3), i.e., after testing the sample was cooled slowly without quenching. As a result, the average particle size was greater, as precipitation allowed for growth over a longer time and thus further nucleation of the particles (Figure 12b).

3.6. Another Influence on Hot Ductility Behaviour

In earlier works, the results of hot torsion testing were analysed for similar TiNb IF steel but cast at non-standard slower pulling rates of 0.8 m/min [26] and even at 0.5 m/min [36]. Temperature dependencies of the number of turns to fracture (Nf) are shown in Figure 16 for all three casting (slab pulling) rates. The existence of all three temperature zones with a decrease in plasticity to the minimum was confirmed for both higher slab pulling rates. In the case of the slab cast at the slowest rate, there was the greatest lack of plasticity in the area of phase transformation γ/α, the absence of which may be associated with the lower number of test temperatures. Comparison of the dependence of number of turns Nf on the test temperature showed a marked increase in plasticity with the increase in slab pulling rate, apart from the critical temperature regions with a minimum of plasticity. Here the differences in the number of turns Nf were small to negligible. At the standard pulling rate of 1.02 m/min, the values of the number of turns in the samples were significantly higher, disregarding of course the critical temperature regions. It can be assumed that this was related to the coarse casting structure and subsequently to the reaustenitisation with the coarser original austenitic grain and the coarser secondary structure [37]. It could also be the result of the presence of larger particles [38], whose occurrence is welcome from the point of view of ductility improvement [4,18]. The effect of the slightly lower concentration of Nb (0.038 wt. %) in this slab compared with the slower pulling slab (0.044 wt. % Nb) cannot be excluded either, as in Reference [10].

4. Conclusions

Based on the results of hot plastometry torsion testing of samples taken from a TiNb IF steel slab continuously cast at the standard pulling rate 1.02 m/min according to the basic programme (BP) and also after temperature cycling, the following conclusions can be asserted:
1. The results of plastometric torsion testing in the temperature range of 600–1250 °C according to the basic programme showed good correspondence of the temperature dependence of the number of turns to failure Nf and the deformation intensity of Se on the temperature of deformation. In both cases, the existence of three temperature zones with a decrease in plasticity to minimum was confirmed, in the field of stable austenite, in the area of phase transformation of austenite into ferrite, and in the ferrite area.
2. SEM analysis confirmed that the fracture surface of samples from regions with minimal plasticity is created by dimples of transcrystalline ductile fractures (DTDF), but with differences in the shape and depth of the dimples which are associated with a particular deformation temperature and location within the fracture. There was a rare occurrence of melting.
3. At minimum plasticity in the austenite temperature zone, the presence of fine complex oxides with particles based on Nb, Ti microelements, probably (Ti,Nb)N. in combination with melting was confirmed on the fracture surface using EDX analysis. In the temperature zone of phase transformation of austenite into ferrite, the presence of angular and oval particles based on Fe, Mn, O, S, C, Ti was confirmed on the fracture surface, probably particles complex oxisulphides, or of MnS, as well as TiC and/or TixSy. In addition to these particles, the formation of a film of ferrite mesh at the boundaries of the original γ grains is evidently involved in the embrittlement. In the temperature range of ferrite, the area of the plasticity minimum is wide, in the temperature range of 150 °C with a minimum temperature of 637 °C. Complex particles of irregular shape based on Ti, Fe, N, Nb, Mn, S, i. e. probably particles of MnS, TiN and/or (Ti,Nb)xSy, can be considered to be the reason for embrittlement.
4. The two-degree cycling of temperatures according to CT1150 and CT900 results mostly in decreased plasticity compared to the basic programme. The most significant effect of cycling was evident for the CT900 programme below the maximum plasticity at 850 °C in the basic programme, when the number of turns decreased from 1726.9 to 195 turns. A similar decrease, but less pronounced, was observed in CT1150 cycling below the maximum plasticity in the basic programme at 1050 °C, where the number of turns decreased from 326.8 to only 95.4.
5. Significant worsening of plasticity following the application of two-degree cycling over the maximum plasticity in the BP resulted in a change in the fracture morphology so that the dimples of transcrystalline ductile fracture (DTDF) were smoother and wider with more distinct wrinkling of the walls of the dimples, which further encircled the network formed from very fine dimples. In the case of CT1150 cycling, more complex particles compared to the BP were observed at fracture, namely Ti and Nb carbonitrides in combination with oxisulfides, or Ti nitrides with oxisulfides or oxides. In addition, complex (Fe,Nb)P4 and (Ti,Nb)3S4 particles were confirmed. Their mean size detected statistically by means of TEM was much more subtle, only 20 nm compared to 42 nm in the BP. Similarly, CT900 cycling revealed finer particles, with an average size of 37 nm and even less (18 nm) after quenching compared to 105 nm in the BP. The observed particles were Al oxides, Ti(N,C) and (Ti,Nb)2S in contrast to the particles probably of TiFe and FeMnS in the BP. The degradation of plasticity corresponded just to the finer particles, newly created with temperature cycling.

Author Contributions

Designing and conducting research experiments, article conceptualization, writing–original draft preparation, J.K. and M.L.; coordinating research activities and designing research experiments, P.J. and Z.J.; specifically performing the experiments with TEM and SEM, V.G. and M.V.; developing specific methodology for hot torsion testing and performing the experiments, A.B.; analysing TEM data, paper editing and discussion of the paper structure, S.L., M.M. and M.F.; funding and supervising the paper preparation, J.D.

Funding

This study was supported mainly by the Joint Scientific Grant Agency (VEGA) of the Slovak Ministry of Education and the Slovak Academy of Sciences, project No. 1/0549/14 and No. 1/0387/11.

Acknowledgments

This study was supported also by SP2019/43 Specific research in the metallurgical, materials and process engineering.

Conflicts of Interest

The authors declare no conflicts of interest.

References

  1. Lee, S.H.; Utsunomiya, H.; Sakai, T. Microstructures and mechanical properties of ultra low carbon interstitial free steel severely deformed by a multi-stack accumulative roll bonding process. Mater. Trans. 2004, 45, 2177–2181. [Google Scholar] [CrossRef]
  2. Ghosh, P.; Ghosh, C.; Ray, R.K. Precipitation in interstitial free high strength steels. ISIJ Int. 2009, 49, 1080–1086. [Google Scholar] [CrossRef]
  3. Wilber, G.A.; Batra, R.; Savage, W.F.; Childs, W.J. The effects of thermal history and composition on the hot ductility of low carbon steels. Metall. Trans. A 1975, 6A, 1727–1735. [Google Scholar] [CrossRef]
  4. Mintz, B. The influence of composition on the hot ductility of steels and to the problem of transverse cracking. ISIJ Int. 1999, 39, 833–855. [Google Scholar] [CrossRef]
  5. Mintz, B.; Abushosha, R.; Jonas, J.J. Influence of dynamic recrystallisation on the tensile ductility of steels in the temperature range 700 to 1150 °C. ISIJ Int. 1992, 32, 241–249. [Google Scholar] [CrossRef]
  6. Vedani, M.; Dellasega, D.; Mannuccii, A. Characterization of grain-boundary precipitates after hot-ductility tests of microalloyed steels. ISIJ Int. 2009, 49, 446–452. [Google Scholar] [CrossRef]
  7. Suzuki, H.G.; Nishimura, S.; Imamura, J.; Nakamura, Y. Embrittlement of steel occurring in the temperature range from 1000 °C to 600 °C. Trans. Iron Steel Inst. Jpn. 1984, 24, 169–177. [Google Scholar] [CrossRef]
  8. Longauerová, M. Segregation and Precipitation at Continuous Casting, 1st ed.; TU HF Košice: Košice, Slovakia, 2006. (In Slovak) [Google Scholar]
  9. Wolf, M.M. Fine intergranular surface cracks in bloom casting. Trans. Iron Steel Inst. Jpn. 1984, 24, 351–358. [Google Scholar] [CrossRef]
  10. Ouchi, C.; Matsumoto, K. Hot ductility in Nb-bearing high strength low-alloy steel. Trans. Iron Steel Inst. Jpn. 1982, 22, 181–189. [Google Scholar] [CrossRef]
  11. Suzuki, H.G.; Nishimura, S.; Yamagushi, S. Characteristics of hot ductility in steels subjected to the melting and solidification. Trans. Iron Steel Inst. Jpn. 1982, 22, 48–56. [Google Scholar] [CrossRef]
  12. Suzuki, A. High temperature deformation behaviour on solidification. Trans. Iron Steel Inst. Jpn. 1985, 25, 648–952. [Google Scholar]
  13. Suzuki, H.G.; Nishimura, S.; Nakamura, Y. Improvement of hot ductility of continuously cast carbon steels. Trans. Iron Steel Inst. Jpn. 1984, 24, 54–59. [Google Scholar] [CrossRef]
  14. Gabániová, M.; Marek, P.; Ševčík, A.; Mikolaj, D. Fractographic analysis of high temperature fractures of low carbon slabs. In Proceedings of the Metal 2003, Hradec nad Moravicí, Czech Republic, 20–22 May 2003; Tanger, Ltd.: Ostrava, Czech Republic, 2003. CD-ROM (In Slovak). [Google Scholar]
  15. Maehara, Y.; Ohmori, Y. The precipitation of A1N and NbC and the hot ductility of low carbon steels. Mater. Sci. Eng. 1984, 62, 109–119. [Google Scholar] [CrossRef]
  16. Takeuchi, H.; Brimacombe, J.K. Effect of oscillation-mark formation on the surface quality of continuously cast steel slabs. Metall. Trans. B 1985, 16, 605–625. [Google Scholar] [CrossRef]
  17. Bořuta, J.; Kubina, T. Segregation, precipitation and hot formability of steels. AMS 2002, 8, 183–187. [Google Scholar]
  18. Kang, M.H.; Lee, J.S.; Koo, S.; Kim, J.; Heo, N.H. The mechanism of hot ductility loss and recovery in Nb-bearing low alloy steels. Metall. Mater. Trans. A 2014, 45, 4302–4306. [Google Scholar] [CrossRef]
  19. Revaux, T.; Deprez, P.; Bricout, J.P.; Oudin, J. In situ solidified hot tensile test and hot ductility of some plain carbon steels and microalloyed steels. ISIJ Int. 1994, 34, 528–535. [Google Scholar] [CrossRef]
  20. Mintz, B.; Yue, S.; Jonas, J. Hot ductility of steels and its relationship to the problem of transverse cracking during continuous casting. Int. Mater. Rev. 1991, 36, 187–220. [Google Scholar] [CrossRef]
  21. Hornbogen, E.; Gräf, M. Fracture toughness of precipitation hardened alloys containing narrow soft zones at grain boundaries. Acta Metall. 1977, 25, 877–881. [Google Scholar] [CrossRef]
  22. Mintz, B.; Stewart, J.M.; Crowther, D.N. The influence of cyclic temperature oscillations on precipitation and hot ductility of a C-Mn-Nb-Al steel. Trans. Iron Steel Inst. Jpn. 1987, 27, 959–964. [Google Scholar] [CrossRef]
  23. El-Wazri, A.M.; Hassani, F.; Yue, S.; Es-Sadiqi, E.; Collins, L.E.; Iqbal, K. The effect of thermal history on the hot ductility of microalloyed steels. ISIJ Int. 1999, 39, 253–262. [Google Scholar] [CrossRef]
  24. Cepeda, L.E.; Rodrigues-Ibabe, J.M.; Urcola, J.J.; Fuentes, M. Influence of dynamic recrystallisation on hot ductility of aluminium killed mild steel. Mater. Sci. Technol. 1989, 5, 1191–1199. [Google Scholar] [CrossRef]
  25. Fedorová, M. Fractographic and Structural Features of Slab Surface Discontinuity. Ph.D. Thesis, Technical University of Košice, Košice, Slovakia, 2012. (In Slovak). [Google Scholar]
  26. Fedorová, M.; Longauerová, M.; Bořuta, J. High temperature embrittlement evaluation of samples from TiNb IF steel after hot torsion test. Acta Metall. Slovaca Conf. 2013, 3, 40–48. [Google Scholar] [CrossRef]
  27. Le Papillon, Y.; Jäeger, W.; Konig, M.; Weisgerber, B.; Jauhola, M. Determination of High Temperature Surface Crack Formation Criteria in Continuous Casting and Thin Slab Casting; In Casting and Solidification, Technical Steel Research: European Commission, Final Report; Office for Official Publications of the European Communities: Luxembourg, 2003. [Google Scholar]
  28. Lee, U.H.; Park, T.E.; Son, K.S.; Kang, M.S.; Won, Y.M.; Yim, C.H.; Lee, S.K.; Kim, I.; Kim, D. Assessment of Hot Ductility with Various Thermal Histories as an Alternative Method of in situ Solidification. ISIJ Int. 2010, 50, 540–545. [Google Scholar] [CrossRef]
  29. Bořuta, J. Moderní krutový plastometr k přesnému zjišťování deformačních charakteristik za tepla tvářených kovů. Metall. J. Hut. Llisty 1993, 48, 7–8, 37–44. (In Czech) [Google Scholar]
  30. Bořuta, J.; Gembalová, P.; Omacht, D.; Bořuta, A.; Kubánek, Z.; Kubina, T.; Schindler, I. Plastometrický výzkum deformačního chování řízeně tvářených materiálů. Metall. J. Hut. Listy 2008, 61, 80–87. (In Czech) [Google Scholar]
  31. Longauerová, M.; Fujda, M.; Bořuta, J.; Kollerová, M.; Horáková, V.; Hollá, Ľ.; Marek, P.; Ferjo, J. Hot ductility loss of NbVTi microalloyed steel. Acta Metall. Slovaca 2005, 11, 97–103. [Google Scholar]
  32. Konrádyová, J.; Longauerová, M. Comparison of results from dilatometric analysis of TiNb IF steel and TiNb microalloyed steel in cast state. In Proceedings of the Metalurgia Junior 2014, Košice, Slovakia, 21–22 May 2014; Technical University of Košice: Košice, Slovakia, 2014; pp. 157–161. (In Slovak). [Google Scholar]
  33. Schindler, I.; Bořuta, J. Simulation of working processes by torsion plastometer and automated computer processing of experimental results. Arch. Metall. 1994, 39, 329–340. [Google Scholar]
  34. Štefan, B.; Parilák, Ľ.; Uďanová, Ľ.; Šlesár, M. Quantitative evaluation of the precipitation in micro alloyed steels by the electron microscopy of carbon extracted replicas. Steel Sheets Oceľové Plechy 1977, 3–4, 57–81. (In Slovak) [Google Scholar]
  35. Konrádyová, J.; Longauerová, M.; Girman, V.; Longauer, S.; Bořuta, A.; Bořuta, J. Interrelationship between hot ductility and particle size in TiNb IF steel. Mater. Sci. Forum. 2017, 891, 124–130. [Google Scholar] [CrossRef]
  36. Longauerová, M.; Fedorová, M.; Bořuta, J.; Bořuta, A. Effect of cooling rate in the critical temperature areas on the occurrence of hot ductility. Metall. J. Hut. Listy 2011, 64, 76–79. (In Slovak) [Google Scholar]
  37. Longauerová, M.; Bekeč, P.; Fedorová, M.; Longauer, S. Effect of casting rate on Ti-Nb microalloyed steel slab surface zone microstructure. Acta Metall. Slovaca Conf. 2010, 1, 167–172. [Google Scholar]
  38. Longauerová, M.; Huráková, M.; Longauer, S. Precipitation in surface zone of continuously-cast slab of ULC/IF steel microalloyed with titanium. Mater. Sci. Forum 2014, 782, 73–80. [Google Scholar] [CrossRef]
Figure 1. (a) Dependence of number of turns to failure (Nf) on test temperature (Td); (b) Dependence of limited deformation intensity (Sef) on test temperature (Td); (c) Dependence stress (σp) on test temperature (Td).
Metals 09 00752 g001
Figure 2. Dependence of stress σ on deformation intensity Se at selected temperatures: (a) TQ = 1220 °C, Nf = 45.6, sample X3; (b) TQ = 1143 °C, Nf = 38, sample X9; (c) TQ = 996 °C, Nf = 326.8, sample V9; (d) TQ = 925 °C, Nf = 72.8, sample X6; (e) TQ = 818 °C, Nf = 284.4, sample V5; (f) TQ = 637 °C, Nf = 5.5, sample V1; (pink curve–with parameter, blue curve–without parameter; Sep–peak intensity of deformation, σp-peak stress).
Metals 09 00752 g002aMetals 09 00752 g002b
Figure 3. Temperature dependence of the number of turns to failure Nf in the basic programme and of 1°, 2° temperature cycling in programme CT900 respectively CT1150 as well as quench states.
Metals 09 00752 g003
Figure 4. (a) Particles on the fracture, sample X4, TQ = 1132 °C, Nf = 33.7; (b) EDX spectrum from the particle in Figure 4a.
Metals 09 00752 g004
Figure 5. Melting and particles on the fracture, sample X2, TQ = 1175 °C, Nf = 41.4.
Metals 09 00752 g005
Figure 6. (a) Particles on the fracture, sample V1, TQ = 637 °C, Nf = 5.5; (b) EDX spectrum from the particle in Figure 6a.
Metals 09 00752 g006
Figure 7. (a) Particles on the fracture, sample X7, TQ = 946 °C, Nf = 6.2; (b) EDX spectrum from the particle in Figure 7a.
Metals 09 00752 g007
Figure 8. (a) Particles on the fracture, sample X5, TQ = 847 °C, Nf = 424.1; (b) EDX spectrum from the particle in Figure 8a-Fe, Ti, Mn.
Metals 09 00752 g008
Figure 9. (a) Fracture of sample Y4, CT1150-2°, Nf = 95.4, Td = 1050 °C; (b) EDX spectrum from the particle in Figure 8a-Fe, Ti, Mn, N, O, S, C, Al, Nb, Mg.
Metals 09 00752 g009
Figure 10. (a) TEM, particles in sample Y4, CT1150-2°, spherical particle on the basis of P, Fe, Nb, Ti, O, Cu; (b) Diffraction pattern, sample Y4, (Fe,Nb)P4 phase.
Metals 09 00752 g010
Figure 11. (a) TEM, particles in sample Y4, CT1150-2°, part of complex particle with S, Cu, Ti, O, Nb, Fe; (b) Diffraction pattern, sample Y4, (Ti,Nb)3S4 phase.
Metals 09 00752 g011
Figure 12. Relative frequency of particles by size for samples: (a) CT1150-2°, Td = 1050 °C, Nf = 95.4, Ar; (b) CT900-2°, Td = 850 °C, Nf = 195.5, Ar; (c) CT900-2°, Td = 850 °C, Nf = 89.7, quenching.
Metals 09 00752 g012
Figure 13. (a) Fracture of sample Z6, CT900-2°, Nf = 195.5, Td = 850 °C; (b) EDX spectrum from particle in Figure 12a-Fe, O, Al.
Metals 09 00752 g013
Figure 14. TEM, particles in sample Z6, CT900-2°. Particle on the base: (a) Ti, S, Nb; (b) N, Ti, C.
Metals 09 00752 g014
Figure 15. Diffraction patterns, sample Z6, CT900-2°: (a) (Ti,Nb)2S phase from Figure 14, particle a; (b) Ti(N,C) phase from Figure 14, particle b.
Metals 09 00752 g015
Figure 16. Temperature dependence of hot ductility (number of turns to fracture, Nf ) in torsion testing for three slab pulling rates: v = 0.53 [36], v = 0.8 [26] and v = 1.02 m/min.
Metals 09 00752 g016
Table 1. Chemical composition of the slab cast at the standard pulling rate 1.02 m/min [wt. %].
CMnSiPSAlMoTiVNbZr
0.0030.330.0070.0540.0070.0360.0020.0330.0010.0380.002
BCaCuNiAsSnSbCrZnNFe
0.00050.00020.0290.0090.0010.0020.0020.020.0010.003Balance
Table 2. Temperature cycling conditions in the stable austenite temperature zone (CT1150).
Type of CyclingProgramme Conditions CT1150No.Type of Cooling
1° temperature
cycling
1375 °C/0.45′–1200 °C/1′–700 °C/1′–1150 °C/1′Y1Ar
1375 °C/0.45′–1200 °C/1′–700 °C/1′–1150 °C/1′Y2Quenching
2° temperature
cycling
1375 °C/0.45′–1200 °C/1′–700 °C/1′–1150 °C/1′–950 °C/1′Y7Ar
1375 °C/0.45′–1200 °C/1′–700 °C/1′–1150 °C/1′–1000 °C/1′ Y3Ar
1375 °C/0.45′–1200 °C/1′–700 °C/1′–1150 °C/1′–1050 °C/1′ Y4Ar
1375 °C/0.45′–1200 °C/1′–700 °C/1′–1150 °C/1′–1050 °C/1′ Y8Quenching
1375 °C/0.45′–1200 °C/1′–700 °C/1′–1150 °C/1′–1100 °C/1′ Y5Ar
1375 °C/0.45′–1200 °C/1′–700 °C/1′–1150 °C/1′–1200 °C/1′ Y6Ar
Table 3. Temperature cycling conditions near the temperature range of the phase transformation γ→α (CT900).
Type of CyclingProgramme Conditions CT900No.Type of Cooling
1° temperature
cycling
1375 °C/0.45′–1200 °C/1′–700 °C/1′– 900 °C/1′Z1Ar
1375 °C/0.45′–1200 °C/1′–700 °C/1′– 900 °C/1′Z2Quenching
2° temperature
cycling
1375 °C/0.45′–1200 °C/1′–700 °C/1′–900 °C/1′–700 °C/1′Z3Ar
1375 °C/0.45′–1200 °C/1′–700 °C/1´–900 °C/1′–750 °C/1′Z4Ar
1375 °C/0.45′–1200 °C/1′–700 °C/1′–900 °C/1′–800 °C/1′Z5Ar
1375 °C/0.45′–1200 °C/1′–700 °C/1′–900 °C/1′–850 °C/1′Z6Ar
1375 °C/0.45′–1200 °C/1′–700 °C/1′–900 °C/1′–850 °C/1′Z9Quenching
1375 °C/0.45′–1200 °C/1′–700 °C/1′–900 °C/1′–1000 °C/1′Z7Ar
1375 °C/0.45′–1200 °C/1′–700 °C/1′–900 °C/1′–1000 °C/1′ Z8Ar
Table 4. Results of hot torsion testing according to the basic programme (BP).
Sample No.Td [°C]TQ [°C]Nfσp [MPa]SepSef
V16006375.5*3240.150.75
Y96006437.3˜2970.560.95
V37006978.4*2830.431.06
V475075818.7*1600.081.83
V5800818284.4^*1360.054.93
V68508441726.9^*960.207.01
X5900847424.1^*500.085.39
X695092572.8^*660.083.36
X79509466.2˜1030.600.83
V91050996326.8^*770.305.09
V101100107388.1*600.193.58
X41150113233.7˜500.162.48
X91150114338.0*430.202.62
X21200117541.4410.142.71
X31250122045.6*340.122.82
Td—planned temperature of sample in hot torsion test; TQ-real measured temperature of sample in hot torsion test; Nf—number of turns (revolutions) to failure; σp—peak stress; Sep—peak intensity of deformation; Sef—boundary intensity of deformation; *—fracture completed during tensile test at ambient temperature 20 °C, because some test rods had fractured during torsion testing, but due to contact they joined back together, usually at one point on the fracture perimeter; ˜—quenching in water; ^*—forced stop, fracture completed during static tensile test at 20 °C.
Table 5. Results of hot torsion testing with temperature cycling based on programmes (CT1150) and (CT900).
CTNo.Td [°C]TQ [°C]NfTd−TQ [°C]
CT11501° temperature
cycling
Y11150113737.9Tdown = −13 °C
Y21150114436.4Tdown = −13 °C

temperature
cycling
Y7950889596.9Tdown = −60 °C
Y3100095654.1Tdown = −45 °C
Y4105099595.4Tdown = −55 °C
Y81050104249.5Tdown = −10 °C
Y51100108355.3Tdown = −18 °C
Y61200119740.4Tdown = −5 °C
CT9001° temperature
cycling
Z1900886186.3Tdown = −36 °C
Z290090370.9Tdown = −4 °C

temperature
cycling
Z370074213.6Tterm.efekt = +42 °C
Z4750851192.1Tterm.efekt = +100 °C
Z580080262.5Tterm.efekt = +2 °C
Z6850851195.5Tdown = −27 °C
Z985084489.7Tdown = −8 °C
Z7100098134.7Tdown = −19 °C
Z81000100156.1Tdown = −13 °C

