Role of Vanadium Addition on Hot Deformation Behavior of Aluminum Alloy 5083


Abstract
:1. Introduction
2. Materials and Methods
2.1. Materials
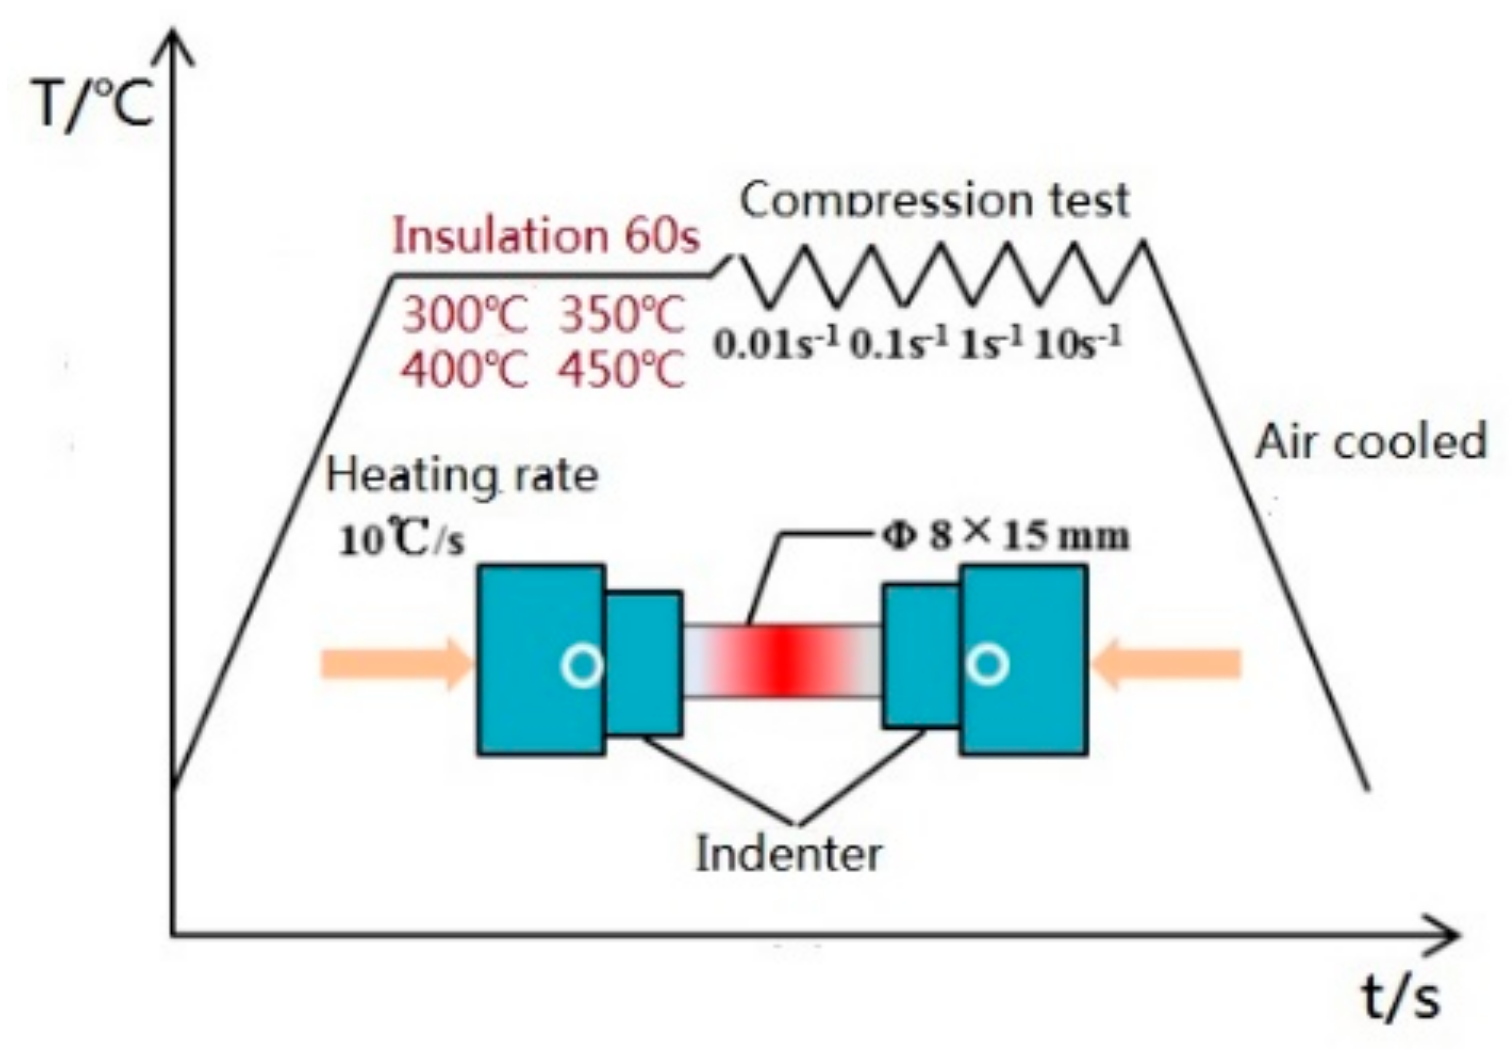
2.2. Methods
3. Results and Discussion
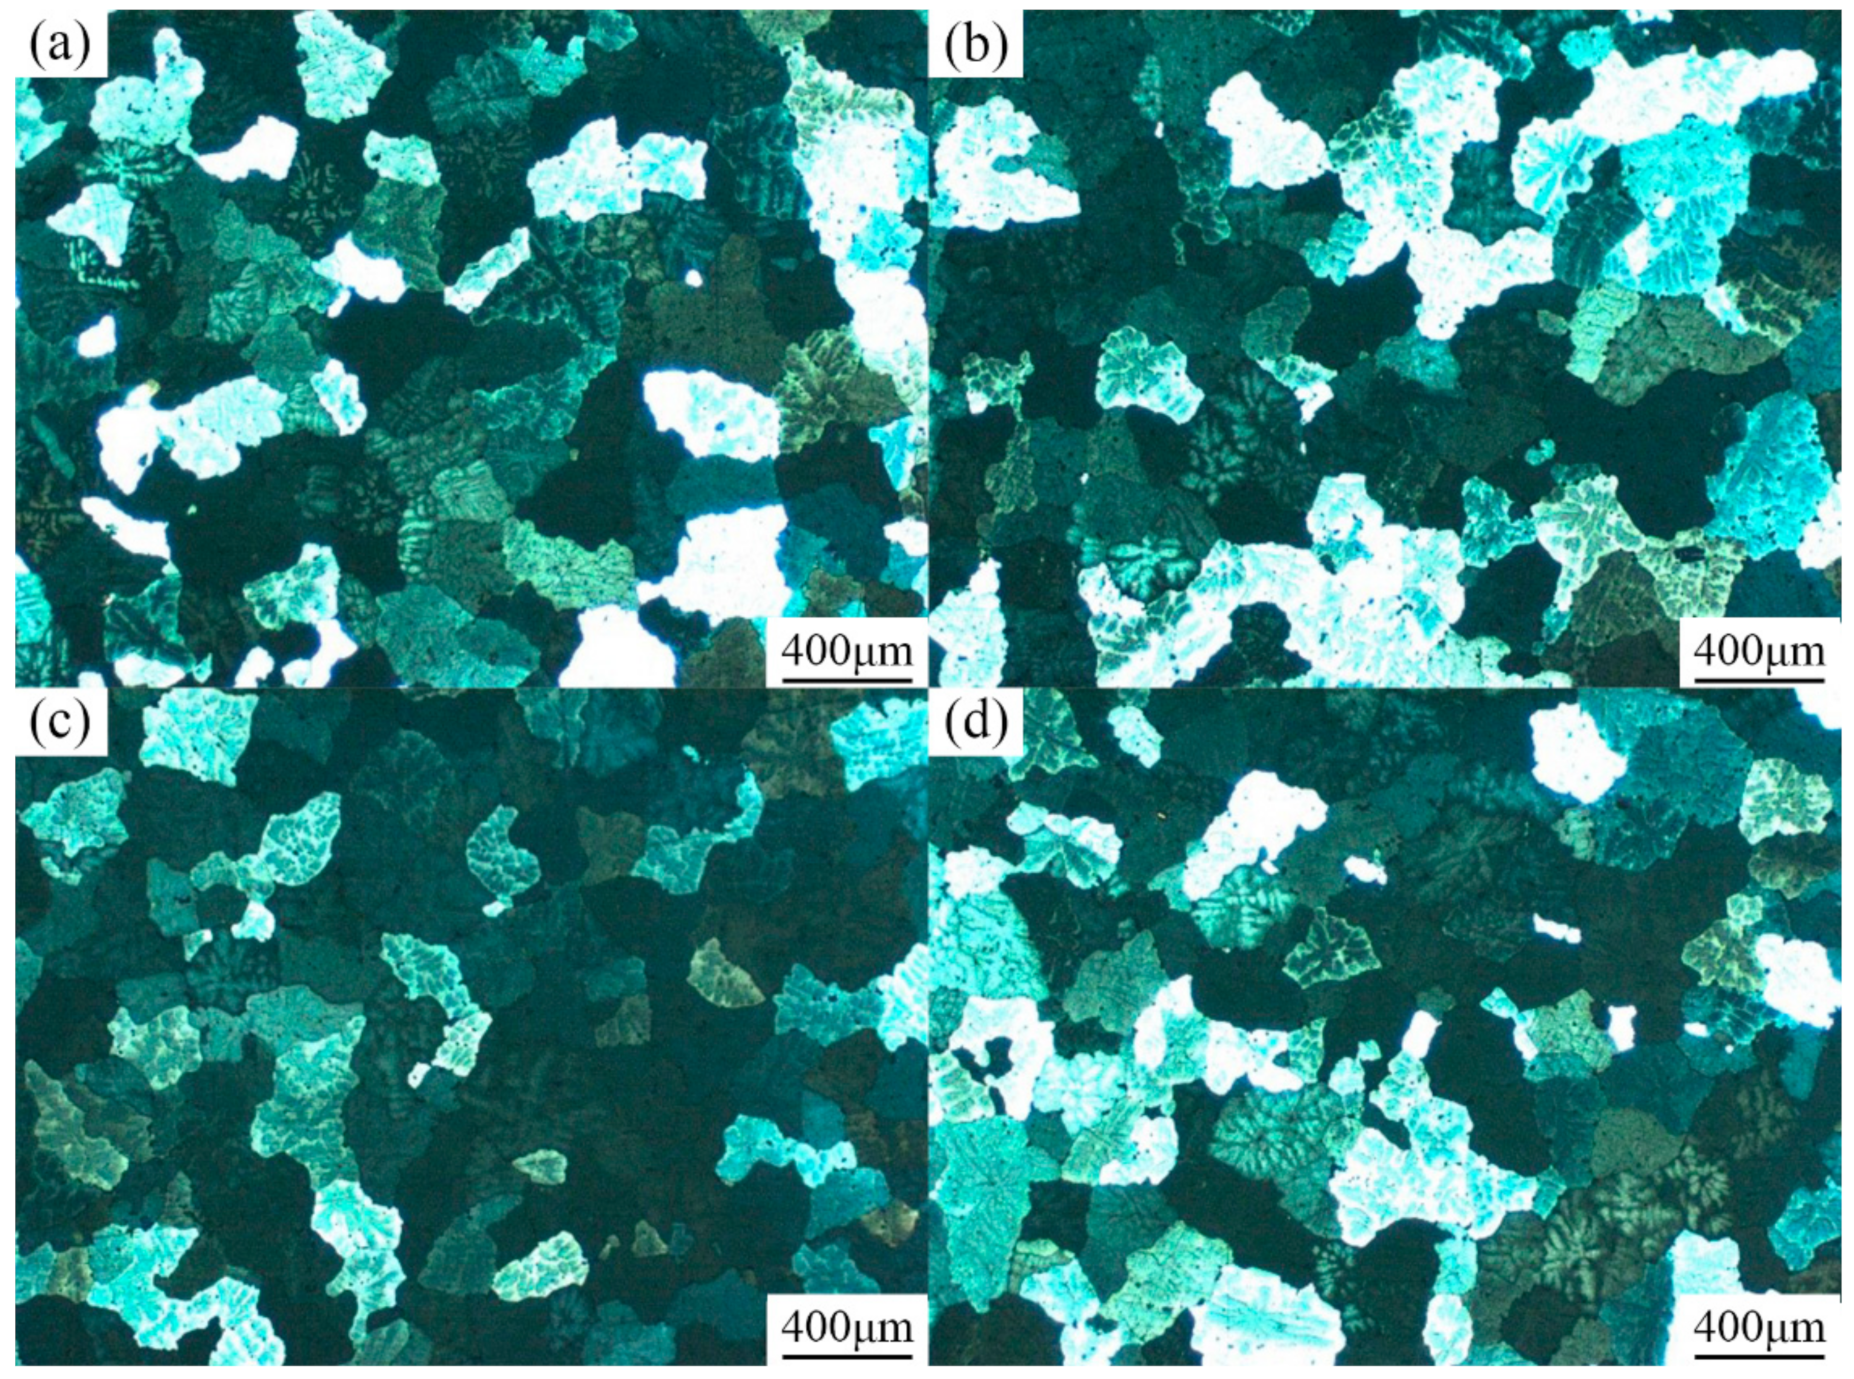
3.1. Microstructure of the 5083 + V Alloy before Hot Compression
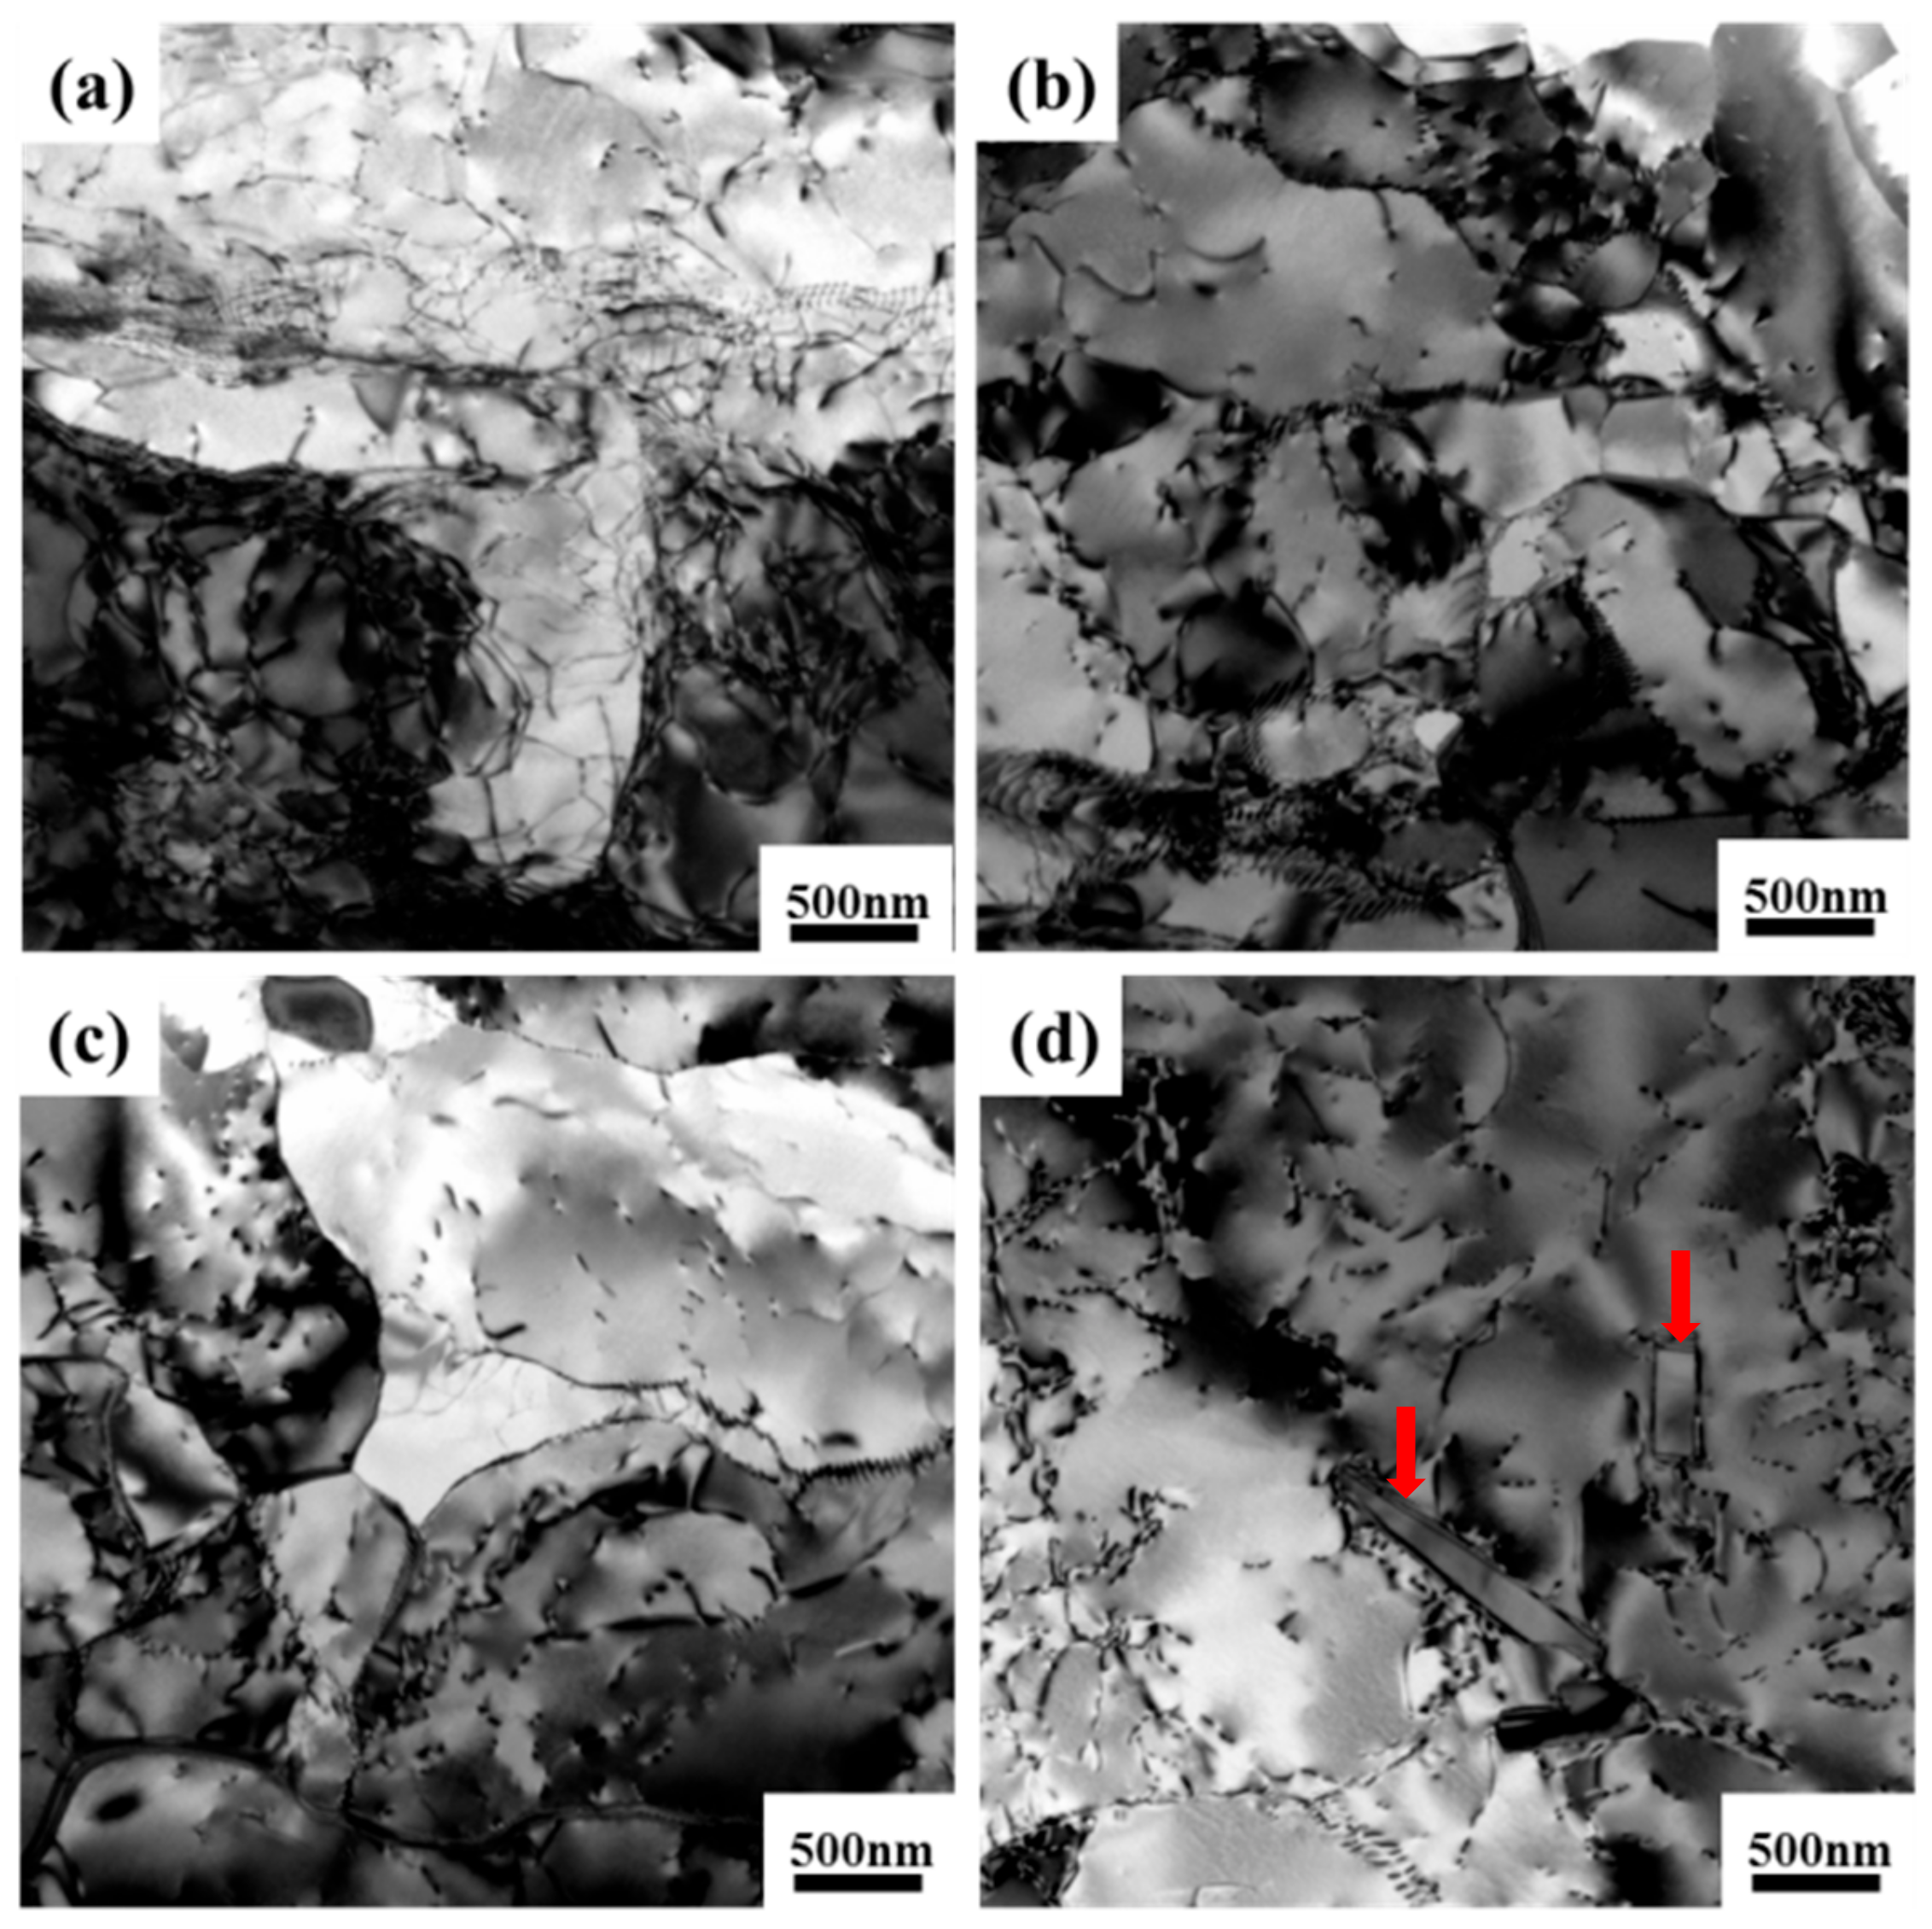
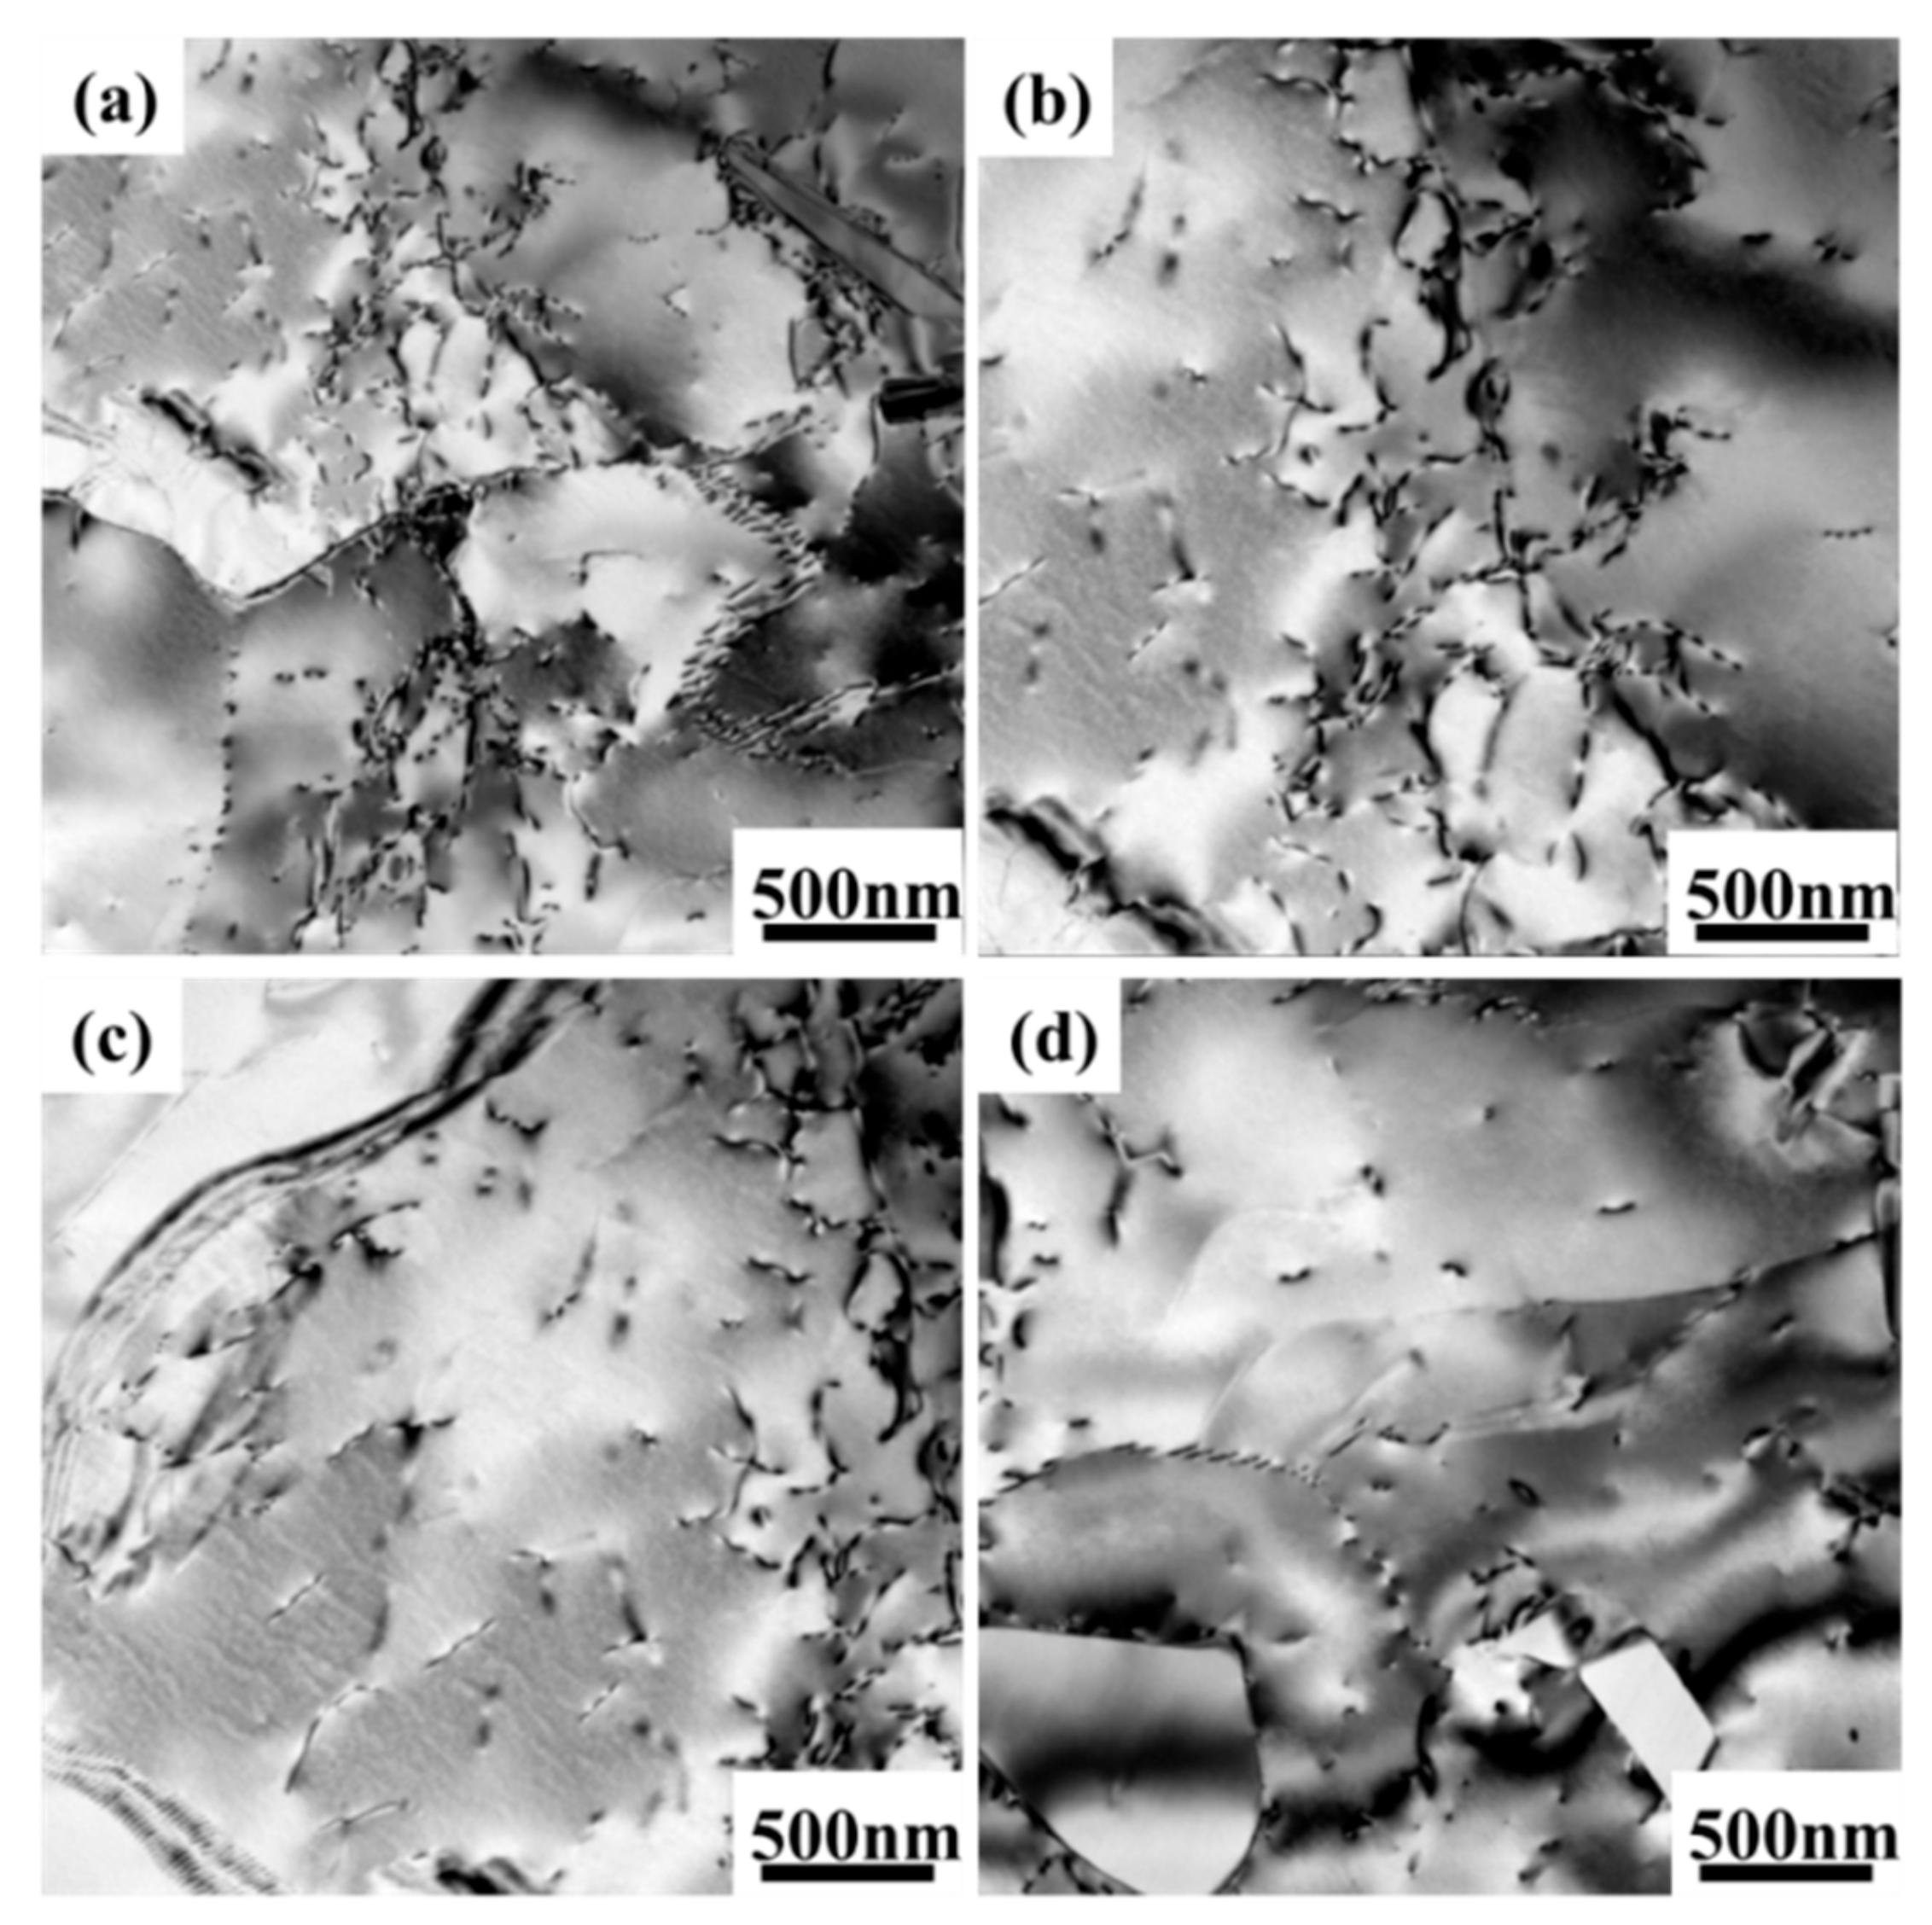
3.2. Stress-Strain Curves and Microstructure of Hot Compressed Alloy
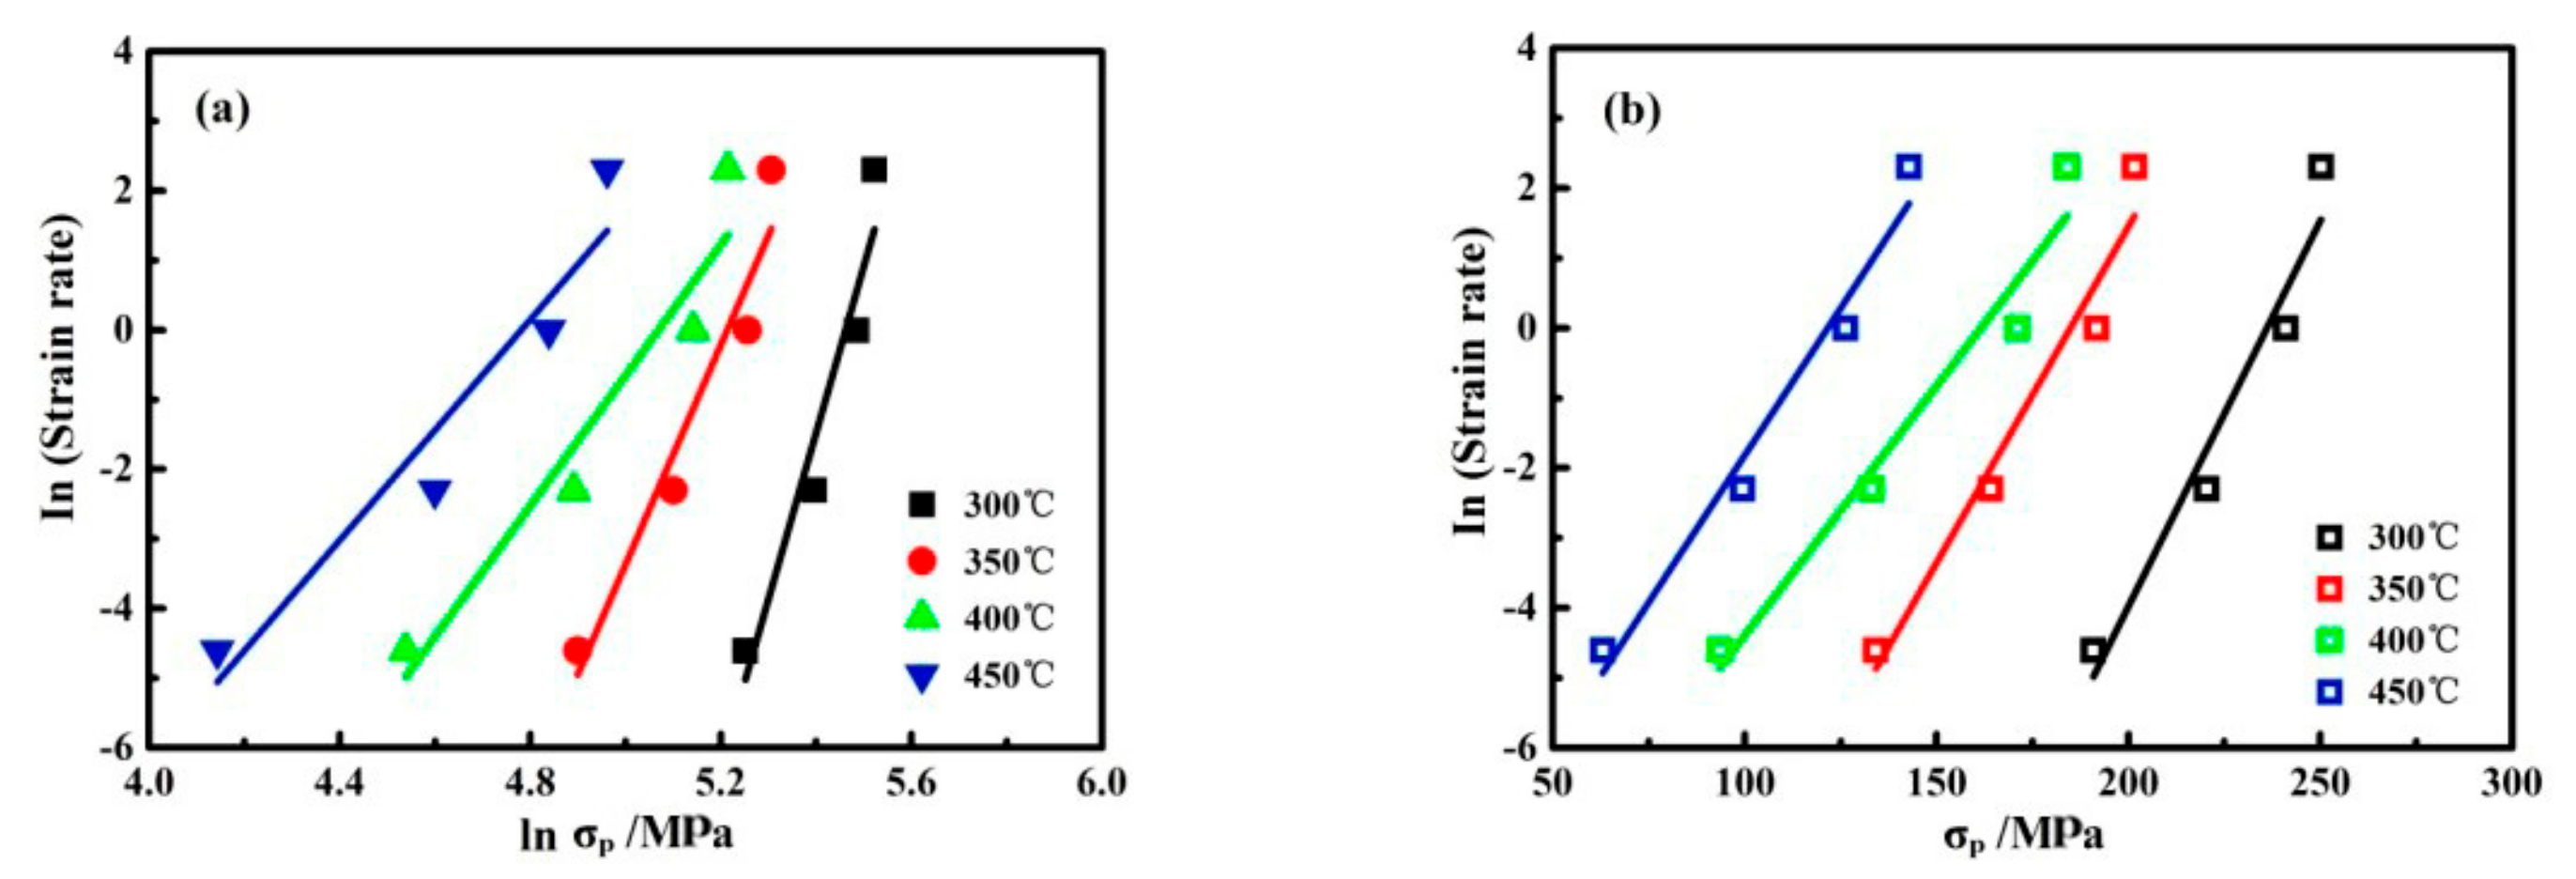
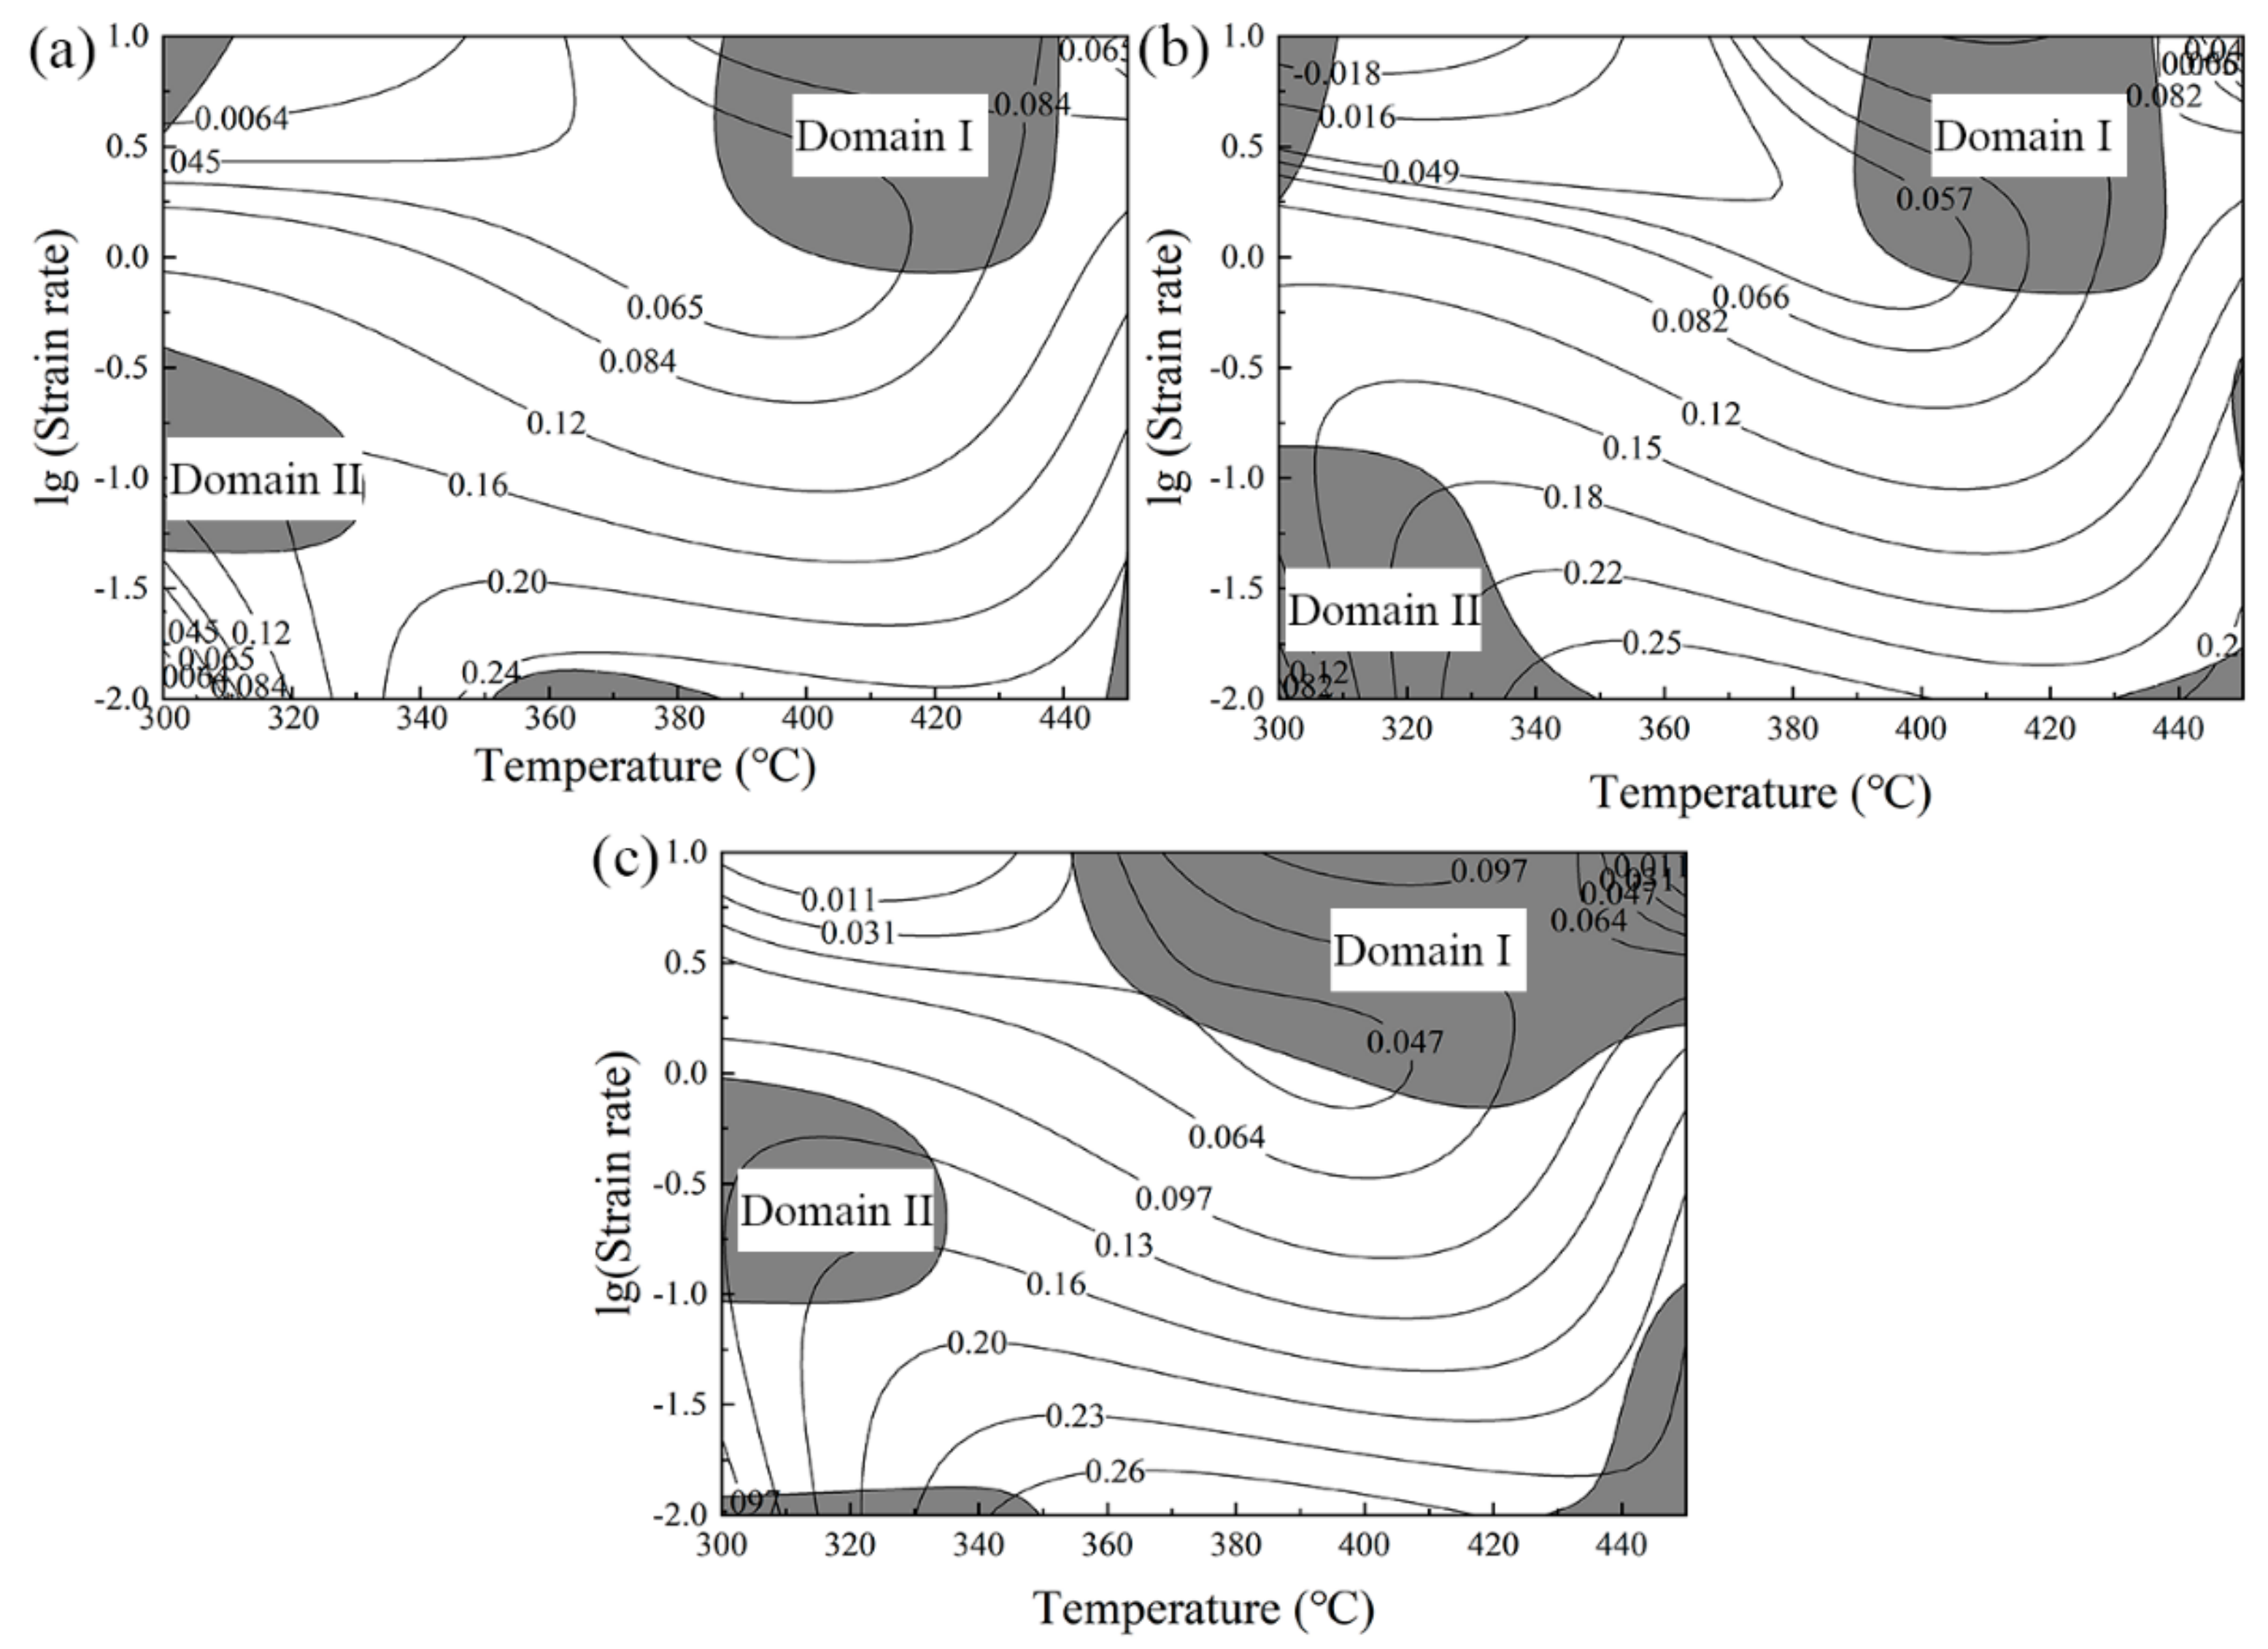
3.3. Constitutive Equation and Processing Map
4. Conclusions
- (1)
- The addition of 0.05 wt.% V to alloy 5083 can increase the flow stress due to the existence of fine Al3V particles formed during homogenization, which show a pinning effect on the dislocations and sub-grains during hot deformation processes.
- (2)
- The activation energy of alloy 5083 changes with increasing V contents up to 0.05 wt.%. In the alloy with 0.05 wt.% V, the activation energy reaches the maximum value of 166 kJ/mol, which is 10.0% higher than that of V-free alloy 5083.
- (3)
- For a higher true strain, the appropriate process domain for alloy C is in the temperature ranges of 350–430 °C and strain rates of 0.01–0.030 s−1.
Author Contributions
Funding
Conflicts of Interest
References
- Yi, G.S.; Sun, B.H.; Poplawsky, J.D.; Zhu, Y.K.; Free, M.L. Investigation of pre-existing particles in Al 5083 alloys. J. Alloys Compd. 2018, 740, 461–469. [Google Scholar] [CrossRef]
- Grajca, A.; Morawiec, M.; Zalecki, W. Austenite decomposition and precipitation behavior of plastically deformed low-Si microalloyed steel. Metals 2018, 8, 1028. [Google Scholar] [CrossRef]
- Smith, D.; Joris, O.P.J.; Sankaran, A.; Weekes, H.E.; Bull, D.J.; Prior, T.J.; Dye, D.; Errandonea, D.; Proctor, J.E. On the high-pressure phases stability and elastic properties of β-titanium alloys. J. Phys. Condens. Mater. 2017, 29, 155401. [Google Scholar] [CrossRef] [PubMed]
- Ling, O.; Zheng, Z.Q.; Nie, Y.F.; Jian, H.G. Hot deformation behavior of 2060 alloy. J. Alloys Compd. 2015, 648, 681–689. [Google Scholar]
- Yan, L.M.; Shen, J.; Li, J.P.; Li, Z.B.; Tang, Z.L. Dynamic recrystallization of 7055 aluminum alloy during hot deformation. Mater. Sci. Eng. A 2010, 650, 295–301. [Google Scholar] [CrossRef]
- Pan, S.P.; Chen, Y.Q.; Song, W.W. Effects of Initial Microstructure Characteristics on Hot De-formation Behaviors of 2E12 Aluminum Alloy. J. Mater. Eng. 2016, 44, 22–32. [Google Scholar] [CrossRef]
- Koushki, A.R.; Goodarzi, M.; Paidar, M. Influence of shielding gas on the mechanical and metallurgical properties of DP-GMA-welded 5083-H321 aluminum alloy. Int. J. Miner. Metall. Mater. 2016, 23, 1416–1426. [Google Scholar] [CrossRef]
- Shamsipur, A.; Anvari, A.; Keyvani, A. Improvement of microstructure and corrosion properties of friction stir welded AA5754 by adding Zn interlayer. Int. J. Miner. Metall. Mater. 2018, 25, 967–973. [Google Scholar] [CrossRef]
- Fang, H.C.; Chao, H.; Chen, K.H. Effect of Zr, Er and Cr additions on microstructures and properties of Al–Zn–Mg–Cu alloys. Mater. Sci. Eng. A 2014, 610, 10–16. [Google Scholar] [CrossRef]
- Wen, S.P.; Wang, W.; Zhao, W.H. Precipitation hardening and recrystallization behavior of AlMgErZr alloys. J. Alloy. Compd. 2016, 687, 143–151. [Google Scholar] [CrossRef]
- Liu, R.; Hui, H.; Jun, M. Mechanical Properties at Low Temperature and Microstructure of Al-6Mg-0.8Zn-0.5Mn-0.2Zr-0.2Er Alloy. Rare Met. Mater. Eng. 2018, 47, 162–168. [Google Scholar]
- Huang, P.P.; Somers, A.; Howlett, C. Film formation in trihexyl (tetradecyl) phosphonium diphenylphosphate ionic liquid on AA5083 aluminium alloy. Surf. Coat. Technol. 2016, 303, 385–395. [Google Scholar] [CrossRef]
- Benallal, A.; Berstad, T.; Børvik, T. An experimental and numerical investigation of the behaviour of AA5083 aluminium alloy in presence of the Portevin–Le Chatelier effect. Int. J. Plast. 2008, 24, 1916–1945. [Google Scholar] [CrossRef]
- Wen, S.P.; Gao, K.Y.; Huang, H. Role of Yb and Si on the precipitation hardening and recrystallization of dilute Al–Zr alloys. J. Alloy. Compd. 2014, 599, 65–70. [Google Scholar] [CrossRef]
- Fan, C.H.; Chen, X.H.; Zhou, X.P. Microstructure evolution and strengthening mechanisms of spray-formed 5A12 Al alloy processed by high reduction rolling. Trans. Nonferrous Met. Soc. China 2017, 27, 2363–2370. [Google Scholar] [CrossRef]
- Allen, C.M.; O’Reilly, K.A.Q.; Evans, P.V. The effect of vanadium and grain refiner additions on the nucleation of secondary phases in 1xxx Al alloys. Acta Mater. 1999, 47, 4387–4403. [Google Scholar] [CrossRef]
- Kazakova, E.F.; Rusnyak, Y.I. A study of rapidly hardened aluminum alloys with iron and vanadium. Met. Sci. Heat Treat. 2009, 51, 436–439. [Google Scholar] [CrossRef]
- Camero, S.; Puchi, E.S.; Gonzalez, G. Effect of 0.1% vanadium addition on precipitation behavior and mechanical properties of Al-6063 commercial alloy. J. Mater. Sci. 2006, 41, 7361–7373. [Google Scholar] [CrossRef]
- Esquivel, J.; Gupta, R.K. Influence of the V content on microstructure and hardness of high-energy ball milled nanocrystalline Al-V alloys. J. Alloy. Compd. 2018, 760, 63–70. [Google Scholar] [CrossRef]
- Shi, C.; Chen, X.G. Effect of vanadium on hot deformation and microstructural evolution of 7150 aluminum alloy. Mater. Sci. Eng. A 2014, 613, 91–102. [Google Scholar] [CrossRef]
- Shi, C.; Chen, X.G. Evolution of activation energies for hot deformation of 7150 aluminum alloys with various Zr and V additions. Mater. Sci. Eng. A 2016, 650, 197–209. [Google Scholar] [CrossRef]
- Brooks, S.P.; Gelman, A. General Methods for Monitoring Convergence of Iterative Simulations. J. Comput. Graph. Stat. 1998, 7, 434–455. [Google Scholar] [Green Version]
- Yan, Y.; Qi, Y.; Chen, L.J. Strain rate dependent high temperature compressive deformation characteristics of ultrafine-grained pure aluminum produced by ECAP. Trans. Nonferrous Met. Soc. China 2016, 26, 966–973. [Google Scholar] [CrossRef]
- Ramesh, K.T. Effects of high rates of loading on the deformation behavior and failure mechanisms of hexagonal close-packed metals and alloys. Metall. Mater. Trans. A 2002, 33, 927–935. [Google Scholar] [CrossRef]
- Sherby, O.D.; Ruano, O.A. Rate-controlling processes in creep of subgrain containing aluminum materials. Mater. Sci. Eng. A 2005, 410–411, 8–11. [Google Scholar] [CrossRef]
- Wu, W.X.; Sun, D.Q.; Cao, C.Y.; Wang, Z.F.; Zhang, H. Flow stress behavior of 5083 aluminium alloy under hot compression deformation. Trans. Nonferrous Met. Soc. China 2007, 17, 1667–1671. [Google Scholar]


| Alloy | Si | Fe | Cu | Mn | Mg | Ni | Ti | Zr | V | Al |
|---|---|---|---|---|---|---|---|---|---|---|
| A | 0.04 | 0.05 | 0.01 | 0.7 | 4.65 | 0.15 | 0.01 | 0.12 | 0 | Bal. |
| B | 0.04 | 0.05 | 0.01 | 0..7 | 4.65 | 0.15 | 0.01 | 0.12 | 0.03 | Bal. |
| C | 0.04 | 0.05 | 0.01 | 0.7 | 4.65 | 0.15 | 0.01 | 0.12 | 0.05 | Bal. |
| D | 0.04 | 0.05 | 0.01 | 0..7 | 4.65 | 0.15 | 0.01 | 0.12 | 0.10 | Bal. |
© 2019 by the authors. Licensee MDPI, Basel, Switzerland. This article is an open access article distributed under the terms and conditions of the Creative Commons Attribution (CC BY) license (http://creativecommons.org/licenses/by/4.0/).
Share and Cite
Wang, L.; Wang, X.; Zhu, X.; Xu, X.; Cui, J.; Liao, B.; Wang, X.; Wu, X. Role of Vanadium Addition on Hot Deformation Behavior of Aluminum Alloy 5083. Metals 2019, 9, 766. https://doi.org/10.3390/met9070766
Wang L, Wang X, Zhu X, Xu X, Cui J, Liao B, Wang X, Wu X. Role of Vanadium Addition on Hot Deformation Behavior of Aluminum Alloy 5083. Metals. 2019; 9(7):766. https://doi.org/10.3390/met9070766
Chicago/Turabian StyleWang, Lijuan, Xiangjie Wang, Xiao Zhu, Xin Xu, Jianzhong Cui, Bin Liao, Xiaodong Wang, and Xiaodong Wu. 2019. "Role of Vanadium Addition on Hot Deformation Behavior of Aluminum Alloy 5083" Metals 9, no. 7: 766. https://doi.org/10.3390/met9070766