Strain-Induced Ferrite Formation During Steckel Mill Simulations with Varying Roughing Pass Schedules


 ,
,  ,
,
Abstract
:1. Introduction
2. Materials and Methods
2.1. Torsion Simulations
2.2. Microstructural Analysis
3. Results
3.1. Stress–Strain Curves from the Plate Rolling Simulations
3.2. Optical Microscopy Results
3.3. Calculation of the Critical Strains for the Onset of DT and DRX
4. Discussion
4.1. Mean Flow Stresses
4.2. Volume Fraction of DT Ferrite per Pass
4.3. Production/Retention Tendencies for the Formation of DT Ferrite
4.4. Microstructure Analysis
5. Conclusions
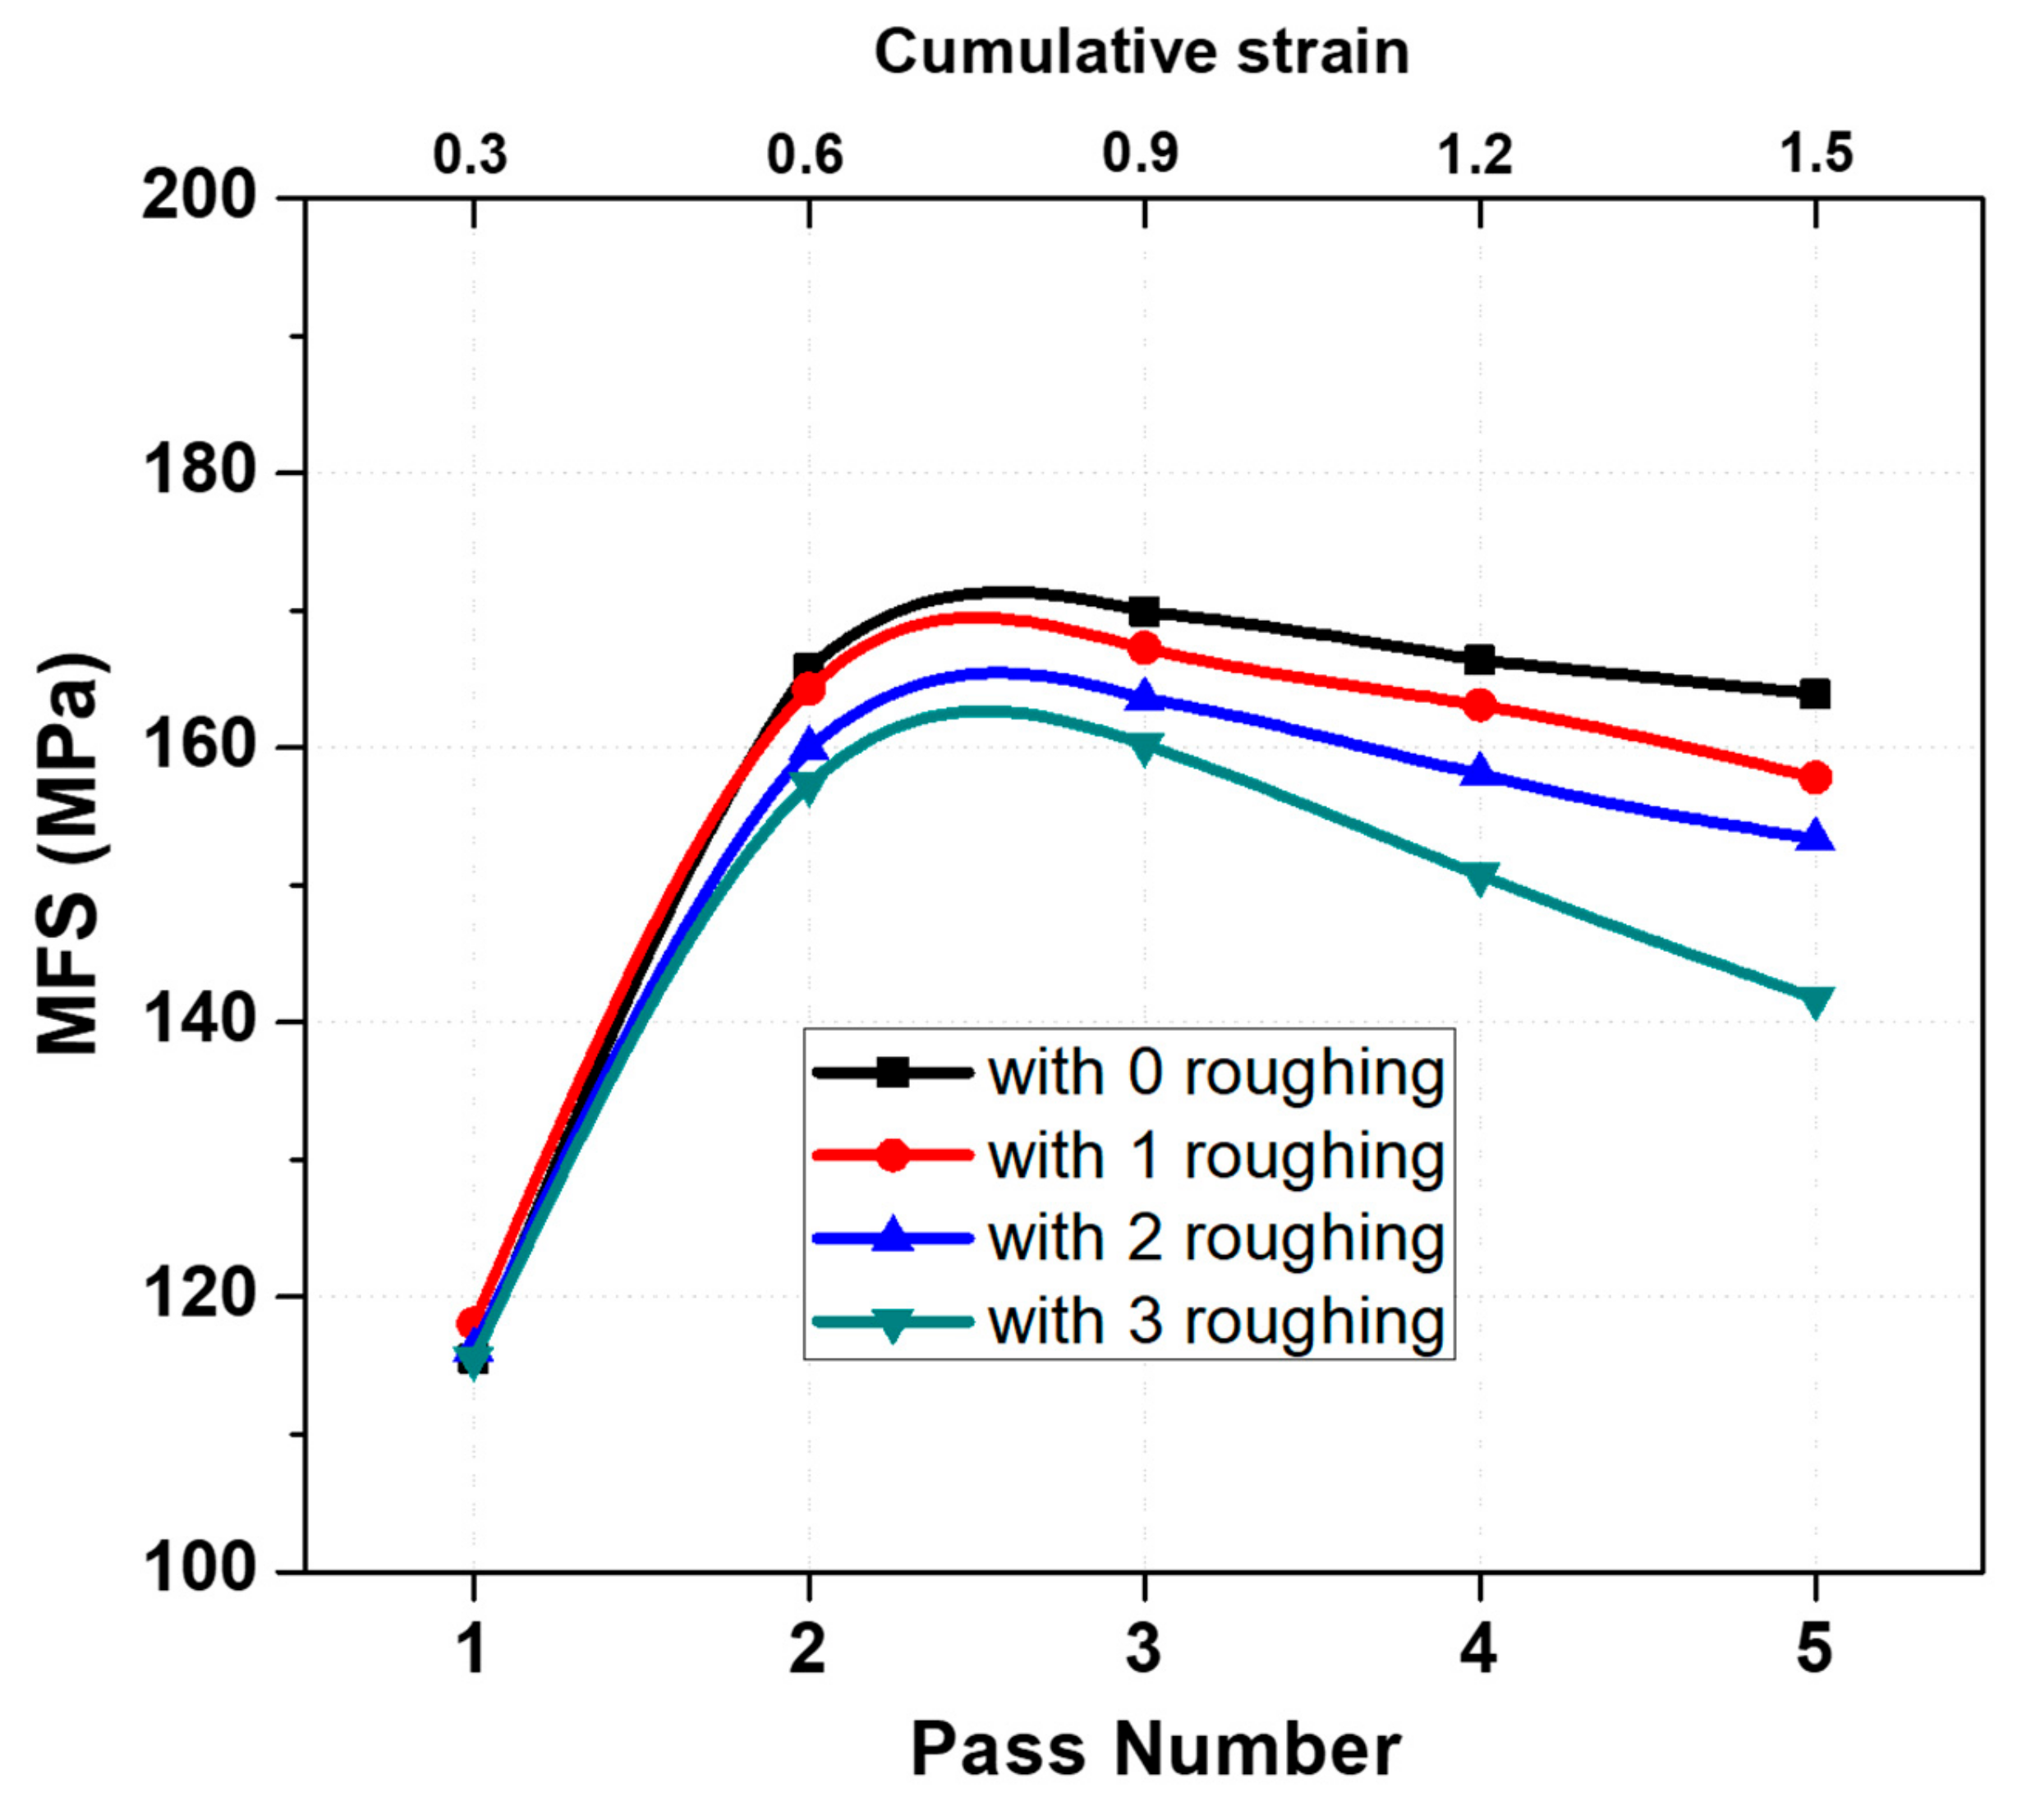
- The number of roughing passes employed before the finishing simulations influenced the levels of flow curves during the five-pass simulated Steckel mill operation. The DT ferrite inherited from the higher number of roughing passes (higher retained strain) contributed to the increase in softening observed during the finishing passes.
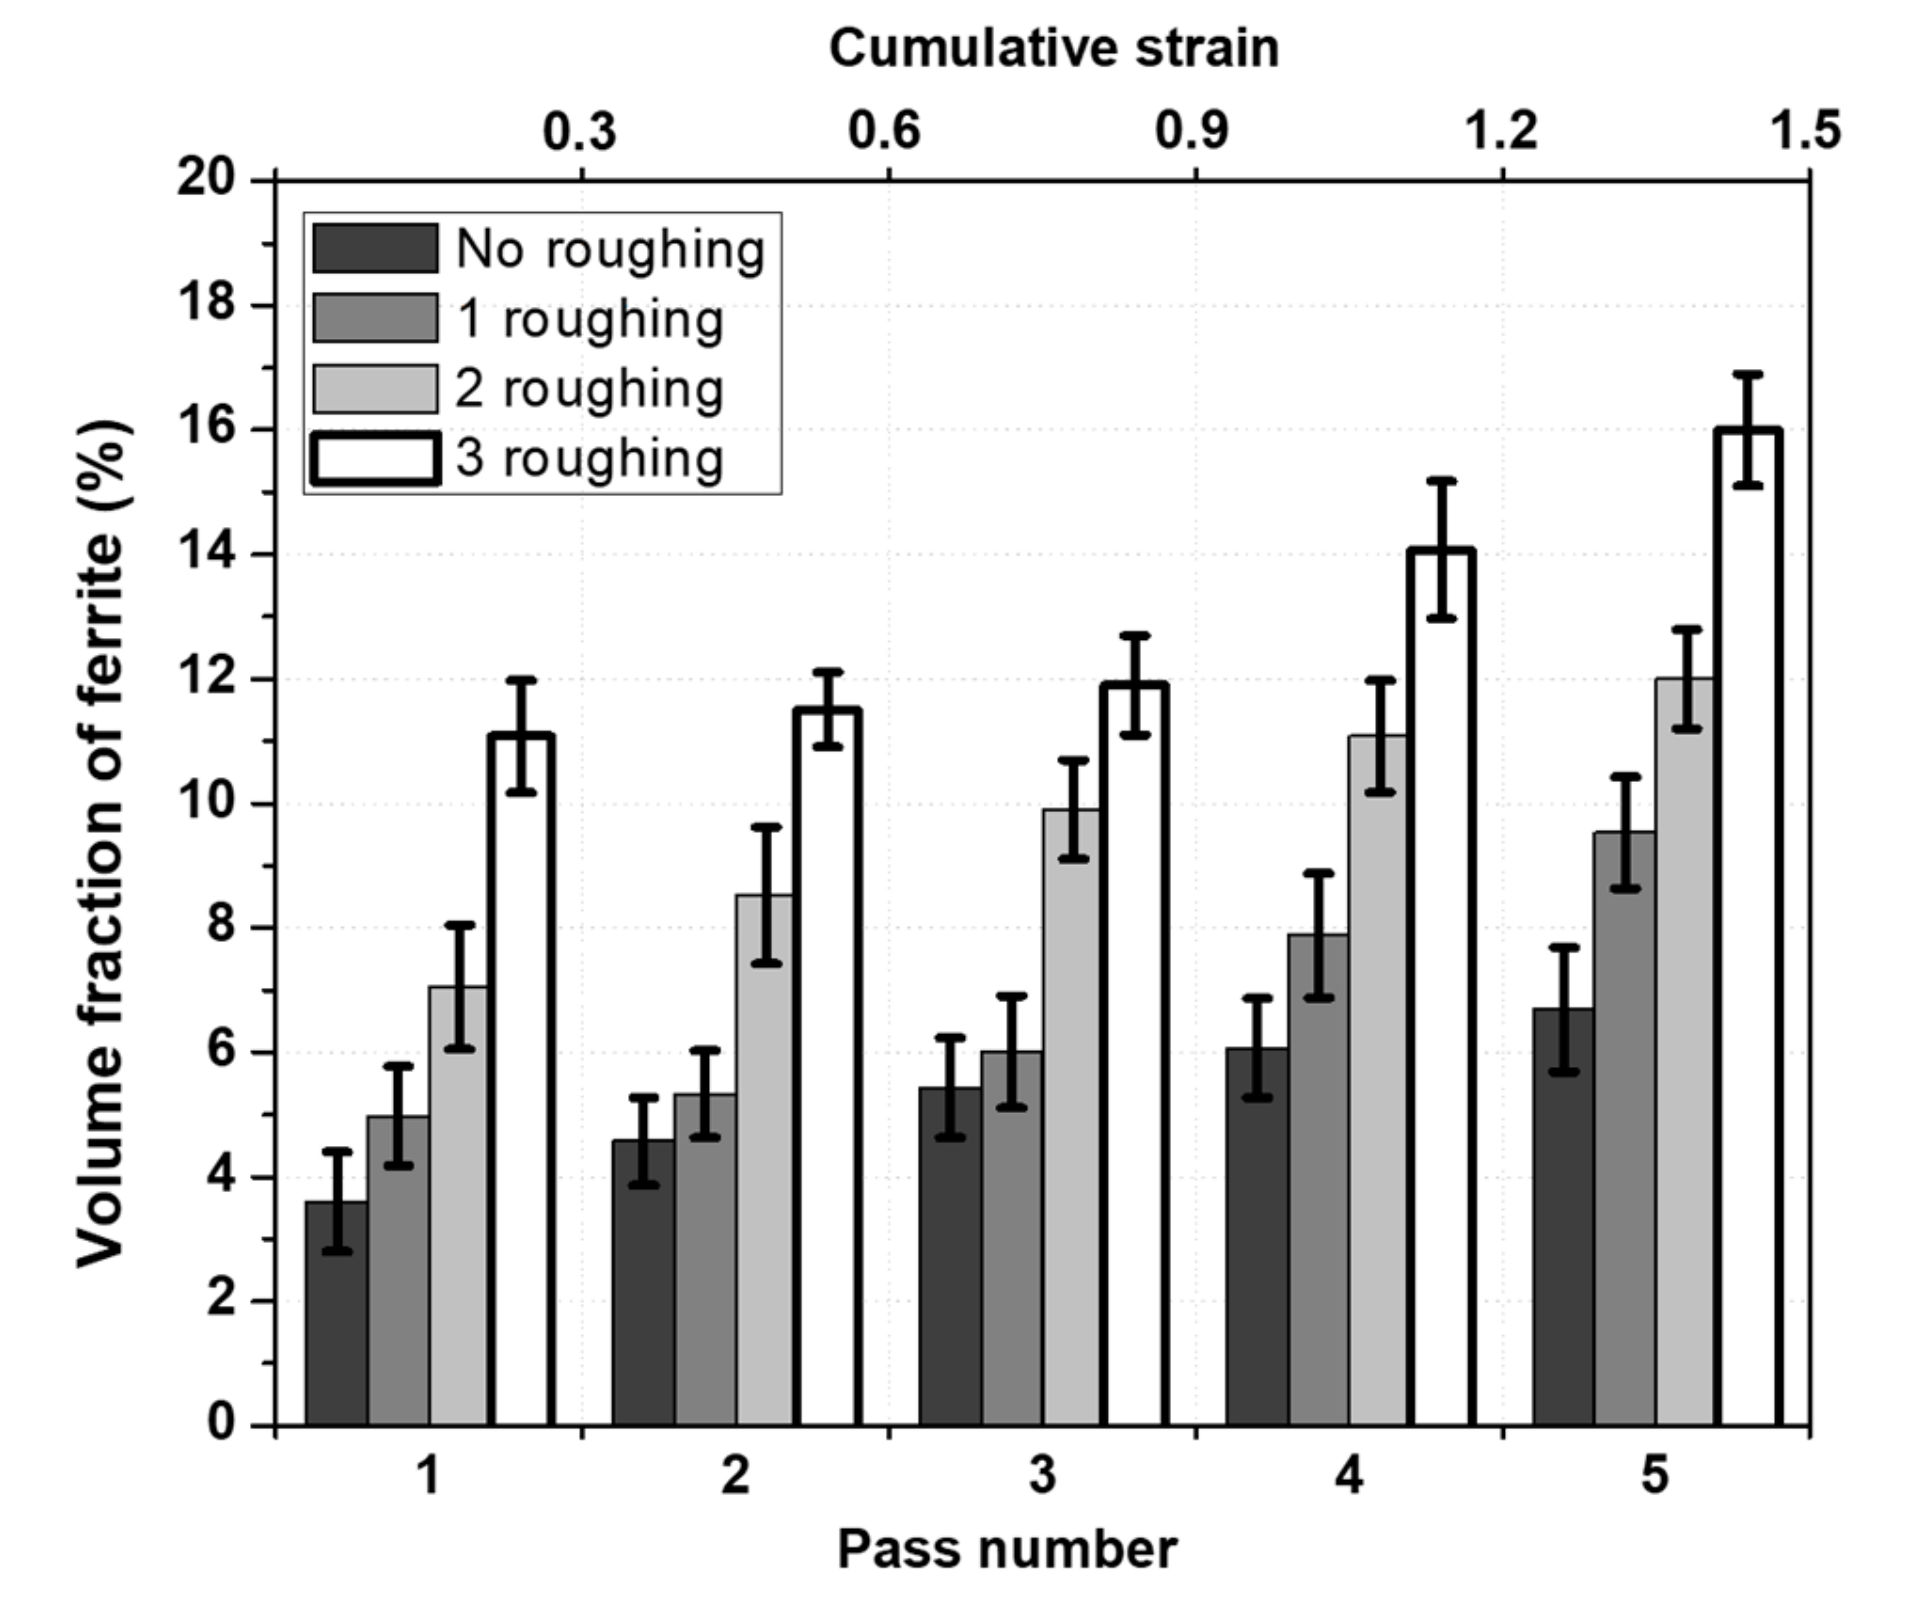
- Thermomechanical schedules with a higher number of roughing passes produced higher amounts of ferrite volume fractions which sharply reduced the levels of the MFS. This is supported by images from optical microscopy. The perceptive MFS increase from the first to the second pass is attributable to strain accumulation.
- The critical strains to dynamic transformation in the finishing passes were shown to be dependent on the number of roughing passes. Higher numbers of roughing strains led to lower values of critical strain to DT in the first finishing pass of the five-pass simulations. This value decreases from pass to pass due to retained work hardening from the previous pass.
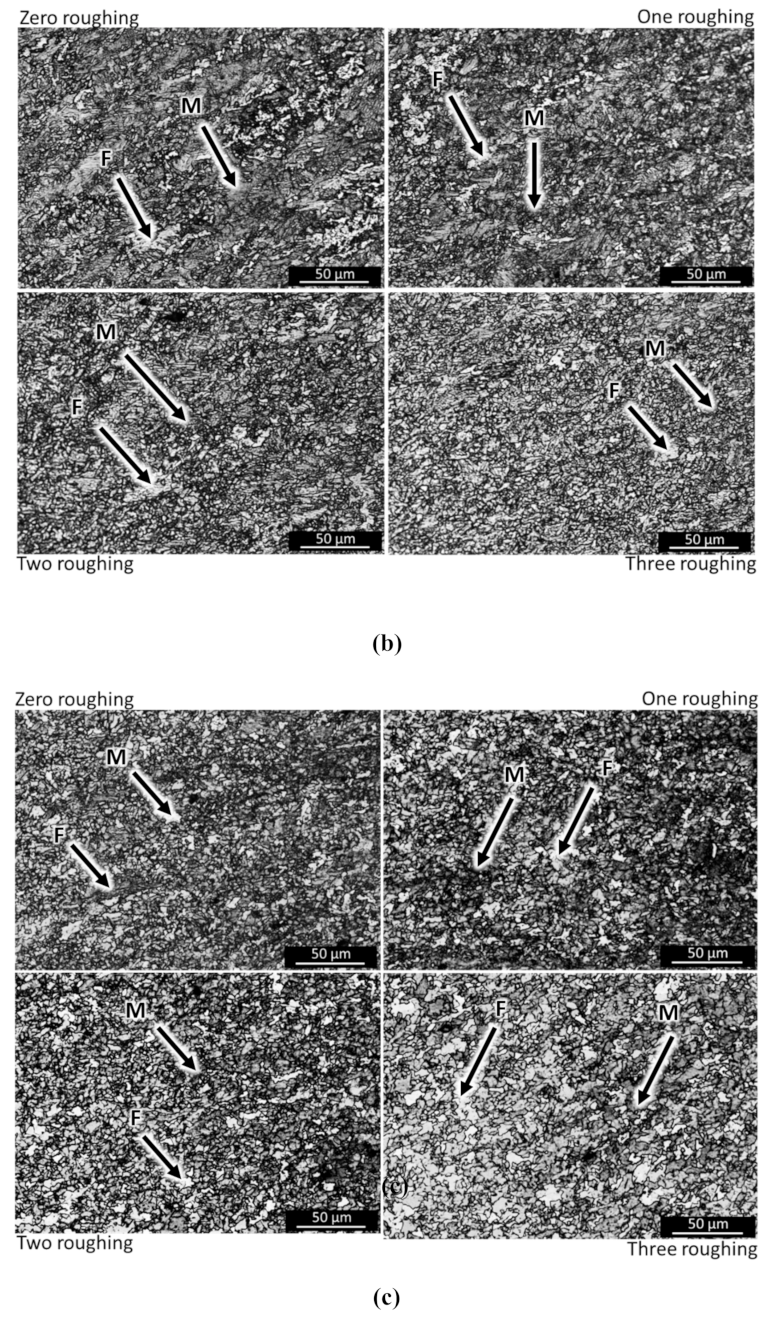
- Microstructure analysis showed that ferrite is mostly present in a polygonal form after each strain. This is a result of the displacive mechanism that occurs on the critical strain, which then coalesces diffusionaly into polygonal grains on continued straining.
Author Contributions
Funding
Acknowledgments
Conflicts of Interest
References
- Zhao, L.; Park, N.; Tian, Y.; Shibata, A.; Tsuji, N. Dynamic transformation mechanism for producing ultrafine grained steels. Adv. Eng. Mater. 2018, 20, 1701016. [Google Scholar]
- Matsumura, Y.; Yada, H. Evolution deformation of ultrafine-grained ferrite in hot successive deformation. Trans. ISIJ 1987, 27, 492–498. [Google Scholar]
- Yada, H.; Matsumura, Y.; Senuma, T. International conference on physical metallurgy of thermomechanical processing of steels and other metals Thermec ’88. In Proceedings of the 1st Conference Physical Metallurgy of Thermomechanical Processing of Steels and Other Metals, Tokyo, Japan, 6–10 June 1988; Tamura, I., Ed.; 1988; Volume 2, pp. 200–207. [Google Scholar]
- Yada, H.; Li, C.M.; Yamagata, H. Dynamic γ—A transformation during hot deformation in Iron-Nickel-Carbon alloys. ISIJ Int. 2000, 40, 200–206. [Google Scholar]
- Chen, Y.; Chen, Q. Dilatometric investigation on isothermal transformation after hot deformation. J. Iron Steel Res. Int. 2003, 10, 46–48. [Google Scholar]
- Liu, Z.; Li, D.; Lu, S.; Qiao, G. Thermal stability of high temperature deformation induced ferrite in a low carbon steel. ISIJ Int. 2007, 47, 289–293. [Google Scholar]
- Sun, X.; Luo, H.; Dong, H.; Liu, Q.; Weng, Y. Microstructural evolution and kinetics for post-dynamic transformation in a plain low carbon steel. ISIJ Int. 2008, 48, 994–1000. [Google Scholar]
- Ghosh, C.; Basabe, V.V.; Jonas, J.J.; Kim, Y.; Jung, I.; Yue, S. The dynamic transformation of deformed austenite at temperatures above the Ae3. Acta Mater. 2013, 61, 2348–2362. [Google Scholar] [Green Version]
- Aranas, C.; Nguyen-Minh, T.; Grewal, R.; Jonas, J.J. Flow softening-based formation of Widmanstatten ferrite in a 0.06%C steel deformed above the Ae3. ISIJ Int. 2015, 55, 300–307. [Google Scholar]
- Aranas, C.; Jonas, J.J. Effect of Mn and Si on dynamic transformation of austenite above the Ae3 temperature. Acta Mater. 2015, 82, 1–10. [Google Scholar]
- Grewal, R.; Aranas, C.; Chadha, K.; Shahriari, D.; Jahazi, M.; Jonas, J.J. Formation of Widmastatten ferrite at very high temperatures in the austenite phase field. Acta Mater. 2016, 109, 23–31. [Google Scholar]
- Basabe, V.V.; Jonas, J.J. The ferrite transformation in hot deformed 0.036% Nb austenite at temperature above the Ae3. ISIJ Int. 2010, 50, 1185–1192. [Google Scholar]
- Rodrigues, S.F.; Aranas, C.; Wang, T.; Jonas, J.J. Dynamic transformation of an X70 steel under plate rolling conditions. ISIJ Int. 2017, 57, 162–169. [Google Scholar]
- Rodrigues, S.F.; Aranas, C.; Jonas, J.J. Dynamic transformation during the simulated plate rolling of a 0.09% Nb steel. ISIJ Int. 2017, 57, 1102–1111. [Google Scholar]
- Rodrigues, S.F.; Aranas, C.; Jonas, J.J. Retransformation behavior of dynamically transformed ferrite during the simulated plate rolling of a low C and an X70 Nb steel. ISIJ Int. 2017, 57, 929–936. [Google Scholar]
- Rodrigues, S.F.; Aranas, C.; Siciliano, F.; Jonas, J.J. Dynamic transformation during the simulation of plate rolling in an X70 steel. Steel Res. Int. 2016, 88, 1600388. [Google Scholar]
- Rodrigues, S.F.; Aranas, C.; Sun, B.; Siciliano, F.; Yue, S.; Jonas, J.J. Effect of grain size and residual strain on the dynamic transformation of austenite under plate rolling conditions. Steel Res. Int. 2018, 89, 1700547. [Google Scholar]
- Rodrigues, S.F.; Siciliano, F.; Aranas, C.; Silva, E.S.; Reis, G.S.; Jahazi, M.; Jonas, J.J. Dynamic phase transformation behavior of a Nb-microalloyed steel during roughing passes at temperatures above the Ae3. Metals 2019, 9, 334. [Google Scholar]
- Aranas, C.; Wang, T.; Jonas, J.J. Effect of interpass time on the dynamic transformation of a plain C-Mn and Nb-microalloyed steel. ISIJ Int. 2015, 55, 647–654. [Google Scholar]
- Bale, C.W.; Belisle, E.; Chartrand, P.; Decterov, S.A.; Eriksson, G.; Hack, K.; Jung, I.H.; Kang, Y.Y.; Melancon, J.; Pelton, A.D.; et al. FactSage thermomechanical software and database-recent developments. Calphad 2009, 33, 295–311. [Google Scholar]
- Fields, D.S.; Backofen, W.A. Determination of strain hardening characteristics by torsion testing. Proc. Am. Soc. Test. Mater. 1957, 57, 1259–1272. [Google Scholar]
- Jonas, J.J. Modelling the length changes that take place during torsion testing. Int. J. Mech. Sci. 1993, 35, 1065–1077. [Google Scholar]
- Ghosh, C.; Aranas, C.; Jonas, J.J. Dynamic transformation of deformed austenite at temperatures above the Ae. Prog. Mater. Sci. 2016, 82, 151–233. [Google Scholar]
- Schneider, C.A.; Rasband, W.S.; Eliceiri, K.W. NIH Image to ImageJ: 25 years of image analysis. Nat. Methods 2012, 9, 671–675. [Google Scholar] [PubMed]
- Poliak, E.I.; Jonas, J.J. A one-parameter approach to determining the critical conditions for the initiation of dynamic recrystallization. Acta Mater. 1996, 44, 127–136. [Google Scholar]
- Aranas, C.; Rodrigues, S.F.; Fall, A.; Jahazi, M.; Jonas, J.J. Determination of the critical stress associated with dynamic phase transformation in steels by means of free energy method. Metals 2018, 8, 360. [Google Scholar]
- Aranas, C.; Shen, Y.; Rodrigues, S.F.; Jonas, J.J. Microstructural evolution of a C-Mn steel during hot compression Above the Ae3. Metall. Mater. Tran. A 2016, 47, 4357–4361. [Google Scholar]
- Aztec Reclassify Phase: Discriminating Phases in Steels; Oxford Instruments: High Wycome, UK, 2016; Available online: www.nano.oxinst.com (accessed on 19 July 2019).


| C | Mn | Si | Cr | Nb | N | Orthoequilibrium Ae3 | Paraequilibrium Ae3 |
|---|---|---|---|---|---|---|---|
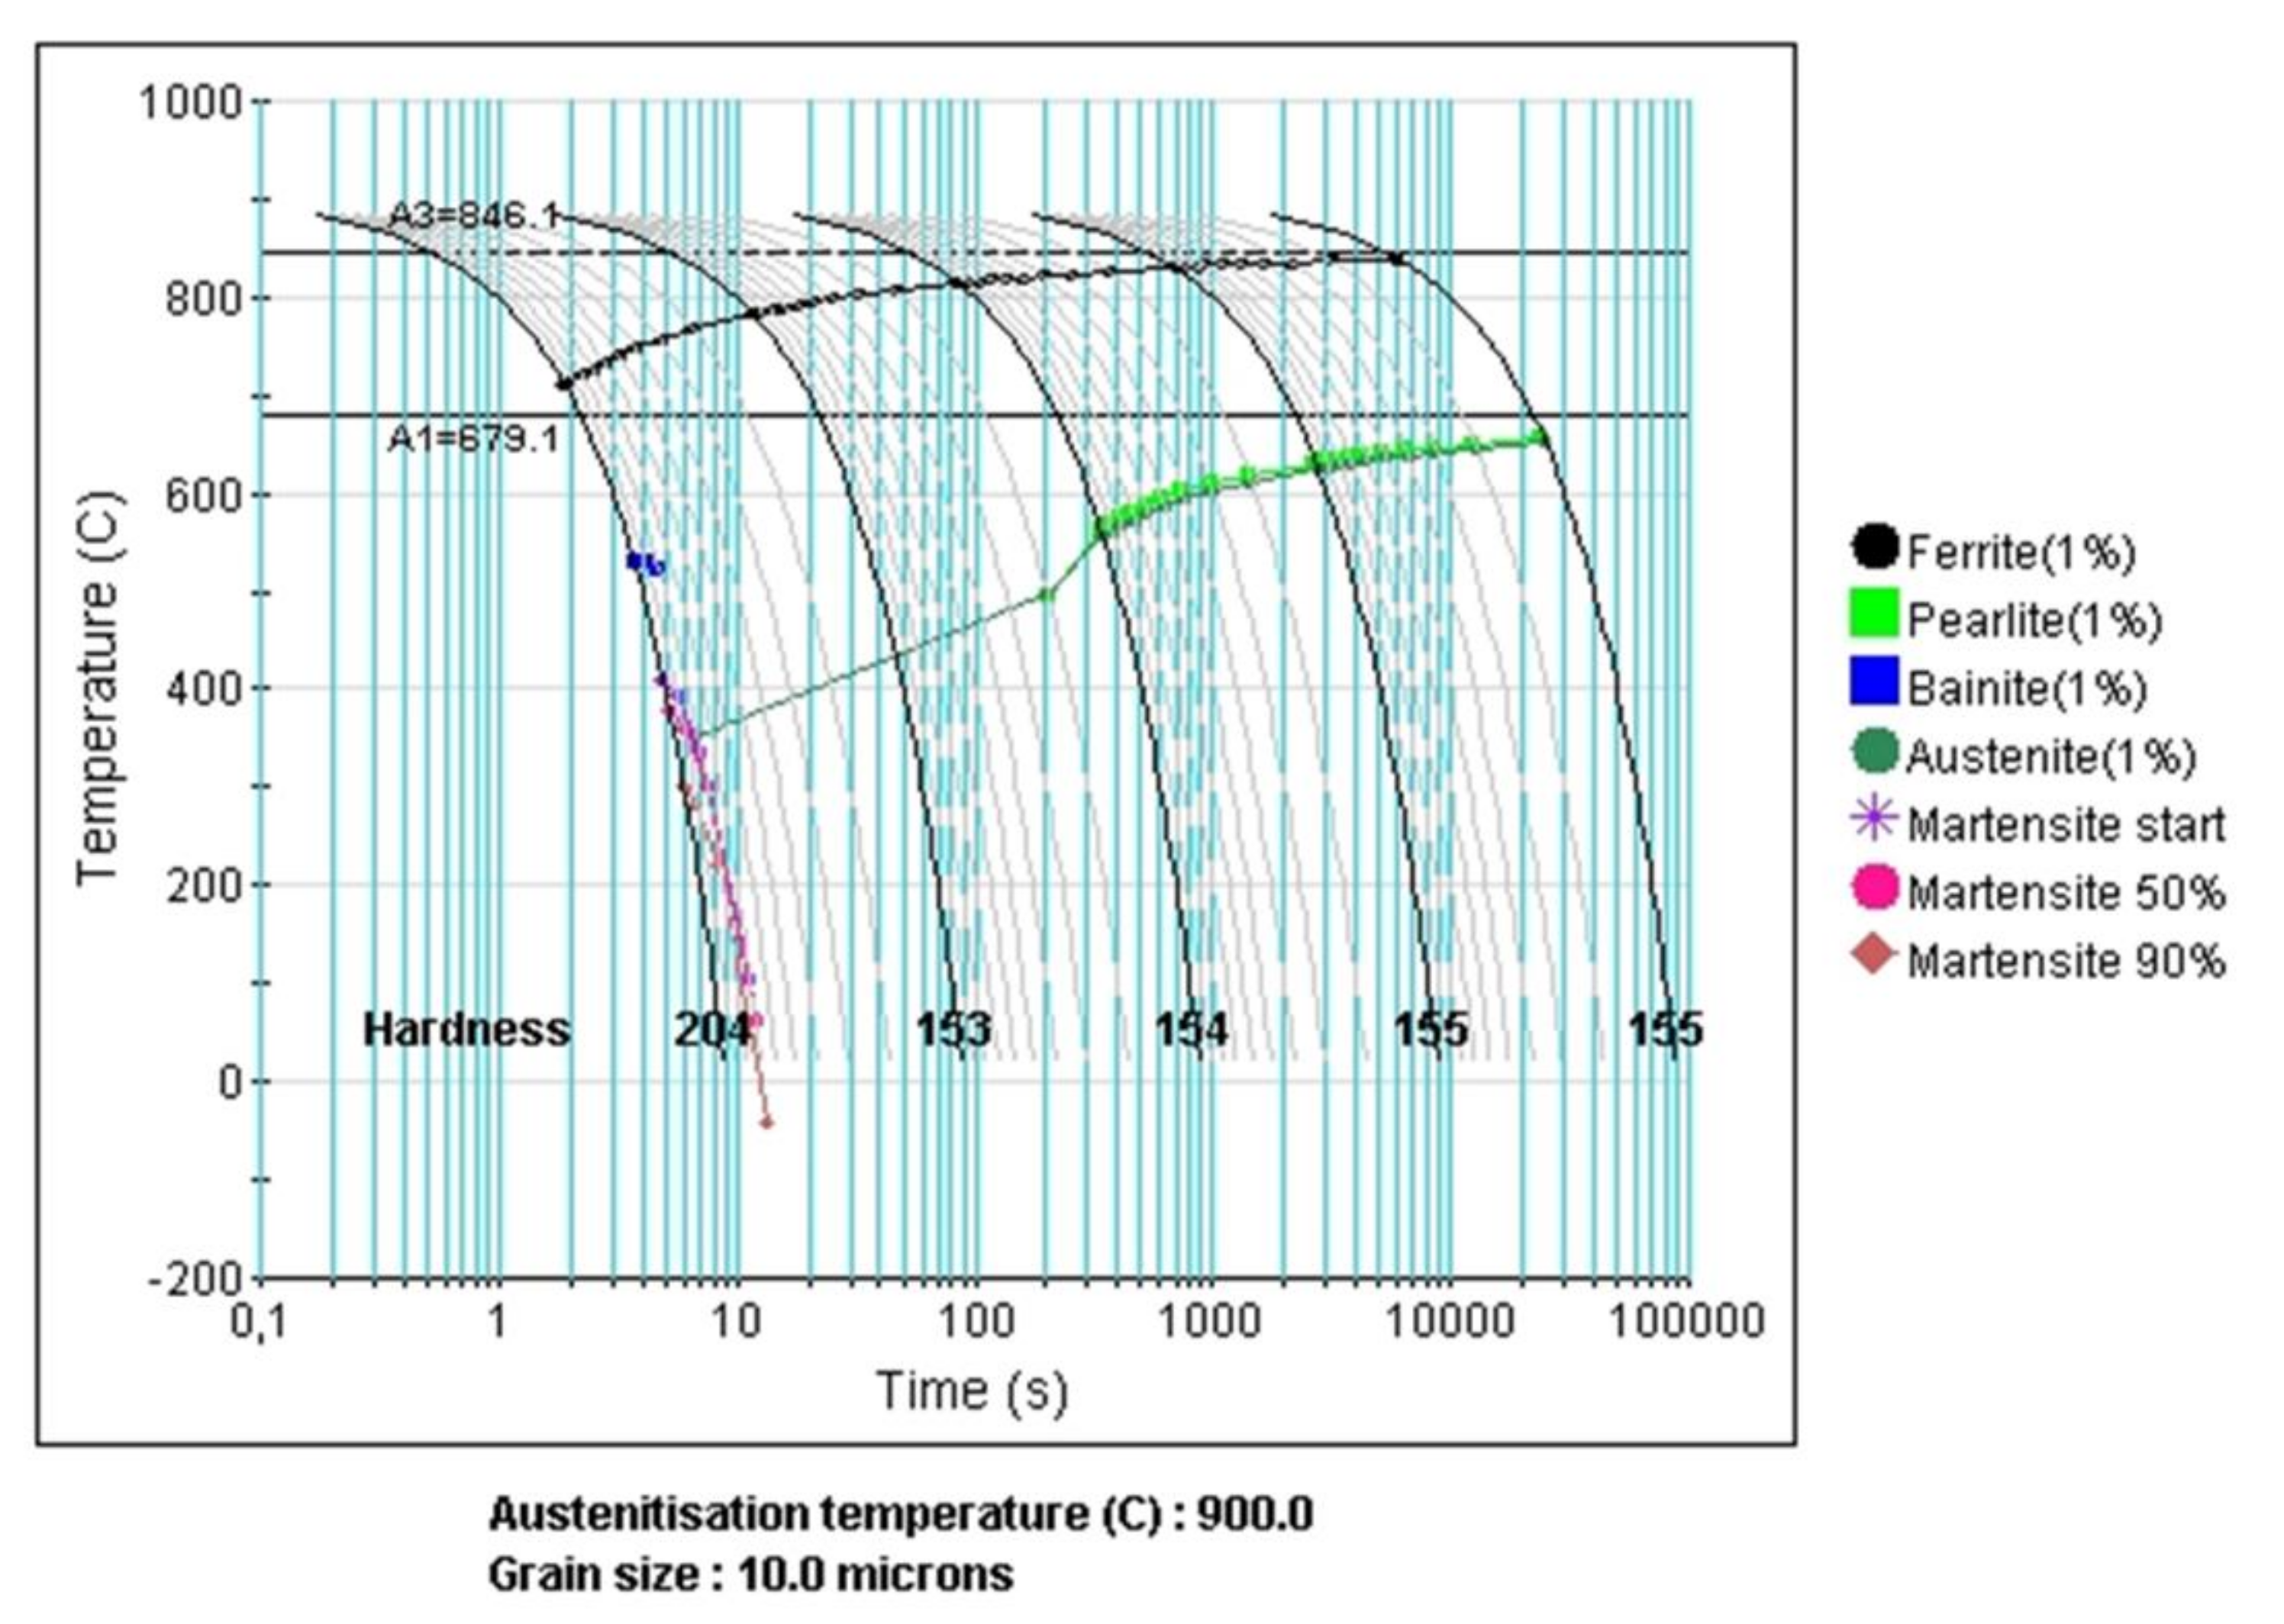
| 0.047 | 1.56 | 0.25 | 0.21 | 0.092 | 0.008 | 846.1 °C | 811.2 °C |
© 2019 by the authors. Licensee MDPI, Basel, Switzerland. This article is an open access article distributed under the terms and conditions of the Creative Commons Attribution (CC BY) license (http://creativecommons.org/licenses/by/4.0/).
Share and Cite
Palhano, H.B.; Aranas, C., Jr.; Rodrigues, S.F.; Silva, E.S.; Reis, G.S.; Miranda, E.J.P., Jr.; Siciliano, F.; Jonas, J.J. Strain-Induced Ferrite Formation During Steckel Mill Simulations with Varying Roughing Pass Schedules. Metals 2019, 9, 814. https://doi.org/10.3390/met9080814
Palhano HB, Aranas C Jr., Rodrigues SF, Silva ES, Reis GS, Miranda EJP Jr., Siciliano F, Jonas JJ. Strain-Induced Ferrite Formation During Steckel Mill Simulations with Varying Roughing Pass Schedules. Metals. 2019; 9(8):814. https://doi.org/10.3390/met9080814
Chicago/Turabian StylePalhano, Henry B., Clodualdo Aranas, Jr., Samuel F. Rodrigues, Eden S. Silva, Gedeon S. Reis, Edson Jansen P. Miranda, Jr., Fulvio Siciliano, and John J. Jonas. 2019. "Strain-Induced Ferrite Formation During Steckel Mill Simulations with Varying Roughing Pass Schedules" Metals 9, no. 8: 814. https://doi.org/10.3390/met9080814