Article

Microstructure of Low-Temperature Gas-Carbonitrided Layers on Austenitic Stainless Steel

by
Paweł Kochmański
*,
Jolanta Baranowska
and
Sebastian Fryska
Institute of Materials Science and Engineering, West Pomeranian University of Technology, 70-310 Szczecin, Av. Piastów 19, Poland
*
Author to whom correspondence should be addressed.
Metals 2019, 9(8), 817; https://doi.org/10.3390/met9080817
Submission received: 14 June 2019 / Revised: 22 July 2019 / Accepted: 23 July 2019 / Published: 25 July 2019

Abstract

:
This paper presents the results of microstructural examinations on gas carbonitrided layers using scanning electron microscopy (SEM), wavelength dispersive spectrometry X-ray microanalysis (WDS), magnetic force microscopy (MFM), electron backscattered diffraction (EBSD), and X-ray diffraction. The main objective of the work is to discuss the microstructural and morphological changes occurring in the layers depending on the process parameter such as temperature and atmosphere composition. The carbonitrided layers comprise two sublayers: an outer layer enriched in nitrogen and an inner layer enriched in carbon. It is found that both the microstructure and the thickness depend on the technological parameters of the thermochemical treatment. The treatment temperature is particularly important, increasing both the total and the nitrogen-rich sublayer thickness regardless of the atmosphere type. The nitrogen potential has a positive influence on the thickness of the nitrogen-stabilised S-phase sublayer. Layers treated for 5 h at temperatures of 400 and 450 °C are composed of an internal carbon-enriched S-phase sublayer and an outer nitrogen-enriched S-phase sublayer that can be divided into ferromagnetic and paramagnetic zones. In the outer sublayer, symmetry distortion of the fcc crystal system is observed and stacking faults may have occurred. With layers produced at 500 °C for 5 h, the outer nitrogen-enriched sublayer contains fine precipitates of nitrides and carbides.

1. Introduction

Austenitic stainless steel is a widely used structural material for applications where high corrosion resistance is required, particularly in medical, chemical, and food processing industries. However, due to insufficient low hardness and wear resistance, its application is often limited. Increasing the mechanical properties of such steel is possible through the use of surface treatment such as nitriding or/and carburization. The diffusive layers formed at temperatures above 500 °C are mostly composed of carbides and/or nitrides, which negatively affect the corrosion resistance of the steel [1,2,3]. Therefore, the so-called low temperature treatment is of particular industrial interest. It is found that if the process of treatment is conducted below 500 °C, the formation of a new phase takes place [4,5]. This phase, called “expanded austenite” or “S-phase” demonstrates not only good mechanical properties such as hardness or wear resistance but also has the corrosion properties comparable with those of austenitic stainless steel [2,6,7,8]. The S-phase is considered to be [5,9,10] a supersaturated solid solution of interstitials, i.e., nitrogen and/or carbon in austenite, and its mechanical and corrosive properties depend on the nitrogen or carbon content dissolved in austenite [1,11]. The majority of scientific research in this area concerns the surface treatment of austenitic stainless steels due to their excellent corrosion resistance, although there are also some published works on surface treatment of other types of stainless steels such as high chromium and precipitation-hardening steels [12,13,14,15,16].
Low temperature nitriding and carburizing both have disadvantages, for example, the hardness of their carburised layers being too low or the stress gradient of their nitrided layers being very large. For these reasons, low-temperature carbonitriding (nitrocarburizing) has been developed over the last decade as an alternative for single element treatment [17,18,19]. Since carbonitrided layers have a higher surface hardness and a lower hardness gradient towards the core compared to carburised and nitrided layers, their wear resistance and bearing performance are improved. The microstructure of nitrided and carburised layers on austenitic stainless steels is well-described in the literature [18,20,21,22,23,24]. However, microstructural characterization of gas carbonitrided layers, although present [10,25,26], is not detailed.
The main objective of the work described in this paper is to characterize the microstructure of carbonitrided layers on austenitic stainless steel. The layers are produced using a hybrid method, i.e., gas thermochemical treatment preceded by ion sputtering surface activation [27], for variations of the technological treatment parameters.

2. Experimental Procedure

2.1. Protocol for Production of the Carbonitrided Diffusion Layers

Diffusion carbonitrided layers were produced on X10CrNi18-8 (1.4310/AISI 302) austenitic stainless steel of the chemical composition given in Table 1. Samples were cut from a plate and solution treated at 1000 °C for 3 h to remove plastic deformation features. The samples, of dimensions 20 mm × 10 mm × 5 mm, were mechanically ground and polished to a roughness of Ra = 0.05 µm. To remove any surface layers that may have been strained by the mechanical methods, electrochemical polishing was used as the final surface preparation. The electropolishing was conducted in a mixture of diethyl ether–175 mL, methanol–75 mL, and perchloric acid–100 mL, at the following parameters: temperature −20 °C, time 90 s, current density 0.2 A/cm2, and voltage 10 V. The samples were cleaned ultrasonically in acetone prior to surface treatment.
The layers were produced using non-commercial equipment constructed at the West Pomeranian University of Technology [28]. The surface treatment consisted of two stages: ex-situ physical activation and gas carbonitriding. Pure hydrogen plasma sputtering was applied as the activation method. This ion sputtering was conducted in a separate chamber connected via a canal lock with a quartz retort of volume 0.012 m3. Quartz was used here to avoid ammonia dissociation onto the walls of the retort. Before the ion sputtering process, the activation chamber was evacuated with a Roots vacuum pump with a pressure level of 0.26 Pa and then purged with hydrogen. Hydrogen of 5.0 purity was additionally purified with “Superpure-O” oxygen producer to produce an impurity content of below 1 ppb. The gas pressure during ion sputtering was changed within a the range from 2 to 7 Pa in order to maintain the required value of current density. The activation process was conducted in two stages: a low current density of 0.5 mA/cm2 was applied initially to achieve “sparking out”, followed by the actual activation at 3.5 mA/cm2 for 15 min. A DC (direct current) power supply operating at the voltage of circa 1300 V was applied.
After activation, the samples were transferred through the canal lock into the retort where the required gas treatment parameters of temperature and gas mixture were already established. The gas mixture composition was prepared by mixing pure ammonia or partially dissociated ammonia (produced in an external thermal dissociation equipment) with acetylene. The linear flow rate of the gas mixture was maintained at a level of 1 cm/s. The temperature of the furnace was controlled with an accuracy of ±2 °C. The degree of ammonia dissociation was measured in the exhaust gas using a conventional dissociometer. The acetylene level was maintained experimentally at 2 vol. % in order to provide as high a carbon potential as possible without causing sooting. Once the treatment was completed, the samples were moved into a room temperature zone of the retort to cool. The parameters of the thermo-chemical treatment used for the different samples are given in Table 2.

2.2. Characterization Protocol

After mechanical precision cutting, the samples were nickel plated electrochemically in order to protect the edges during further preparation. The samples were mounted in a conductive resin (Polyfast, Struers, Ballerup Denmark) and mechanically ground and polished using a 0.25 µm diamond suspension. This was followed by polishing using a vibratory machine (Struers) with a silica suspension for approximately 1 h. Low angle (7°) argon ion milling (Flat Milling System IM-3000, Hitachi, Japan) was the final stage of the sample preparation procedure for EBSD (electron backscattered diffraction), X-ray microanalysis, and MFM (magnetic force microscopy). Microstructures on cross-sections were revealed chemically using Aqua regia etchant.
The manufactured diffusion layers were examined using an FE-SEM SU-70 microscope (Hitachi, Naka, Japan) and WDS (wavelength dispersive spectrometry)/EDS (energy dispersive spectrometry) X-ray microanalysis and EBSD using the NORAN™ System 7 from Thermo Fisher Scientific (Madison, WI USA). The latter consisted of Magnaray (WDS)-, UltraDry X-ray detector (EDS)-, and QuasOr (EBSD)-integrated components. The WDS analysis was performed at an accelerating voltage of 10 kV and an electron beam current of approximately 20 nA using CrSc80, NiC80, and TAP diffracting crystals for nitrogen, carbon, and oxygen, respectively. The WDS quantitative analytical procedures were based on the following standards: Cr2N, WC, and Cr2O3 for nitrogen, carbon, and oxygen, respectively. Net count elemental mappings were acquired with a resolution of 1024 by 768 and a pixel size of 0.04 µm. Quantitative profiles of nitrogen and carbon concentrations in the layers were derived from the WDS point analysis. For each position of the distance from the surface, three analyses were performed, and the average values are presented in the graphs. The first points in the graphs originate from analysis acquired on the surfaces of the coatings. The “PROZA” correction method was applied for WDS quantitative analysis, and the estimated standard uncertainty for the WDS measurements was 0.05 wt. %.
EBSD crystal orientation maps were acquired at the accelerating voltage of 20 kV, a working distance of 15 mm and an exposure time in the range from 84 to 115 ms. Shorter exposure times were sufficient for the austenitic substrate, but longer times were required in order to provide clear diffraction patterns for the layers. The resolution of the EBSD maps was 512 by 384, and the pixel size was 0.12 µm. A 2 × 2 pixel binning was applied. Seven Radon lines were used in the indexing process. No software enhancement of the maps was performed on the results presented in this article.
Magnetic force microscopy (MFM) imaging was conducted using a Nanoscope IV (Veeco, Plainview, NY, USA). An MESP type probe coated with CoCr was used after magnetization with an external magnet. The “lift mode” with a sample–probe distance of 100 nm was applied to the imaging. Areas of dimensions 40 μm × 40 μm and 15 μm × 15 μm were scanned, depending on the thickness of the layer.
All WDS, EDS, EBSD, and MFM examinations were performed on flat (not etched) sample surfaces.
X-ray diffraction (XRD) phase analysis was performed using CoKα, using X-ray tube parameters of 35 kV and 45 mA and a Bragg–Brentano geometry (X’Pert–PRO, Panalytical, Almelo, The Netherlands). The applied step of the goniometer was 0.05°, and the acquisition time was 200 s. The acquired data was processed using X’Pert HighScore (v. 2.2.1) software provided by Panalytical.

3. Results and Discussion

All of the carbonitrided layers produced comprised two major sublayers: an external layer enriched in nitrogen (Figure 1a,b, Figure 2a,b, Figure 3a,b, Figure 4a,b, Figure 5a,b and Figure 6a,b) and an internal layer enriched in carbon (Figure 1a,c, Figure 2a,c, Figure 3a,c, Figure 4a,c, Figure 5a,c and Figure 6a,c). The microstructure and thickness of the layers depended on the technological parameters of the thermo-chemical treatment. The greatest influence was found to be exerted by the treatment temperature. Both the total layer thickness and the thickness of the nitrogen-rich sublayer increased exponentially with temperature regardless of the atmosphere used (Figure 7). The total layer thickness responded in a similar way to the treatment temperature for both atmospheres. However, the nitrogen potential had a positive influence on the thickness of the external nitrogen-rich sublayer; this was observed for all of the analysed layers.
In general, the layers produced can be divided into two groups: those produced at temperatures of up to 450 °C and those produced above this temperature. In the first case, the carbonitrided layers were precipitation-free dual-layer structures that were resistant to chemical etching, especially the carbon-rich sublayer (Figure 1a,c, Figure 2a,c, Figure 3a,c and Figure 4a,c). However, the authors are aware that the presence of precipitates of nitrides and carbides is also related to process duration [19,29]. This means that if the process time was increased, nitride and carbide precipitates may well have formed.

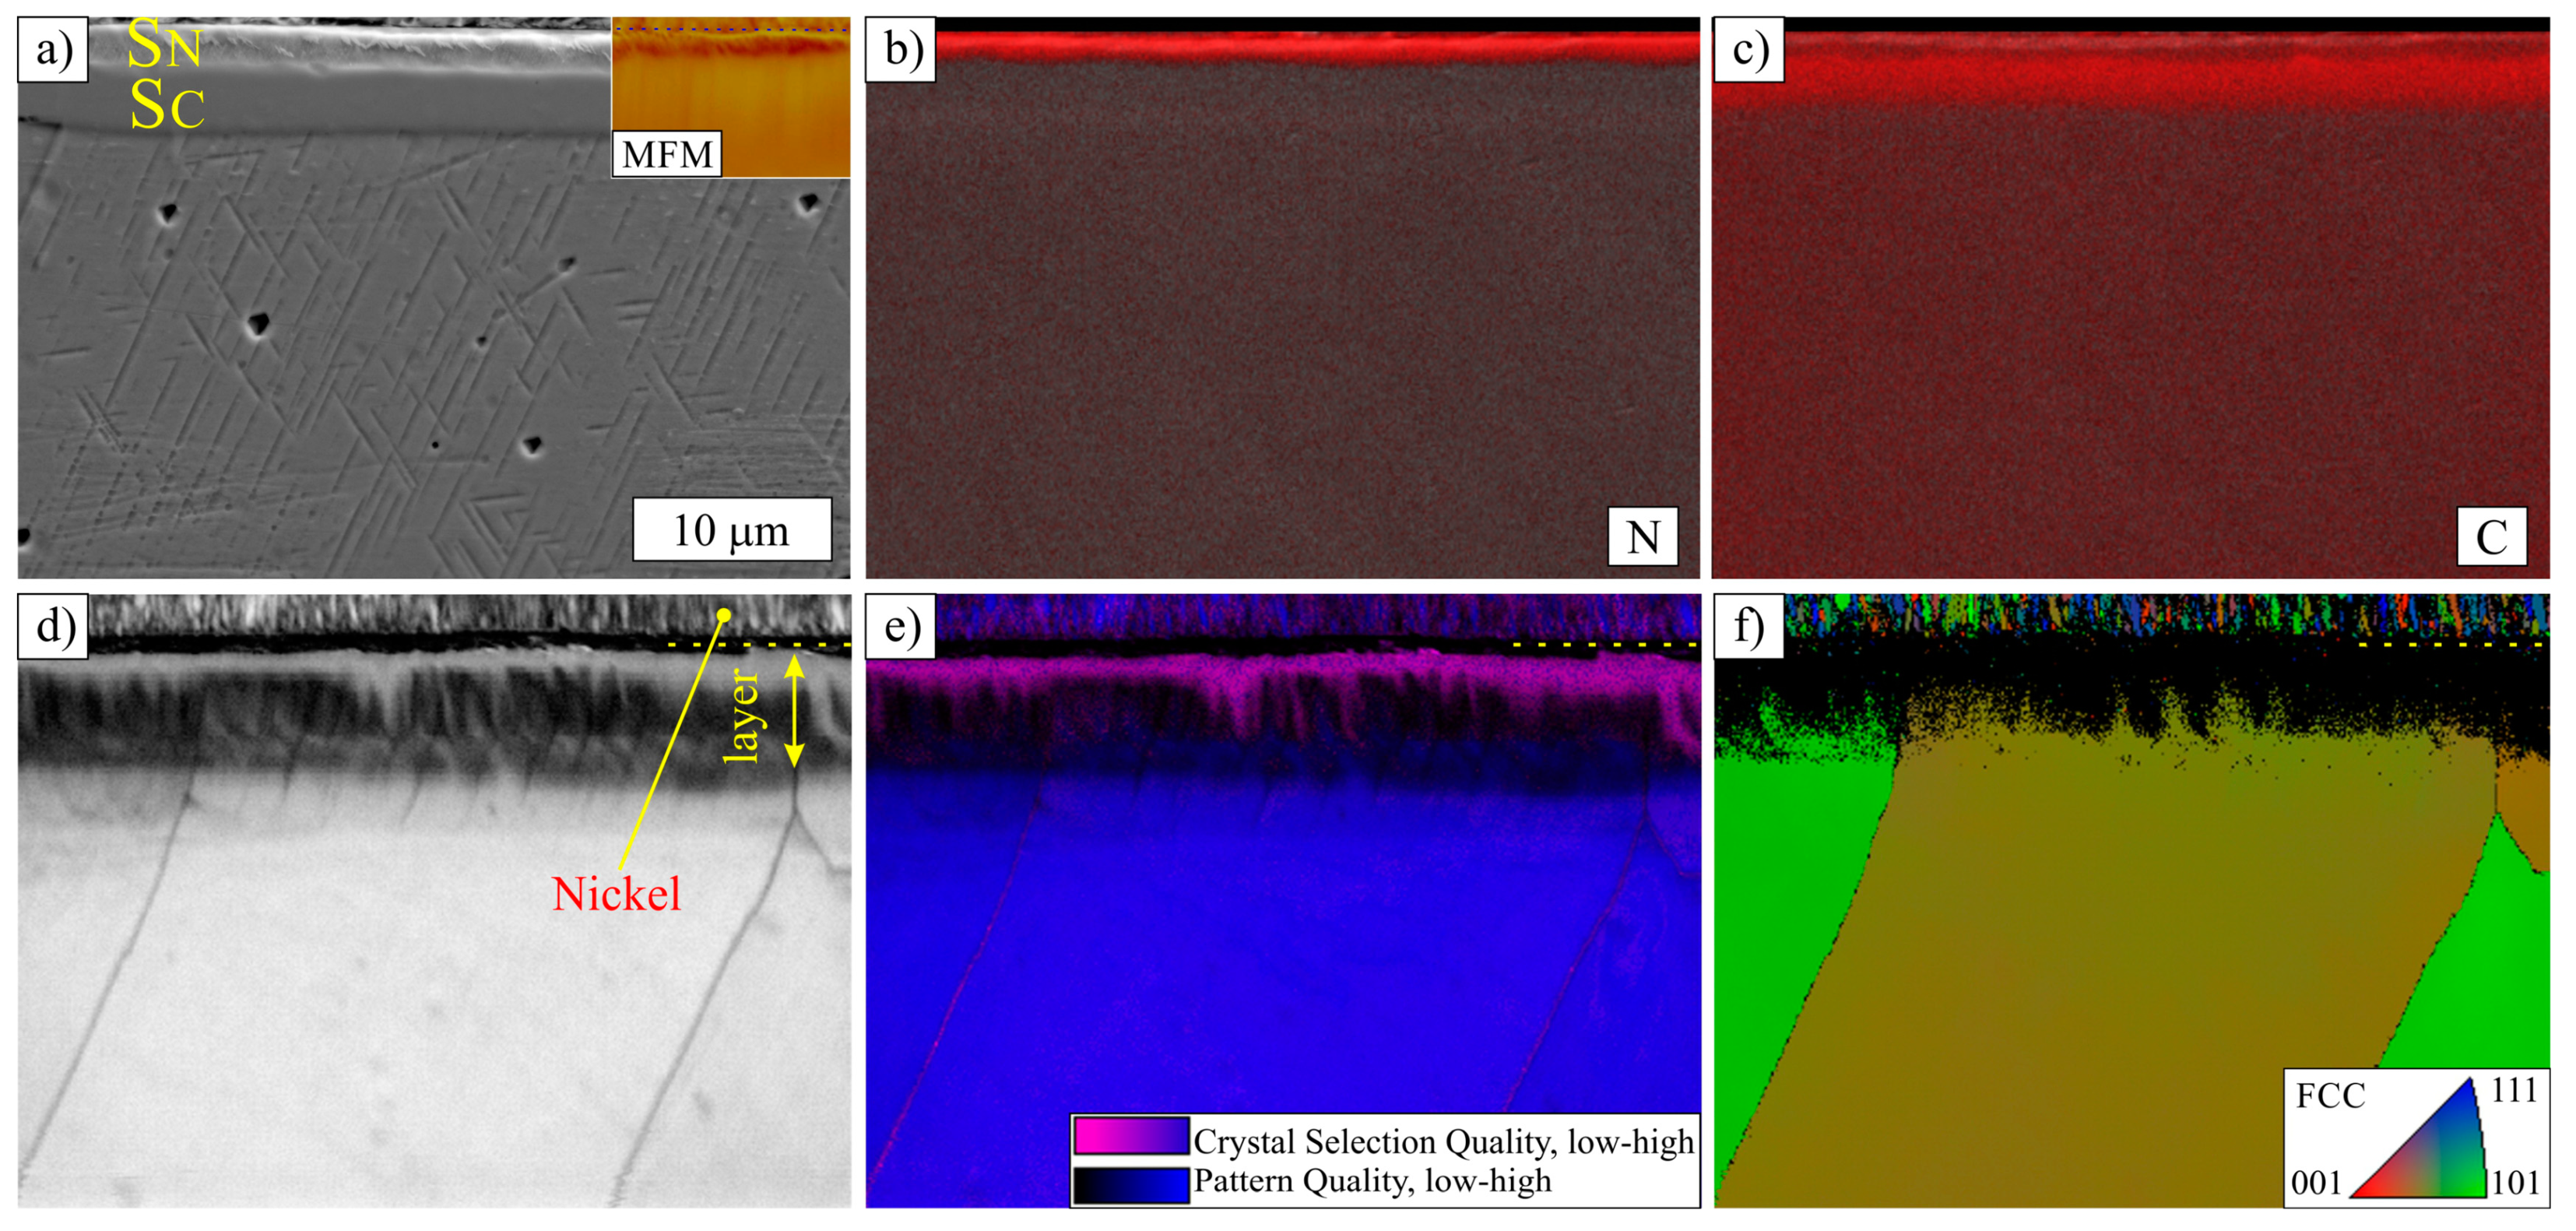
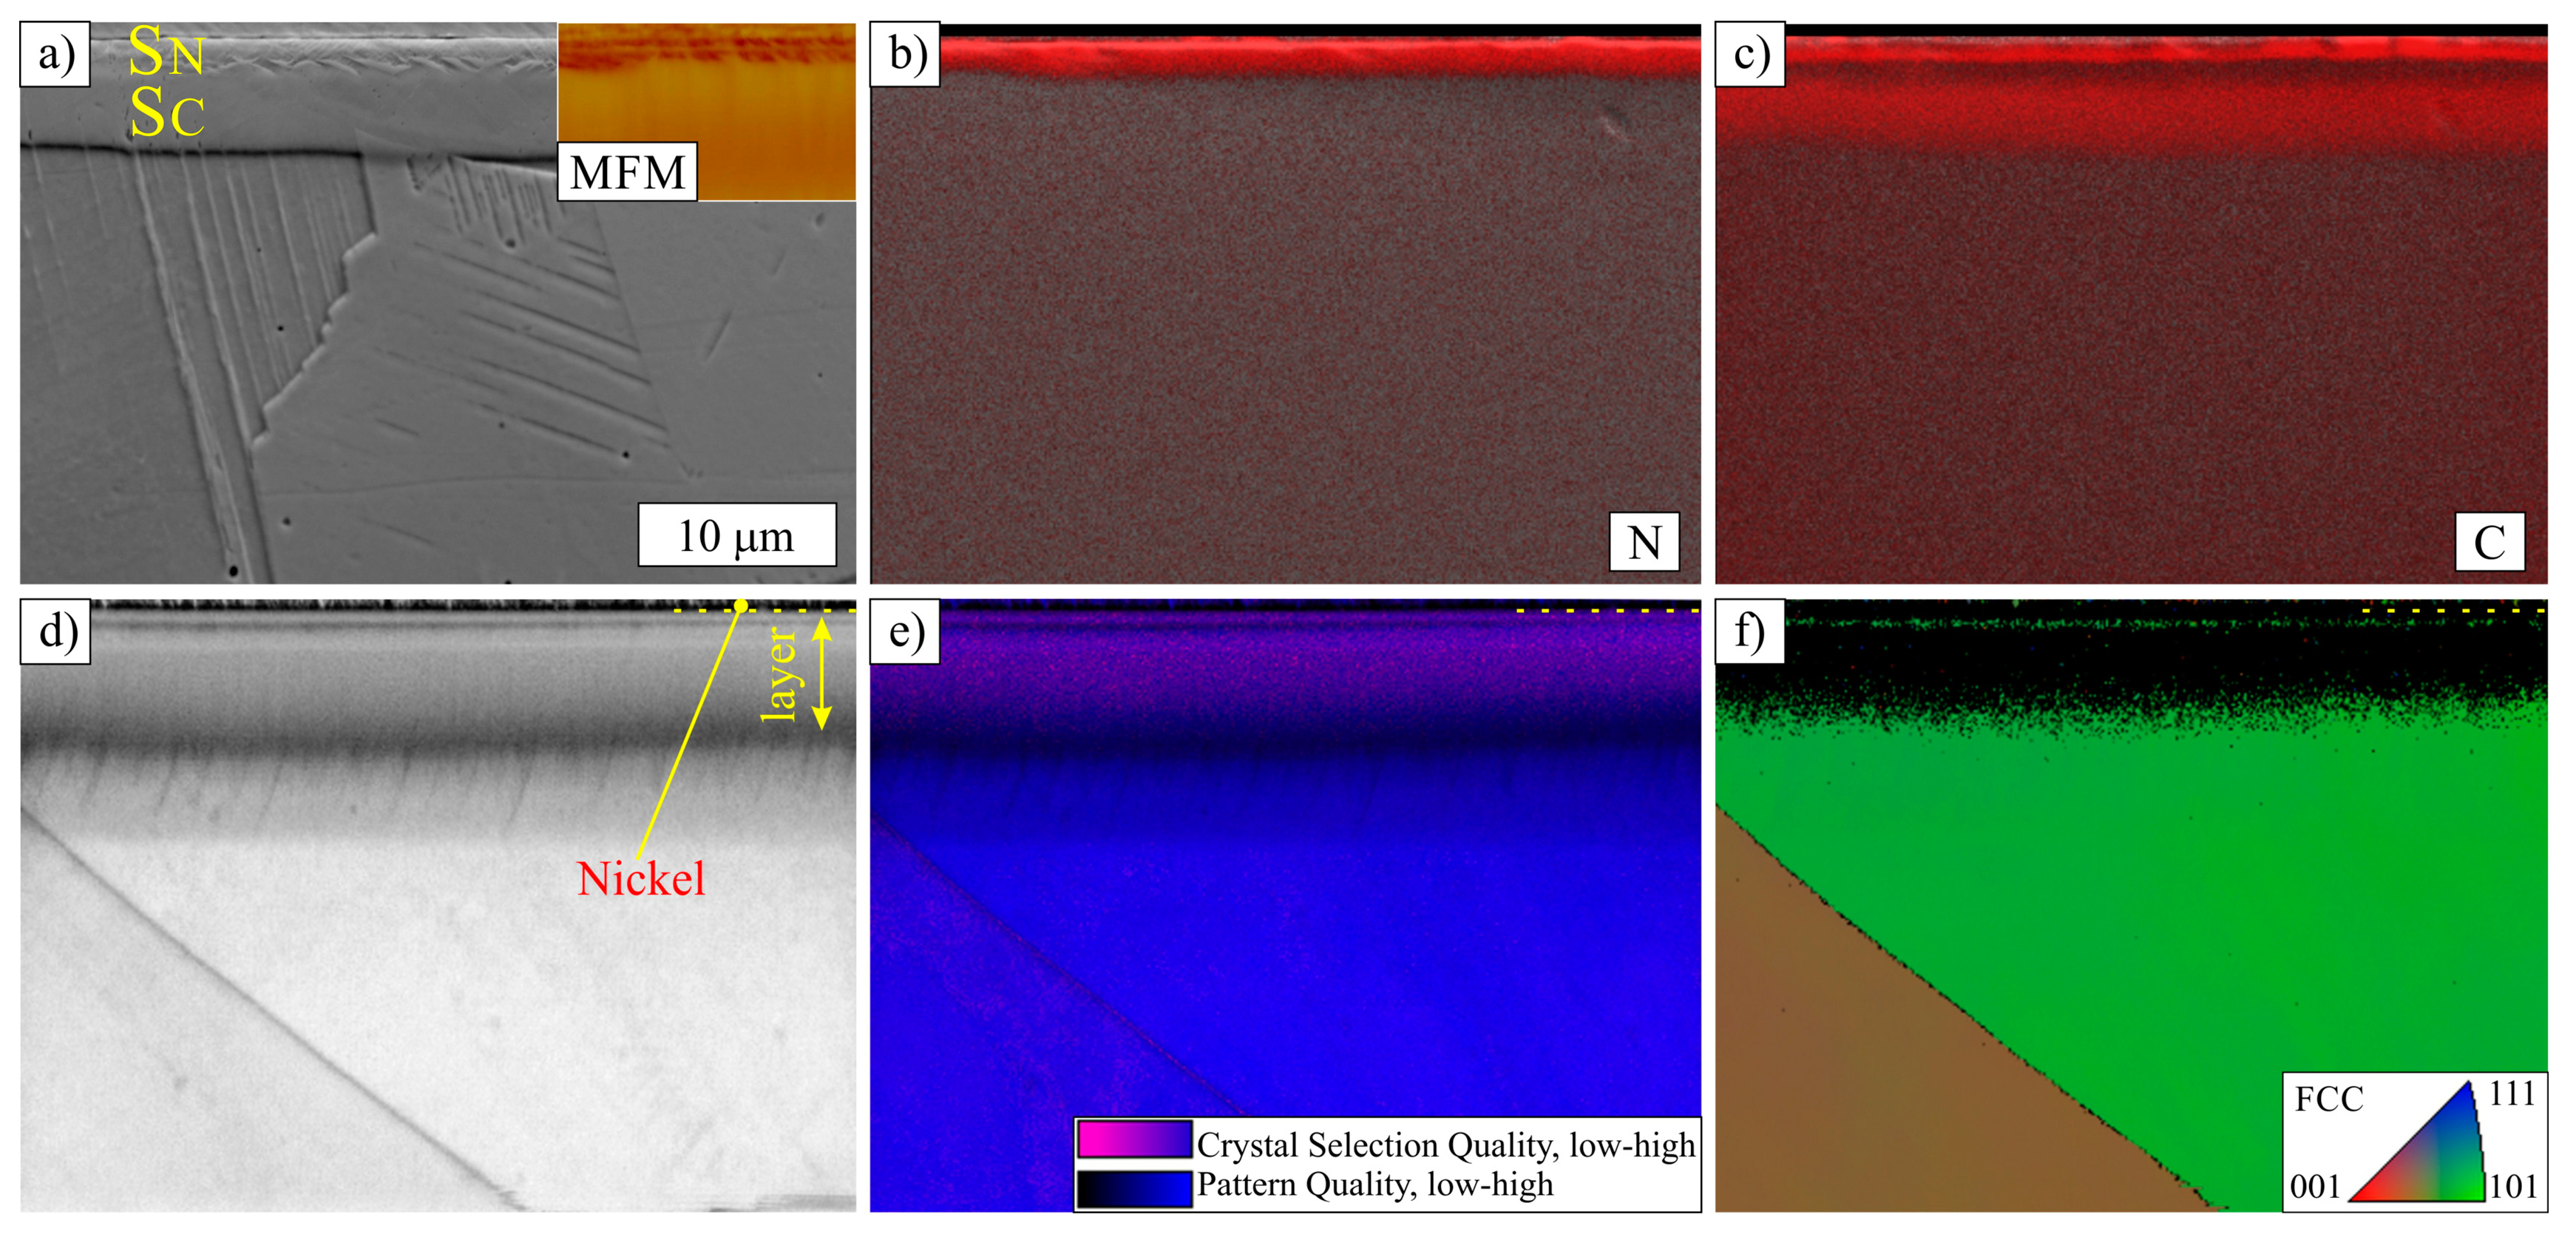
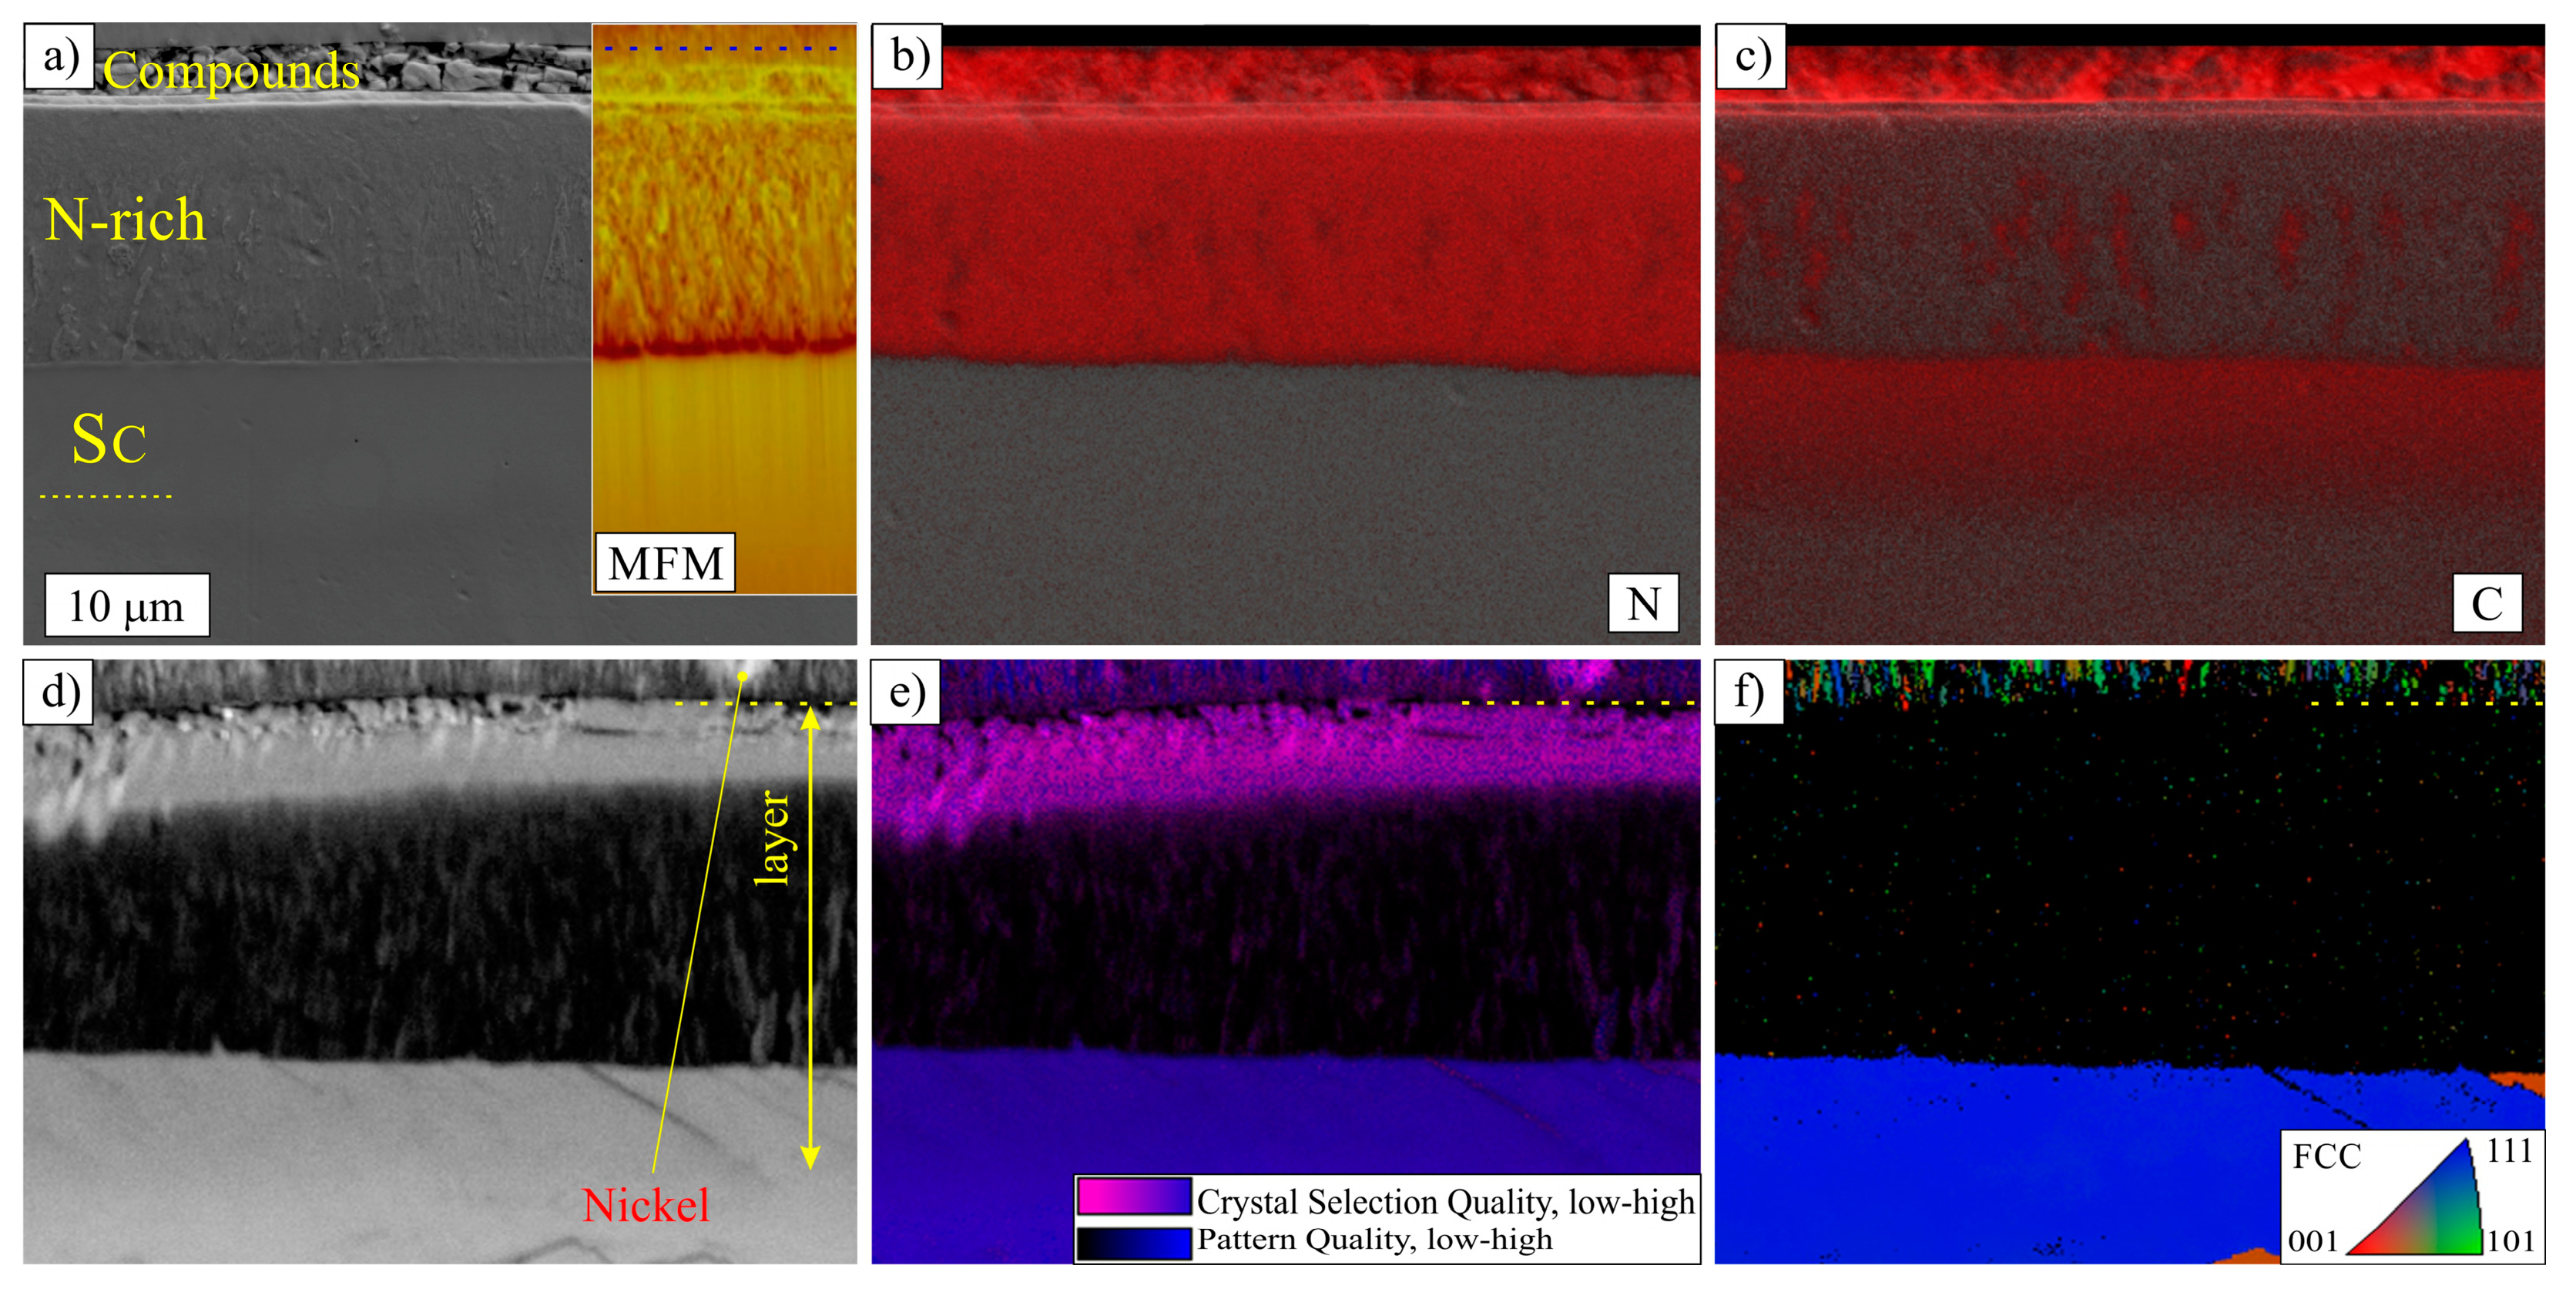
3.1. Layers Treated at 400 and 450 °C

In treatments carried out at 400 °C, the nitrogen potential had no significant effect on the thickness of the sublayers (Figure 7 and Figure 8a,b). For a treatment temperature of 450 °C, a higher nitrogen potential of the atmosphere led to the formation of a thicker nitrogen-rich sublayers that also contained more nitrogen (Figure 3a–c, Figure 4a–c and Figure 8c,d), i.e., a greater ammonia content in the atmosphere led to a higher maximum nitrogen concentration in the layer and a thicker nitrogen-stabilised S-phase sublayer. On the other hand, the thickness of the carbon-rich sublayer was greater for a treatments carried out in a lower nitrogen potential atmosphere. The maximum content of nitrogen, c.a. 6.5 wt. %, was measured for layers produced in an atmosphere containing 98% ammonia at both temperatures (Figure 8b,d). The quantitative WDS X-ray microanalysis profiles for nitrogen and carbon distribution on the layer’s cross-sections were consistent with the qualitative WDS maps (Figure 1b,c, Figure 2b,c, Figure 3b,c and Figure 4b,c) and also with the results reported by other researchers [10,17,19,25,26]. A greater concentration of carbon was present near the surface and within the carbon-stabilised S-phase sublayer. The root cause of such a shape of the carbon profile in carbonitrided layers has not yet been explained convincingly in the literature [26,30].
The results of the XRD studies (Figure 9 and Figure 10) confirm the presence of both nitrogen and carbon-stabilised S-phases in layers treated at temperatures of 400 and 450 °C. Due to the use of the CoKα X-ray wavelength, diffraction peaks originating from the austenitic substrate were still visible in the thinnest layers produced at 400 °C. For layers treated at a temperature of 450 °C, shifts in the position of the diffraction peaks towards lower angles (larger interplanar distances) were observed compared to those produced at 400 °C for both process atmospheres. The diffraction peaks originating from the carbon-rich S-phase of the layer treated at 450 °C and 98% ammonia were difficult to distinguish due to the increased external nitrogen-rich S-phase sublayer attenuating X-rays reflected from the more deeply located sublayer.
In all examined samples, a significant ferromagnetic contrast was observed in the part of nitrogen-rich S-phase area that had the highest nitrogen content (Figure 1a, Figure 2a, Figure 3a and Figure 4a). The carbon-rich S-phase and the low nitrogen concentration layers did not reveal ferromagnetism due to a smaller crystal lattice deformation. The minimum fcc lattice expansion needed to exhibit the ferromagnetic state is 5% [21,27]. Brink et al. [31] observed ferromagnetism in a nitrogen-stabilized S-phase of intermediate nitrogen content (interstitial occupancy of N: yN = 0.29 – 0.39), contrary to low (yN = 0.13) and high nitrogen content (yN = 0.55).
EBSD pattern quality maps acquired from the layers carbonitrided at both 400 and 450 °C were generally similar, i.e., deterioration of the quality was observable, especially in the nitrogen-enriched S-phase sublayers (Figure 1d, Figure 2d, Figure 3d, Figure 4d, Figure 5d and Figure 6d). The decreased pattern quality in this sublayer had a gradient character different to the layers treated at 500 °C (see Section 3.2). EBSD pattern quality maps provide interesting microstructural information about the depth of the strain and stress induced as a result of surface treatment. Dark-appearing slip planes and a general decrease in the pattern quality could be distinguished in the material beneath the metallographically visible boundary of the carbon-stabilised expanded austenite. This was more distinct in the layers treated at 400 °C. For evaluating the EBSD patterns, fcc, bcc, and hcp crystal systems were assumed. In Figure 1e, Figure 2e, Figure 3e and Figure 4e, maps of “crystal selection quality” have been combined with the maps of pattern quality (Figure 1d, Figure 2d, Figure 3d and Figure 4d). Generally, in the regions of low pattern quality it was difficult to identify the crystal structure and low quality of the crystal selection was observable. The EBSD analytical system showed that the best compatibility was with the fcc crystal system (Figure 1f, Figure 2f, Figure 3f and Figure 4f); however, some areas with low pattern and low crystal selection quality and austenite grain boundaries were qualified as hcp structure. This fact would confirm the stacking fault theory concerning the nature of expanded austenite suggested by Fewell et al. [22]. On the other hand, it has been shown that the non-stressed S-phase (both nitrogen- and carbon-stabilised) has fcc unit cells [18,23]. Nevertheless, in light of the presented EBSD results it is clear that the symmetry of the fcc crystal system is distorted and stacking faults may be induced as a result of low temperature carbonitriding.

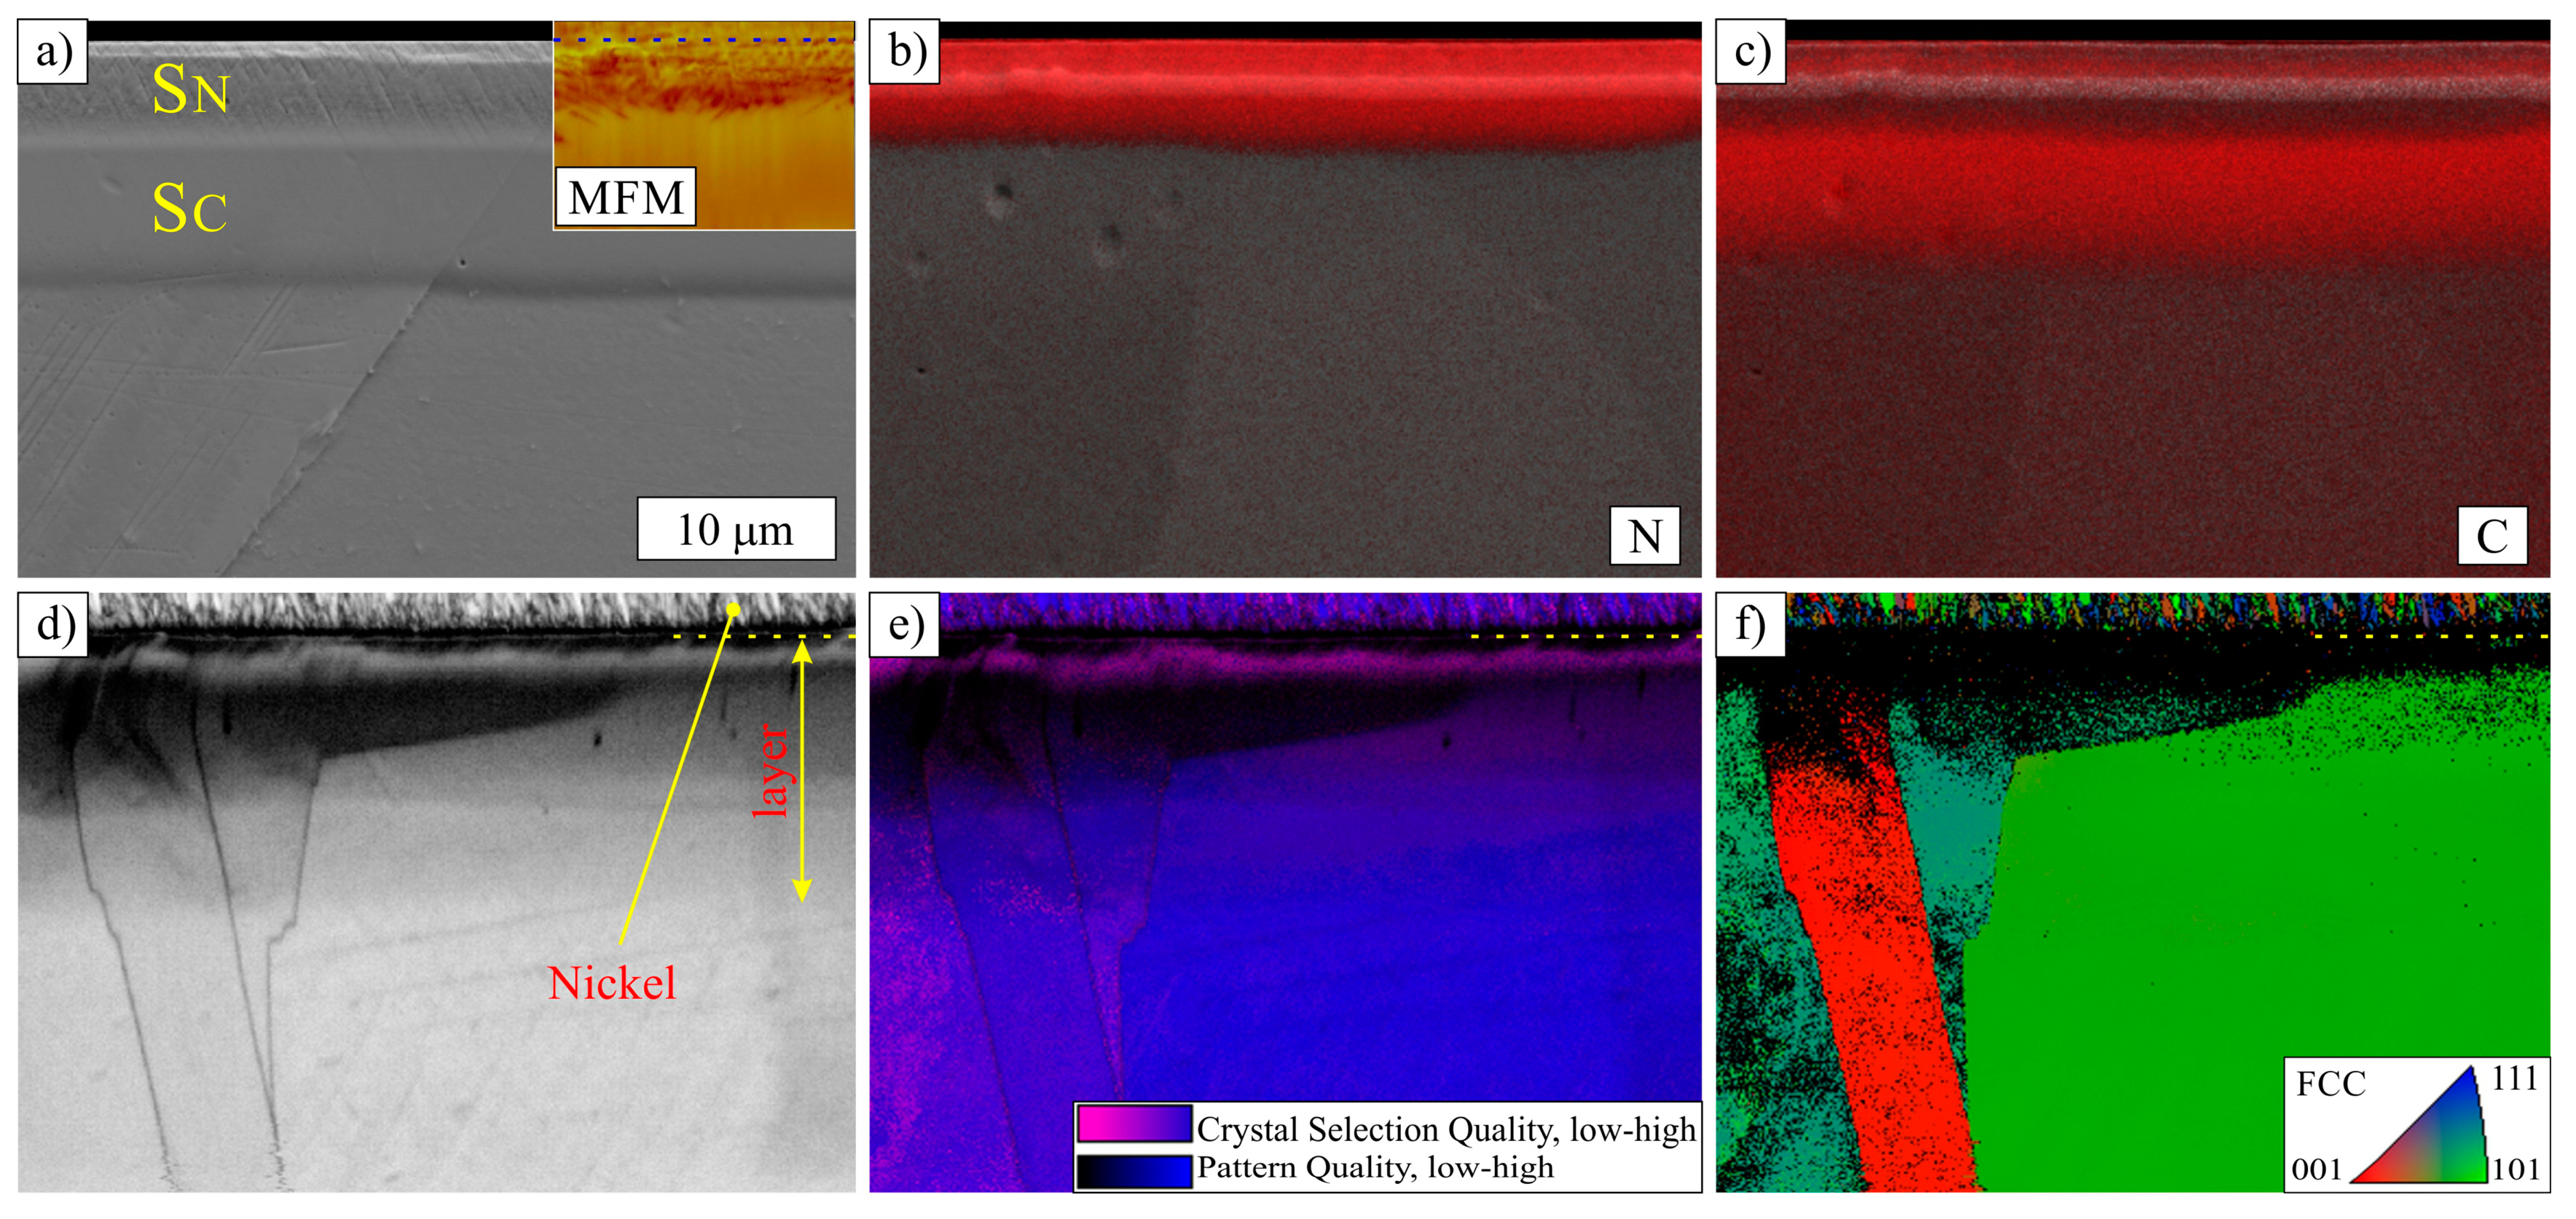
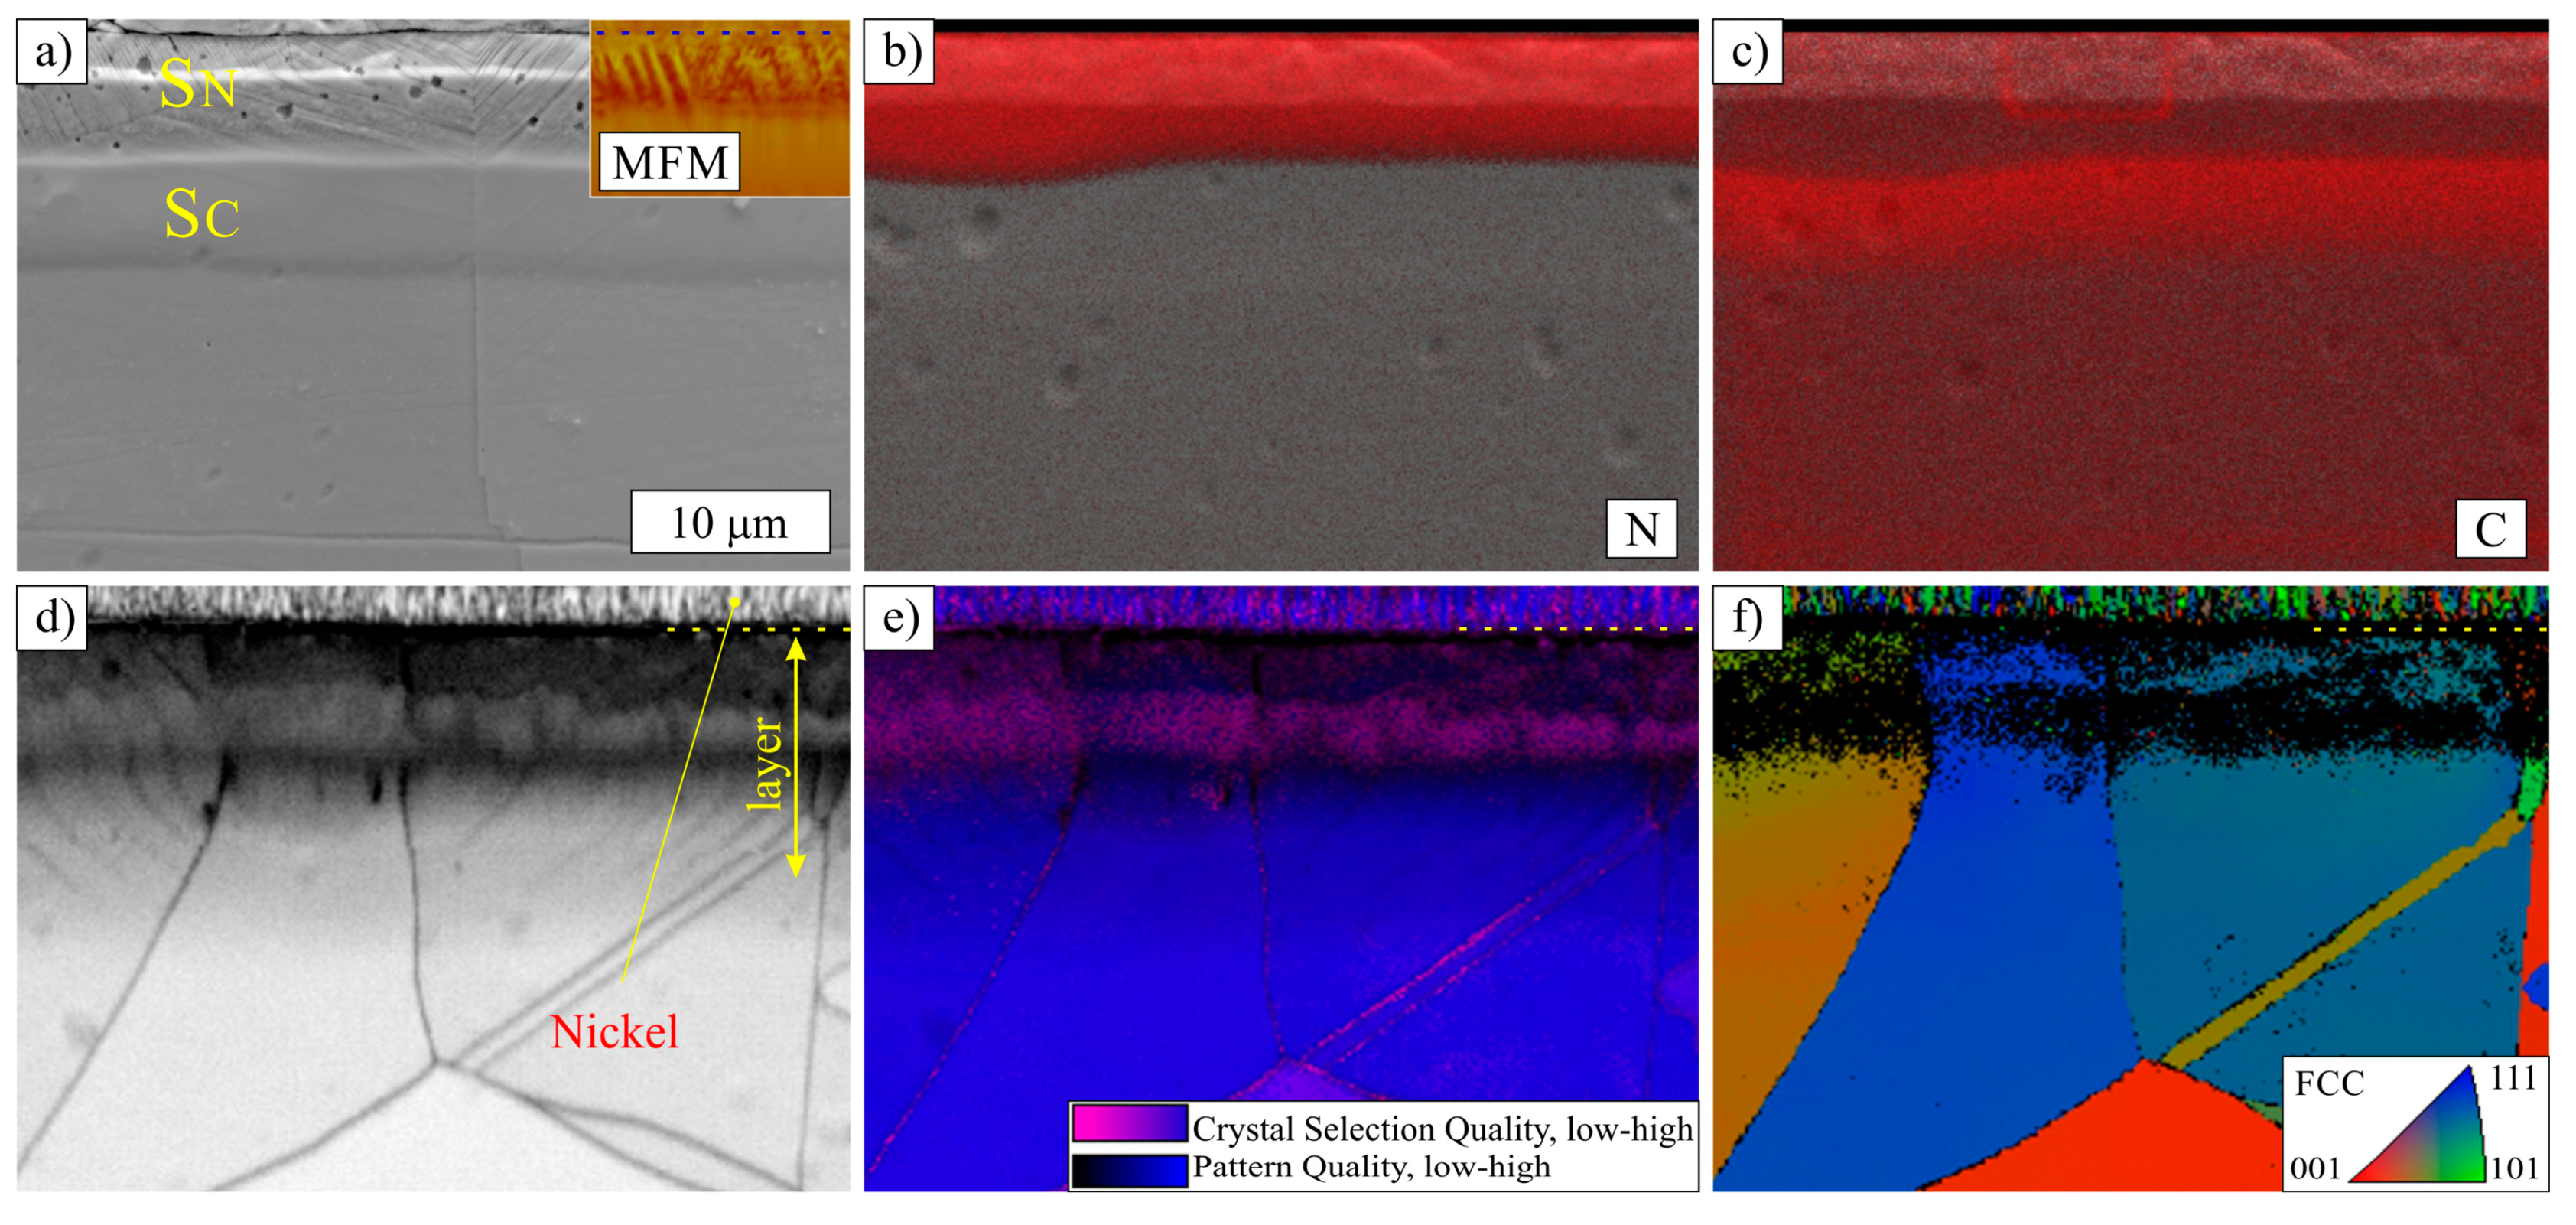
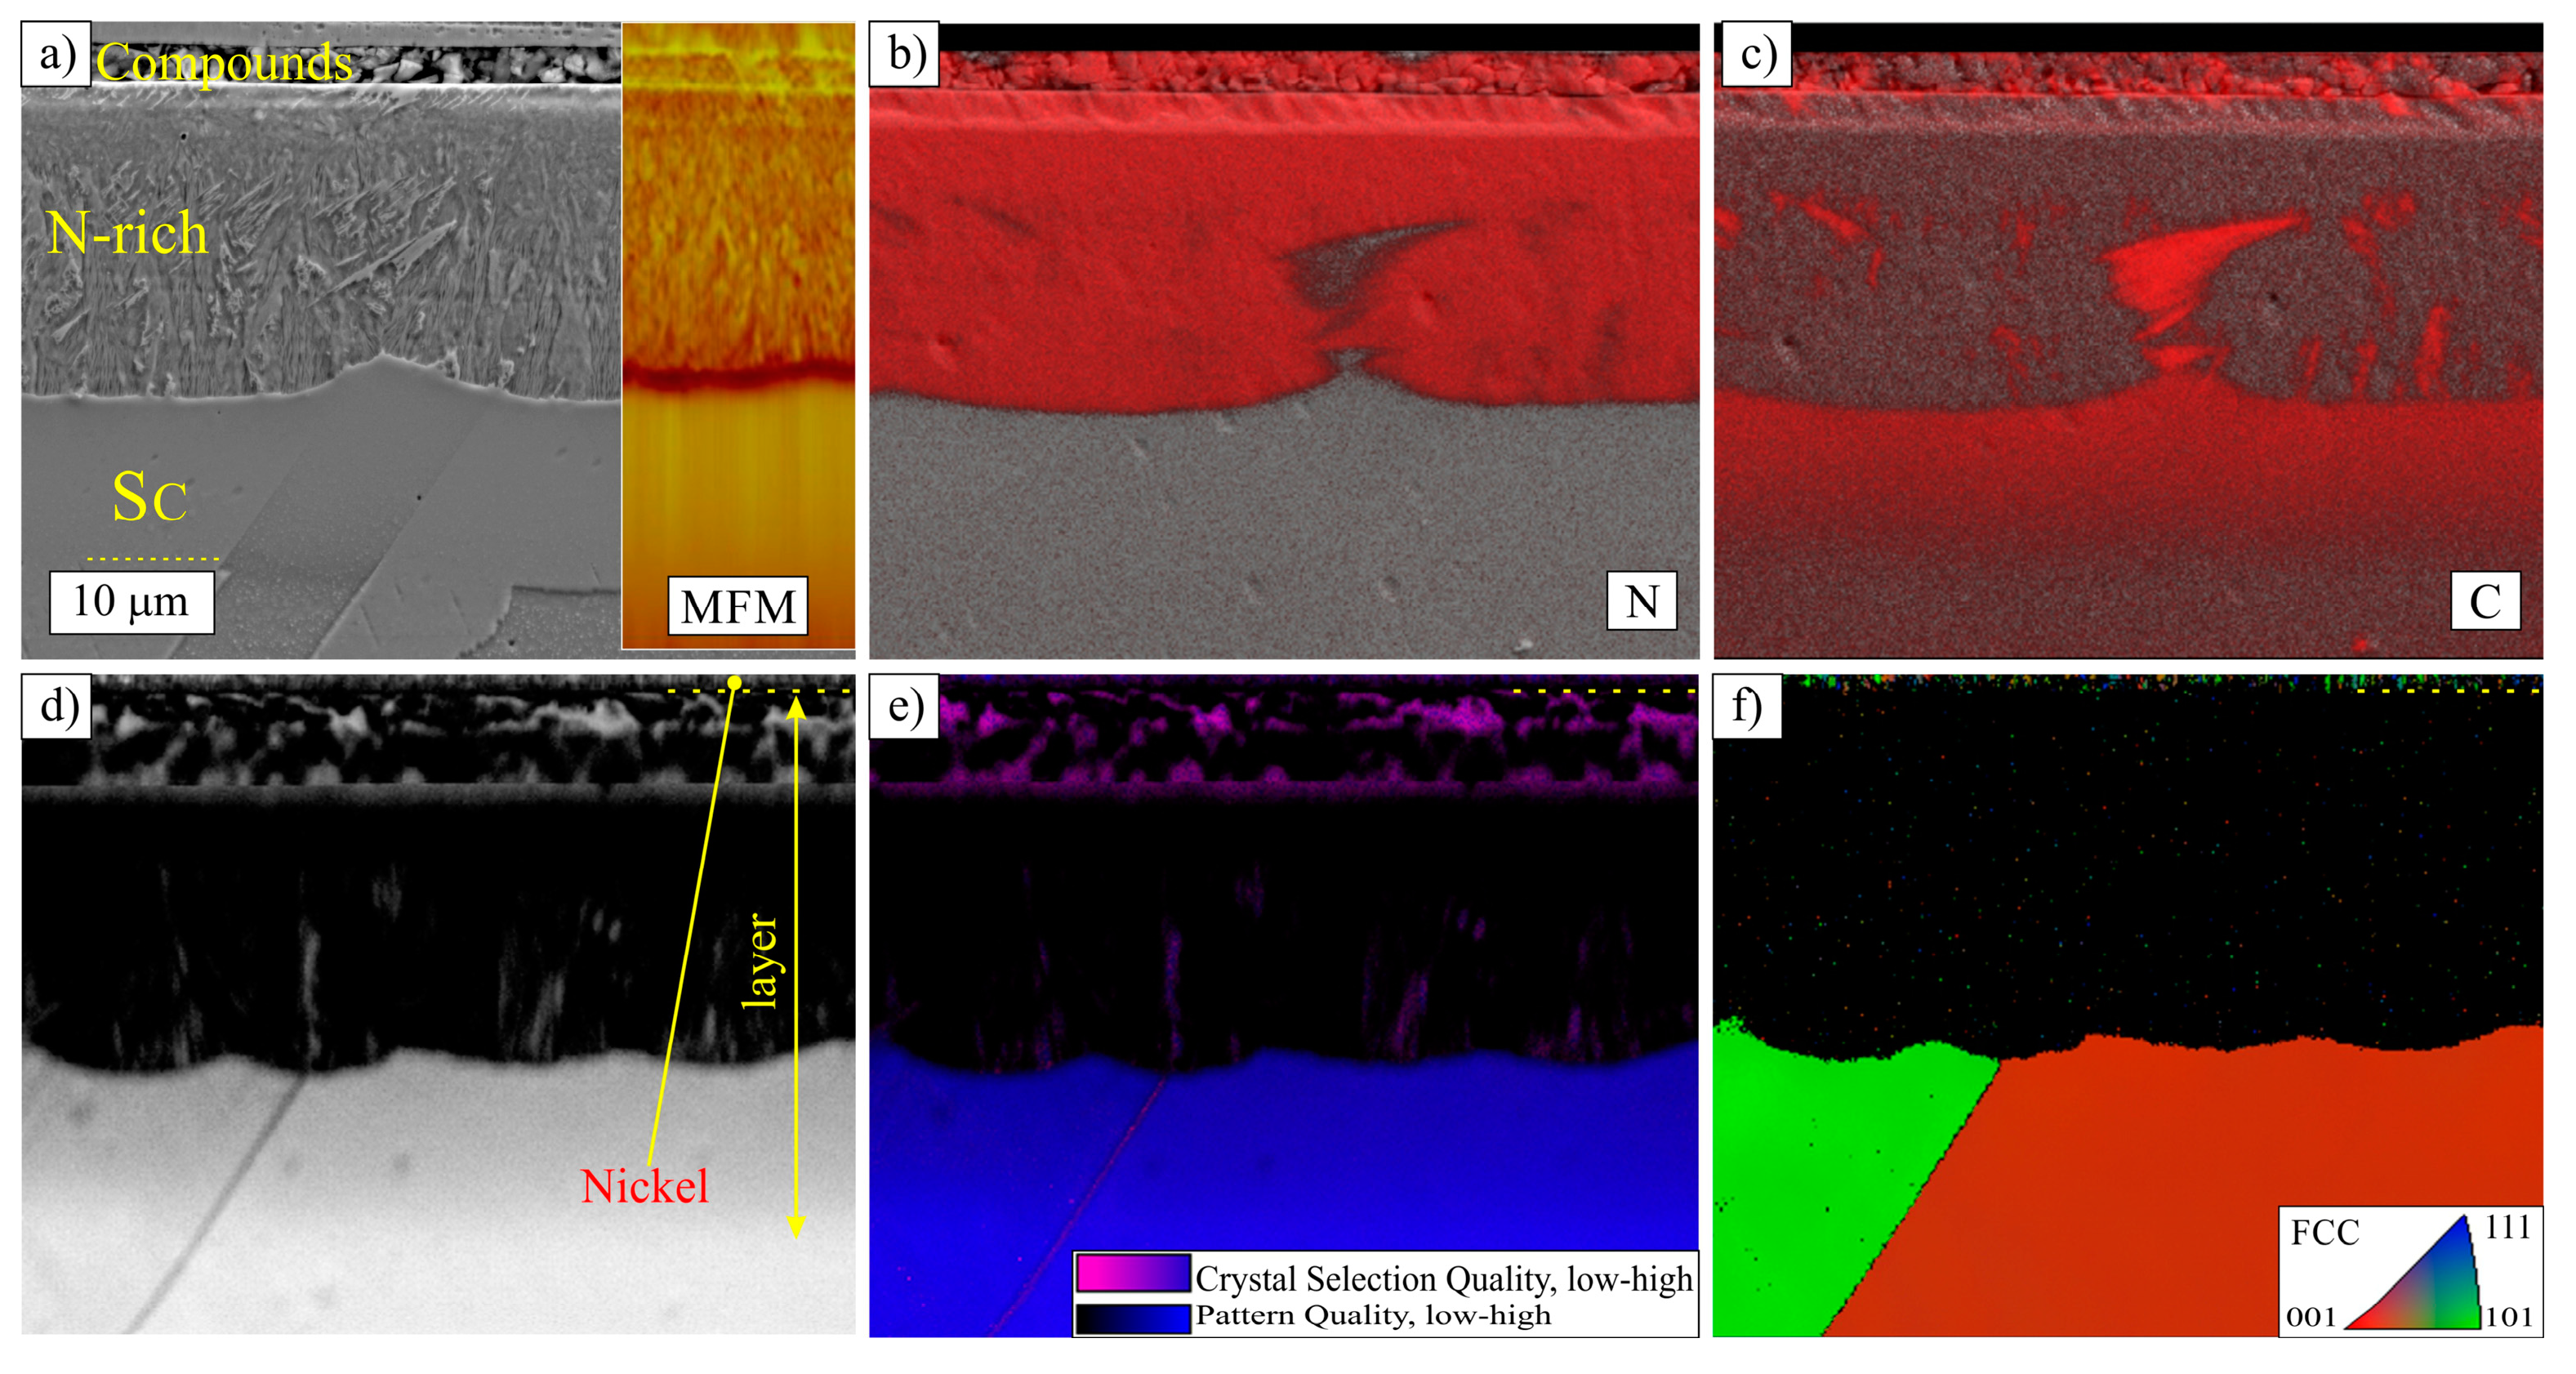
3.2. Layers Treated at 500 °C

In the layers produced at 500 °C, the carbon-rich sublayer was not etched in contrast to the nitrogen-rich sublayer, which was sensitive to chemical etching (Figure 5a and Figure 6a). The susceptibility to chemical etching indicated the presence of chromium nitrides and/or carbides precipitates. These precipitates were also indicated by WDS elemental maps (Figure 5c and Figure 6c) as well as quantitative profiles (Figure 8e,f), and they could be observed using a high-resolution SEM image (Figure 11a). The layers obtained at 500 °C also contained a relatively thick (approximately 3 to 4 µm) brittle sublayer of nitrides located near the surface.
An increased concentration of carbon in this sublayer was visible in the WDS map (Figure 5c and Figure 6c). Because the layer contained numerous cracks (developed most probably during sample preparation), the carbon X-ray signal may have originated partially from the diamond suspension used during sample polishing. However, 2 to 4 wt. % of carbon was detected using WDS X-ray microanalysis measurements performed on the as-received treated surfaces (Figure 8e,f). For both types of atmosphere, the maximum nitrogen content was ca. 9 wt. %, and this maximum was located a few microns from the surface (Figure 8e,f). Magnetic force microscopy revealed that ferromagnetic behaviour was present within the entire nitrogen-rich sublayer of layers carbonitrided at 500 °C (Figure 5a and Figure 6a) in both types of atmospheres. The ferromagnetic properties of the layers can be attributed to the presence of the products of decomposition of S-phase in the layers. Metastable S-phase in austenitic stainless steels of the type 18-8 thermally decomposes into stable phases, i.e., ferromagnetic BCC (body centered cubic) ferrite/martensite and precipitates of nitrides (mainly CrN) and carbides [10,32,33]. The strongest contrast was observed in the vicinity of the boundary with the internal carbon-rich sublayer, i.e., at the front of the decomposition of S-phase. The phase composition of this area of fine lamellar microstructure (Figure 11b) was not investigated exhaustively in this work; however, it could contain some portion of remaining S-phase of the content of the interstitial elements (N, C) providing the ferromagnetism. The similar lamellar microstructure was observed with transmission electron microscopy by Li et al. [33] in the products of S-phase decomposition. The carbon-rich sublayer of the layers treated at 500 °C remained paramagnetic.
X-ray diffraction patterns acquired from the surface of both layers produced at 500 °C were similar (Figure 9 and Figure 10), and mainly CrN nitride could be identified. For both layers, a significant broadening of all CrN diffraction peaks was observed, indicating that the nitrides were very finely dispersed. No carbides were identified using the XRD method. No diffraction signal was visible for the carbon-rich sublayer, which was probably the carbon-stabilised S-phase. For the layer produced in the atmosphere of 50% NH3 (500 °C), except diffraction peaks coming from CrN, the additional one is present and located at the 2Θ angle of ca. 53° (Figure 9), which could be attributed to martesitic phase of tetragonally deformed BCC structure. This would confirm the presence of the products of the S-phase decomposition. However, this diffraction peak could be also attributed to residual S-phase.
Further evidence for the refinement of the structure of the nitrogen-rich sublayer was a drastic deterioration of the EBSD pattern quality (Figure 5d and Figure 6d) in the nitrogen-rich sublayer, appearing as dark areas. In addition to the poor EBSD pattern quality, the indexing quality (not presented in this paper) and the crystal selection (Figure 5e,f and Figure 6e,f) were also very low. In the carbon-rich sublayer, only a slight decrease in the EBSD pattern quality and crystal selection was perceptible and an fcc-type structure could be easily identified.
In the authors’ opinion, the presence of a very sharp boundary between the carbon-rich and nitrogen-rich sublayers, in both chemical and phase composition, was of particular significance. The carbon-stabilised S-phase itself was more resistant to thermal decomposition into the phase mixture containing carbide precipitates than the nitrogen stabilised S-phase (it can be produced at a temperature of 520 °C [18]). In the carbonitrided layers, it is likely that the growth of nitrogen S-phase proceeded at the expense of carbon S-phase sub-layer. This would mean that the part of the nitrided layer near the surface decomposes first into nitrides, and at the same time it is probable that a nascent non-decomposed nitrogen S-phase forms adjacent to the carbon-rich sublayer area during the process. This is supported by the observation of strong ferromagnetic properties in this exact area (Figure 5a and Figure 6a).
Scanning electron microscopy obsevations revealed that some surface features are typical of an S-phase layer on austenitic stainless steel, such as conspicuous grain boundaries of austenite; grains elevated from the surface or twins are still visible (Figure 12a), but these are not as sharply defined as those with samples produced at all lower treatment temperatures (Figure 12b).

4. Conclusions

All presented carbonitrided layers comprised two major sublayers: an outer layer enriched in nitrogen and an inner layer enriched in carbon. It was found that both the microstructure and the thickness depended on the technological parameters of the thermochemical treatment. The treatment temperature was particularly important, increasing both the total and the nitrogen-rich sublayer thickness regardless of the atmosphere type. The nitrogen potential had a positive influence on the thickness of the outer nitrogen-stabilised S-phase sublayer for all analysed layers.. Layers treated at temperatures of 400 and 450 °C were composed of an internal carbon-enriched S-phase sublayer and an outer nitrogen-enriched S-phase sublayer, which could be divided into ferromagnetic and paramagnetic zones. Symmetry distortion of the fcc crystal system was also observed in these layers treated at 400 and 450 °C, and stacking faults may have been induced. With layers produced at 500 °C, the outer nitrogen-enriched sublayer contained fine precipitates of nitrides and carbides.

Author Contributions

Conceptualization, P.K. and J.B.; methodology, P.K. and S.F.; investigation, P.K. and S.F.; writing—original draft preparation, P.K.; writing—review and editing, J.B.; project principal investigator, J.B.

Funding

This research was partially funded by the Polish National Centre for Science, grant number N N507 220940 and the APC was funded by West Pomeranian University of Technology Research Funds.

Conflicts of Interest

The authors declare no conflict of interest.

References

  1. Baranowska, J.; Arnold, B. Corrosion resistance of nitrided layers on austenitic steel. Surf. Coat. Technol. 2006, 200, 6623–6628. [Google Scholar] [CrossRef]
  2. García Molleja, J.; Nosei, L.; Ferrón, J.; Bemporad, E.; Lesage, J.; Chicot, D.; Feugeas, J. Characterization of expanded austenite developed on AISI 316L stainless steel by plasma carburization. Surf. Coat. Technol. 2010, 204, 3750–3759. [Google Scholar] [CrossRef]
  3. Sun, Y. Production of nitrogen and carbon S phases in austenitic stainless steels by hybrid plasma surface alloying. Surf. Eng. 2009, 26, 114–122. [Google Scholar] [CrossRef]
  4. Ichii, K.K. Structure of the ion-nitrided layer of 18-8 stainless steel. Technol. Rep. Kansai Univ. 1986, 27, 135. [Google Scholar]
  5. Bell, T. Current Status of Supersaturated Surface Engineered S-Phase Materials. Key Eng. Mater. 2009, 373–374, 289–295. [Google Scholar]
  6. Zhang, T.; Tong, X.S. The Effect of Wear and Corrosion Resistance of Austenitic Stainless Steel on Plasma Carburizing. Adv. Mater. Res. 2014, 941–944, 1357–1361. [Google Scholar] [CrossRef]
  7. Jiang, L.; Luo, H.; Zhao, C. Nitrocarburising of AISI 316 stainless steel at low temperature. Surf. Eng. 2018, 34, 205–210. [Google Scholar] [CrossRef]
  8. Souza, R.M.; Ignat, M.; Pinedo, C.E.; Tschiptschin, A.P. Structure and properties of low temperature plasma carburized austenitic stainless steels. Surf. Coat. Technol. 2009, 204, 1102–1105. [Google Scholar] [CrossRef]
  9. Fewell, M.P.; Mitchell, D.R.G.; Priest, J.M.; Short, K.T.; Collins, G.A. The nature of expanded austenite. Surf. Coat. Technol. 2000, 131, 300306. [Google Scholar] [CrossRef]
  10. Dong, H. S-phase surface engineering of Fe-Cr, Co-Cr and Ni-Cr alloys. Int. Mater. Rev. 2010, 55, 65–98. [Google Scholar] [CrossRef]
  11. Baranowska, J.; Franklin, S.E.; Pelletier, C.G.N. Tribological behaviour and mechanical properties of low temperature gas nitrided austenitic steel in relation to layer morphology. Wear 2005, 259, 432–438. [Google Scholar] [CrossRef]
  12. Kochmański, P.; Baranowska, J. Structure and properties of gas nitrided layers on nanoflex stainless steel. Defect Diffus. Forum 2012, 326, 291–296. [Google Scholar] [CrossRef]
  13. Kochmański, P.; Baranowska, J. Kinetics of low temperature nitriding of precipitation hardened stainless steel. Defect Diffus. Forum 2011, 312, 530–535. [Google Scholar] [CrossRef]
  14. Baranowska, J.; Kochmański, P.; Bielawski, J. The influence of chemical composition of stainless steel on the formation of low temperature nitrided layer. Defect Diffus. Forum 2012, 326–328, 297–302. [Google Scholar] [CrossRef]
  15. Kochmański, P.; Baranowska, J. Gas nitrided layers on precipitation hardened stainless steel. Mater. Eng. (Inżynieria Mateiałowa) 2010, 3, 324–327. [Google Scholar]
  16. Bottoli, F.; Winther, G.; Christiansen, T.L.; Somers, M.A.J. Influence of Microstructure and Process Conditions on Simultaneous Low-Temperature Surface Hardening and Bulk Precipitation Hardening of Nanoflex®. Metall. Mater. Trans. A Phys. Met. Mater. Sci. 2015, 46, 5201–5216. [Google Scholar] [CrossRef]
  17. Christiansen, T.L.; Hummelshøj, T.S.; Somers, M.A.J. A Method of Activating an Article of Passive Ferrous or non-Ferrous Metal Prior to Carburizing, Nitriding and/or Nitrocarburizing. U.S. Patent No. 8,845,823, 30 September 2014. [Google Scholar]
  18. Christiansen, T.L.; Somers, M.A.J. Low-temperature gaseous surface hardening of stainless steel: The current status. Int. J. Mater. Res. 2009, 100, 1361–1377. [Google Scholar] [CrossRef]
  19. Sun, Y.; Haruman, E. Influence of processing conditions on structural characteristics of hybrid plasma surface alloyed austenitic stainless steel. Surf. Coat. Technol. 2008, 202, 4069–4075. [Google Scholar] [CrossRef]
  20. Jegou, S.; Christiansen, T.L.; Klaus, M.; Genzel, C.; Somers, M.A.J. Determination of composition, residual stress and stacking fault depth profiles in expanded austenite with energy-dispersive diffraction. Thin Solid Films 2013, 530, 71–76. [Google Scholar] [CrossRef] [Green Version]
  21. Wu, D.; Kahn, H.; Michal, G.M.; Ernst, F.; Heuer, A.H. Ferromagnetism in interstitially hardened austenitic stainless steel induced by low-temperature gas-phase nitriding. Scr. Mater. 2011, 65, 1089–1092. [Google Scholar] [CrossRef]
  22. Fewell, M.P.; Priest, J.M. High-order diffractometry of expanded austenite using synchrotron radiation. Surf. Coat. Technol. 2008, 202, 1802–1815. [Google Scholar] [CrossRef]
  23. Hummelshøj, T.S.; Christiansen, T.L.; Somers, M.A.J. Lattice expansion of carbon-stabilized expanded austenite. Scr. Mater. 2010, 63, 761–763. [Google Scholar] [CrossRef]
  24. Wu, D.; Kahn, H.; Dalton, J.C.; Michal, G.M.; Ernst, F.; Heuer, A.H. Orientation dependence of nitrogen supersaturation in austenitic stainless steel during low-temperature gas-phase nitriding. Acta Mater. 2014, 79, 339–350. [Google Scholar] [CrossRef]
  25. Buhagiar, J.; Dong, H. Low temperature plasma carbonitriding of ASTM F138 and ASTM F1586 biomedical stainless steels. Surf. Eng. 2009, 26, 256–264. [Google Scholar] [CrossRef]
  26. Gu, X.; Michal, G.M.; Ernst, F.; Kahn, H.; Heuer, A.H. Numerical simulations of carbon and nitrogen composition-depth profiles in nitrocarburized austenitic stainless steels. Met. Mater. Trans. A Phys. Metall. Mater. Sci. 2014, 45, 4268–4279. [Google Scholar] [CrossRef]
  27. Baranowska, J. Importance of surface activation for nitrided layer formation on austenitic stainless steel. Surf. Eng. 2009, 26, 293–298. [Google Scholar] [CrossRef]
  28. Baranowska, J.; Szczecinski, K.; Mieczysław, W. Increasing of Gas Nitriding Kinetics; Euromat: Maastricht, The Netherlands, 1997; pp. 279–282. [Google Scholar]
  29. Mittemeijer, E.J.; Somers, M.A.J. (Eds.) Thermochemical Surface Engineering of Steels; Woodhead Publishing: Cambridge, UK, 2015; ISBN 9780857096807. [Google Scholar]
  30. Tsujikawa, M.; Yamauchi, N.; Ueda, N.; Sone, T.; Hirose, Y. Behavior of carbon in low temperature plasma nitriding layer of austenitic stainless steel. Surf. Coat. Technol. 2005, 193, 309–313. [Google Scholar] [CrossRef]
  31. Brink, B.K.; Ståhl, K.; Christiansen, T.L.; Frandsen, C.; Hansen, M.F.; Somers, M.A.J. Composition-dependent variation of magnetic properties and interstitial ordering in homogeneous expanded austenite. Acta Mater. 2016, 106, 32–39. [Google Scholar] [CrossRef] [Green Version]
  32. Prokert, F.; Abd El-Rahman, A.M.; Schell, N.; Negm, N.Z.; Richter, E.; El-Hossary, F.M.; Möller, W. In-situ stability study of nitrocarburized 304 stainless steel during heating. Surf. Coat. Technol. 2005, 200, 602–607. [Google Scholar]
  33. Li, X.Y.; Sun, Y.; Bell, T. The stability of the nitrogen S-phase in austenitic stainless steel. Z. Met. 1999, 90, 901–907. [Google Scholar]
Figure 1. Cross-section of carbonitrided layers on sample 1 (acc. to Table 2)–400 °C, 49%NH3; (a) scanning electron (SE) image, (b) SE image (of non-etched sample) overlaid with wavelength dispersive spectrometry X-ray microanalysis (WDS) map of nitrogen, (c) SE image (of non-etched sample) overlaid with WDS map of carbon, (d) electron backscattered diffraction (EBSD) pattern quality map, (e) EBSD map of crystal selection quality combined with pattern quality, and (f) EBSD fcc structure orientation map.
Metals 09 00817 g001
Figure 2. Cross-section of carbonitrided layers on sample 2 (acc. to Table 2)–400 °C, 98%NH3; (a) SE image, (b) SE image (of non-etched sample) overlaid with WDS map of nitrogen, (c) SE image (of non-etched sample) overlaid with WDS map of carbon, (d) EBSD pattern quality map, (e) EBSD map of crystal selection quality combined with pattern quality, and (f) EBSD fcc structure orientation map.
Metals 09 00817 g002
Figure 3. Cross-section of carbonitrided layers on sample 3 (acc. to Table 2)–450 °C, 49%NH3; (a) SE image, (b) SE image (of non-etched sample) overlaid with WDS map of nitrogen, (c) SE image (of non-etched sample) overlaid with WDS map of carbon, (d) EBSD pattern quality map, (e) EBSD map of crystal selection quality combined with pattern quality, and (f) EBSD fcc structure orientation map.
Metals 09 00817 g003
Figure 4. Cross-section of carbonitrided layers on sample 4 (acc. to Table 2)–450 °C, 98%NH3; (a) SE image, (b) SE image (of non-etched sample) overlaid with WDS map of nitrogen, (c) SE image (of non-etched sample) overlaid with WDS map of carbon, (d) EBSD pattern quality map, (e) EBSD map of crystal selection quality combined with pattern quality, and (f) EBSD fcc structure orientation map.
Metals 09 00817 g004
Figure 5. Cross-section of carbonitrided layers on sample 5 (acc. to Table 2)–500 °C, 49%NH3; (a) SE image, (b) SE image (of non-etched sample) overlaid with WDS map of nitrogen, (c) SE image (of non-etched sample) overlaid with WDS map of carbon, (d) EBSD pattern quality map, (e) EBSD map of crystal selection quality combined with pattern quality, and (f) EBSD fcc structure orientation map.
Metals 09 00817 g005
Figure 6. Cross-section of carbonitrided layers on sample 6 (acc. to Table 2)–500 °C, 98%NH3; (a) SE image, (b) SE image (of non-etched sample) overlaid with WDS map of nitrogen, (c) SE image (of non-etched sample) overlaid with WDS map of carbon, (d) EBSD pattern quality map, (e) EBSD map of crystal selection quality combined with pattern quality, and (f) EBSD fcc structure orientation map.
Metals 09 00817 g006
Figure 7. Thickness (total and nitrogen-rich sublayer) of layers carbonitrided at variable temperatures and atmospheres at constant time of 5 h.
Metals 09 00817 g007
Figure 8. Nitrogen and carbon concentrations measured in WDS X-ray microanalysis on cross-sections of layer carbonitrided at different parameters; samples (acc. to Table 2) correspondingly: (a) 1–400 °C, 49%NH3, (b) 2–400 °C, 98%NH3, (c) 3–450 °C, 49%NH3, (d) 4–450 °C, 98%NH3, (e) 5–500 °C, 49%NH3, and (f) 6–500 °C, 98%NH3. Lines are only to guide the eye.
Metals 09 00817 g008
Figure 9. X-ray diffraction (XRD) patterns acquired from layers carbonitrided in atmosphere containing 49% NH3 at. various temperatures (samples 1, 3, and 5 acc. to Table 2).
Metals 09 00817 g009
Figure 10. XRD patterns acquired from layers carbonitrided in atmosphere containing 98%. NH3 at various temperatures (samples 2, 4, and 6 acc. to Table 2).
Metals 09 00817 g010
Figure 11. SE images of microstructure of nitrogen-rich sublayer of carbonitrided layer-sample 6–500 °C, 49%NH3: (a) area ca. 5 µm from surface and (b) area at boundary with the internal carbon-rich sublayer. Etched with Aqua regia.
Metals 09 00817 g011
Figure 12. SE images of surface of carbonitrided layers: (a) sample 6–500 °C, 98%NH3, and (b) sample 4–450 °C, 98%NH3.
Metals 09 00817 g012
Table 1. Chemical composition of X10CrNi18-8 steel.
ElementCCrNiMoMnSiFe
Mass %0.118.677.540.232.030.33balance
Table 2. Thermo-chemical treatment parameters.
SampleTemperature
(°C)
Atmosphere Composition (vol. %)Duration (h)
NH3Dissociated NH3C2H2
140049balance25
240098-
345049balance
445098-
550049balance
650098-

