Article

Numerical Modeling of Open-Eye Formation and Mixing Time in Argon Stirred Industrial Ladle

1
Process Metallurgy Research Unit, University of Oulu, PO Box 4300, 90014 Oulu, Finland
2
Outokumpu Stainless Oy, Terästie, 95490 Tornio, Finland
3
School of Metallurgy, Northeastern University, Heping District, Shenyang 11004, China
*
Author to whom correspondence should be addressed.
Metals 2019, 9(8), 829; https://doi.org/10.3390/met9080829
Submission received: 28 May 2019 / Revised: 8 July 2019 / Accepted: 24 July 2019 / Published: 26 July 2019

Abstract

:
In secondary metallurgy, argon gas stirring and alloying of elements are very important in determining the quality of steel. Argon gas is injected through the nozzle located at the bottom of the ladle into the molten steel bath; this gas breaks up into gas bubbles, rising upwards and breaking the slag layer at high gas flow rates, creating an open-eye. Alloy elements are added to the molten steel through the open-eye to attain the desired steel composition. In this work, experiments were conducted to investigate the effect of argon gas flow rate on the open-eye size and mixing time. An Eulerian volume of fluid (VOF) approach was employed to simulate the argon/steel/slag interface in the ladle, while a species transport model was used to calculate the mixing time of the nickel alloy. The simulation results showed that the time-averaged value of the open-eye area changed from 0.66 to 2.36 m2 when the flow rate of argon was varied from 100 to 500 NL/min. The mixing time (95% criterion) of tracer addition into the metal bath decreased from 139 s to 96 s, when the argon flow rate was increased from 100 to 500 NL/min. The model validation was verified by comparing with measured experimental results.

1. Introduction

In the steel refining process, argon stirring is extensively employed to boost slag-steel reactions and to homogenize the chemical composition of alloy elements and their temperature. The behavior of the slag layer and mixing phenomena in the ladle are highly influenced by the argon stirring rates, the number of nozzles, and their configurations. Over the years, many physical and computational fluid dynamic (CFD) simulations [1,2,3,4,5,6,7,8,9,10,11,12,13,14,15,16,17,18,19,20,21,22] have been performed to investigate the effect of gas flow rate, slag layer thickness, and number of nozzles on open-eye formation and mixing time in water models and industrial-scale ladles.
Cao et al. [4] studied the fluid flow, mass transfer, and open-eye behavior in an industrial scale ladle using both volume of fluid (VOF) and Euler-Lagrange modeling approaches. Cao et al. [5] extended the work to investigate the mixing phenomenon using a species transport model. Valentin et al. [7] studied the influence of stirring rate on the formation of the open-eye and mixing phenomena in a 170-t industrial ladle. Cloete et al. [8] investigated the fluid flow and mixing phenomena in full-scale gas-stirred ladles by employing the VOF model for tracking the free surface of the melt. Cloete et al. [9] extended the work of Cloete et al. [8] by studying the influence of various design variables on mixing efficiency. Li et al. [10,11,12] investigated the fluid flow, bubble diameter, turbulent dissipation rate, bubble movement, and open-eye fluctuation in a water model ladle through experiments and numerical simulations.
Gonzalez et al. [13] investigated the fluid flow and open-eye behavior for a ladle under non-isothermal conditions. Amaro-Villeda et al. [14] studied the effect of slag properties (thickness and viscosity) on mixing time, open-eye, and energy dissipation in a 1:6 scale of a 140 tonne industrial ladle. Zhu et al. [15] investigated the fluid flow and mixing phenomena in argon-stirred ladles with six types of tuyere arrangement. The results concluded that mixing time is greatly influenced by a tracer adding position, and mixing time decreases with increasing gas flow rate, but the effect is not great. Lou et al. [16] performed numerical simulations to study the effect of different numbers and positions of tuyeres on the inclusion behavior and mixing phenomena in gas-stirred ladles. Liu et al. [18] and Li et al. [19] studied the effect of gas flow rate and slag layer thickness on open-eye formation and mixing time in a water model ladle through physical and numerical modeling. Liu et al. [20] performed simulations using an Large Eddy Simulation (LES) approach to study the effect of gas flow rate on open-eye formation and slag entrapment.
Haiyan et al. [21] and Madan et al. [22] studied the effect of gas flow rate on the mixing phenomenon in a bottom-stirring ladle with dual plugs. Wu et al. [23] and Thunman et al. [24] studied the effect of gas flow rate and slag layer thickness on the open-eye formation and slag entrainment in water model ladles. Li et al. [25] modeled the three-phase flows and behavior of the open-eye in an industrial-scale ladle using the volume of fluid (VOF) approach. Liu et al. [26] investigated the effect of gas flow rate and slag layer thickness on open-eye formation and mixing phenomena in an industrial-scale ladle. Singh et al. [27] validated the simulation results of Liu et al. [26] and extended the model to investigate the desulphurization behavior. Ramasetti et al. [28,29] investigated the effect of gas flow rate and slag layer properties on open-eye formation in a water model ladle.
During the past years, studies were concentrated more on the modeling of water model ladles, while studies related to industrial scale ladle modeling were limited. In the present work, a mathematical model was developed to describe the three-phase flow in an industrial-scale ladle. The Eulerian VOF model was used to track the slag/steel/gas interface behavior, and a species transport model was used to calculate the mixing time. The industrial measurements for studying the effect of argon flow rate on open-eye formation and mixing time were performed at Outokumpu Stainless Oy in Tornio, Finland. The simulation results of open-eye area and mixing time were in good agreement with industrial data.

2. Materials and Methods

2.1. Model Description

A set of Navier-Stokes equations were used to solve the fluid dynamics in the system.
Continuity equation:
ρ t + ( ρ u i ) x i = 0 ,
Momentum equation:
( ρ u i ) t + ( ρ u i u j ) t = p x i + x i [ μ e ( u i x j + u j x i ) ] + ρ g i ,
where ρ is the fluid density; u represents the velocity; t is the time; p and g represent the pressure and gravitational acceleration, respectively; and μ e is the effective turbulent viscosity.
The volume of fluid (VOF) model tracks two or more phases by solving a single set of momentum equations. In this work, it was used to track the liquid-steel/slag/argon-gas interface behavior. The finite volume equation of the VOF model can be written in the following form:
1 ρ q [ t ( α q ρ q ) + · ( α q ρ q u q ) = S α q + p = 1 n ( m ˙ p q m ˙ q p ) ] ,
where m ˙ p q , m ˙ q p represent the mass transfer from phase p to q and phase q to p in unit time and volume, respectively; α q is the volume fraction of phase q ; ρ q is the density of phase q ; and S α q is the source term taken as 0 in Fluent software. The volume fraction of main phase is not calculated in Fluent software, while it can be acquired by Equation (4). When the volume fractions are summed, the following equation is satisfied:
q = 1 n α q = 1
The standard k ε model is used to model turbulence, which solves two equations for the transport of turbulent kinetic energy and its dissipation rate to obtain the effective viscosity field,
Turbulent kinetic energy, k :
t ( ρ k ) + x i ( k u i ) = x j [ ( μ + μ t σ t ) k x i ] + P k ρ ε ,
The rate of dissipation of turbulent kinetic energy, ε :
( ρ ε ) t + ( ρ ε u i ) x i = x j [ ( μ + μ t σ ε ) ε x j ] + ε k ( C 1 P k C 2 ρ ε ) ,
where P k is the generation term of turbulence kinetic energy due to mean velocity gradients, where k is the turbulent kinetic energy, ε is the turbulent dissipation rate, and x i represents the spatial coordinates for different directions. P k is the turbulent kinetic energy source term caused by the mean velocity gradient, and P b is the turbulent kinetic source term caused by buoyancy. These terms are calculated by Equations (7) and (8) respectively.
P k = μ t u j x i ( u i x j + u j x i ) ,
P b = g i ( μ t ρ P r i ) ρ x i
μ t = μ + ρ c μ k 2 ε
The turbulent viscosity is calculated by Equation (9) using the equations k and ε from Equations (5) and (6), respectively.
To calculate the mixing process in the ladle, the species transport model was solved throughout the computational domain.
( ρ c ) t + · ( ρ u c ) = · [ ρ ( D + μ t ρ S c t ) c ]
where D is the mass diffusion coefficient and Sc t is the turbulent Schmidt number with a value of 0.7 ( S c t = μ t ρ D t where D t is the turbulent diffusivity).

2.2. Experimental Details

The experiments were performed in an industrial ladle of 150-ton capacity at Outokumpu Stainless Oy, Tornio plant in Finland. Argon gas was injected into the steel bath through a nozzle located at the bottom of ladle. The measurements were conducted with gas flow rates varying from 100 to 500 NL/min. The thermo-physical and operating parameters are shown in Table 1.

2.3. Numerical Details

The computational domain and mesh system for the ladle configuration studied is shown in Figure 1. The number of cells was approximately 1 million. A mesh size of 8 mm was set throughout the domain, and a maximum mesh size of 4 mm was set for the inlet and slag layer. ANSYS Fluent software was used to perform the multi-phase flow simulations. At the inlet of the ladle, velocity inlet boundary condition, pressure outlet condition at the ladle top surface, and no-slip boundary condition was used at the ladle walls. The finite volume technique was used for the discretization of conservation equations and SIMPLE scheme was used for the pressure-velocity coupling. The volume of fluid (VOF) model was used to track the gas/steel/slag behavior and the species transport model was used to calculate the mixing time of the nickel alloy. The variable time step t was used by setting the Courant number to 2 and the convergence criterion was set to 10−5 for the residuals of dependent variables.

3. Results and Discussion

3.1. Effect of Gas Flow Rate on Open-Eye Formation

Figure 2 and Figure 3 show the experimental and simulation results of the effect of argon flow rate on the open-eye area. The position and size of the open-eye were not constant throughout the process, the value of the open-eye area was averaged for a period of 60 s. The fluctuation of the open-eye area with time for flow rates of 100, 300, and 500 NL/min for experimental and simulation results is shown in Figure 4. At the initial stage, the open-eye area expands rapidly, reaching peak values depending on the flow rate, and starts to stabilize and fluctuate around a constant level. The peak values of the open-eye area for flow rates of 100 NL/min, 300 NL/min, and 500 NL/min were 1.16 m2, 2.09 m2, and 3.17 m2, respectively. The respective time-averaged values for the constant level of the open-eye area were 0.66 m2, 1.37 m2, and 2.36 m2. The predicted trend of enlargement of the open-eye area with argon flow rate was in good agreement with the measurements of Valentin et al. [7].

3.2. Flow Field Distribution

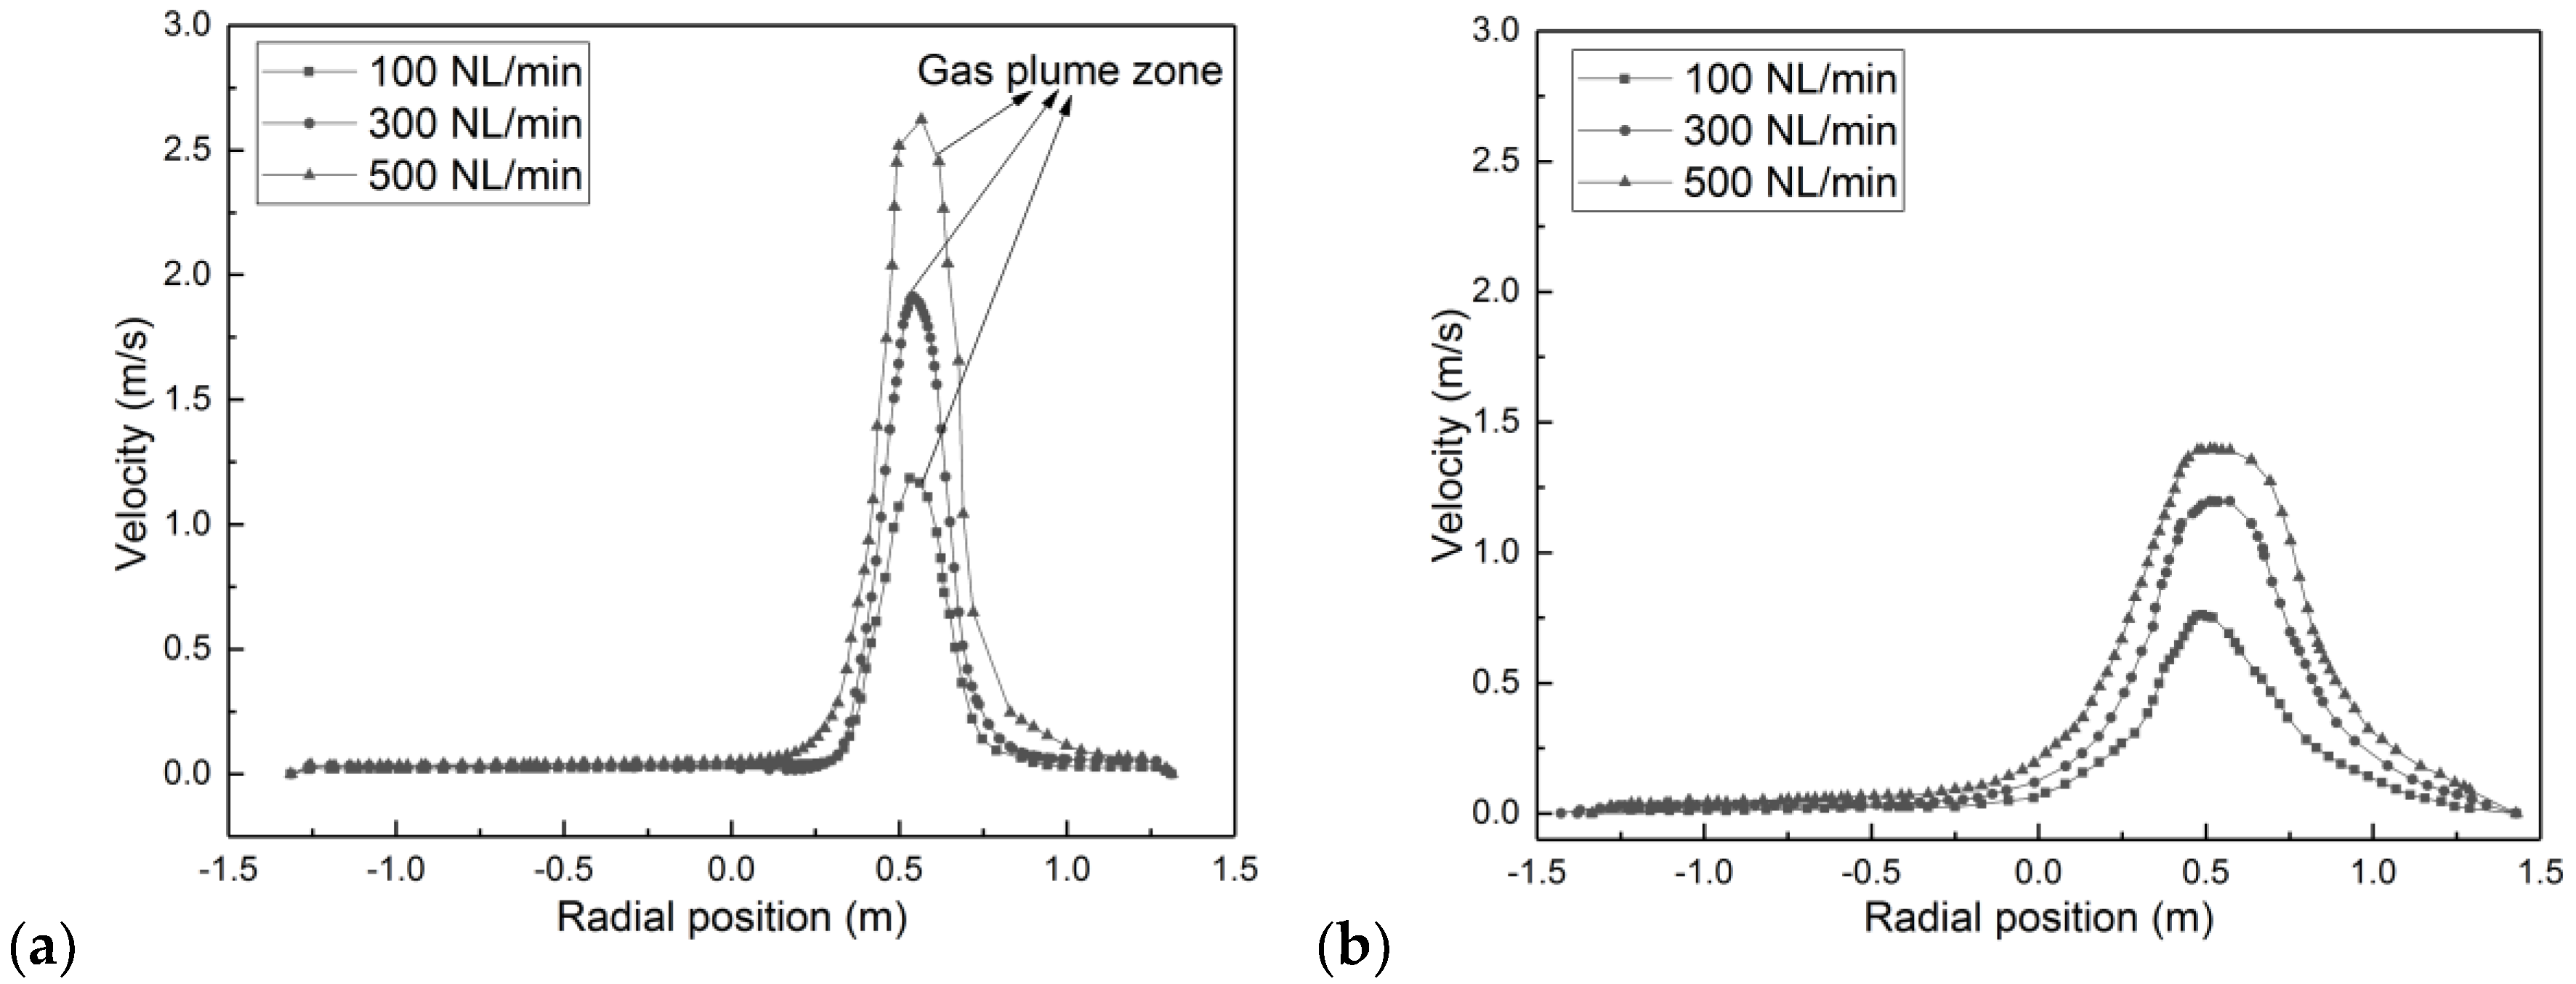
Figure 5, Figure 6 and Figure 7 depict the velocity, turbulent kinetic energy, and dissipation rate profiles on the horizontal plane that pass through the position of the plumes at heights 1.5 m and 3.0 m from the bath bottom. The flow velocity in the plume zones is very high and increases with increase in the gas flow rates, whereas small flow velocities are observed in the zone around the plumes. The flow velocities increase from 1.2 to 2.5 m/s at a height of 1.0 m above the bath bottom, and 0.5 to 1.4 m/s at a height of 3.0 m above the bath bottom when the gas flow rate is increased from 100 to 500 NL/min. The flow velocities tend to decrease as the flow reaches the top surface of the ladle bath. The same trend is followed for the turbulence kinetic energy and dissipation profiles, which can be seen in Figure 6 and Figure 7. The predicted velocity fields follow the same trends of radial velocities, which were, measured physically Xie et al. [31,32].

3.3. Mixing Behavior

In this study, the mixing time is defined as the time to attain a 95% degree of homogenization in the molten steel. The locations of points to calculate the mixing time in the ladle are shown in Figure 8. In order to simulate the addition of nickel alloy, the tracer was released in the form of circle with radius of 0.196 m, located just above the center of the plug where the plume breaks the slag layer and creates the open-eye. The shell formation and subsequent melting of the alloy was neglected in the simulations.
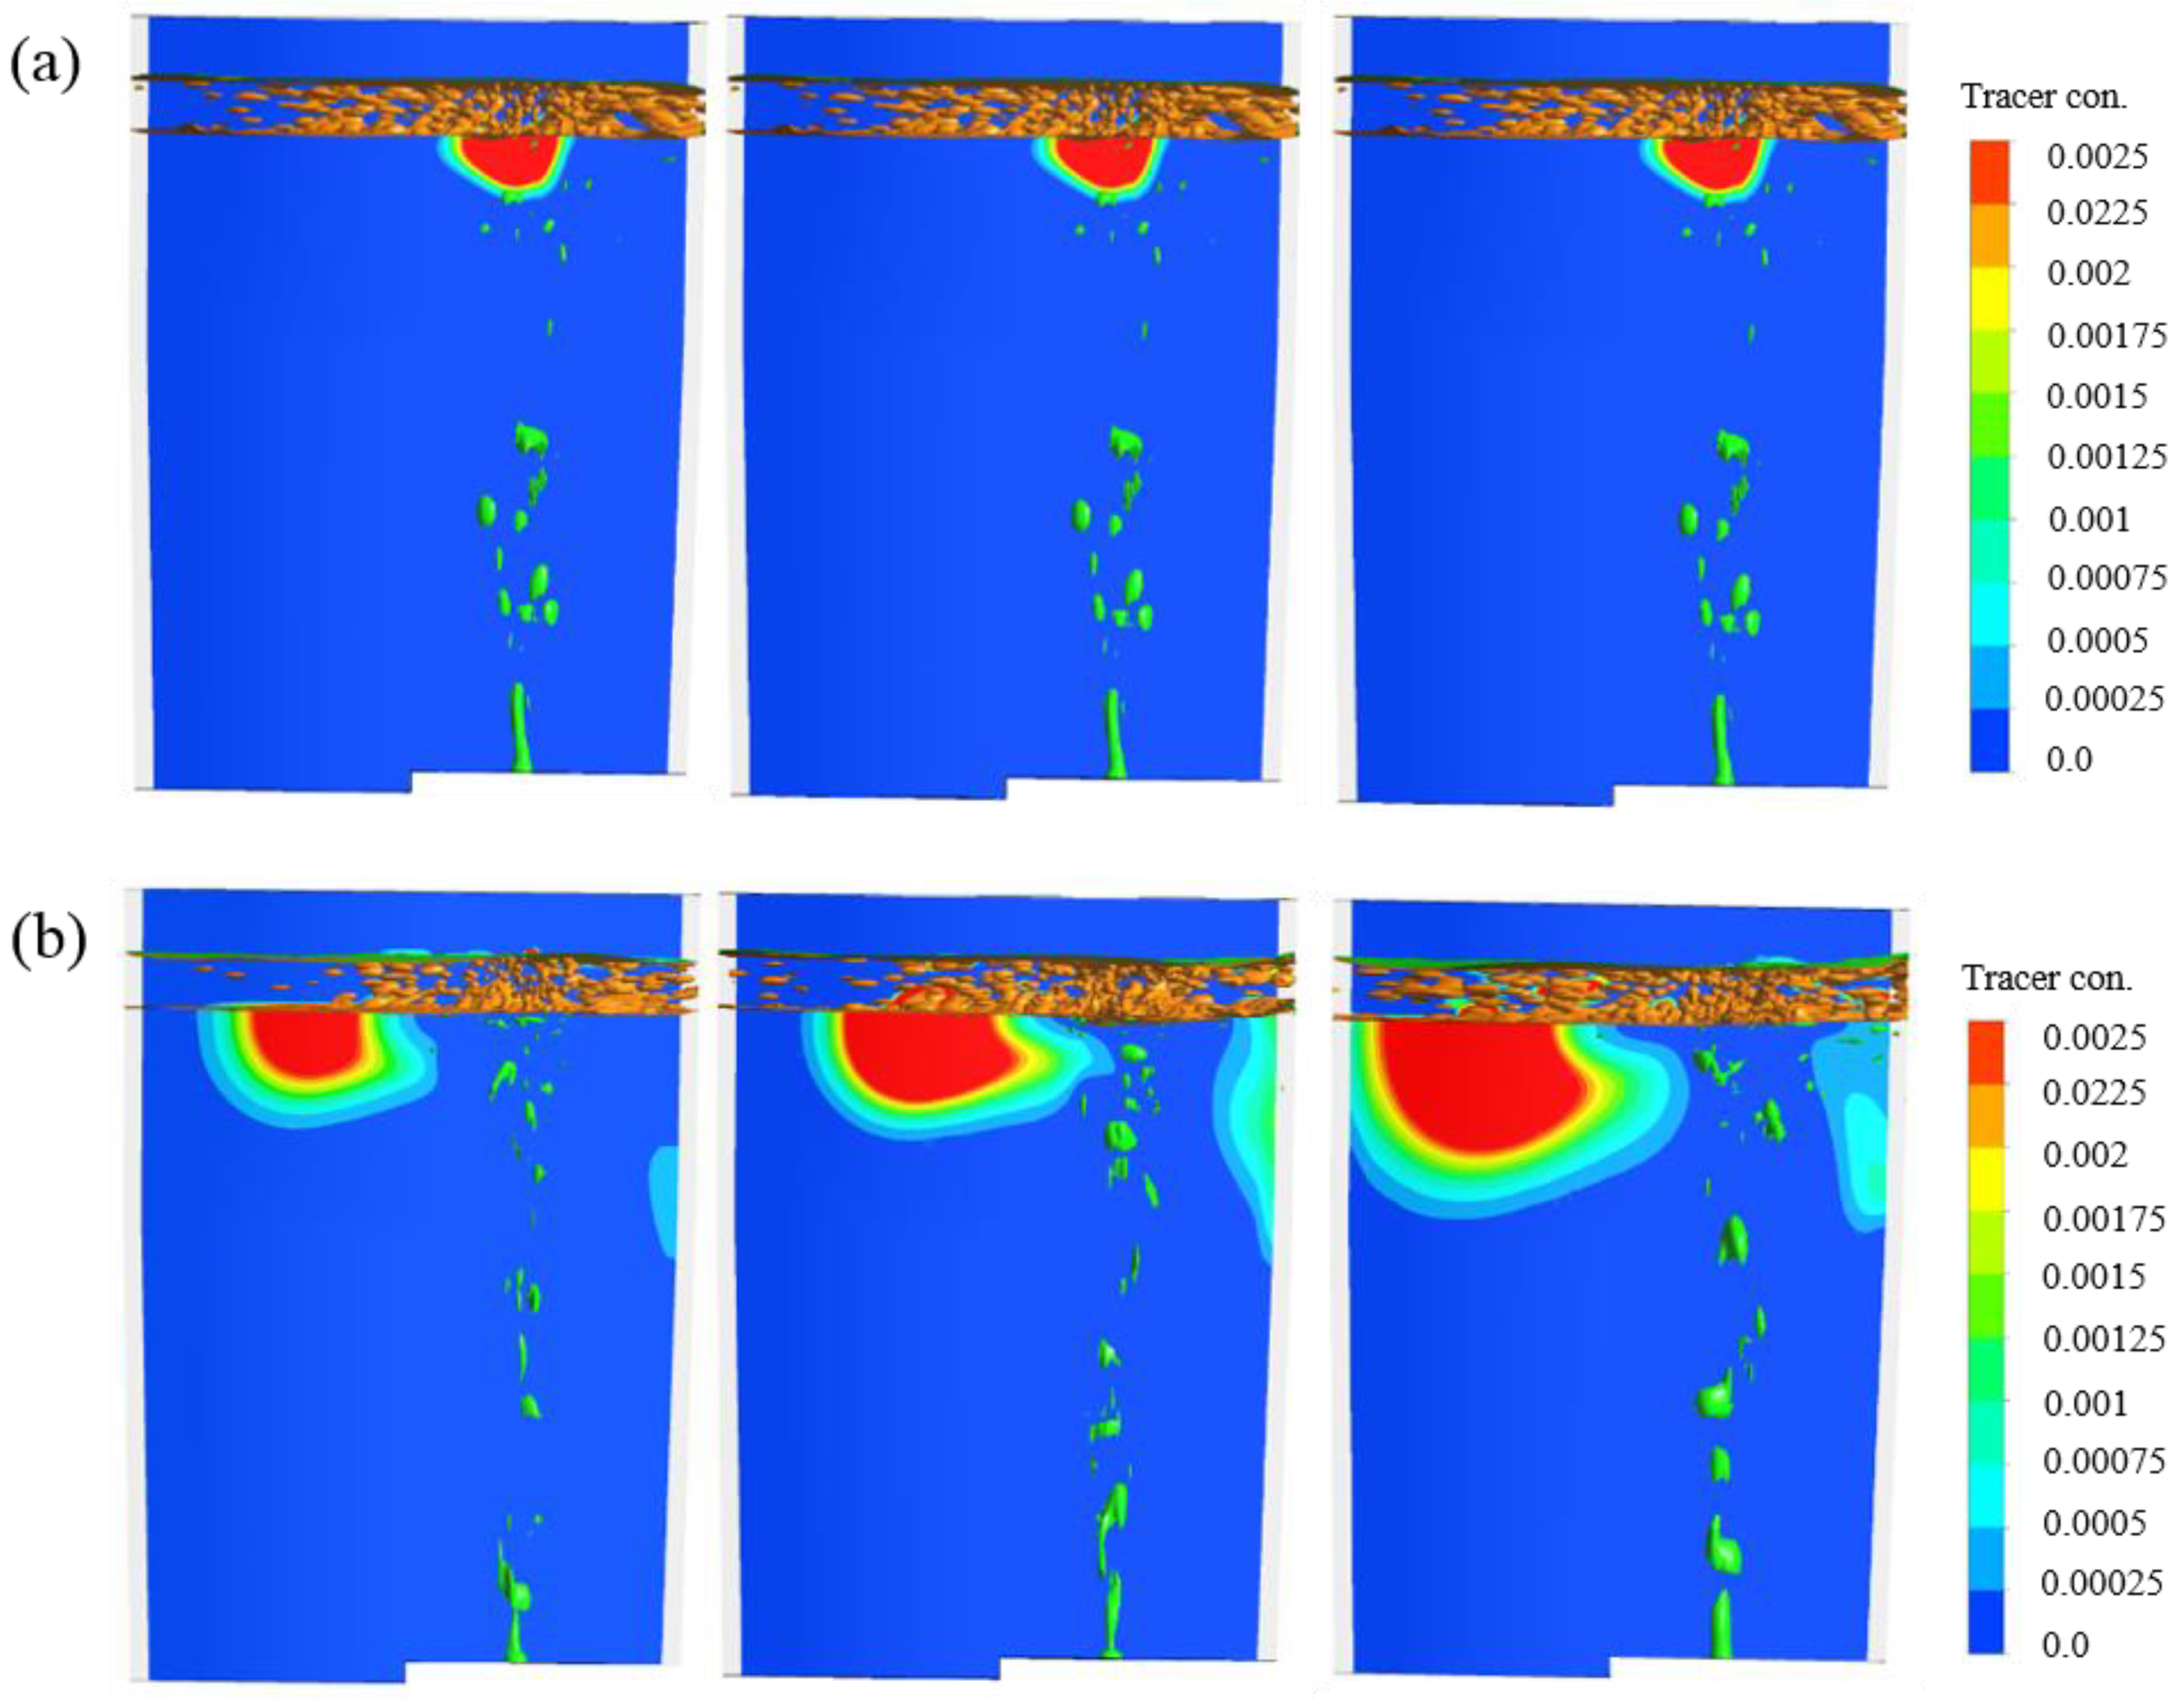
Figure 9 displays the concentration profiles of the tracer inside the ladle after an addition time of 0 s, 5 s, 10 s, 20 s, 40 s, or 60 s for different argon flow rates. At 0 s, the tracer is injected through the generated open-eye which is located at the top-right side of the ladle furnace (see Figure 9a). As seen in Figure 9b, the tracer started to dissolve into the molten steel at 5 s, but moved to the ladle surface due to the direction of the high gas flow coming through the nozzle located at the bottom of the ladle. The dissolution of tracer was higher at a gas flow rate of 500 NL/min, when compared to a low gas flow rate of 200 NL/min. The same trend of tracer distribution in the molten steel was followed at 10 s and 20 s (see Figure 9c,d). By 40 s, the tracer had spread out almost throughout the whole ladle at a gas flow rate of 500 NL/min, while for a gas flow rate of 100 NL/min, it was still dissolving, with approximately 65% dissolved. The tracer had almost spread out at 60 s for all gas flow rates as seen in Figure 9f, and the tracer was completely spread out when the ladle furnace was operated at a high gas flow rate of 500 NL/min.
Figure 10a–c depict typical tracer response curves of four monitoring points and the procedure adopted to evaluate the 95% mixing time for different argon flow rates. The average mixing time value at Point 1 from industrial measurements and numerical simulations are shown in Figure 10d. During the experiments, steel samples of concentration were taken from the ladle at certain intervals of time and at a certain location. The nickel alloying to steel was done at sampling point 0 to reach case-specific nickel aim-content. Steel samples were then used to evaluate the required mixing time for obtaining aim-nickel content, starting from point of alloying. It can be seen that with an increase in the argon gas flow rate, the mixing time decreased, and the same trend was followed in both experiments and simulations. The present results of mixing times in the industrial scale ladle are in good agreement with the simulation results of Liu et al. [26]. The numerical simulation values for mixing time agree fairly well with the industrial measurements, with a maximum error of 16.3%. The possible source for the error between the experiments and simulations is the tracer addition method and neglecting of shell formation and subsequent melting of the alloy in the simulations.

4. Conclusions

In this study, the effect of argon flow rate on the fluid flow, open-eye size, and mixing time were numerically investigated. The Eulerian VOF model was used to track the slag/steel/argon interface behavior, and a species transport model was used to calculate the mixing time. The simulation results of open-eye size and mixing time showed good agreement with the industrial measurements. The following conclusions can be drawn from the numerical simulations.
  • The flow patterns of the molten steel inside the ladle furnace are largely dependent on the argon flow rate. The flow velocity is very high at heights near to the bottom of the ladle furnace, and it tends to decrease as the flow moves upwards.
  • The increase in the flow rate of argon gas from 100 to 500 NL/min enlarges the open-eye size from 0.66 to 2.36 m2.
  • The simulated mixing time (95% criterion) of tracer addition into the metal bath decreased from 139 s to 96 s when the argon flow rate was increased from 100 to 500 NL/min.

Author Contributions

Investigation: E.K.R.; methodology, T.S. and M.L.; supervision, V.-V.V., P.S., T.F., and L.S.

Funding

The authors are grateful for the financial support of the European Commission under grant number 675715-MIMESIS–H2020-MSCA-ITN-2015, which is part of the Marie Sklodowska-Curie Actions Innovative Training Networks European Industrial Doctorate Program.

Acknowledgments

The authors are grateful to Sapotech Oy for the support to capture the formation of the open-eye process in the ladle at very high temperatures.

Conflicts of Interest

The authors declare no conflict of interest.

References

  1. Peranandhanthan, M.; Mazumdar, D. Modeling of Slag Eye Area in Argon Stirred Ladles. ISIJ Int. 2010, 50, 1622–1631. [Google Scholar] [CrossRef] [Green Version]
  2. Patil, S.P.; Satish, D.; Peranadhanathan, M.; Mazumdar, D. Mixing Models for Slag Covered, Argon Stirred Ladles. ISIJ Int. 2010, 50, 1117–1124. [Google Scholar] [CrossRef] [Green Version]
  3. Mandal, J.; Patil, S.; Madan, M.; Mazumdar, M. Mixing Time and Correlations for Ladles Stirred with Dual Plugs. Metall. Mater. Trans. B 2005, 36, 479–487. [Google Scholar] [CrossRef]
  4. Cao, Q.; Nastac, L. Mathematical Investigation of Fluid Flow, Mass Transfer, and Slag-steel Interfacial Behavior in Gas Stirred Ladles. Metall. Mater. Trans. B 2018, 49, 1388–1404. [Google Scholar] [CrossRef]
  5. Cao, Q.; Nastac, L. Mathematical Modeling of the Multiphase Flow and Mixing Phenomena in a Gas-Stirred Ladle: The Effect of Bubble Expansion. JOM 2018, 70, 2071–2081. [Google Scholar] [CrossRef]
  6. Cao, Q.; Nastac, L. Numerical Modelling of the Transport and Removal of Inclusions in an Industrial Gas-Stirred Ladle. Ironmak. Steelmak. 2018, 45, 984–991. [Google Scholar] [CrossRef]
  7. Valentin, P.; Bruch, C.; Kyrylenko, Y.; Köchner, H.; Dannert, C. Influence of the Stirring Gas in a 170-t Ladle on Mixing Phenomena- Formation and On-line Control of Open-eye at an Industrial LD Steel Plant. Steel Res. Int. 2009, 80, 552–558. [Google Scholar]
  8. Cloete, S.W.P.; Eksteen, J.J.; Bradshaw, S.M. A Mathematical Modelling Study of Fluid Flow and Mixing in Full-Scale Gas-Stirred Ladles. Prog. Comput. Fluid Dyn. 2009, 9, 345–356. [Google Scholar] [CrossRef]
  9. Cloete, S.W.P.; Eksteen, J.J.; Bradshaw, S.M. A Numerical Modelling Investigation into Design Variables Influencing Mixing Efficiency in Full Scale Gas Stirred Ladles. Miner. Eng. 2013, 46–47, 16–24. [Google Scholar] [CrossRef]
  10. Li, L.; Liu, Z.; Li, B.; Matsuura, H.; Tsukihashi, F. Water Model and CFD-PBM Coupled Model of Gas-Liquid-Slag Three Phase Flow in Ladle Metallurgy. ISIJ Int. 2015, 55, 1337–1346. [Google Scholar] [CrossRef]
  11. Li, L.; Li, B. Investigation of Bubble-Slag Layer Behaviors with Hybrid Eulerian-Lagrangian Modeling and Large Eddy Simulation. JOM 2016, 68, 2160–2169. [Google Scholar] [CrossRef]
  12. Li, L.; Liu, Z.; Cao, M.; Li, B. Large Eddy Simulation of Bubble Flow and Slag Layer Behavior in Ladle with Discrete Phase Model (DPM)-Volume of Fluid (VOF) Coupled Model. JOM 2015, 67, 1459–1467. [Google Scholar] [CrossRef]
  13. Gonzalez, H.; Ramos-Banderas, J.A.; Torress-Alonso, E.; Solorio-Diaz, G.; Hernandez-Bocanegra, C.A. Multiphase Modeling of Fluid Dynamic in Ladle Steel Operations Under Non-isothermal Conditions. J. Iron Steel Res. Int. 2017, 24, 888–900. [Google Scholar] [CrossRef]
  14. Amaro-Villeda, A.M.; Ramirez-Argaez, M.A.; Conejo, A.N. Effect of Slag Properties on Mixing Phenomena in Gas-stirred Ladles by Physical Modeling. ISIJ Int. 2014, 54, 1–8. [Google Scholar] [CrossRef] [Green Version]
  15. Zhu, M.Y.; Inomoto, T.; Sawada, I.; Hsiao, T.C. Fluid Flow and Mixing Phenomena in the Ladle Stirred by Argon through Multi-Tuyere. ISIJ Int. 1995, 35, 472–479. [Google Scholar] [CrossRef]
  16. Lou, W.; Zhu, M. Numerical Simulations of Inclusion Behaviour and Mixing Phenomena in Gas-stirred Ladles with Different Arrangement of Tuyeres. ISIJ Int. 2014, 54, 9–18. [Google Scholar] [CrossRef]
  17. Rodriguez-Avila, J.; Morales, R.D.; Najera-Bastida, A. Numerical Study of Multiphase Flow Dynamics of Plunging Jets of Liquid Steel and Trajectories of Ferroalloys Additios in a Ladle during Tapping Operations. ISIJ Int. 2012, 52, 814–822. [Google Scholar] [CrossRef]
  18. Liu, Z.; Li, L.; Li, B. Modeling of Gas-Steel-Slag Three-Phase Flow in Ladle Metallurgy: Part I. Physical Modeling. ISIJ Int. 2017, 57, 1971–1979. [Google Scholar] [CrossRef] [Green Version]
  19. Li, L.; Li, B.; Liu, Z. Modeling of Gas-Steel-Slag Three-Phase Flow in Ladle Metallurgy: Part II. Multi-scale Mathematical Model. ISIJ Int. 2017, 57, 1980–1989. [Google Scholar] [CrossRef] [Green Version]
  20. Liu, W.; Tang, H.; Yang, S.; Wang, M.; Li, J.; Liu, Q.; Liu, J. Numerical Simulation of Slag Eye Formation and Slag Entrapment in a Bottom-Blown Argon-Stirred Ladle. Metall. Mater. Trans. B 2018, 49, 2681–2691. [Google Scholar] [CrossRef]
  21. Haiyan, T.; Xiaochen, G.; Guanghui, W.; Yong, W. Effect of Gas Blown Modes on Mixing Phenomena in a Bottom Stirring Ladle with Dual Plugs. ISIJ Int. 2016, 56, 2161–2170. [Google Scholar] [CrossRef] [Green Version]
  22. Madan, M.; Satish, D.; Mazumdar, D. Modeling of Mixing in Ladles Fitted with Dual Plugs. ISIJ Int. 2005, 45, 677–685. [Google Scholar] [CrossRef]
  23. Wu, L.; Valentin, P.; Sichen, D. Study of Open Eye Formation in an Argon Stirred Ladle. Steel Res. Int. 2010, 81, 508–515. [Google Scholar] [CrossRef]
  24. Thunman, M.; Eckert, S.; Hennig, O.; Björkvall, J.; Sichen, D. Study of the Formation of Open-eye and Slag Entrainment in Gas Stirred Ladle. Steel Res. Int. 2010, 78, 849–856. [Google Scholar]
  25. Li, B.; Yin, H.; Zhou, C.Q.; Tsukihashi, F. Modeling of Three-phase Flows and Behavior of Slag/Steel Interface in an Argon Gas Stirred Ladle. ISIJ Int. 2008, 48, 1704–1711. [Google Scholar] [CrossRef] [Green Version]
  26. Liu, H.; Qi, Z.; Xu, M. Numerical Simulation of Fluid Flow and Interfacial Behavior in Three-Phase Argon-Stirred Ladles with One Plug and Dual Plugs. Steel Res. Int. 2011, 82, 440–458. [Google Scholar] [CrossRef]
  27. Singh, U.; Anapagaddi, R.; Mangal, S.; Padmanabhan, K.A.; Singh, A.K. Multiphase Modeling of Bottom-Stirred Ladle for Prediction of Slag-Steel Interface and Estimation of Desulfurization Behavior. Metall. Mater. Trans. B 2016, 47, 1804–1816. [Google Scholar] [CrossRef]
  28. Ramasetti, E.K.; Visuri, V.V.; Sulasalmi, P.; Mattila, R.; Fabritius, T. Modeling of the Effect of the Gas Flow Rate on the Fluid Flow and Open-Eye Formation in a Water Model of a Steel Making Ladle. Steel Res. Int. 2019, 90, 1–12. [Google Scholar] [CrossRef]
  29. Ramasetti, E.K.; Visuri, V.V.; Sulasalmi, P.; Gupta, A.K.; Palovaara, T.; Fabritius, T. Physical and CFD Modelling of the Effect of Top Layer Properties on the Formation of Open-eye in Gas-stirred Ladles with Single and Dual-plugs. Steel Res. Int. 2019. [Google Scholar] [CrossRef]
  30. Valencia, J.J.; Quested, P.N. ASM Handbook; ASM International: Geauga County, OH, USA, 2008; Volume 15, p. 468. [Google Scholar]
  31. Xie, Y.; Oeters, F. Experimental Studies on the Flow Velocity of Molten Metals in a Ladle Model at Centric Gas Blowing. Steel Res. Int. 1992, 3, 93–104. [Google Scholar] [CrossRef]
  32. Xie, Y.; Orsten, S.; Oeters, F. Behaviour of Bubbles at Gas Blowing into Liquid Wood’s Metal. ISIJ Int. 1992, 1, 66–75. [Google Scholar] [CrossRef]
Figure 1. Computational domain and mesh system of the industrial scale ladle.
Metals 09 00829 g001
Figure 2. Open-eye size in the ladle from experimental results (Z = 3.37 m): (a) Q = 100 NL/min, (b) Q = 300 NL/min, and (c) Q = 500 NL/min.
Metals 09 00829 g002
Figure 3. Open-eye size in the ladle from simulation results (Z = 3.37 m): (a) Q = 100 NL/min, (b) Q = 300 NL/min, and (c) Q = 500 NL/min.
Metals 09 00829 g003
Figure 4. Comparison between experimental and simulation results of time-averaged open-eye area.
Metals 09 00829 g004
Figure 5. Velocity distribution profiles for different gas flow rates from the ladle bottom: (a) 1.5 m (b) 3.0 m.
Metals 09 00829 g005
Figure 6. Turbulent kinetic energy profiles for different gas flow rates from the ladle bottom: (a) 1.5 m (b) 3.0 m.
Metals 09 00829 g006
Figure 7. Turbulent dissipation rate profiles for different gas flow rates from the ladle bottom: (a) 1.5 m (b) 3.0 m.
Metals 09 00829 g007
Figure 8. Monitoring points inside the ladle.
Metals 09 00829 g008
Figure 9. Tracer concentration profiles for different gas flow rates of 100 (left), 300 (middle), and 500 (right) NL/min with different time intervals: (a) 0 s (b) 5 s (c) 10 s (d) 20 s (e) 40 s (f) 60 s.
Metals 09 00829 g009aMetals 09 00829 g009b
Figure 10. Tracer concentration change for different gas flow rates of (a) 100 NL/min (b) 300 NL/min and (c) 500 NL/min. (d) Comparison of simulated average mixing time for different gas flow rate with the experimental values.
Metals 09 00829 g010aMetals 09 00829 g010b
Table 1. Parameters for experiments and simulations.
Physical Properties at 1812 KValueUnit
Density of liquid steel [30]6913kg/m3
Viscosity of liquid steel [30]0.005281Pa s
Density of slag2746kg/m3
Viscosity of slag0.081Pa s
Density of argon gas0.8739kg/m3
Viscosity of argon gas2.2616 × 10−5Pa s
Temperature of bath1812K
Flow rate of argon gas100, 300 and 500NL/min
Slag layer height35cm