Article

Study on Microstructure Evolution and Mechanical Properties of Ti2AlNb-Based Alloy under Canning Compression and Annealing

School of Materials Science and Engineering & National Key Laboratory for Precision Hot Processing of Metals, Harbin Institute of Technology, Harbin 150001, China
*
Authors to whom correspondence should be addressed.
Metals 2019, 9(9), 980; https://doi.org/10.3390/met9090980
Submission received: 14 August 2019 / Revised: 30 August 2019 / Accepted: 31 August 2019 / Published: 3 September 2019

Abstract

:
The influence of height reduction on the microstructure evolution and mechanical properties of the Ti2AlNb-based alloy was investigated during canning compression and subsequent annealing. After the annealing treatment, the spheroidized B2 phase grains occurred because of partial recrystallization. Meanwhile, the texture evolution of the B2 phase and O phase were analyzed under the deformation degree, ranging from 25% to 75%. The results show that the mechanical properties of the post-annealed alloys were co-affected by the grain size and Schmid factor of the B2 phase. When the height reduction was less than 25%, the compression strength was mainly affected by the grain size. When the height reduction was higher than 50%, it was mainly dominated by the Schmid factor. When the deformation degree reached 75%, the recrystallized grain size decreased to 0.9 μm. Meanwhile, the Schmid factor of a {110}<001> slip system in B2 phase reduced to 0.34. Therefore, the yield strength of the Ti2AlNb alloy at room temperature increased from 892 MPa in the as-rolled condition to 935 MPa after the canning compression and annealing.

1. Introduction

Recently, Ti2AlNb-based alloys have become one of the most notable titanium aluminides, which possess attractive advantages, such as high strength and excellent creep resistance, and have great application potential in aviation and aerospace fields [1,2,3,4,5]. The typical Ti2AlNb-based alloys consist of O phase (Ti2AlNb, Cmcm symmetry), B2 phase (BCC, ordered Pm3m symmetric structure)/β phase (disordered structure), and α2 phase (HCP, Ti3Al, and DO19 P63/mmc symmetrical structure) [6,7]. The mechanical properties of the Ti2AlNb-based alloys are significantly influenced by the microstructure, phase composition, and B2 grain size [8,9,10]. It is of great importance to control and optimize the microstructures of Ti2AlNb-based alloys in order to improve their strength and ductility simultaneously.
Up until now, many researchers have focused on investigating the microstructure evolution and the mechanical properties of Ti2AlNb-based alloys by virtue of various methods, including composition modification [11], hot working [12], and heat treatment [13]. For instance, the as-extruded Ti–22Al–25Nb (atom%) alloy bars were successfully prepared by elemental powder metallurgy and subsequent hot extrusion (1200 °C, extrusion ratio of 10.56:1), and the average diameter of the dynamic recrystallization (DRX) grains was refined to 16.1 µm [14]. For the current-assisted heat treatment of the as-rolled Ti–22Al–24Nb–0.5Mo alloy, during isothermally soaking at 1050 °C for 3 min, 5 min, 10 min, and 15 min, the volume fractions of the recrystallized grains were statistically evaluated as being 11.5%, 65.1%, 93.5%, and 97.6% respectively, and the average sizes of the B2 grains increased from 1.7 μm to 13.8 μm [15]. Generally, adjusting the heat treatment parameters can regulate the phase composition, phase percentage, and grain size in order to optimize the mechanical performance of the materials [11,16]. For example, the intrinsic plasticity of Ti–22Al–27Nb would be improved as the disordered degree of the B2 phase is increased with the Nb concentration increasing [17]. Emura et al. [18] successfully controlled the initial B2 grain size of a Ti–22Al–27Nb (atom %) alloy to be within the range of 8–49 µm through the pinning effect of spherical α2 particles on inhibiting grain growth by a pre-alloyed powder metallurgy method.
Usually, severe plastic deformation (SPD) based on cold working, which produces a high density of dislocations, can refine the microstructure to a nanoscale. Recently, SPD processes, such as equal-channel angular pressing (ECAP) [19,20], accumulative roll bonding (ARB) [21], high-pressure torsion (HPT) [22], cold rolling [23,24], cold drawing [24,25], and surface mechanical attrition treatment (SMAT) [26,27], have been developed to achieve exceptional grain refinement in many metallic materials.
However, limited research has been carried out on the SPD process of Ti2AlNb-based alloys, because of their low ductility and high yield strength. Moreover, the subsequent annealing treatment has an important influence on the mechanical property of Ti2AlNb-based alloys, subject to the SPD process, as the occurrence of static recrystallization during annealing may cause an evident microstructure change. Nevertheless, the study on the static recrystallization of Ti2AlNb-based alloys processed by SPD, especially for canning compression, which can enhance the plasticity of the inserted sample with can under the three-dimensional compressive stress state, is rarely reported.
In a present study, a Ti–22Al–24Nb–0.5Mo alloy was subjected to canning compression with different high reductions, as well as subsequent annealing treatment. The influence of the static recrystallization on the microstructure evolution and mechanical properties of the can-compressed Ti2AlNb-based alloy during annealing was investigated, and the relationships among the grain size, slip system, texture evolution, and mechanical property were also discussed.

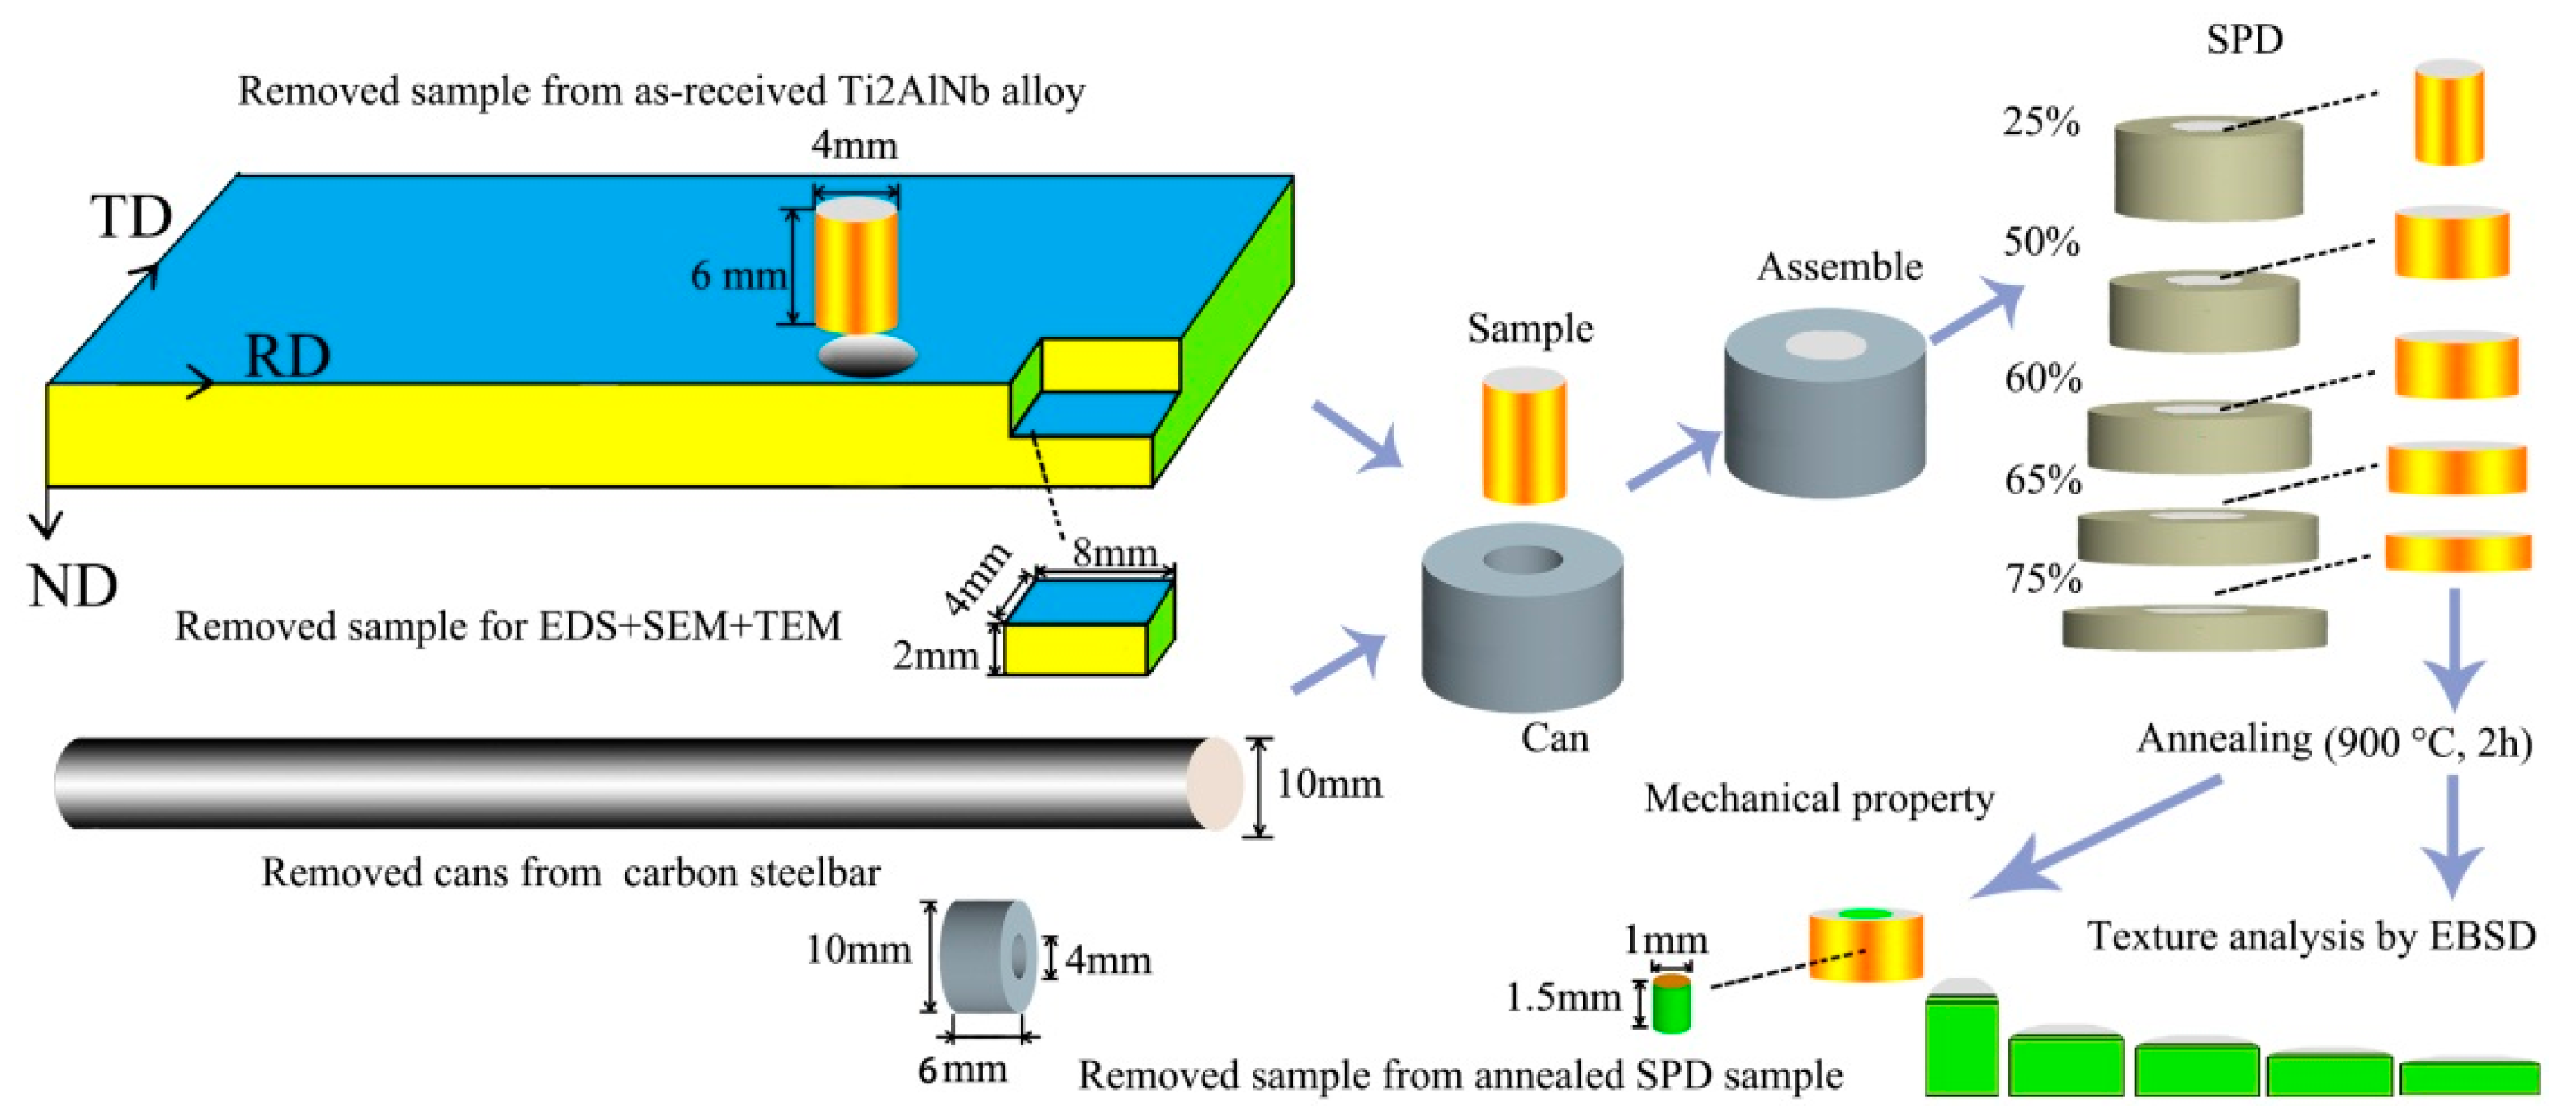
2. Materials and Methods

The as-rolled Ti–Al–Nb–Mo sheet with a thickness of 11.7 mm was provided by Baoji Titanium Industry Co, Ltd. (Baoji, China). The chemical composition of the as-rolled sheet was measured to be Ti–19Al–23Nb–0.5Mo in atomic percent, through inductively coupled plasma mass spectrometer (ICP) (Optima 5300 DV, PerkinElmer, Waltham, MA, USA), as listed in Table 1.
Figure 1 presents a schematic diagram of the experimental procedure. The samples with a diameter of 4 mm and a thickness of 6 mm were machined from the Ti2AlNb-based alloy sheet, and then capsulated into carbon steel cans with a thickness of 6 mm. Subsequently, the canned Ti2AlNb-based samples were compressed on a universal testing machine (SHIMADZU, AG-X Plus 250kN/50kN, Kyoto, Japan) at room temperature, with a strain rate of 0.05 s−1. For analyzing the influence of the deformation degree on the recrystallized grain, texture evolution, and mechanical properties, different height reductions of 25%, 50%, 60%, 65%, and 75% were applied.
After compression, the Ti2AlNb specimens were removed from the steel cans. The compressed specimens were sealed in vacuum quartz tubes, and underwent annealing treatment at 900 °C for 2 h, followed by quenching into cool water. This annealing mode was actually conducted in the α2 and O and B2 three-phase region, in which the α2 and O and B2 microstructure with an optimal balance between strength and ductility could be maintained [7]. The electron back scattering diffraction (EBSD) analysis was carried out on scanning electron microscopy (SEM, Quanta 200FEG, FEI Company, Hillsborough, OR, USA), where the radiation condition was 30 kV and 6.5 mA. To reveal the effect of compression and annealing on the microstructure and mechanical properties of the Ti2AlNb-based alloy, samples with a diameter of 1 mm and height of 1.5 mm were cut from the as-rolled sheet and can-compressed samples, subject to annealing treatment.
All of the slice specimens used for the SEM and EBSD analysis were cut from the samples along the longitudinal sections. The SEM and EBSD samples were electropolished in a solution of perchloric acid, methyl alcohol, and butanol, with a ratio of 6:60:34 for 120 s at a temperature of about −20 °C. The Ti2AlNb specimens for the TEM test were mechanically milled to about 70 μm, followed by twin–jet electropolishing using a solution of perchloric acid, methyl alcohol, and butanol, with a ratio of 6:60:34 at −20 °C and 25 V.
The mechanical properties of the as-rolled and can-compressed Ti2AlNb alloys subject to annealing treatment were analyzed by the microhardness test and uniaxial compression experiment. The microhardness was measured on an HVS-1000A microhardness tester provided by Laizhou Huayin Testing Instrument Co., Ltd., Laizhou, China, with a Vickers indenter under a load force of 1000 g and a dwell time of 15 s, according to the American Society for Testing Materials (ASTM) standard E384-99. The compression experiment was conducted on a universal testing machine (SHIMADZU, AG-X Plus 20kN/5kN, Kyoto, Japan). In each compression condition, the individual uniaxial compression tests were repeated three times. The Vickers microhardness tests were repeated 10 times.
The volume fraction of the phases were determined by image analysis on scanning electron micrographs using the Image-Pro Plus software (Media Cybernetics company, Rockville, USA), which has been used to determine the average values of the complex microstructural features in the study of Jiao and Xu et al. [28,29]. Each statistical value was obtained from three images in order to ensure the measurement accuracy.

3. Results and Discussion

3.1. Initial Microstructure

Figure 2 illustrates the SEM and TEM images for the as-rolled Ti2AlNb alloy sheet. As shown in Figure 2a, there are two morphologies of O phase, that is the rim O phase around the α2 phase and lath O phase embedded in a B2 matrix [30], which can be further confirmed by the TEM observation as shown in Figure 2b,c, respectively (the B2 phase, a = b = c = 3.192 Å; α2 phase, a = 5.780 Å, b = 5.780 Å, c = 4.647 Å; O phase, a = 6.089 Å, b = 9.569 Å, c = 4.66 Å [10]). The volume fractions of the different phases in the as-rolled sample were calculated by the Image-Pro Plus software using backscattered electron SEM micrographs, and the volume fraction of the α2, O, and B2 phases were estimated to be 5.7%, 42.5%, and 51.7%, respectively.

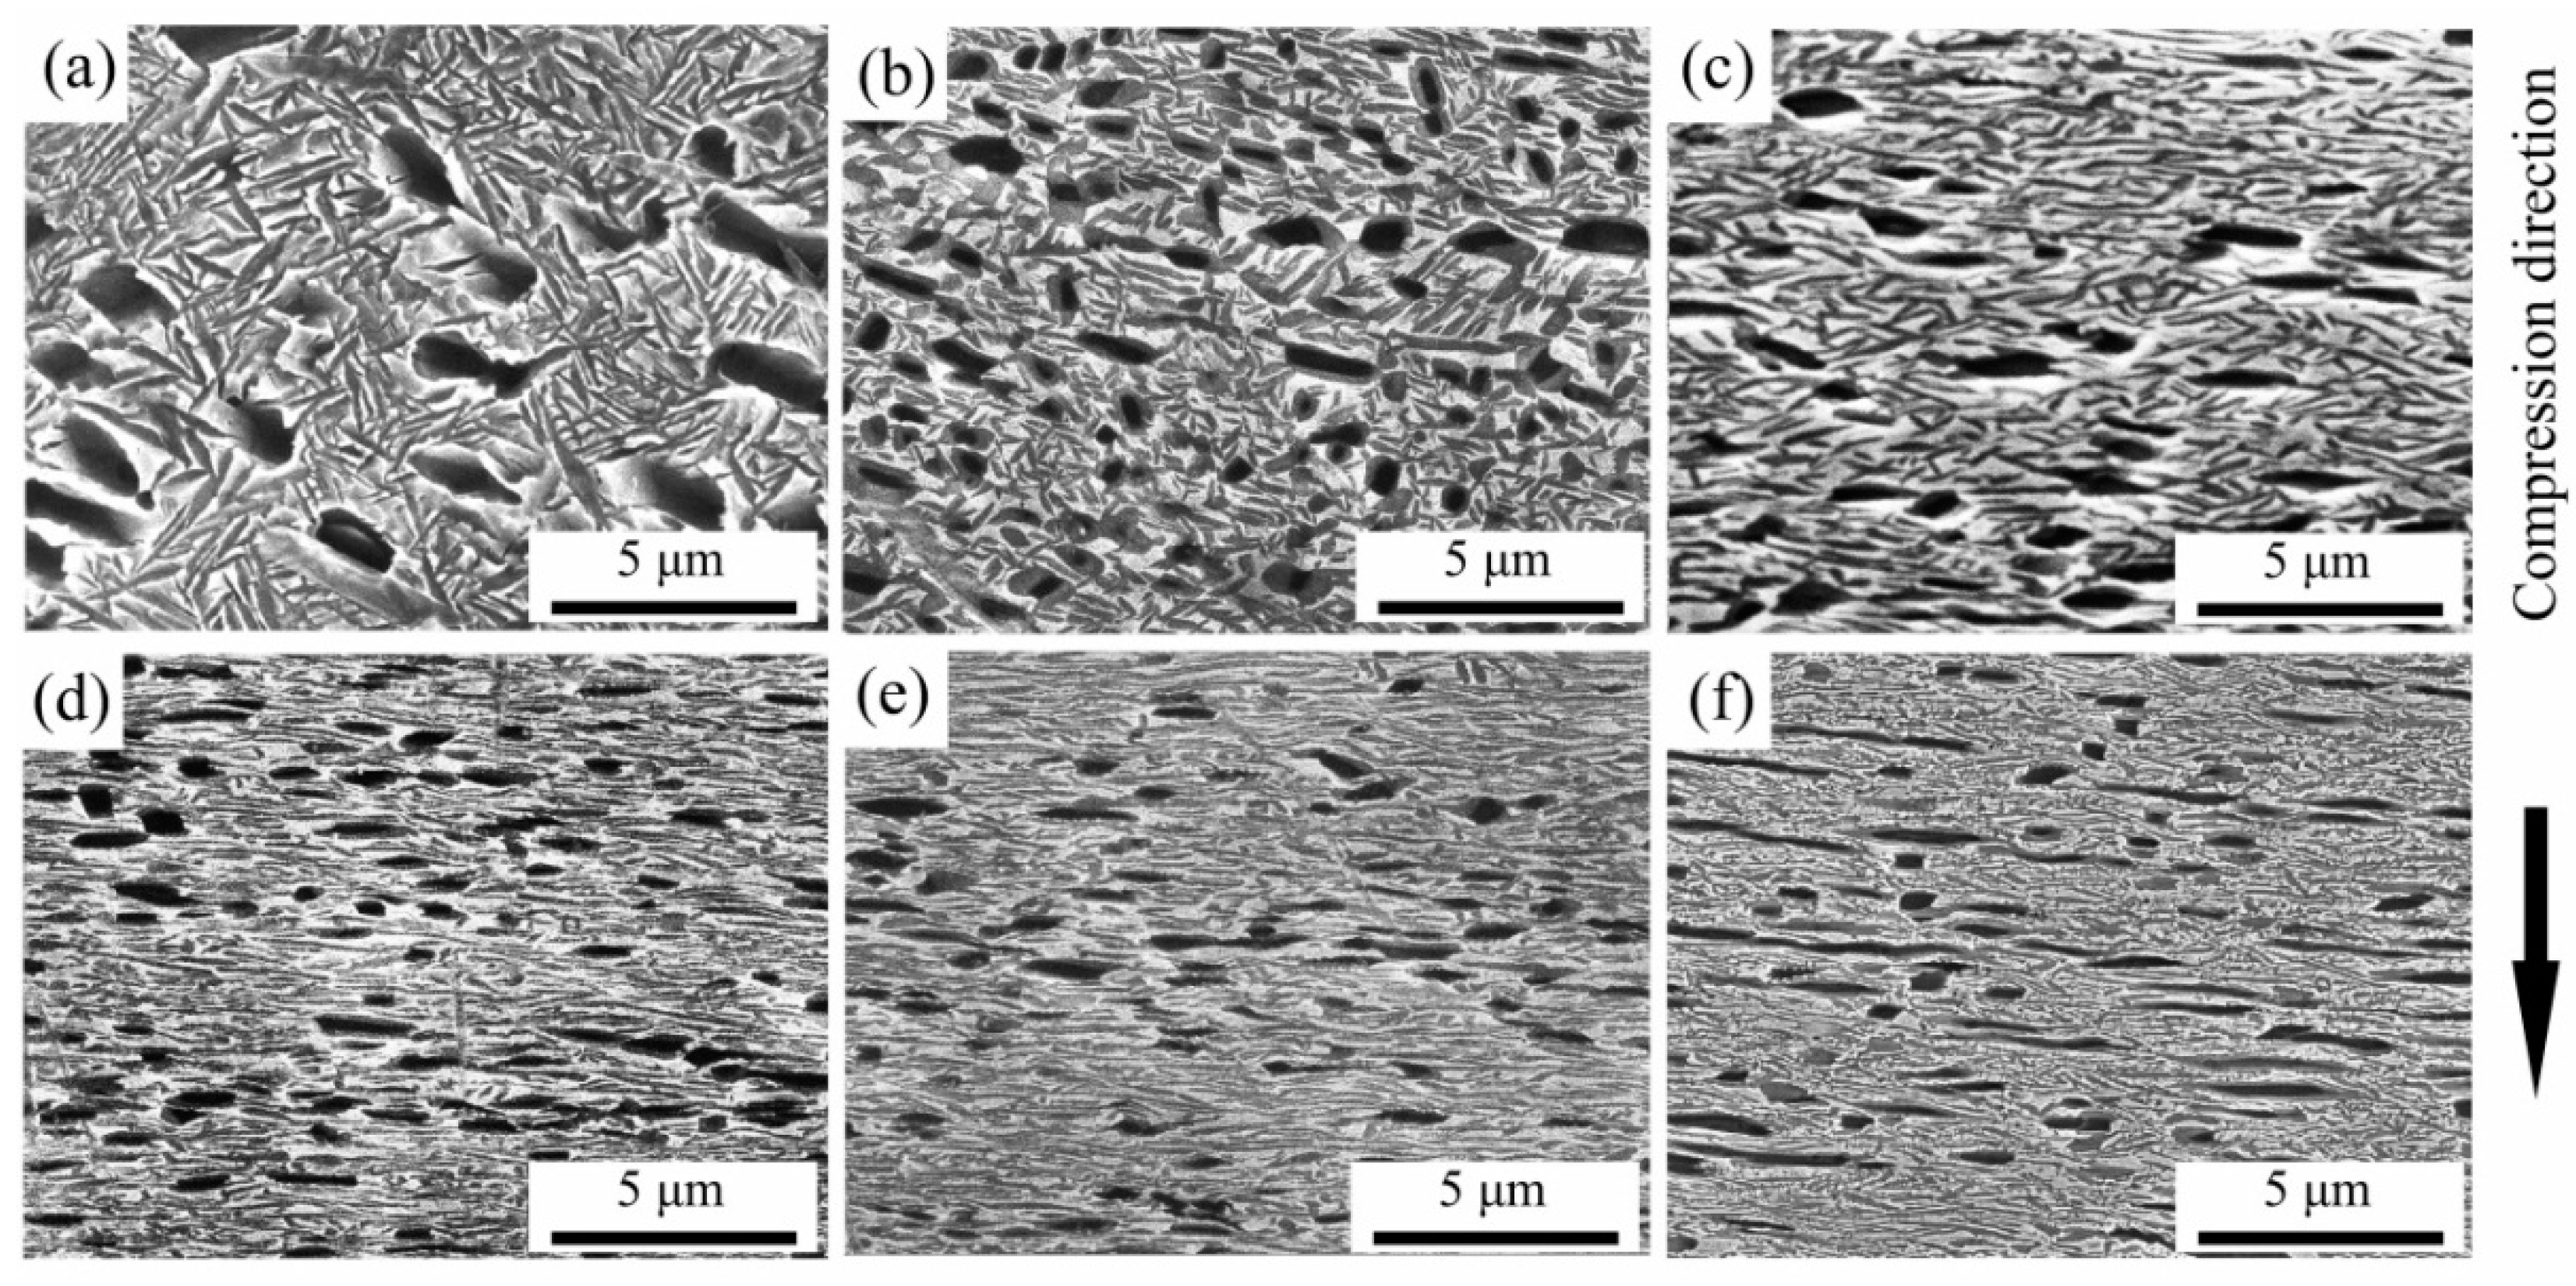
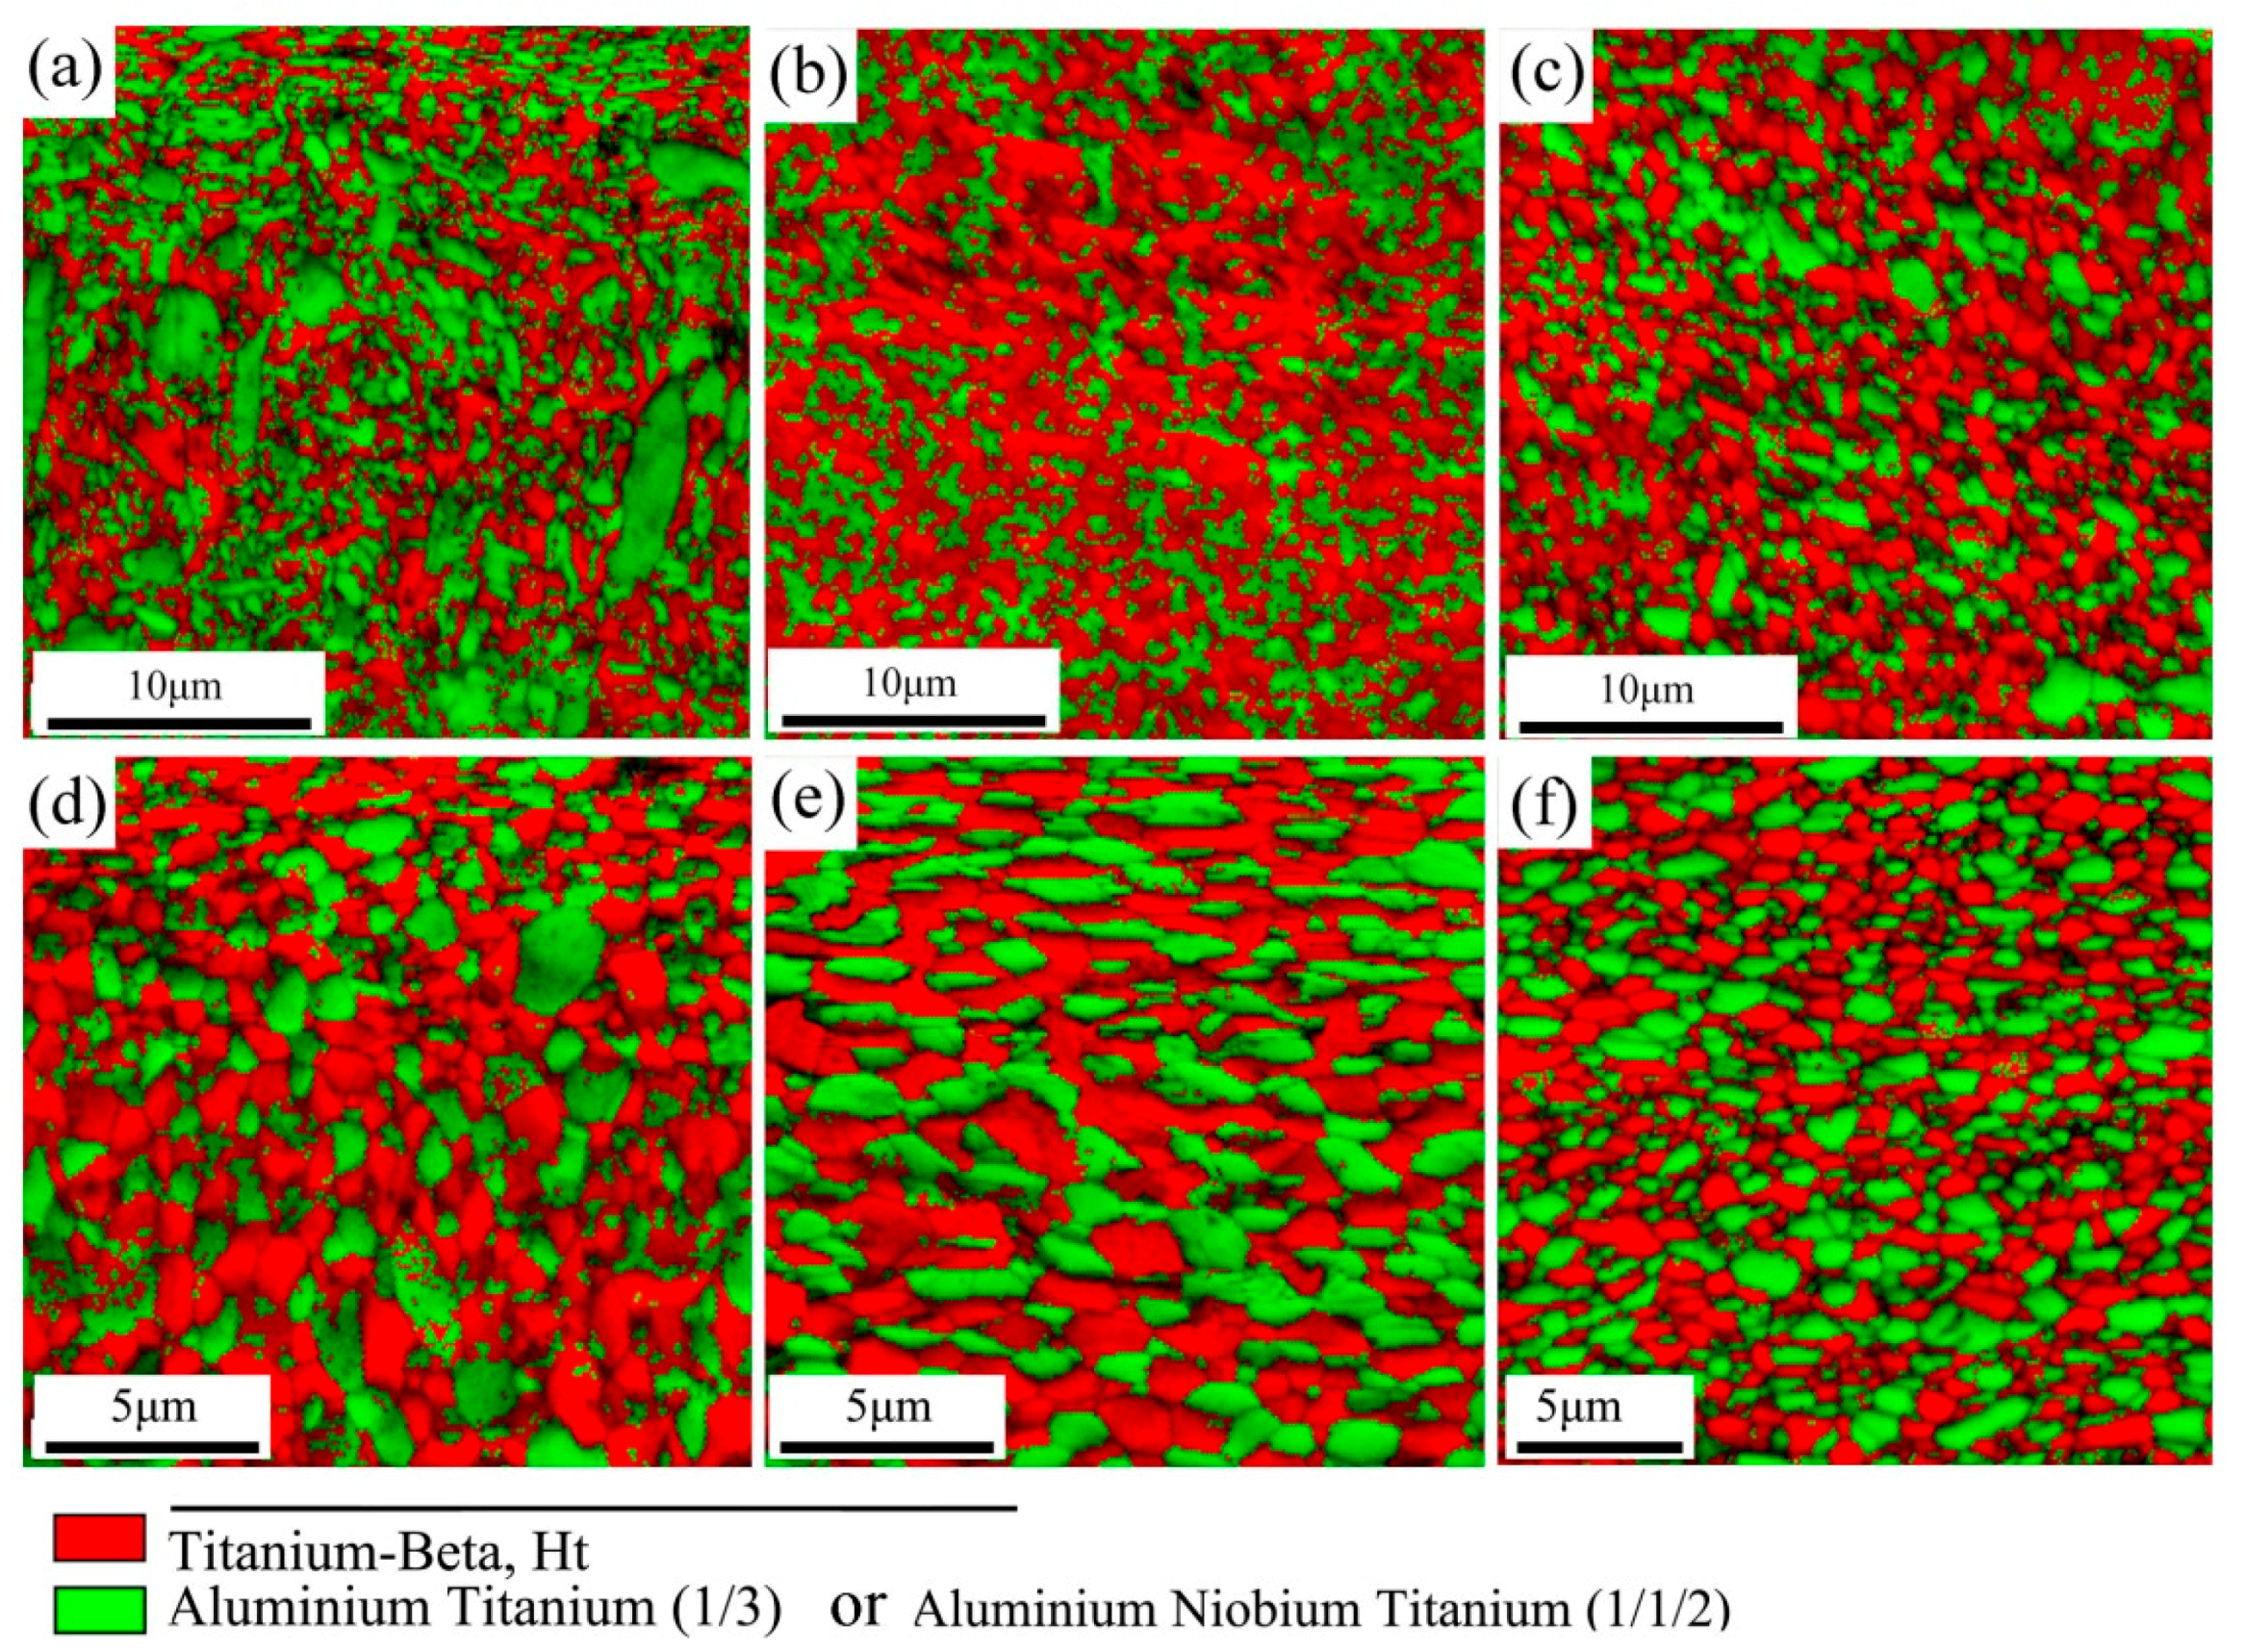
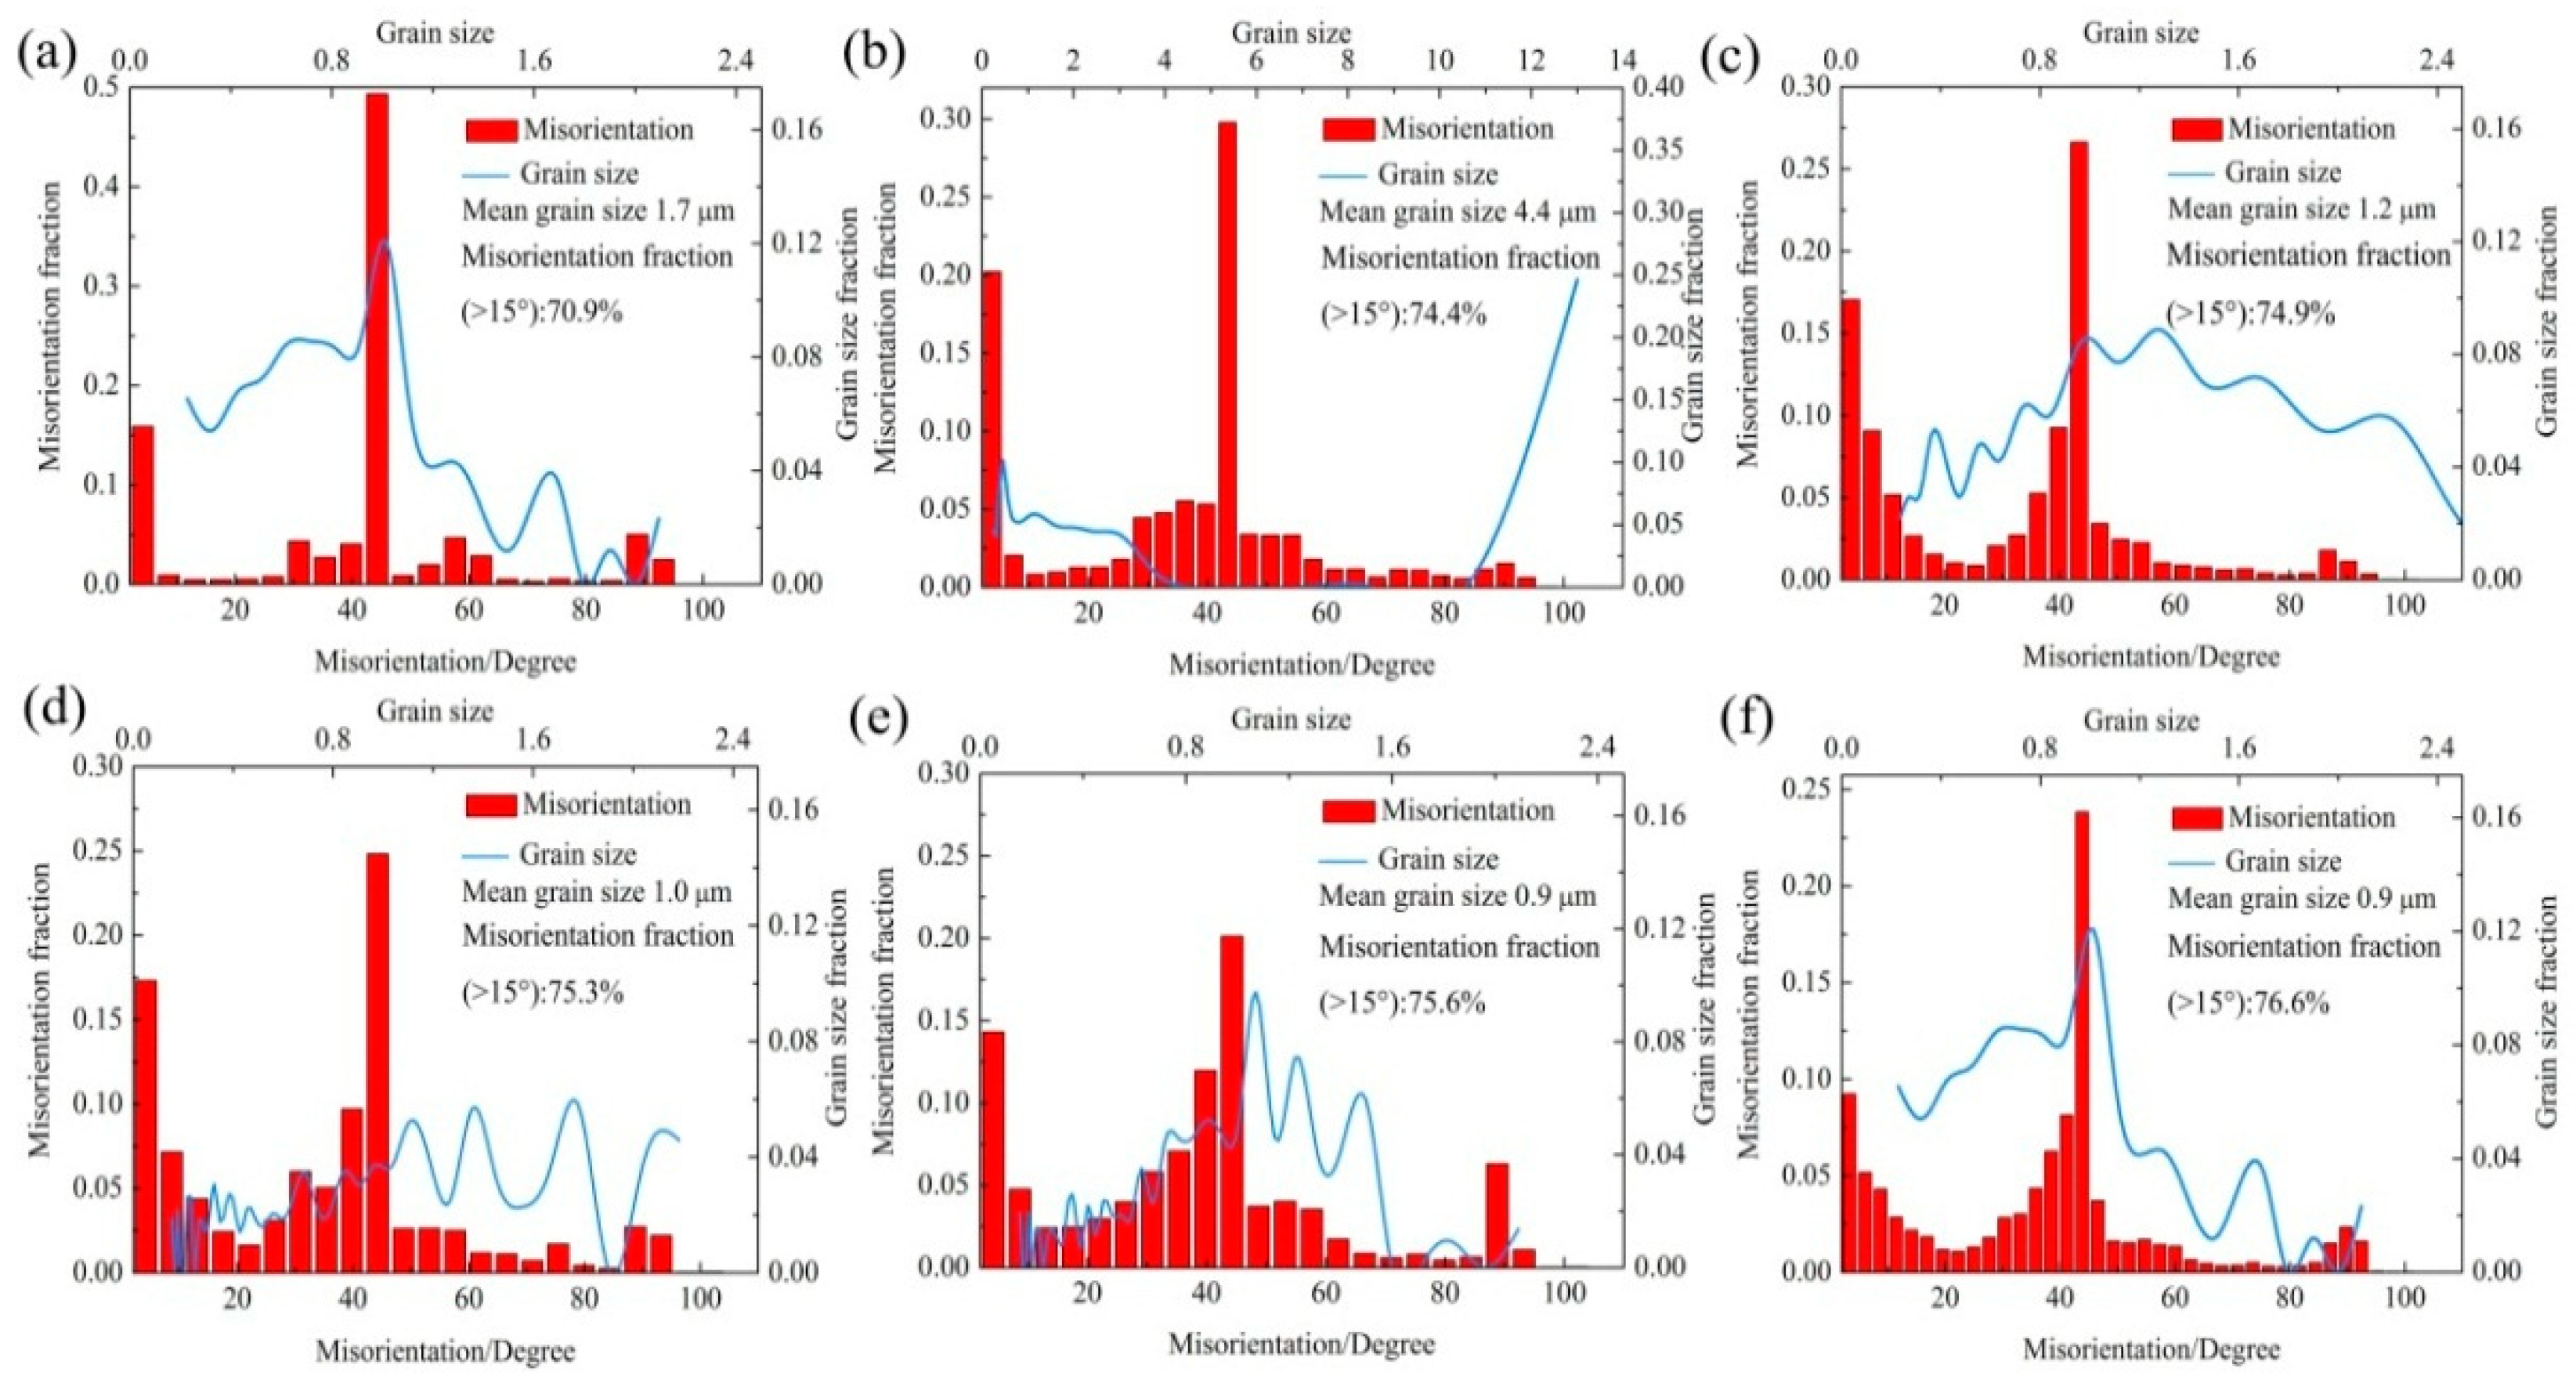
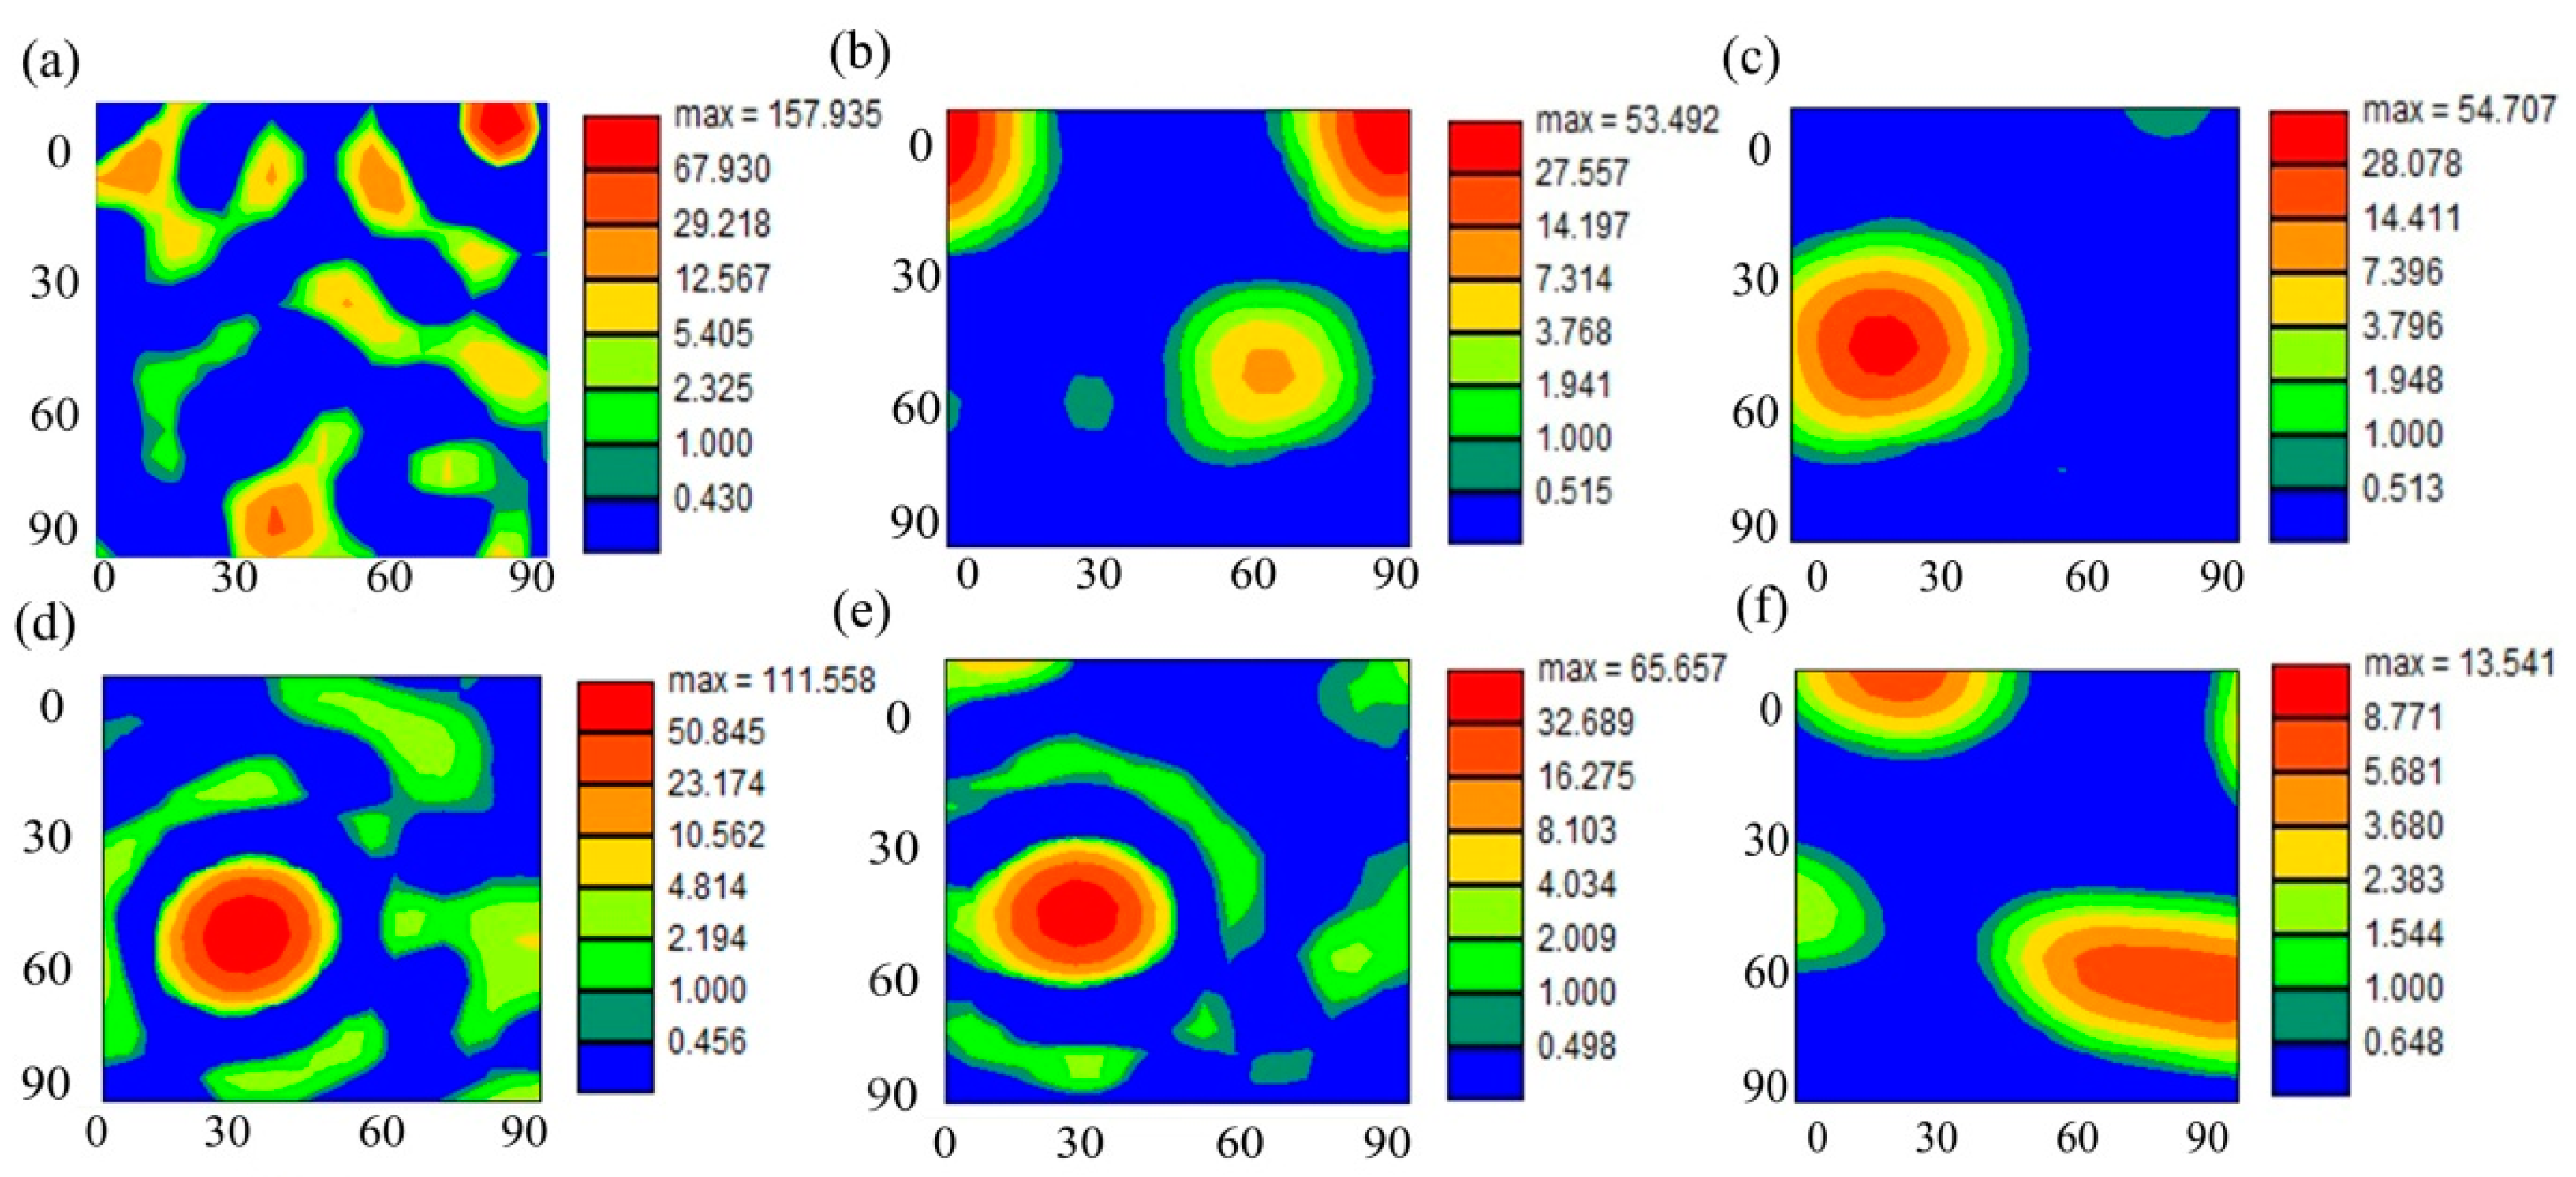
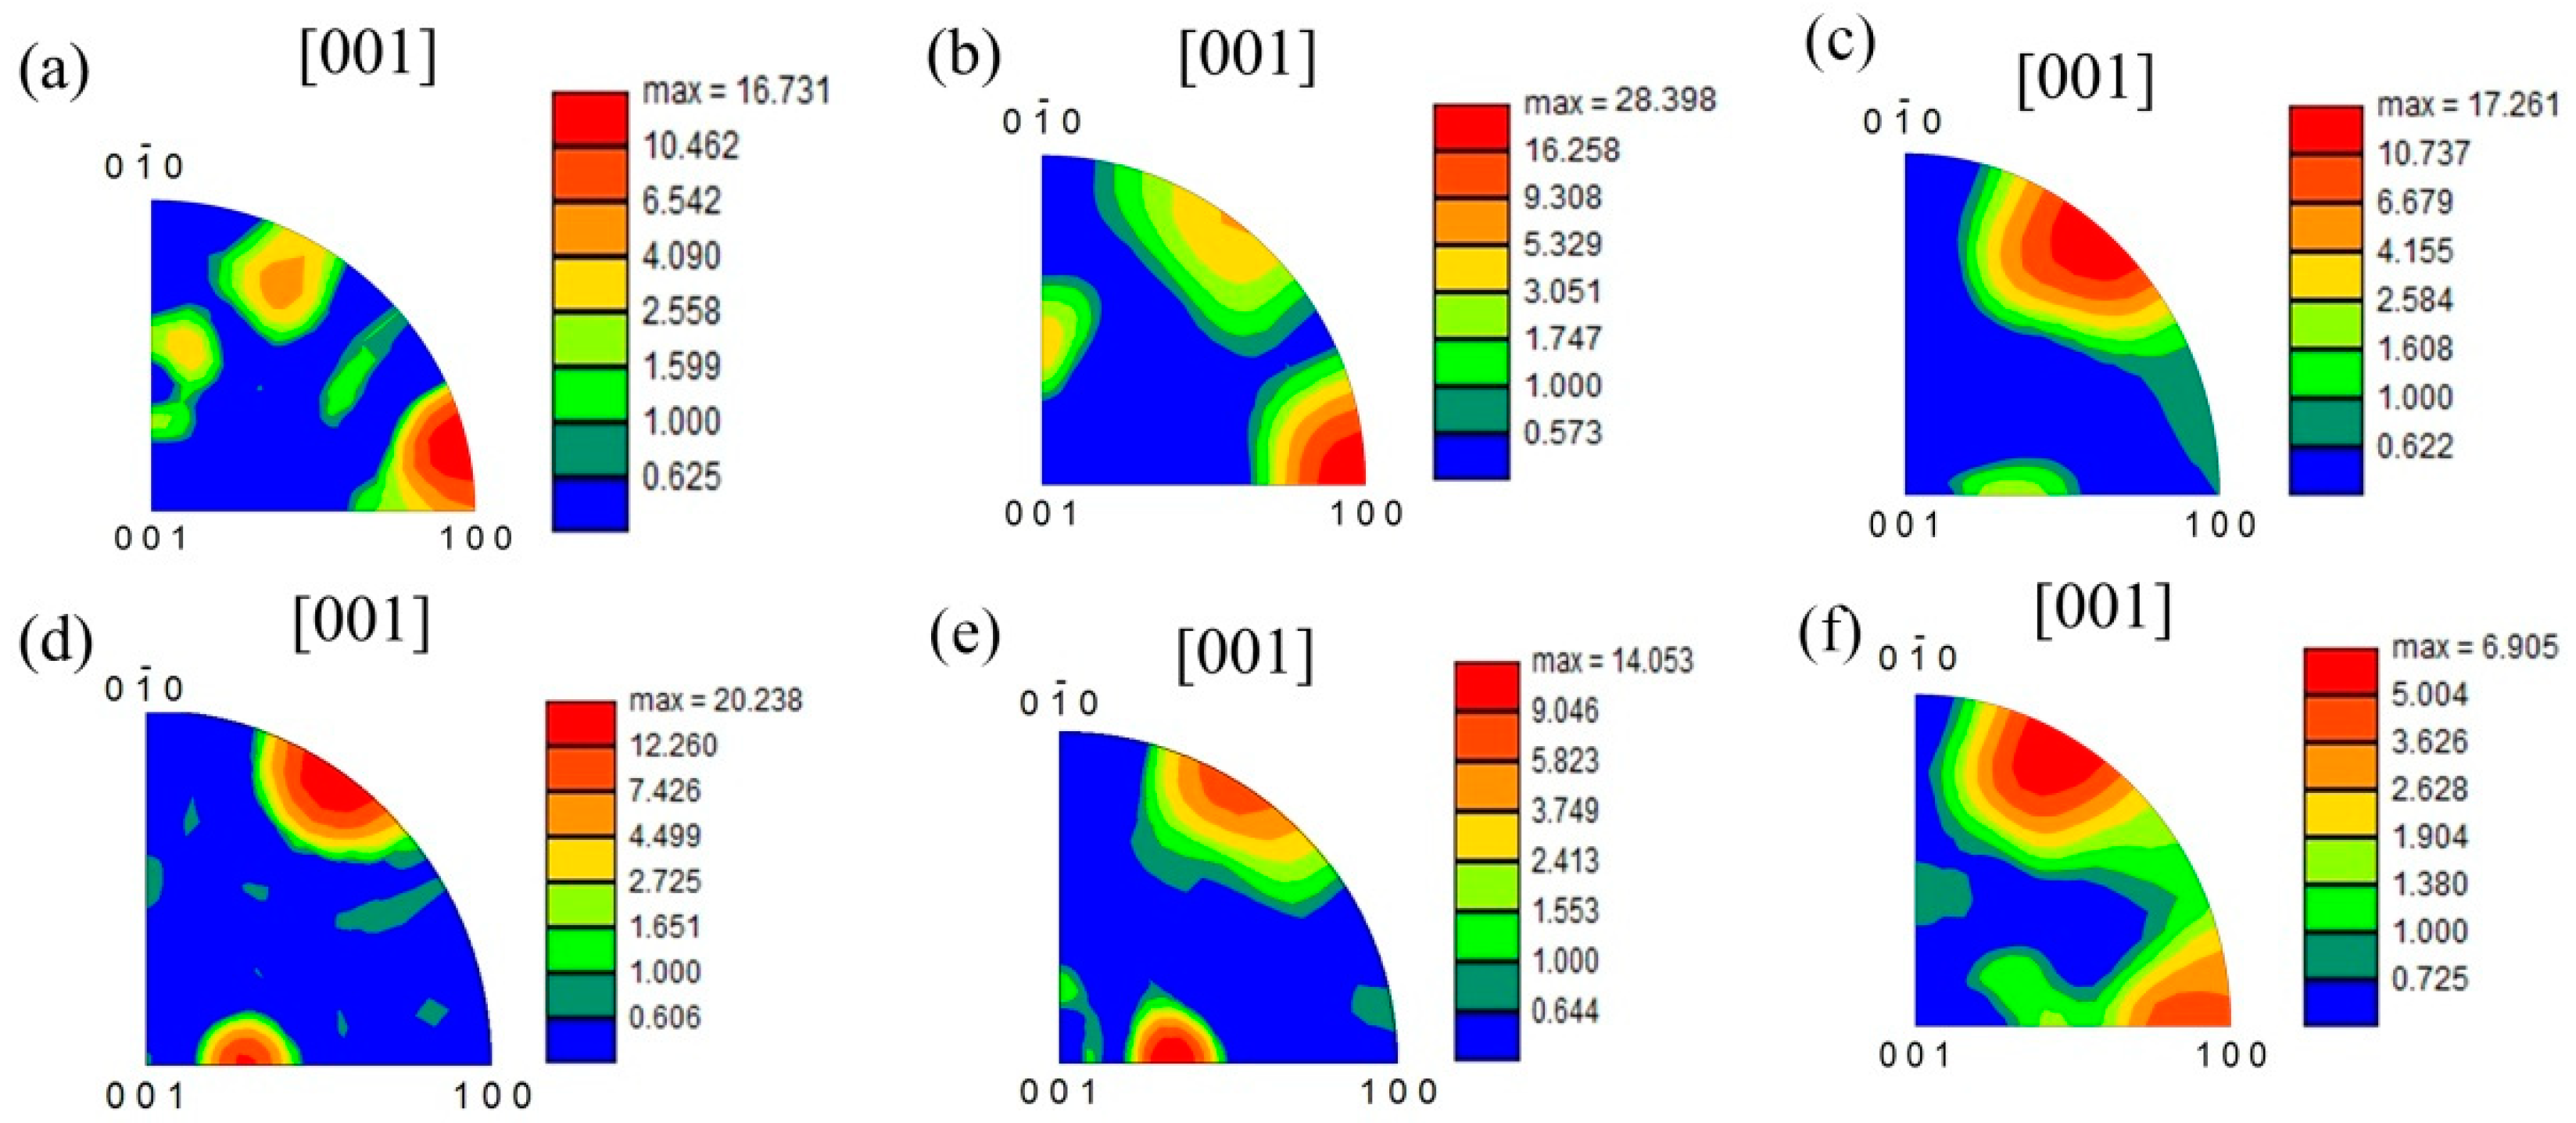
3.2. Microstructure Evolution during Canning Compression and Annealing

Figure 3 presents the SEM images of the as-rolled and can-compressed samples with different height reductions. Figure 4 shows the SEM microstructures of the as-rolled alloy and can-compressed samples subject to annealing treatment at 900 °C for 2 h. It can be seen from Figure 3 that with the increment of height reduction during compression, the O phase and α2 phase were deformed and gradually elongated vertically to the compression direction in the B2 matrix. After the annealing treatment, both the O phase and α2 phase were spheroidized obviously, as shown in Figure 4. The fraction of each phase in different annealing-treated samples was calculated by the Image-Pro Plus software, as shown in Table 2. The results show that there was no significant change in the volume fractions of various phases in the as-rolled sample subject to annealing treatment. With the increasing of the height reduction, the B2 phase content increased from 48.3% to 53.2% after annealing. The O phase content reduced from 45.4% to 37.7%. The α2 phase content increased slightly from 6.3% to 9.1%. Obviously, the B2 phase volume fraction was much greater than the O and α2 phase in the Ti2AlNb-based alloy.
Figure 5 illustrates the phase and image quality (IQ) maps of the as-rolled and can-compressed samples subject to annealing treatment. As a result of the similarity of the crystal structure between the α2 and O phase, it is difficult to make an accurate distinction between them by EBSD analysis. Therefore, the two phases were integrated as the O phase in the EBSD photos, as shown in the green color [31]. As the continuous matrix of the Ti2AlNb-based alloy, the B2 phase possessed the most important influence on its mechanical property, thus it was necessary to analyze the grain size and texture evolution of the B2 phase during the annealing treatment. The corresponding grain size distribution and misorientation fraction of the B2 phase are shown in Figure 6. When the height reduction reached 50%, amounts of spheroidized recrystallization grains were formed, as shown in Figure 5c. With the increase of the deformation degree, the mean grain size of the recrystallized grains decreased from 4.4 μm to 0.9 μm, as shown in Figure 6. The misorientation (>15°) distribution shows that partial static recrystallization occurred after the annealing treatment. Moreover, the recrystallization fractions in the can-compressed specimens after the annealing treatment were greater than that of the post-annealed as-rolled alloy.
Figure 7 and Figure 8 present the inverse pole figure (IPF) results of the B2 phase of the as-rolled and can-compressed samples subject to annealing treatment. In addition, Figure 9 shows the B2 phase orientation distribution function (ODF) figures by means of EBSD analysis. As shown in Figure 7a, Figure 8a and Figure 9a, the as-rolled alloy had a strong (001)[ 1 ¯ 1 ¯ 0] B2 phase texture (see Figure 9a top right corner). When the height reduction reached 25%, the B2 phase texture exhibited <001>//ND and <111>)//ND, with the maximum texture intensity of 9.831, as illustrated in Figure 7b, Figure 8b and Figure 9b. When the height reduction reached 50%, only the <111>//ND γ texture could be found, as shown in Figure 7c, Figure 8c and Figure 9c. When the height reduction gradually increased to 60%, 65%, and 75%, the maximum texture intensity decreased from 16.8 to 8.7. This indicates that when the deformation degree reached 60%, the <111>//ND γ texture intensity rose up to a maximum value. It should be noted that when the compression degree reached 75%, the (001)[1 1 ¯ 0] texture was generated, as shown in Figure 9f, and the texture intensities of <111>//ND and <001>//ND were both less than 2.71.
It can be found that, when the height reduction increased from 25% to 50%, the B2 phase texture evolution was similar to the results of the texture evolution in β titanium alloy during uniaxial compression in a previous research [32]. Also, when the uniaxial compression degree reached 50%, the <111>// ND γ fiber texture occurred in NiTiFe shape memory alloy [33].
Figure 10 presents the IPF of the O phase of the as-rolled and can-compressed samples subject to annealing treatment. The <001>//ND and <110>//ND texture co-existed in the as-rolled alloy and 25% can-compressed alloy, as shown in Figure 10a,b. When the deformation degree reached 50%, the <001>//ND texture disappeared. As the deformation degree reached 75%, the <110>//ND and <001>//ND textures co-existed.

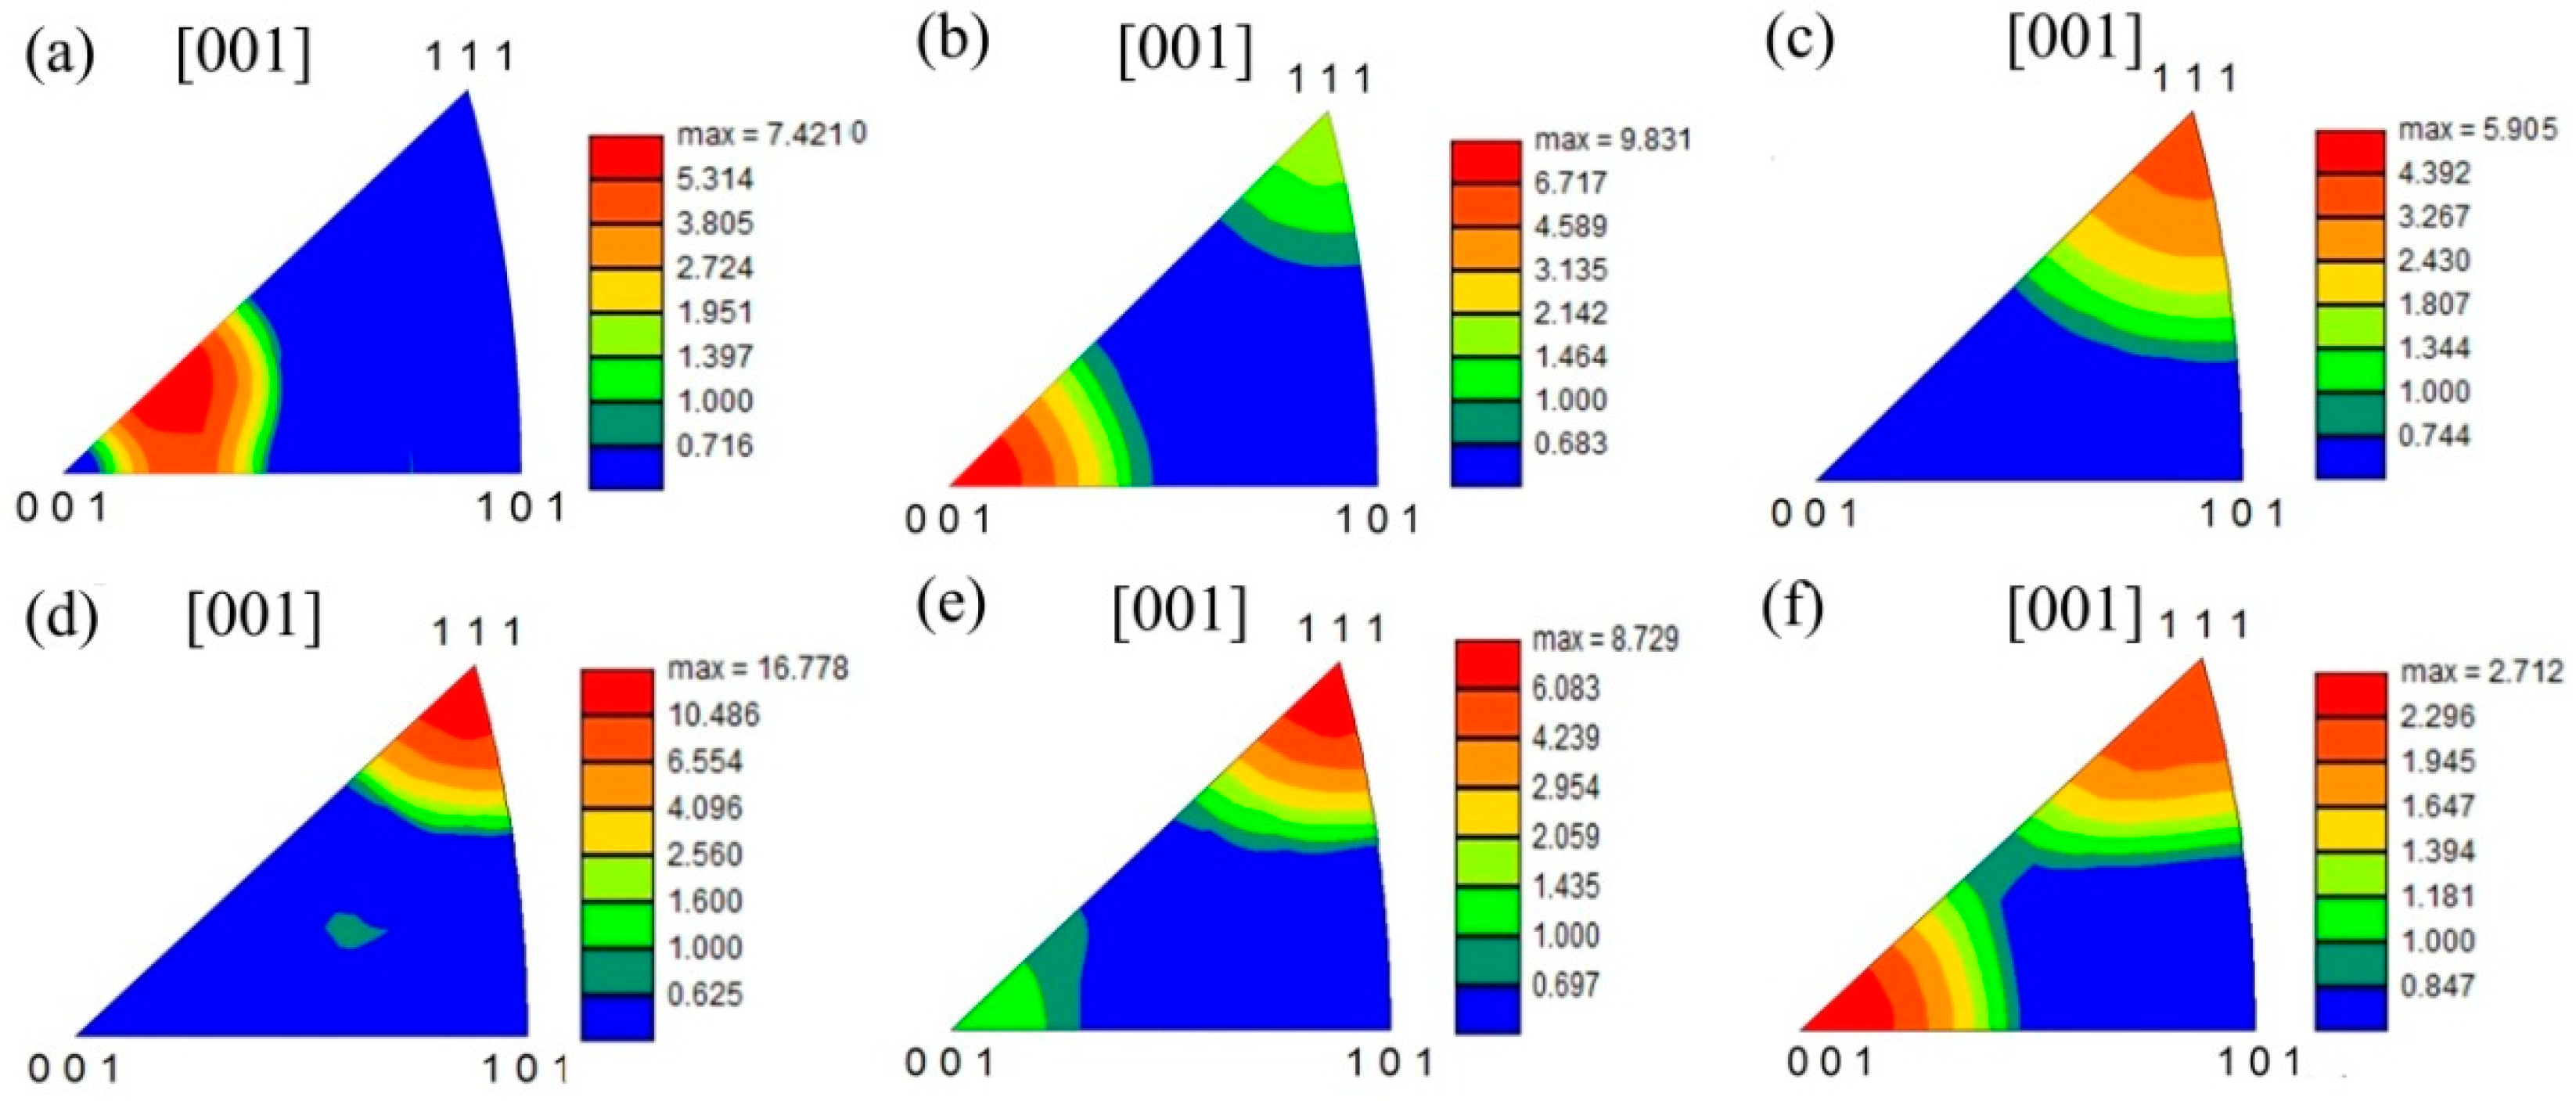
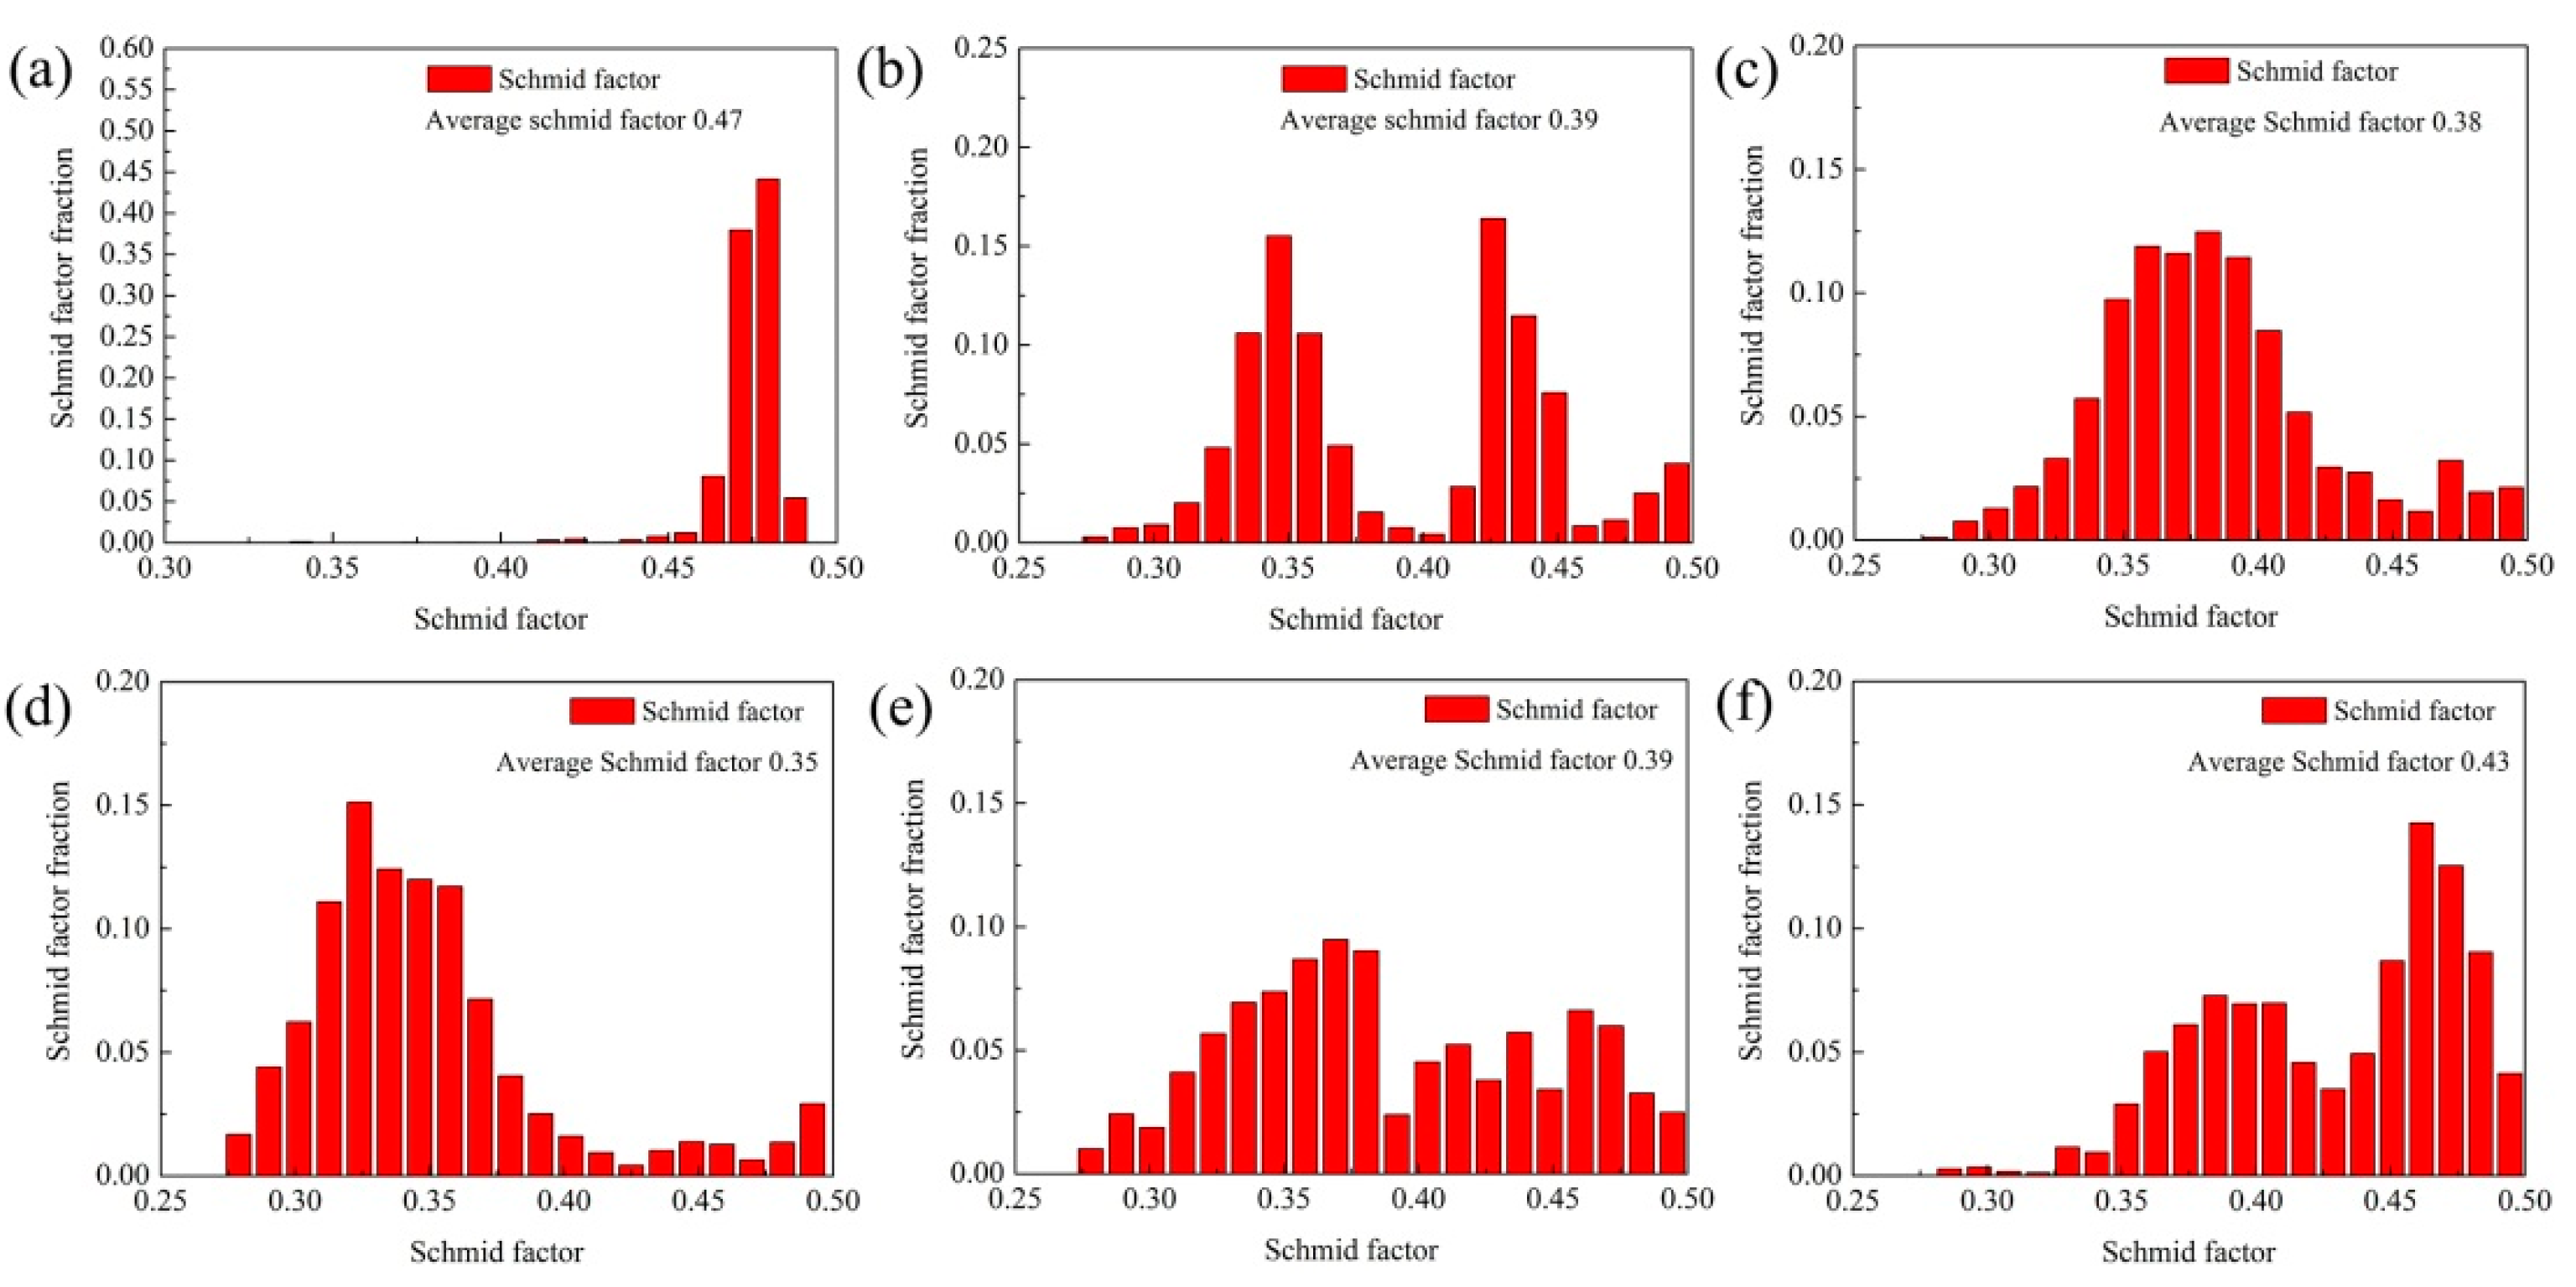
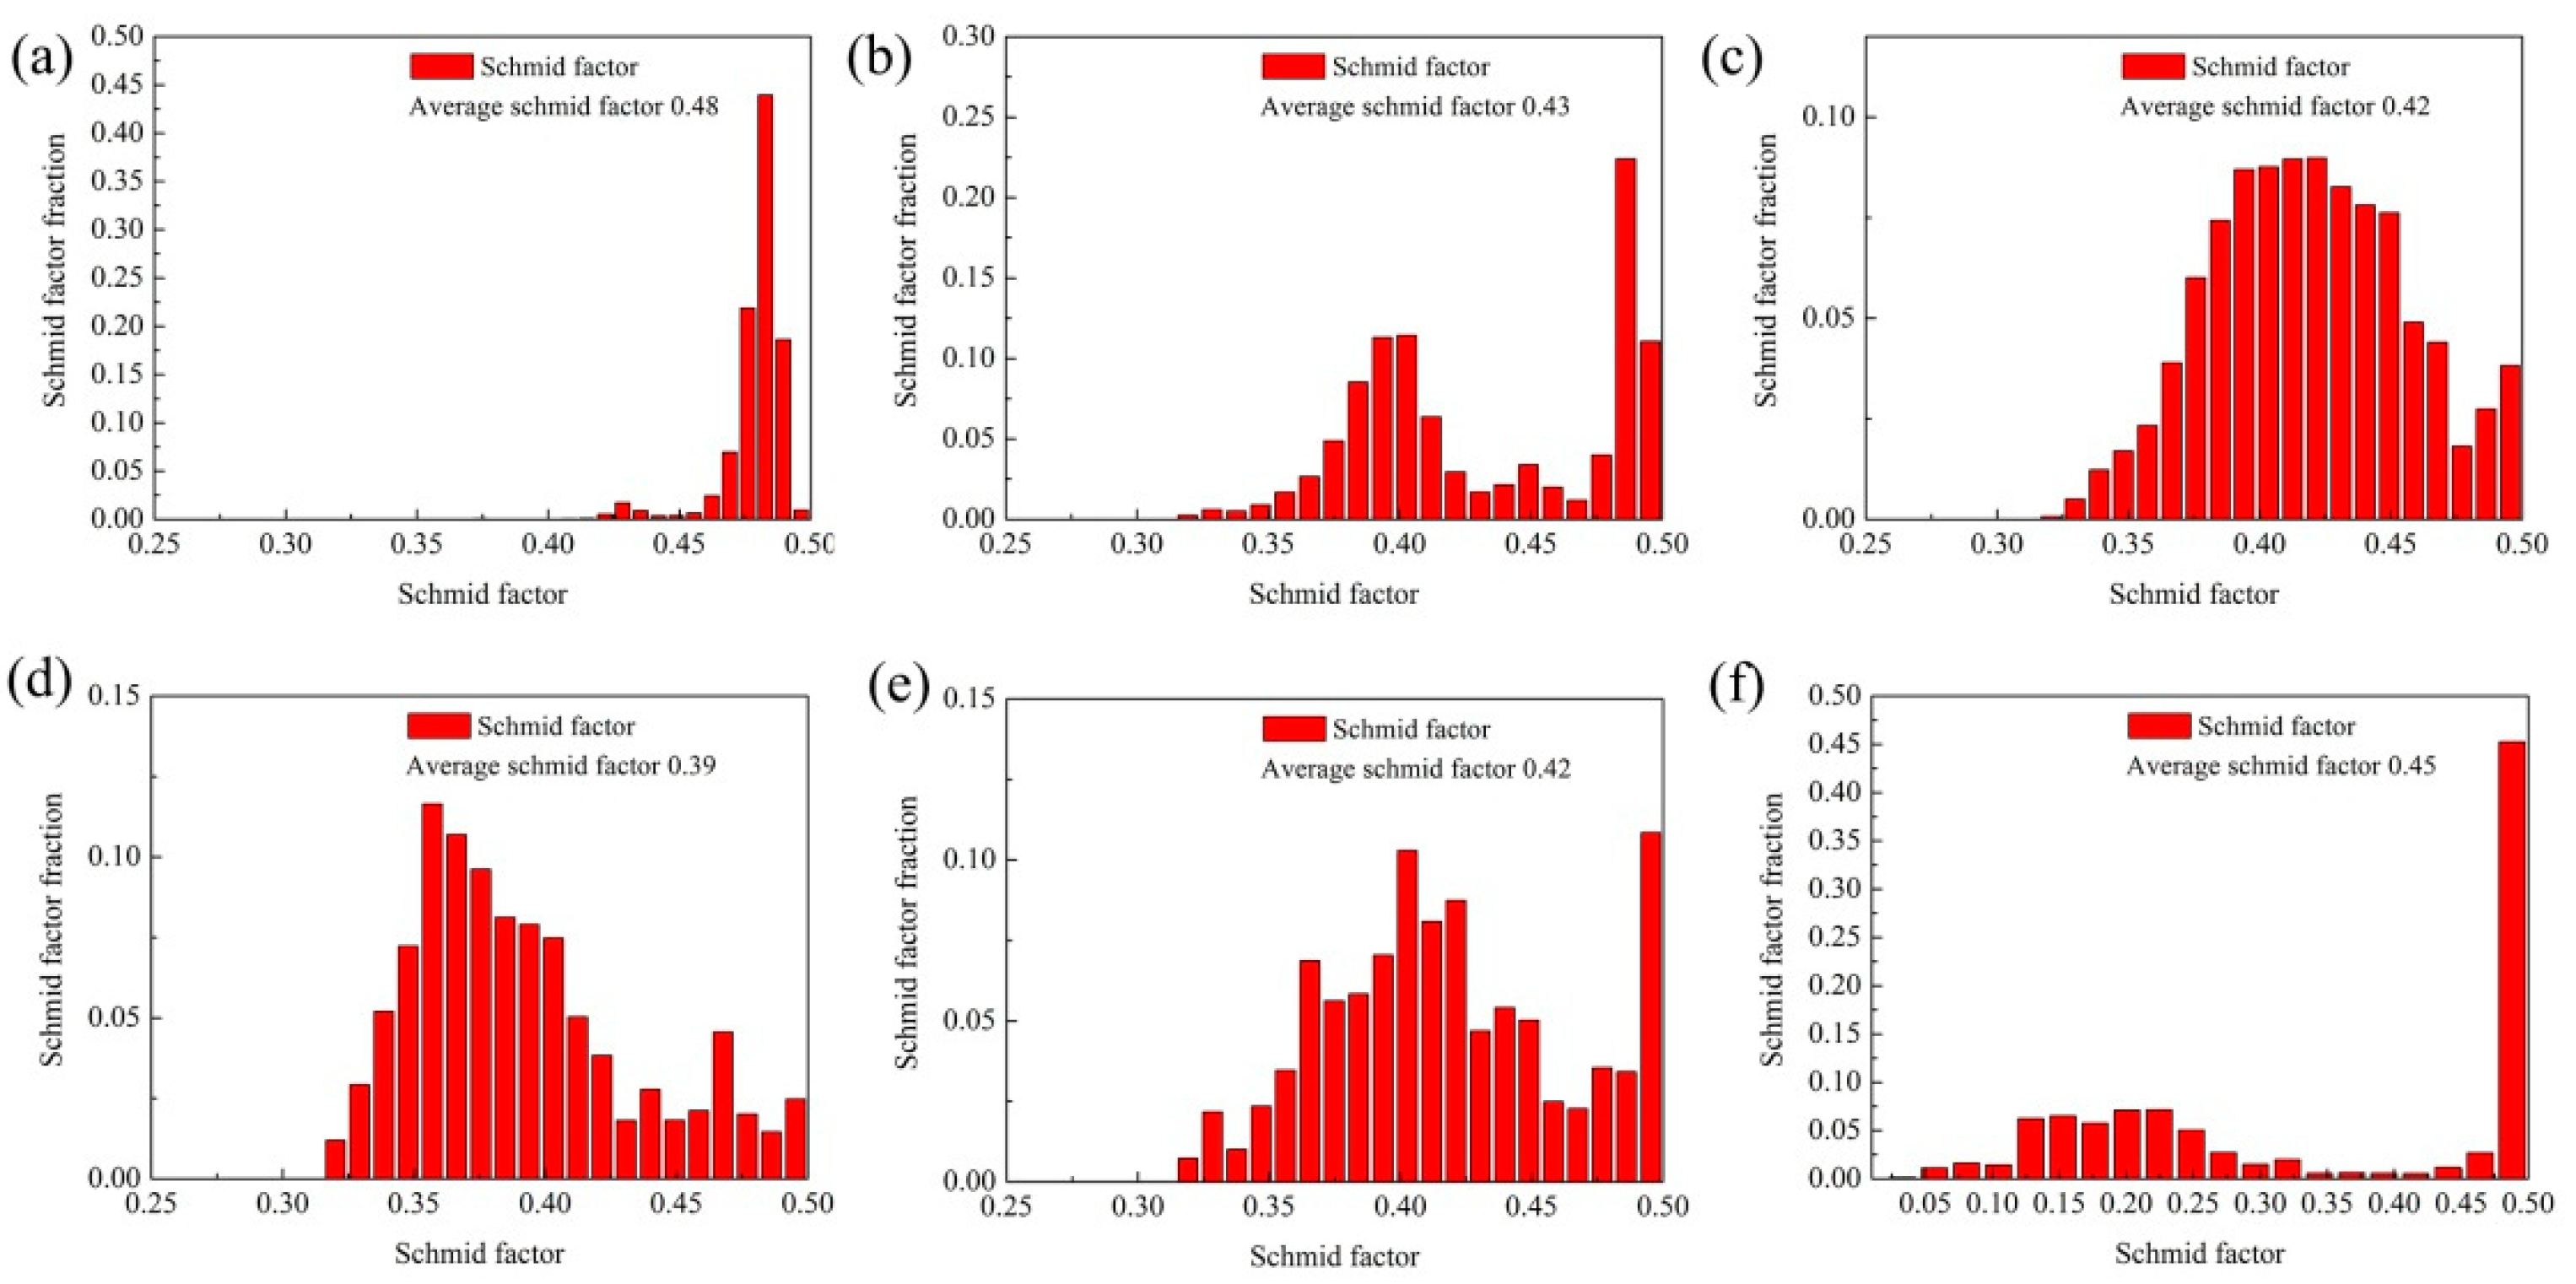
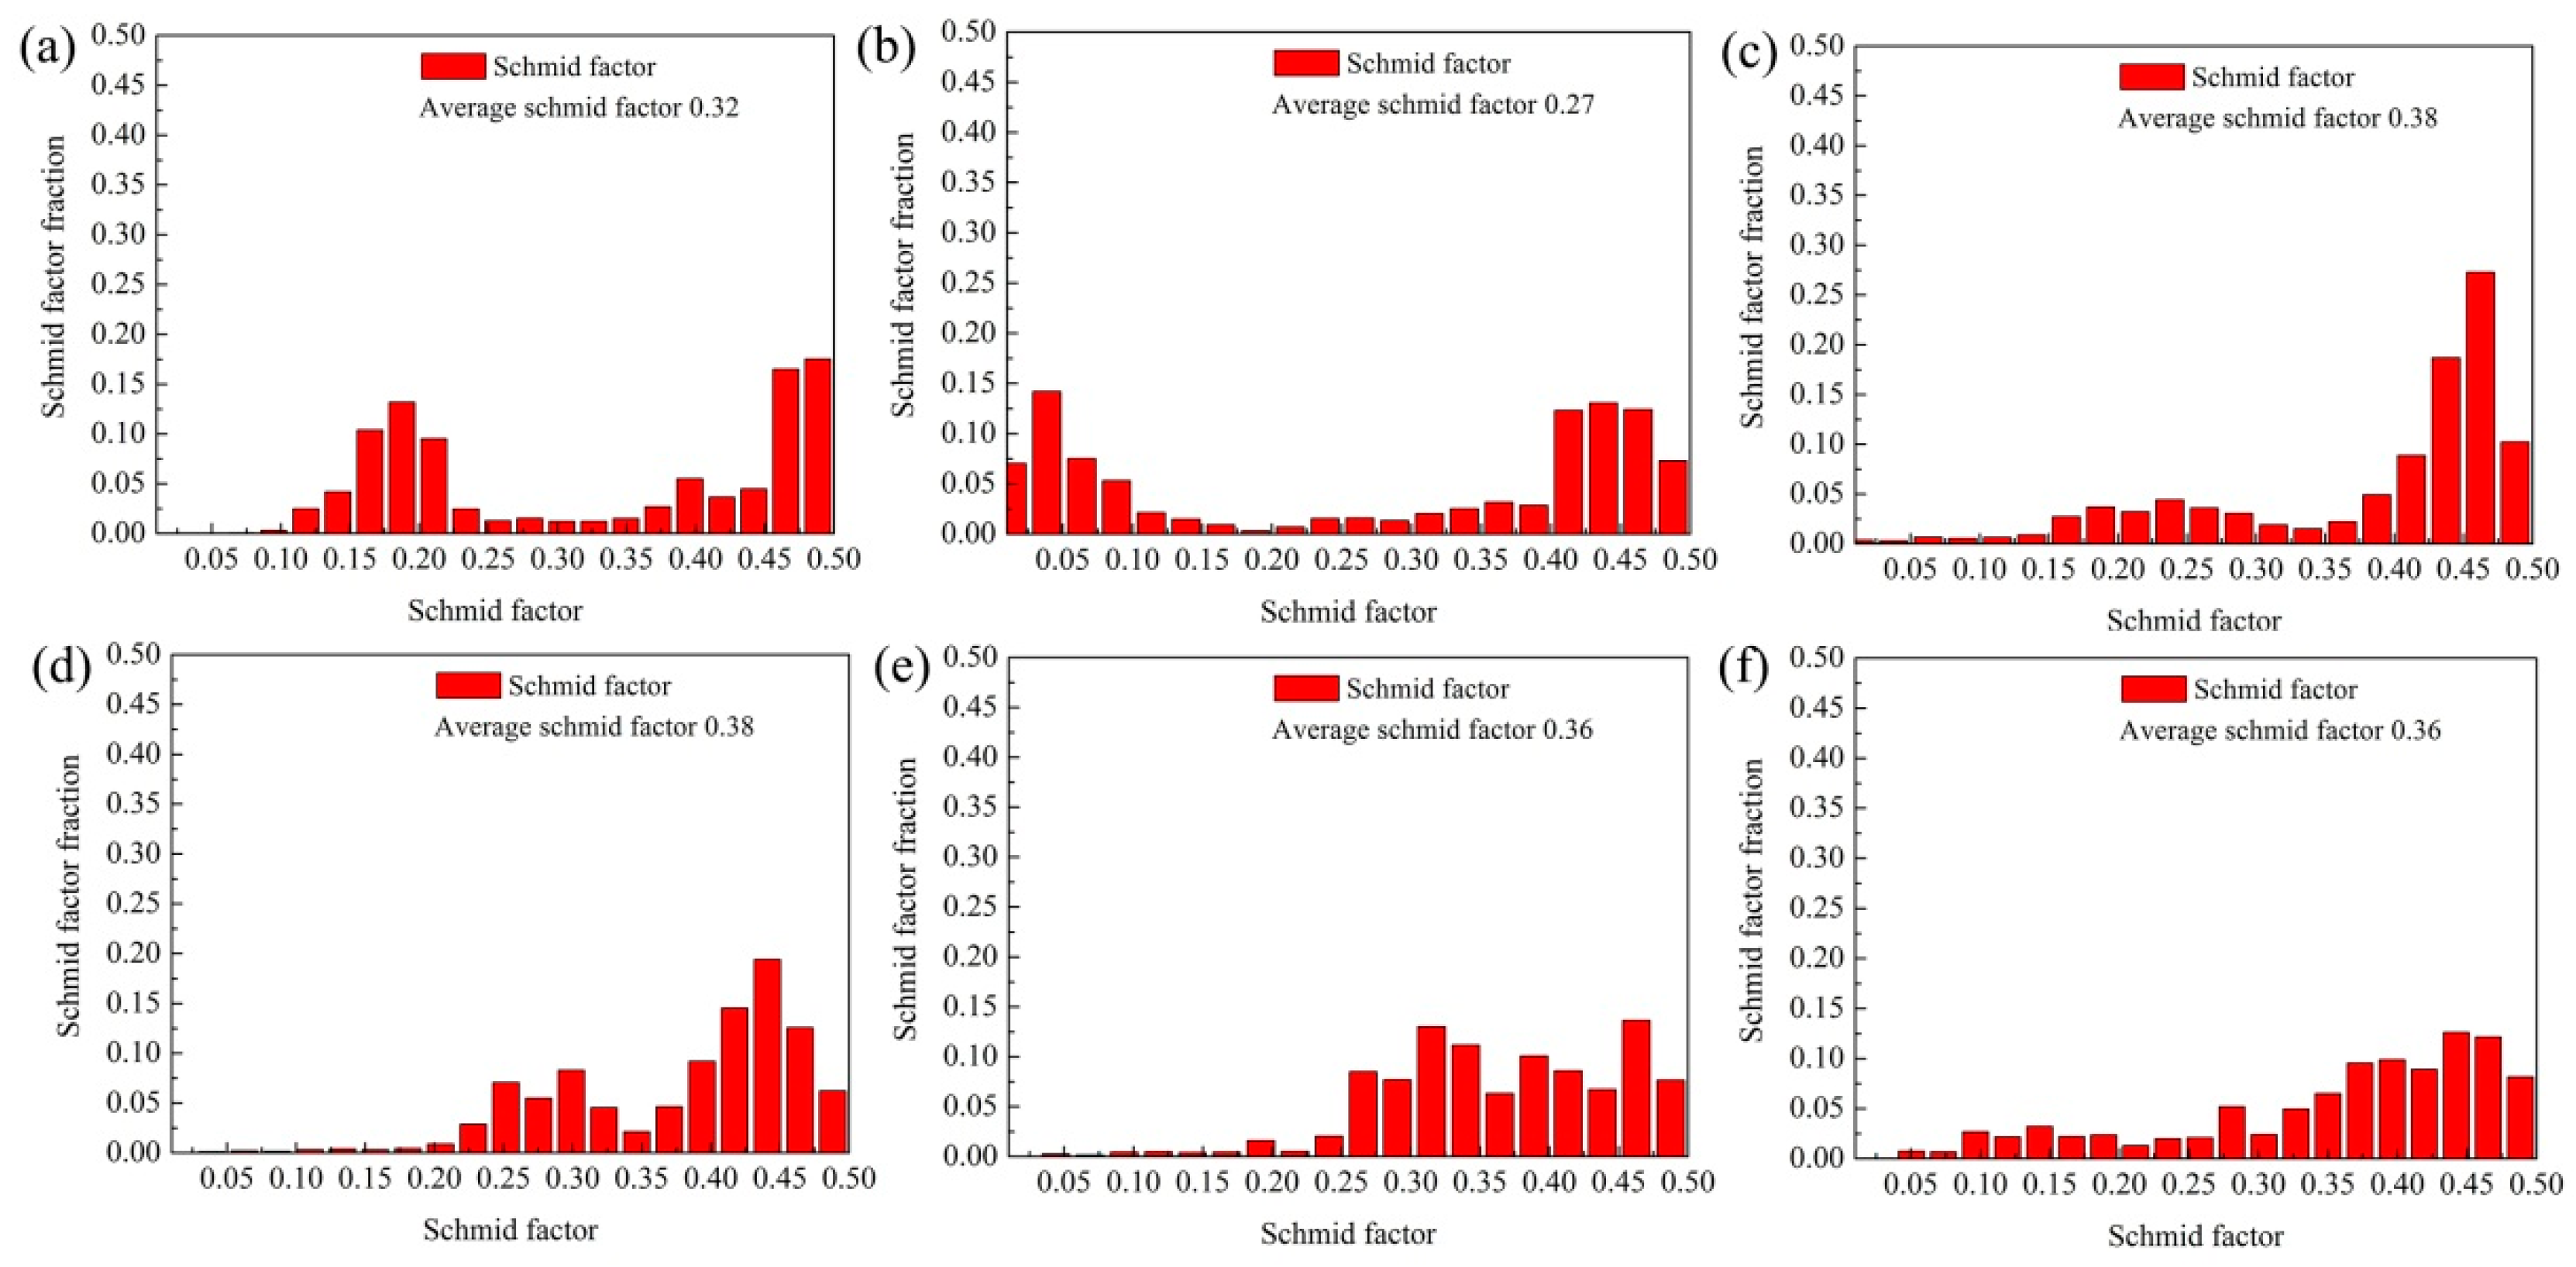
3.3. Schmid Factor Evolution of Three Slip Systems during Canning Compression and Annealing

According to the Hall–Petch criterion, the mechanical properties of the materials are closely related to the grain size [34]. Furthermore, the influence of the Schmid factor could not be ignored [10]. The distribution of the Schmid factors of the three main slip systems of B2 phase, that is, {110}<111>, {112}<111> and {110}<001>, are shown in Figure 11, Figure 12 and Figure 13. It can be seen from Figure 11a, Figure 12a and Figure 13a, that the Schmid factor of the B2 phase was concentrated on 0.47, 0.48, and 0.38, corresponding to the slip system {110}<111>, {112}<111>, and {110}<001> of the as-rolled alloy subject to annealing treatment, respectively. After the canning compression and annealing treatment, the Schmid factor of the {110}<111> and {112}<111> slip systems was distributed from 0.25 to 0.5 continuously, as illustrated in Figure 11 and Figure 12. However, the Schmid factor of the {110}<001> slip system was concentrated on 0.5, as shown in Figure 13. This indicates that the can-compression and subsequent annealing were able to significantly alter the misorientation distribution of the Ti2AlNb alloy. The average Schmid factors of the various slip systems is summarized in Table 3.
The Schmid factor of the main slip system of the O phase, that is, {001}<110>, was calculated according to the EBSD analysis result, as shown in Figure 14. After the canning compression and annealing treatment, the Schmid factor of the {001}<110> slip system in the O phase was distributed from 0.05 to 0.5 continuously. The mean Schmid factor decreased from 0.32 to 0.27 when the deformation degree reached 25%, and then increased to 0.38 when the deformation degree reached 50% and 60%, and finally stabilized at 0.36. The fluctuation was similar to the Schmid factor of the {110}<001> slip system in the B2 phase, as shown in Figure 15d. The average Schmid factor of the {001}<110> system in the O phase is summarized in Table 3.

3.4. Mechanical Property Evolution during Canning Compression and Annealing

Figure 15 illustrates the mechanical properties of the as-rolled and can-compressed samples subject to the annealing treatment. It can be found that in Figure 15b, the hardness of the as-rolled Ti2AlNb alloy subject to annealing treatment was about 364 HV, while the hardness of the can-compressed samples subject to annealing treatment with the height reduction of 25%, 50%, 60%, 65%, and 75% was 332 HV, 355 HV, 334 HV, 345 HV, and 358 HV, respectively. As shown in Figure 15c, the yield strength of the as-rolled alloy subject to annealing treatment was 892 MPa at room temperature. With the height reduction increasing, the yield strength first decreased to 795 MPa (deformation degree 25%), and then increased to 875 MPa (deformation degree 50%). Afterwards, the yield strength decreased to 845 MPa (deformation degree 60%), and finally increased to 935 MPa (deformation degree 75%). The microhardness and yield strength are listed in Table 3.

3.5. Influence of Grain Size and Texture on Mechanical Property

When the height reduction reached 25%, the grain size of the B2 phase subject to annealing treatment increased to 4.4 μm (see Table 3). Although the average Schmid factors of the main slip systems in the B2 phase and O phase decreased, the yield strength and microhardness of the material decreased significantly, indicating that the yield strength and microhardness were mainly influenced by the grain size under the deformation degree of 25%. With the height reduction increasing from 50% to 75%, the grain size was gradually refined from 1.2 to 0.9 μm. Based on the Hall–Petch criterion, the yield strength and microhardness should increase monotonically. However, when the deformation degree was 60%, the yield strength and microhardness of the sample were lower than that under the deformation degree of 50%. This should be mainly because the {110}<001> slip system of the B2 phase and the {001}<110> slip system in the O phase had larger Schmid factors (see Table 3), and the slip systems were more prone to activate in the B2 phase, so the yield strength and microhardness of the material slightly decreased. When the deformation amount increased to 65% and 75%, the grain size did not change evidently, but the yield strength and microhardness of the material increased significantly, which should be negatively correlated with the mean Schmid factor of the {110}<001> slip system in the B2 phase. Furthermore, the mean Schmid factor of the {001}<110> slip system in the O phase remained unchanged.
According to the above analysis, when the deformation degree was less than 25%, grain coarsening reduced the mechanical property of the annealed Ti2AlNb-based alloy. When the deformation degree was higher than 50%, grain refinement could improve the yield strength and microhardness, and the compression texture also exerted an important influence on the mechanical property of the Ti2AlNb alloy. Moreover, the microhardness in the post-annealed can-compressed specimens was basically less than that in the post-annealed as-rolled alloy, which was probably attributed to the increase of B2 phase recrystallization fraction. After the canning compression and annealing treatment, the recrystallization fraction (misorientation >15°) was higher than that of the post-annealed as-rolled alloy (70.9%), as shown in Figure 6. The B2/β phase was the base phase and the main plastic deformation phase of the Ti2AlNb-based alloy [10]. Jiao et al. [31] reported the microhardness decline of Ti–22Al–24Nb–0.5Mo alloy under annealing treatment from 980 °C to 1030 °C, which can be attributed to the softening effect of the static recovery and recrystallization.
However, it should be noted that although the hardness and strength of the Ti2AlNb-based alloy are affected by quite a few factors, such as grain size, phase fraction, texture, and recrystallization degree, it is difficult to determine the contribution of the various factors quantitatively in this work, which needs further study in the future.

4. Conclusions

The microstructure evolution and mechanical properties are analyzed during the canning compression and annealing treatment, and the main conclusions can be obtained as follows:
(1) After canning compression, the O phase and α2 phase were deformed and gradually elongated vertically to the compression direction in the B2 matrix. After the annealing treatment, the recrystallization and grain refinement of the B2 phase were enhanced with the increase of height reduction during the canning compression. Meanwhile, there was no significant change of volume fraction of the various phases after annealing treatment at 900 °C for 2 h.
(2) When the compression degree reached 50% and 60%, the <111>//ND texture occurred as the main texture in the B2 phase. When the height reduction reached 75%, both the <111>//ND and <001>//ND texture were formed in the B2 phase. The maximum Schmid factor of the {110}<001> slip system in the B2 phase was 0.48 m corresponding to the deformation degree of 60%. The fluctuation of the Schmid factor of the {001}<110> slip system in the O phase was similar to the Schmid factor of {110}<001> slip system in the B2 phase.
(3) The mechanical properties of the post-annealed alloys were co-affected by the grain size and Schmid factor of the B2 phase. When the height reduction was less than 25%, the compression strength was mainly affected by the grain size. When the height reduction was higher than 50%, it was mainly dominated by the Schmid factor. Moreover, the yield strength of the Ti2AlNb alloy at room temperature increased from 892 MPa in the as-rolled condition, to 935 MPa after the canning compression and annealing.

Author Contributions

S.W. conceived and designed the experiments; W.X. and W.S. analyzed the data and wrote the paper; Y.C. performed the experiments; D.S. and Y.Z. provided guidance and all sorts of support during the work.

Funding

This research was funded by the National Natural Science Foundation of China, grant number 51775137.

Acknowledgments

This work is supported by the National Natural Science Foundation of China (no. 51775137).

Conflicts of Interest

The authors declare no conflict of interest.

References

  1. Shao, B.; Zong, Y.; Wen, D.; Tian, Y.; Shan, D. Investigation of the phase transformations in Ti22Al25Nb alloy. Mater. Charact. 2016, 114, 75–78. [Google Scholar] [CrossRef]
  2. Zong, Y.; Shao, B.; Tian, Y.; Shan, D. A study of the sharp yield point of a Ti-22Al-25Nb alloy. J. Alloys Compd. 2017, 701, 727–731. [Google Scholar] [CrossRef]
  3. Chen, W.; Chen, Z.Y.; Wu, C.C.; Li, J.W.; Tang, Z.Y.; Wang, Q.J. The effect of annealing on microstructure and tensile properties of Ti–22Al–25Nb electron beam weld joint. Intermetallics 2016, 75, 8–14. [Google Scholar] [CrossRef]
  4. Li, Y.-J.; Wu, A.-P.; Li, Q.; Zhao, Y.; Zhu, R.-C.; Wang, G.-Q. Effects of welding parameters on weld shape and residual stresses in electron beam welded Ti2AlNb alloy joints. Trans. Nonferrous Met. Soc. China 2019, 29, 67–76. [Google Scholar] [CrossRef]
  5. Zou, G.-S.; Xie, E.-H.; Bai, H.-L.; Wu, A.-P.; Wang, Q.; Ren, J.-L. A study on transient liquid phase diffusion bonding of Ti–22Al–25Nb alloy. Mater. Sci. Eng. A 2009, 499, 101–105. [Google Scholar] [CrossRef]
  6. Banerjee, D.; Gogia, A.K.; Nandi, T.K.; Joshi, V.A. A new ordered orthorhombic phase in a Ti3AlNb alloy. Acta Metall. 1988, 36, 871–882. [Google Scholar] [CrossRef]
  7. Zhao, H.; Lu, B.; Tong, M.; Yang, R. Tensile behavior of Ti-22Al-24Nb-0.5Mo in the range 25–650 °C. Mater. Sci. Eng. A 2017, 679, 455–464. [Google Scholar] [CrossRef]
  8. Dey, S.R.; Roy, S.; Suwas, S.; Fundenberger, J.J.; Ray, R.K. Annealing response of the intermetallic alloy Ti–22Al–25Nb. Intermetallics 2010, 18, 1122–1131. [Google Scholar] [CrossRef]
  9. Yang, J.; Wang, G.; Jiao, X.; Li, Y.; Liu, Q. High-temperature deformation behavior of the extruded Ti-22Al-25Nb alloy fabricated by powder metallurgy. Mater. Charact. 2018, 137, 170–179. [Google Scholar] [CrossRef]
  10. Shao, B.; Shan, D.; Guo, B.; Zong, Y. Plastic deformation mechanism and interaction of B2, α2, and O phases in Ti22Al25Nb alloy at room temperature. Int. J. Plast. 2018. [Google Scholar] [CrossRef]
  11. Germann, L.; Banerjee, D.; Guédou, J.Y.; Strudel, J.L. Effect of composition on the mechanical properties of newly developed Ti2AlNb-based titanium aluminide. Intermetallics 2005, 13, 920–924. [Google Scholar] [CrossRef]
  12. Wang, S.; Xu, W.; Zong, Y.; Zhong, X.; Shan, D. Effect of Initial Microstructures on Hot Deformation Behavior and Workability of Ti2AlNb-Based Alloy. Metals 2018, 8, 382. [Google Scholar] [CrossRef]
  13. Lin, P.; He, Z.; Yuan, S.; Shen, J.; Huang, Y.; Liang, X. Instability of the O-phase in Ti–22Al–25Nb alloy during elevated-temperature deformation. J. Alloys Compd. 2013, 578, 96–102. [Google Scholar] [CrossRef]
  14. Yang, J.L.; Wang, G.F.; Zhang, W.C.; Chen, W.Z.; Jiao, X.Y.; Zhang, K.F. Microstructure evolution and mechanical properties of P/M Ti-22Al-25Nb alloy during hot extrusion. Mater. Sci. Eng. A 2017, 699, 210–216. [Google Scholar] [CrossRef]
  15. Li, B.; Zhang, K.; Yao, W.; Xu, B. Effects of current-assisted heat treatment time on microstructure evolution and superplastic properties of Ti-22Al-24Nb-0.5Mo alloy. Mater. Charact. 2019, 150, 38–51. [Google Scholar] [CrossRef]
  16. Gogia, A.K.; Nandy, T.K.; Banerjee, D.; Carisey, T.; Strudel, J.L.; Franchet, J.M. Microstructure and mechanical properties of orthorhombic alloys in the Ti-Al-Nb system. Intermetallics 1998, 6, 741–748. [Google Scholar] [CrossRef]
  17. Ren, X.; Hagiwara, M. Displacive precursor phenomena in Ti–22Al–27Nb intermetallic compound prior to diffusional transformation. Acta Mater. 2001, 49, 3971–3980. [Google Scholar] [CrossRef]
  18. Emura, S.; Araoka, A.; Hagiwara, M. B2 grain size refinement and its effect on room temperature tensile properties of a Ti–22Al–27Nb orthorhombic intermetallic alloy. Scr. Mater. 2003, 48, 629–634. [Google Scholar] [CrossRef]
  19. Zhao, X.; Yang, X.; Liu, X.; Wang, X.; Langdon, T.G. The processing of pure titanium through multiple passes of ECAP at room temperature. Mater. Sci. Eng. A 2010, 527, 6335–6339. [Google Scholar] [CrossRef]
  20. Afifi, M.A.; Wang, Y.C.; Pereira, P.H.R.; Huang, Y.; Wang, Y.; Cheng, X.; Li, S.; Langdon, T.G. Effect of heat treatments on the microstructures and tensile properties of an ultrafine-grained Al-Zn-Mg alloy processed by ECAP. J. Alloys Compd. 2018, 749, 567–574. [Google Scholar] [CrossRef] [Green Version]
  21. Karimi, M.; Toroghinejad, M.R.; Dutkiewicz, J. Nanostructure formation during accumulative roll bonding of commercial purity titanium. Mater. Charact. 2016, 122, 98–103. [Google Scholar] [CrossRef]
  22. Yang, J.; Wang, G.; Park, J.M.; Kim, H.S. Microstructural behavior and mechanical properties of nanocrystalline Ti-22Al-25Nb alloy processed by high-pressure torsion. Mater. Charact. 2019, 151, 129–136. [Google Scholar] [CrossRef]
  23. Nakayama, H.; Tsuchiya, K.; Umemoto, M. Crystal refinement and amorphisation by cold rolling in TiNi shape memory alloys. Scr. Mater. 2001, 44, 1781–1785. [Google Scholar] [CrossRef]
  24. Tsuchiya, K.; Inuzuka, M.; Tomus, D.; Hosokawa, A.; Nakayama, H.; Morii, K.; Todaka, Y.; Umemoto, M. Martensitic transformation in nanostructured TiNi shape memory alloy formed via severe plastic deformation. Mater. Sci. Eng. A 2006, 438–440, 643–648. [Google Scholar] [CrossRef]
  25. Tsuchiya, K.; Hada, Y.; Koyano, T.; Nakajima, K.; Ohnuma, M.; Koike, T.; Todaka, Y.; Umemoto, M. Production of TiNi amorphous/nanocrystalline wires with high strength and elastic modulus by severe cold drawing. Scr. Mater. 2009, 60, 749–752. [Google Scholar] [CrossRef]
  26. Mei, Q.S.; Zhang, L.; Tsuchiya, K.; Gao, H.; Ohmura, T.; Tsuzaki, K. Grain size dependence of the elastic modulus in nanostructured NiTi. Scr. Mater. 2010, 63, 977–980. [Google Scholar] [CrossRef]
  27. Hu, T.; Chen, L.; Wu, S.L.; Chu, C.L.; Wang, L.M.; Yeung, K.W.K.; Chu, P.K. Graded phase structure in the surface layer of NiTi alloy processed by surface severe plastic deformation. Scr. Mater. 2011, 64, 1011–1014. [Google Scholar] [CrossRef]
  28. Chen, X.; Weidong, Z.; Wei, W.; Xiaobo, L.; Jianwei, Z. Coarsening behavior of lamellar orthorhombic phase and its effect on tensile properties for the Ti–22Al–25Nb alloy. Mater. Sci. Eng. A 2014, 611, 320–325. [Google Scholar] [CrossRef]
  29. Jiao, X.; Liu, G.; Wang, D.; Wu, Y. Creep behavior and effects of heat treatment on creep resistance of Ti-22Al-24Nb-0.5Mo alloy. Mater. Sci. Eng. A 2017, 680, 182–189. [Google Scholar] [CrossRef]
  30. Jiao, X.; Kong, B.; Tao, W.; Liu, G.; Ning, H. Effects of annealing on microstructure and deformation uniformity of Ti-22Al-24Nb-0.5Mo laser-welded joints. Mater. Des. 2017, 130, 166–174. [Google Scholar] [CrossRef]
  31. Lin, P.; Hao, Y.; Zhang, B.; Zhang, S.; Shen, J. Strain rate sensitivity of Ti-22Al-25Nb (at%) alloy during high temperature deformation. Mater. Sci. Eng. A 2018, 710, 336–342. [Google Scholar] [CrossRef]
  32. Bai, X.F.; Zhao, Y.Q.; Zhang, Y.S.; Zeng, W.D.; Yu, S.; Wang, G. Texture evolution in TLM titanium alloy during uniaxial compression. Mater. Sci. Eng. A 2013, 588, 29–33. [Google Scholar] [CrossRef]
  33. Zhang, Y.; Jiang, S.; Wang, S.; Sun, D.; Hu, L. Influence of partial static recrystallization on microstructures and mechanical properties of NiTiFe shape memory alloy subjected to severe plastic deformation. Mater. Res. Bull. 2017, 88, 226–233. [Google Scholar] [CrossRef]
  34. Sun, W.T.; Qiao, X.G.; Zheng, M.Y.; Hu, N.; Gao, N.; Starink, M.J. Evolution of long-period stacking ordered structure and hardness of Mg-8.2Gd-3.8Y-1.0Zn-0.4Zr alloy during processing by high pressure torsion. Mater. Sci. Eng. A 2018, 738, 238–252. [Google Scholar] [CrossRef] [Green Version]
Figure 1. Schematic diagram of the experimental procedure. SPD—severe plastic deformation. (RD, rolling direction; TD, transverse direction; ND, normal direction).
Metals 09 00980 g001
Figure 2. SEM and TEM micrographs of the as-rolled Ti2AlNb sample: (a) SEM image; (b) bright TEM field image; (c) and (d) selected area electron diffraction (SAED) patterns of the selected zone marked in (b) showing the matrix with the α2 phase, B2 phase, and O phase.
Metals 09 00980 g002
Figure 3. SEM images for the as-rolled and can-compressed samples with different height reductions: (a) as-rolled, (b) 25%, (c) 50%, (d) 60%, (e) 65%, and (f) 75%.
Metals 09 00980 g003
Figure 4. SEM images for the as-rolled and can-compressed samples subject to annealing treatment: (a) as-rolled, (b) 25%, (c) 50%, (d) 60%, (e) 65%, and (f) 75%.
Metals 09 00980 g004
Figure 5. Phase and image quality (IQ) maps of the as-rolled and can-compressed samples subject to annealing treatment: (a) as-rolled, (b) 25%, (c) 50%, (d) 60%, (e) 65%, and (f) 75%.
Metals 09 00980 g005
Figure 6. Misorientation fraction and grain size distribution of the as-rolled and can-compressed samples subject to annealing treatment: (a) as-rolled, (b) 25%, (c) 50%, (d) 60%, (e) 65%, and (f) 75%.
Metals 09 00980 g006
Figure 7. B2 phase inverse pole figure (IPF) of the as-rolled and can-compressed Ti2AlNb samples subject to annealing treatment at 900 °C for 2 h: (a) as-rolled, (b) 25%, (c) 50%, (d) 60%, (e) 65%, and (f) 75%.
Metals 09 00980 g007
Figure 8. B2 phase IPF of the as-rolled and can-compressed Ti2AlNb samples subject to annealing treatment: (a) as-rolled, (b) 25%, (c) 50%, (d) 60%, (e) 65%, and (f) 75%.
Metals 09 00980 g008
Figure 9. B2 phase orientation distribution function (ODF) figures of the as-rolled and can-compressed Ti2AlNb samples subject to annealing treatment: (a) as-rolled, (b) 25%, (c) 50%, (d) 60%, (e) 65%, and (f) 75%.
Metals 09 00980 g009
Figure 10. O phase IPF of the as-rolled and can-compressed Ti2AlNb samples subject to annealing treatment: (a) as-rolled, (b) 25%, (c) 50%, (d) 60%, (e) 65%, and (f) 75%.
Metals 09 00980 g010
Figure 11. B2 phase mean Schmid factors of the Ti2AlNb samples in {110}<111> subjected to various deformation degrees and subsequent annealing at 900 °C for 2 h: (a) as-rolled, (b) 25%, (c) 50%, (d) 60%, (e) 65%, and (f) 75%.
Metals 09 00980 g011
Figure 12. B2 phase mean Schmid factors of the Ti2AlNb samples in {112}<111> subjected to various deformation degrees and subsequent annealing at 900 °C for 2 h: (a) as-rolled, (b) 25%, (c) 50%, (d) 60%, (e) 65%, and (f) 75%.
Metals 09 00980 g012
Figure 13. B2 phase mean Schmid factors of the {110}<001> slip system of the Ti2AlNb samples subjected to various deformation degrees and subsequent annealing at 900 °C for 2 h: (a) as-rolled, (b) 25%, (c) 50%, (d) 60%, (e) 65%, and (f) 75%.
Metals 09 00980 g013
Figure 14. O phase mean Schmid factors of the Ti2AlNb samples in {001}<110> subjected to various deformation degrees and subsequent annealing at 900 °C for 2 h: (a) as-rolled, (b) 25%, (c) 50%, (d) 60%, (e) 65%, and (f) 75%.
Metals 09 00980 g014
Figure 15. Hardness and mechanical properties of the as-rolled and can-compressed Ti2AlNb samples subject to annealing treatment (the micro-indentation was conducted on a surface perpendicular to the ND): (a) experimental procedure, (b) hardness, (c) yield strength, (d) grain size of B2 phase and Schmid factors of the B2 phase {110}<001>, {110}<111>, and {112}<111> slip systems, and the Schmid factors of the O phase {001}<110> slip system.
Metals 09 00980 g015
Table 1. Measured chemical composition of the Ti2AlNb alloy.
ElementsTiAlMoNbFe
Weight percentage (wt %)46.3110.270.9542.420.08
Atomic percentage (atom %)48.5219.00.5022.910.07
Table 2. Fractions of various phases in the annealing treatment Ti2AlNb alloy.
SampleB2Ti2AlNbTi3Al
As-rolled48.3% ± 2.4%45.4% ± 2.3%6.3% ± 0.3%
Can-compressed 25%49.1% ± 2.5%42.4% ± 2.1%8.5% ± 0.4%
Can-compressed 50%52.1% ± 2.6%39.3% ± 2.0%8.6% ± 0.4%
Can-compressed 60%52.9% ± 2.7%38.3% ± 1.9%8.8% ± 0.4%
Can-compressed 65%50.8% ± 2.6%39.9% ± 2.0%9.3% ± 0.5%
Can-compressed 75%53.2% ± 2.7%37.7% ± 1.9%9.1% ± 0.5%
Table 3. Hardness, yield strength, grain size of the B2 phase, and the Schmid factors of the B2 phase and O phase. AR—as rolled.
Properties AR25%50%60%65%75%
Hardness (HV)364 ± 18332 ± 17355 ± 18334 ± 17345 ± 17358 ± 18
Yield strength (MPa)892 ± 45795 ± 40875 ± 44845 ± 42884 ± 44935 ± 47
Grain size of B2 phase (μm)1.7 ± 0.14.4 ± 0.21.2 ± 0.11 ± 0.10.9 ± 0.10.9 ± 0.1
Schmid factors of B2 {110}<001>0.390.360.470.480.430.34
Schmid factors of B2 {110}<111>0.470.390.380.350.390.43
Schmid factors of B2 {112}<111>0.480.430.420.390.420.45
Schmid factors of O {001}<110>0.320.270.380.380.360.36

