Article

ENSO and Light-Absorbing Impurities and Their Impact on Snow Albedo in the Sierra Nevada de Santa Marta, Colombia

by
Tomás R. Bolaño-Ortiz
1,2,3,*,
Viverlys L. Diaz-Gutiérrez
4 and
Yiniva Camargo-Caicedo
4,*
1
Mendoza Regional Faculty, National Technological University (FRM-UTN), Mendoza M5500, Argentina
2
National Scientific and Technical Research Council (CONICET), Mendoza M5500, Argentina
3
Centre for Environmental Technologies, Universidad Técnica Federico Santa María, Valparaíso 46383, Chile
4
Environmental Systems Modeling Research Group (GIMSA), Universidad del Magdalena, Santa Marta 470001, Colombia
*
Authors to whom correspondence should be addressed.
Geosciences 2020, 10(11), 437; https://doi.org/10.3390/geosciences10110437
Submission received: 27 August 2020 / Revised: 31 October 2020 / Accepted: 2 November 2020 / Published: 6 November 2020
(This article belongs to the Special Issue Monitoring of the Seasonal Snow Cover)

Abstract

:
Snow albedo is an important variable in the coupled atmosphere-earth system at the global level. Moreover, studying its behavior allows us to know the state of the cryosphere. The Sierra Nevada de Santa Marta (SNSM) is a glacier area and the northernmost tropical (10.82° N, 73.75° W) region in South America. It has a height of up to 5775 m.a.sl., which is the second highest mountain in the world near the marine coast. We analyzed variations in snow albedo related to snow cover, snowfall, temperature, light-absorbing impurities such as blank carbon (BC), organic carbon (OC) and dust, and El Niño—Southern Oscillation (ENSO) phenomenon through 20 years (2000–2020). We mainly use daily data from the Moderate Resolution Imaging Spectroradiometer (MODIS) onboard the Terra and Aqua NASA satellites. Results showed through correlations that snow albedo has decreased due to Land Surface Temperature (55%, p < 0.001), a positive phase of ENSO (42%, p < 0.001) and dust (37%, p < 0.01) in the SNSM. Additionally, a dust negative effect was more evident on the southern side (up to 49%, p < 0.001) of the SNSM. Backward trajectories by the NOAA HYSPLIT model suggest that dust sources would be soil erosion in the surrounding region. Results can help recognize the influence of ENSO and dust in the glacier decrease of the SNSM.

Graphical Abstract

1. Introduction

The cryosphere is the frozen part of the hydrosphere and the lithosphere due to its physical interactions with the atmosphere. The cryosphere (as snow and ice) plays an important role in biogeochemical cycles and in the global energy balance [1,2,3,4]. Thus, any qualitative and quantitative change in the physical properties and extent of the cryosphere can affect global air circulation, air and ocean temperatures, river flow in mountains, ocean current patterns, and sea level [5,6,7,8,9,10]. In fact, this indicates that studying the cryosphere is important to better understand these ecosystems and as an indicator of climate change at a global and local level [11,12].
Snow albedo is an important variable in determining the amount of solar radiation adsorbed on the cryosphere. Furthermore, it is defined as a relationship between the incoming and reflected solar radiation by a snow-covered surface. For example, fresh snow can almost completely reflect incoming solar radiation (0.95), but can decrease to 0.45 due to metamorphism [13,14,15]. Snow albedo variations are mainly favored by surface temperature, snowfall, snow age, and snow impurities [14,16,17,18,19]. Light-absorbing impurities (LAI) on snow reduce snow albedo and absorb more solar radiation (called the snow darkening effect or SDE), and accelerate the process of snow aging and the snowmelt rate of snowpack [20,21,22,23]. In fact, LAI and its SDE have been identified as one of the main forcing agents affecting climate change [5,6,24,25]. Most studies indicate that the main LAI particles are BC, OC, and dust [26,27,28,29,30,31,32,33,34,35]. Although recently, studies such as those conducted in Argentina show that volcanic ash can generate a great impact of albedo changes in the mass balance of glaciers in South America [36]. Additionally, numerous studies around the world have analyzed the variations of snow albedo to understand how its snow cover and snowpack are changing due to increased temperature and the presence of LAI, and, therefore, the associated radiative forcing in the climate [10,17,23,28,29,37,38,39,40,41,42,43,44,45,46,47,48,49].
The cryosphere in South America is mainly associated with the Andes mountain range. In the upper parts of these mountains, glaciers are formed whose types of weather vary from their tropical Andes region in Colombia, Venezuela, Ecuador, Bolivia, and Peru until middle and high latitudes in the Patagonia region in Argentina and Chile [50]. Throughout this region, the snow and glaciers are an important source of fresh water for more than 80 million inhabitants [51]. In addition, 99% of all tropical glaciers are located in the Tropical Andes region [52]. The most critical situation has been observed in the glaciers of the Andean mountains in the inner tropics, that is, those glaciers located in Ecuador, Venezuela, and Colombia [53,54]. Particularly, in Colombia, a constant recession of glaciers has been reported in the last half century (i.e., since 1970) and its acceleration since 2000 [55,56] when the warm phases of the El Niño–Southern Oscillation (ENSO) phenomenon began to be more frequent [57]. Because of that, most of Colombia’s glaciers are in danger of disappearing in the next few years [58,59].
One of the largest Colombian glacial areas is located in the Sierra Nevada de Santa Marta (SNSM) in the north of the country [50,59]. Recent studies show that its glacial area has reduced from 16.1 km2 in 1981 to 6.21 km2 in 2019 [59,60]. It has lost approximately 0.5 m w.e. yr−1 between 2000 and 2018 [61]. These studies focused on analyzing the spatio-temporal variation and mass of snow-glaciers. This is mainly attributed to climate change [6,9,59,60]. In Colombia, it has only been studied in the snow albedo through the impact of pyroclastic material emitted during volcanic eruptions, and its effect in the notably rapid recession of glaciers in its central region [62,63]. Although, in the surroundings of the SNSM, there are no volcanoes that affect air quality. Moreover, in Colombia, no studies have yet been carried out showing the relationship between changes in snow albedo related to variables other than temperature and volcanic ash. Recent studies show that the rate of glacial surface loss in the SNSM has been reduced despite the very warm temperatures observed during the 21st century. Therefore, a decrease in the sensitivity of these glaciers to regional temperature could be suggested, while local factors would be becoming more influential in explaining the evolution of the SNSM cryosphere [64]. Therefore, it is important to know the effects that other variables, such as the LAI and ENSO effects that may have on the availability of water resources and the changes of radiative forcing and climate.
The prime objective of this study is to investigate the association of snow cover, snowfall (SP), LST, and LAI particles such as black carbon (BC), organic carbon (OC), and dust on snow albedo over the SNSM based on satellite remote sensing and reanalysis data for the 2000–2020 period. The results will serve to improve the knowledge related to the relationship between LAI particles and ENSO in the snow and glacier variations in the SNSM. In addition, the results may improve the predictions about the evolution of these small glaciers in future decades. The rest of the article is ordered as follows. Section 1 describes the study, data set, and procedures used. In Section 2, we display variation and evolution of snow albedo, snow cover, snowfall, temperature, ENSO, and LAI. Significant relationships between snow albedo and the variables analyzed are shown by means of Pearson’s correlation coefficient (r). In addition, backward trajectories analysis using the NOAA HYSPLIT model was performed to estimate dust sources. In Section 3, we discuss the results considering previous studies at a regional and global level. Finally, conclusions are found in Section 4.

2. Materials and Methods
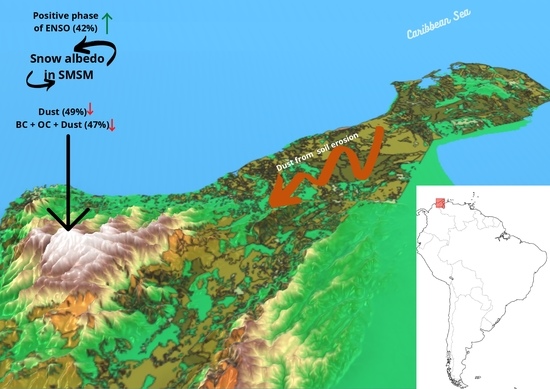
2.1. Analyzed Area

SNSM is the northernmost tropical cryosphere area in Colombia and South America (10.82° N, 73.75° W), as shown in Figure 1 [60]. It is geologically associated with the Tropical Andes [65]. Moreover, SNSM is the highest coastal mountain system in the world (5775 m.a.sl.). Its highest peaks are less than 45 km from the coastline in the Caribbean Sea [66]. Since 1964, it is a protected area called Sierra Nevada de Santa Marta National Natural Park, covering 3830 km2. Its highest areas are inhabited by the Koguis, Arhuacos, Wiwas, and Kankuamos indigenous communities, who also administer and help preserve the SNSM from the Kogui-Malayo-Arhuaco reservation as a sub-area within the mentioned national natural park. These communities limit access to areas of snow and glaciers, as they are considered sacred areas for their culture [67]. Furthermore, the SNSM serves as a source of water to 36 rivers, which are the main source of fresh water to approximately 3.4 million inhabitants in the departments of Magdalena, La Guajira, and Cesar from North Colombia [60,68,69].

2.2. Data Analysis

We analyzed a data set from March 2000 to February 2020. We selected the areas with a height greater than 4000 m.a.s.l. (Figure 1) because, according to previous studies, this is where snowfall occurs and glaciers are located [57]. We mainly use MODIS daily data (https://modis.gsfc.nasa.gov/data/) with a special resolution of 0.5 and 1 km, as shown in Table 1. The latest MODIS data collection (V6) includes several enhancements to the previous version including, but not limited to, elimination of Terra sensor degradation issues and improvements to atmospheric calibration [70]. In addition, snow products such as MYD10A1 and MOD10A1 were compiled with algorithms that only include the highest quality atmospherically corrected observations [71]. Previous studies indicate that the general error of the albedo product in snow (MOD10A1 and MYD10A1) can vary from 1% to 10% for good observations with low atmospheric disturbances [43]. In satellite imagery analysis, the steep slopes of complex terrain can increase errors. In this sense, this type of error is likely higher in the SNSM due to complex terrain. However, changes in snow albedo can still be quantified, so we opted for a temporal change analysis per pixel that is expected to mitigate the influence of topography to some extent by avoiding direct intercomparing of pixels influenced by different slopes-aspects [17,39]. The MODIS instrument products do not generate data in the presence of clouds in order to minimize the effect of missing data under these conditions. We combined the data recovered from the Terra and Aqua satellites, by means of the daily pixel by pixel comparison to replace the failed data or overcast sky. This was observed during the pass of the Terra satellite but not by the Aqua satellite and vice versa. Since there was data for both, the one with the best quality was selected [72]. This is because these satellites have the MODIS instrument on board and pass through the studied area daily, but, at different times, increase the probability of taking cloud-free observations. For example, when only using Terra (MOD10A1), data were retrieved for 69% of the analyzed time period. However, when combined with data retrieved from Aqua (MYD10A1), the cloud-free data increased to 83%.
Snow precipitation (SP) were estimated (per pixel) for the rains retrieved from the GPM satellites (https://gpm.nasa.gov/missions/GPM) and LST below 0 °C (MOD11A and MYD11A1) [17,41]. For instance, whenever a pixel registered a data of rainfall and a temperature below 0 °C at the same time, then it is assumed that it is SP [17,41]. We used snow cover as Normalized difference snow index (NDSI), which is an index that is connected to the presence of snow in a pixel and is a more accurate description of snow detection. Then, snow cover was detected using the NDSI ratio of the difference in VIS and SWIR reflectance. NDSI = ((band 4 − band 6)/(band 4 + band 6)). Thus, a pixel with NDSI > 0.0 is considered to have some snow present. At the same time, a pixel with NDSI <= 0.0 is a snow free land surface [91]. Daily data sets of SA, NDSI, SP, and LST were analyzed using box-and-whisker plots. With this, it is possible to observe the variability and skewness of the data and, if so, its positive or negative direction. In this way, the trend of the data can be estimated, either increasing or decreasing in the period analyzed. In addition, we analyzed the SA monthly variations with the bi-monthly ENSO index (MEI) (https://psl.noaa.gov/enso/mei/), and with the reanalysis data of BC, OC, and dust from MERRA-2 (https://gmao.gsfc.nasa.gov/reanalysis/MERRA-2/) [92]. SA mean monthly values were correlated by means of Pearson’s coefficient (r) with mean monthly values of NDSI, LST, SP, warm phase of ENSO as ENSO (+), ENSO cold phase as ENSO (−), BC, OC, and dust. Finally, we explore the potential sources of dust, as the most influential LAI in the SA, which may be reaching the snowy areas and reducing snow albedo. Then, we show the map of the degree of soil erosion in Northern Colombia [93]. Additionally, we used the web version of the NOAA HYSPLIT trajectory model driven by meteorological reanalysis data from Global Data Assimilation System (GDAS, https://www.ready.noaa.gov/HYSPLIT_traj.php). The multiple backward of air parcels arriving to SNSM have been computed for 24-h of Caribbean air mass transport [94].

3. Results

3.1. Daily Variation of Snow Albedo, NDSI, Snow Precipitation, and Temperature

Figure 2 shows boxplots for daily SA, NDSI, SP, and LST datasets. SA showed a mean of 41.4% while a mean of 42.6%, indicating that the data is skewed towards higher values (mean > median) with outliers of up to 100% shown in Figure 2a. This skewness toward positive values is related to the occurrence of higher mean daily SP of 7.46 mm with extreme values or outliers of up to 83 mm (Figure 2c). However, the snow cover, represented by the NDSI (Figure 2b) showed a skewness towards lower values with a mean of 0.07 and a median of 0.1 (mean < median). This decrease in snow cover would be influenced by the snowmelt caused by the increase in temperature with a median of 0.97 °C, a mean of 1.31 °C, a minimum value of −8.45 °C, and a maximum value of 9.6 °C (Figure 2d).

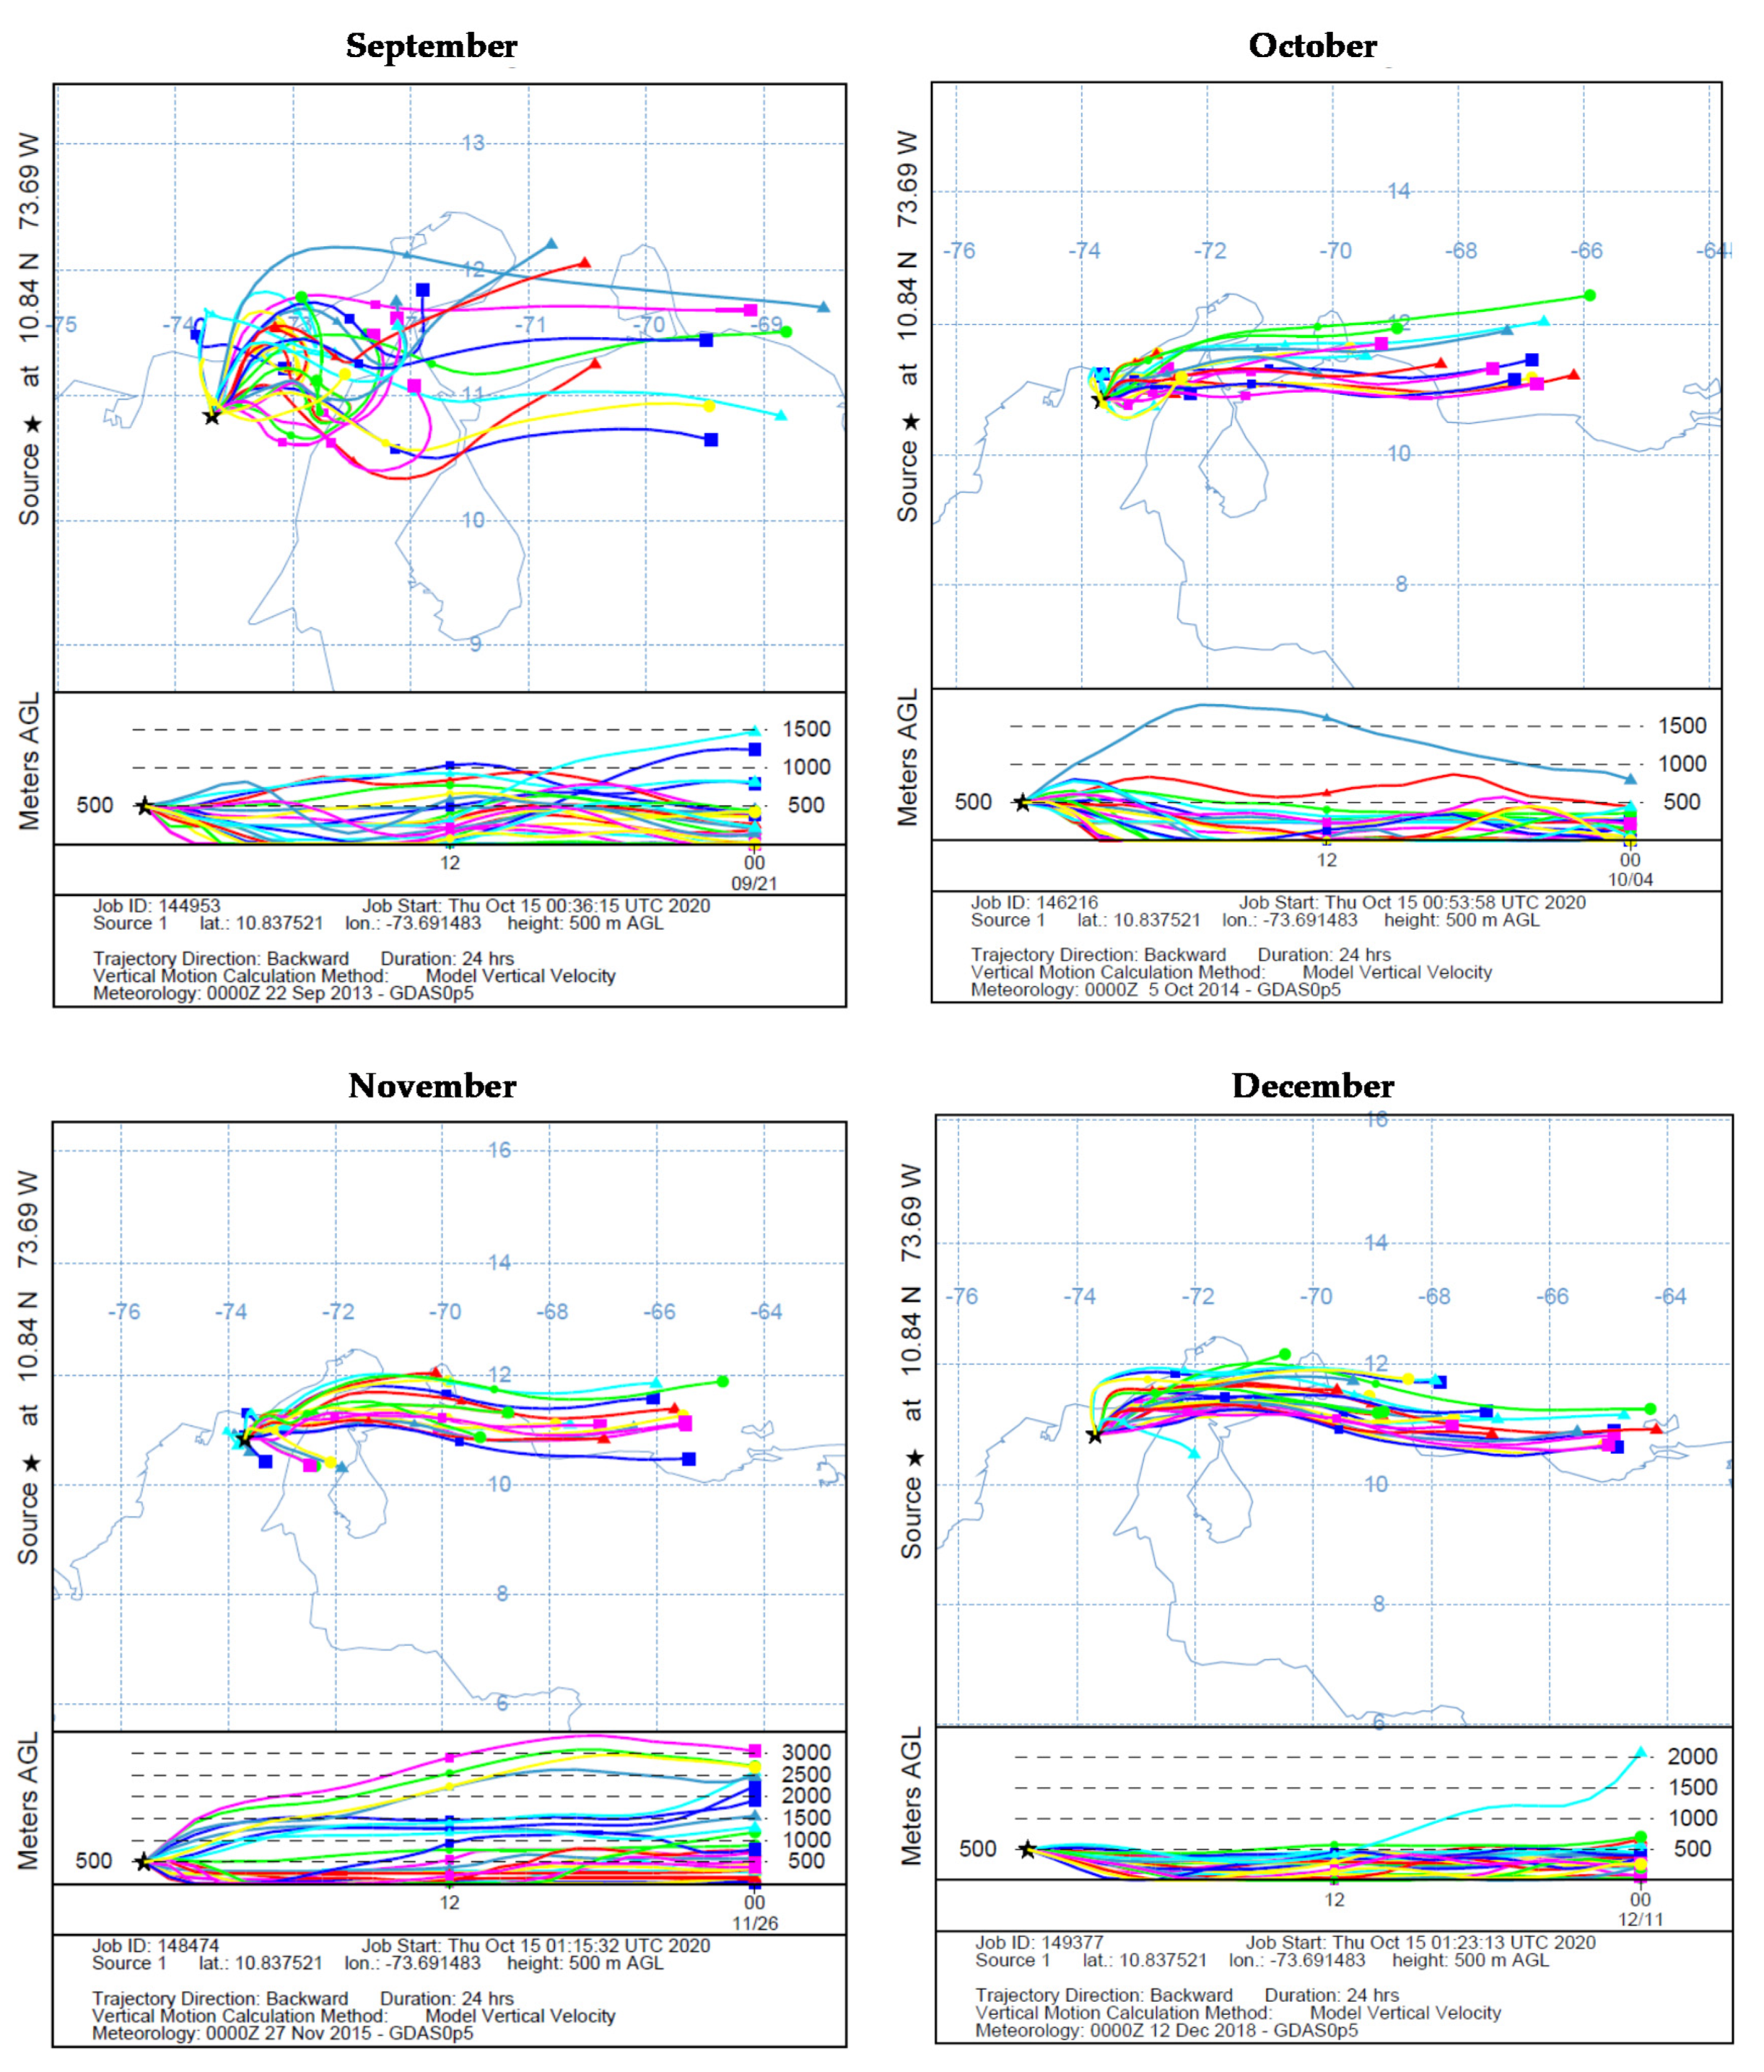
3.2. Impact of ENSO and LAI on SA

Figure 3 shows the mean monthly variation from March 2000 to February 2020 of SA and SP. Figure 3a show a high consistency between the monthly behavior of the SP and SA from March 2000 to February 2020. It is appreciated that the SNSM has a bi-modal cycle of rainfall with peaks in May and October of each year (Figure 3b). In addition, it seems to influence an increase of the SA, which presents the maximum monthly mean during the same months of May and October. Meanwhile, Figure 4a displays the monthly average variation for SA and the bi-monthly multivariate ENSO index (MEI) from 2000 to 2020. It shows that, for most years, high snow albedo values were related to the negative phases (ENSO cold phase) and vice versa.
Figure 4b,c showed that the values of BC and OC show that the higher values were related to reductions in SA. However, no significant negative relationships of BC and OC were observed in SA. Figure 4d shows the monthly behavior of snow albedo and dust surface mass concentration. It is shown that high snow albedo values were associated with low concentrations of surface dust. While the combined effect of BC, OC, and dust seems to have a significant effect in reducing the SA of the SNSM (Figure 4e). Thus, considering the rain cycles observed in Figure 3b, and the studied sub-areas shown in Figure 1, we estimate in Table 2 the r coefficient between SA and the analyzed variables. The SA variables showed significant correlations (positive or negative), according to the expected physical behavior. For example, the NDSI showed a positive correlation with albedo of up to 45% (p < 0.001) for the November-December (ND) period in the Southeast area. Furthermore, SP showed a correlation with SA of up to 75% (p < 0.001) for the ND period in the Northern area. SA showed a negative correlation of 36% (p < 0.001), 42% (p < 0.001), and 41% (p < 0.001) for LST, ENSO (+), and dust, respectively, in the ND period in Southwestern area. Our data indicate that the greatest negative impact on SA was produced by dust in the Southeast area with 48% (p < 0.001) during the period from May to June (MJ) and by ENSO (+) in the Southwestern area with 42% (p < 0.01) for the ND period. Overall, it was observed that BC and OC did not have a single negative effect on SA, but it seems to have a combined effect when the sum of the three (Bc + Oc + Dust) was considered.
Figure 5 shows the monthly mean and variation of the snow albedo for the whole SNSM area and for the subareas shown in Figure 1. As mentioned before, snow albedo in the SNSM is related to snow precipitations that have two annual peaks (Figure 3b). In general, the whole area presented maximum values of monthly mean snow albedo (46.5% in May and 46% in October) for each year (Figure 5a). The highest monthly values of SA presented were 48.6%, 46.34%, and 45% in May for the northern, southwestern, and southeast areas, respectively. Generally, recovery of SA during the months of May is strongly related to SP, which shows significant positive correlational values between 53% (p < 0.001) and 64% (p < 0.001) for MJ periods (Table 2). In addition, the positive influence of NDSI on SA was more evident in the second annual peak presented in the months of September to December, which showed a significant correlation between 33% (p < 0.01) and 58% (p < 0.001) for the September to October (SO) period, as previously appearing in Table 2.
The largest negative monthly variations of SA were in June and December for all areas analyzed (as shown in Figure 5). The positive phase of the ENSO also shows a negative correlation with SA mainly in the second half of the year (June to December). Furthermore, dust was significantly negatively correlated with SA in SNSM. It showed correlations of 37% (p < 0.01), 41% (p < 0.001) and 43% (p < 0.001) in the ND period for the whole area, southwestern area, and southeastern area, respectively. Assuming that the dust sources are nearby to the area analyzed, Figure 6 shows the degree of soil erosion around SNSM, where it can be seen that, in most of this region on the Colombian side, the degree of soil erosion is very high or high. This likely causes dust particles from disturbed and loose soils to be dragged by the winds and reach the snowy areas of the SNSM. When exploring the sources of dust in the snow and glaciers of SNSM, we simulated a backward trajectory using the web version of the NOAA HYSPLIT model via the Real-time Environmental Applications and Display system (READY) [94,95]. We run 24 h backward trajectories for each of the months which the greatest impact of dust was observed in SA (Table 2), namely, September, October, November, and December. The results show that superficial air masses pass through the eroded area shown in Figure 6. Thus, these air masses would be lifting and dragging the dust to the snowy areas of the area studied in the SNSM, entering mainly from the northeast side (Figure 7).

4. Discussion

4.1. Influence of NDSI and Snow Precipitation on Snow Albedo

Flanner and Zender [97] showed that snowfall provides fresh snow with small snow grains, increasing the total effective surface area of snow grains, and resulting in increased snow albedo. Other studies displayed results in the same direction and also linked high values of snow albedo to a longer time of snow cover permanence [17,18,40,98,99,100,101,102]. In the inner tropics, precipitation shows seasonal changes due to the Intertropical Convergence Zone that ensures two wet seasons each year [103]. Furthermore, studies showed an increasing trend in rainfall, both on an annual scale and during the rainy season, after the mid-20th century, mainly north of 11° S [104,105]. This is consistent with our findings. For instance, for almost all the analyzed area, SP and NDSI showed higher significant positive correlations with SA during the April to June and September to December periods (Table 2).

4.2. Impact of Temperature and ENSO on Snow Albedo

Rabatel et al. [57] analyzed glaciers of the tropical Andes of Colombia, Venezuela, Ecuador, Peru, and Bolivia. They found that the higher frequency of ENSO (+) events since the late 1970s, along with a warming of the troposphere over the tropical Andes, could explain much of the shrinkage of these tropical glaciers. They found that the monthly mass balance in glaciers was up to 3.5 times more negative during ENSO (+) events than in an average month in Colombia. Recent studies found similar data in tropical Andean glaciers such as Conejeras Glacier in Colombia. It shows great sensitivity to temperature changes and especially to the evolution of the ENSO(+) phenomenon with great loss of mass and area during these warm events, suffering a reduction of 37% between 2006 and 2017 [106]. Additionally, the average summer temperature near the surface is 0.7 to 1.3 °C higher during ENSO(+) than during ENSO(−), which improves the melting glacier surface [107]. These studies reinforce our results. In effect, Figure 2 shows an LST increase and significant negative correlations between ENSO(+) and SA (see Figure 5). As mentioned before, SA in the SNSM is related to SP that has two annual peaks (Figure 3b). In general, the whole area presented maximum values of monthly mean of SA (46.5% in May and 46% in October) for each year (Figure 5a). The highest monthly SA means presented values of 48.6%, 46.34%, and 45% in May for the northern, southwestern, and southeast areas, respectively. Generally, recovery of SA during the months of May is strongly related to SP, which shows significant positive correlational values between 54% (p < 0.001) and 64% (p < 0.001) for MJ periods (Table 2). In addition, the positive influence of NDSI on SA was more evident in the second annual peak presented in the months of September to December, which showed a significant correlation between 33% (p < 0.01) and 58% (p < 0.001) for the SO and ND periods, as previously presented in Table 2. Thus, our analysis shows how the increase in frequency of ENSO(+) and its temperature risings are associated with the glacier mass loss identified in the SNSM between 2000 and 2018 [61].

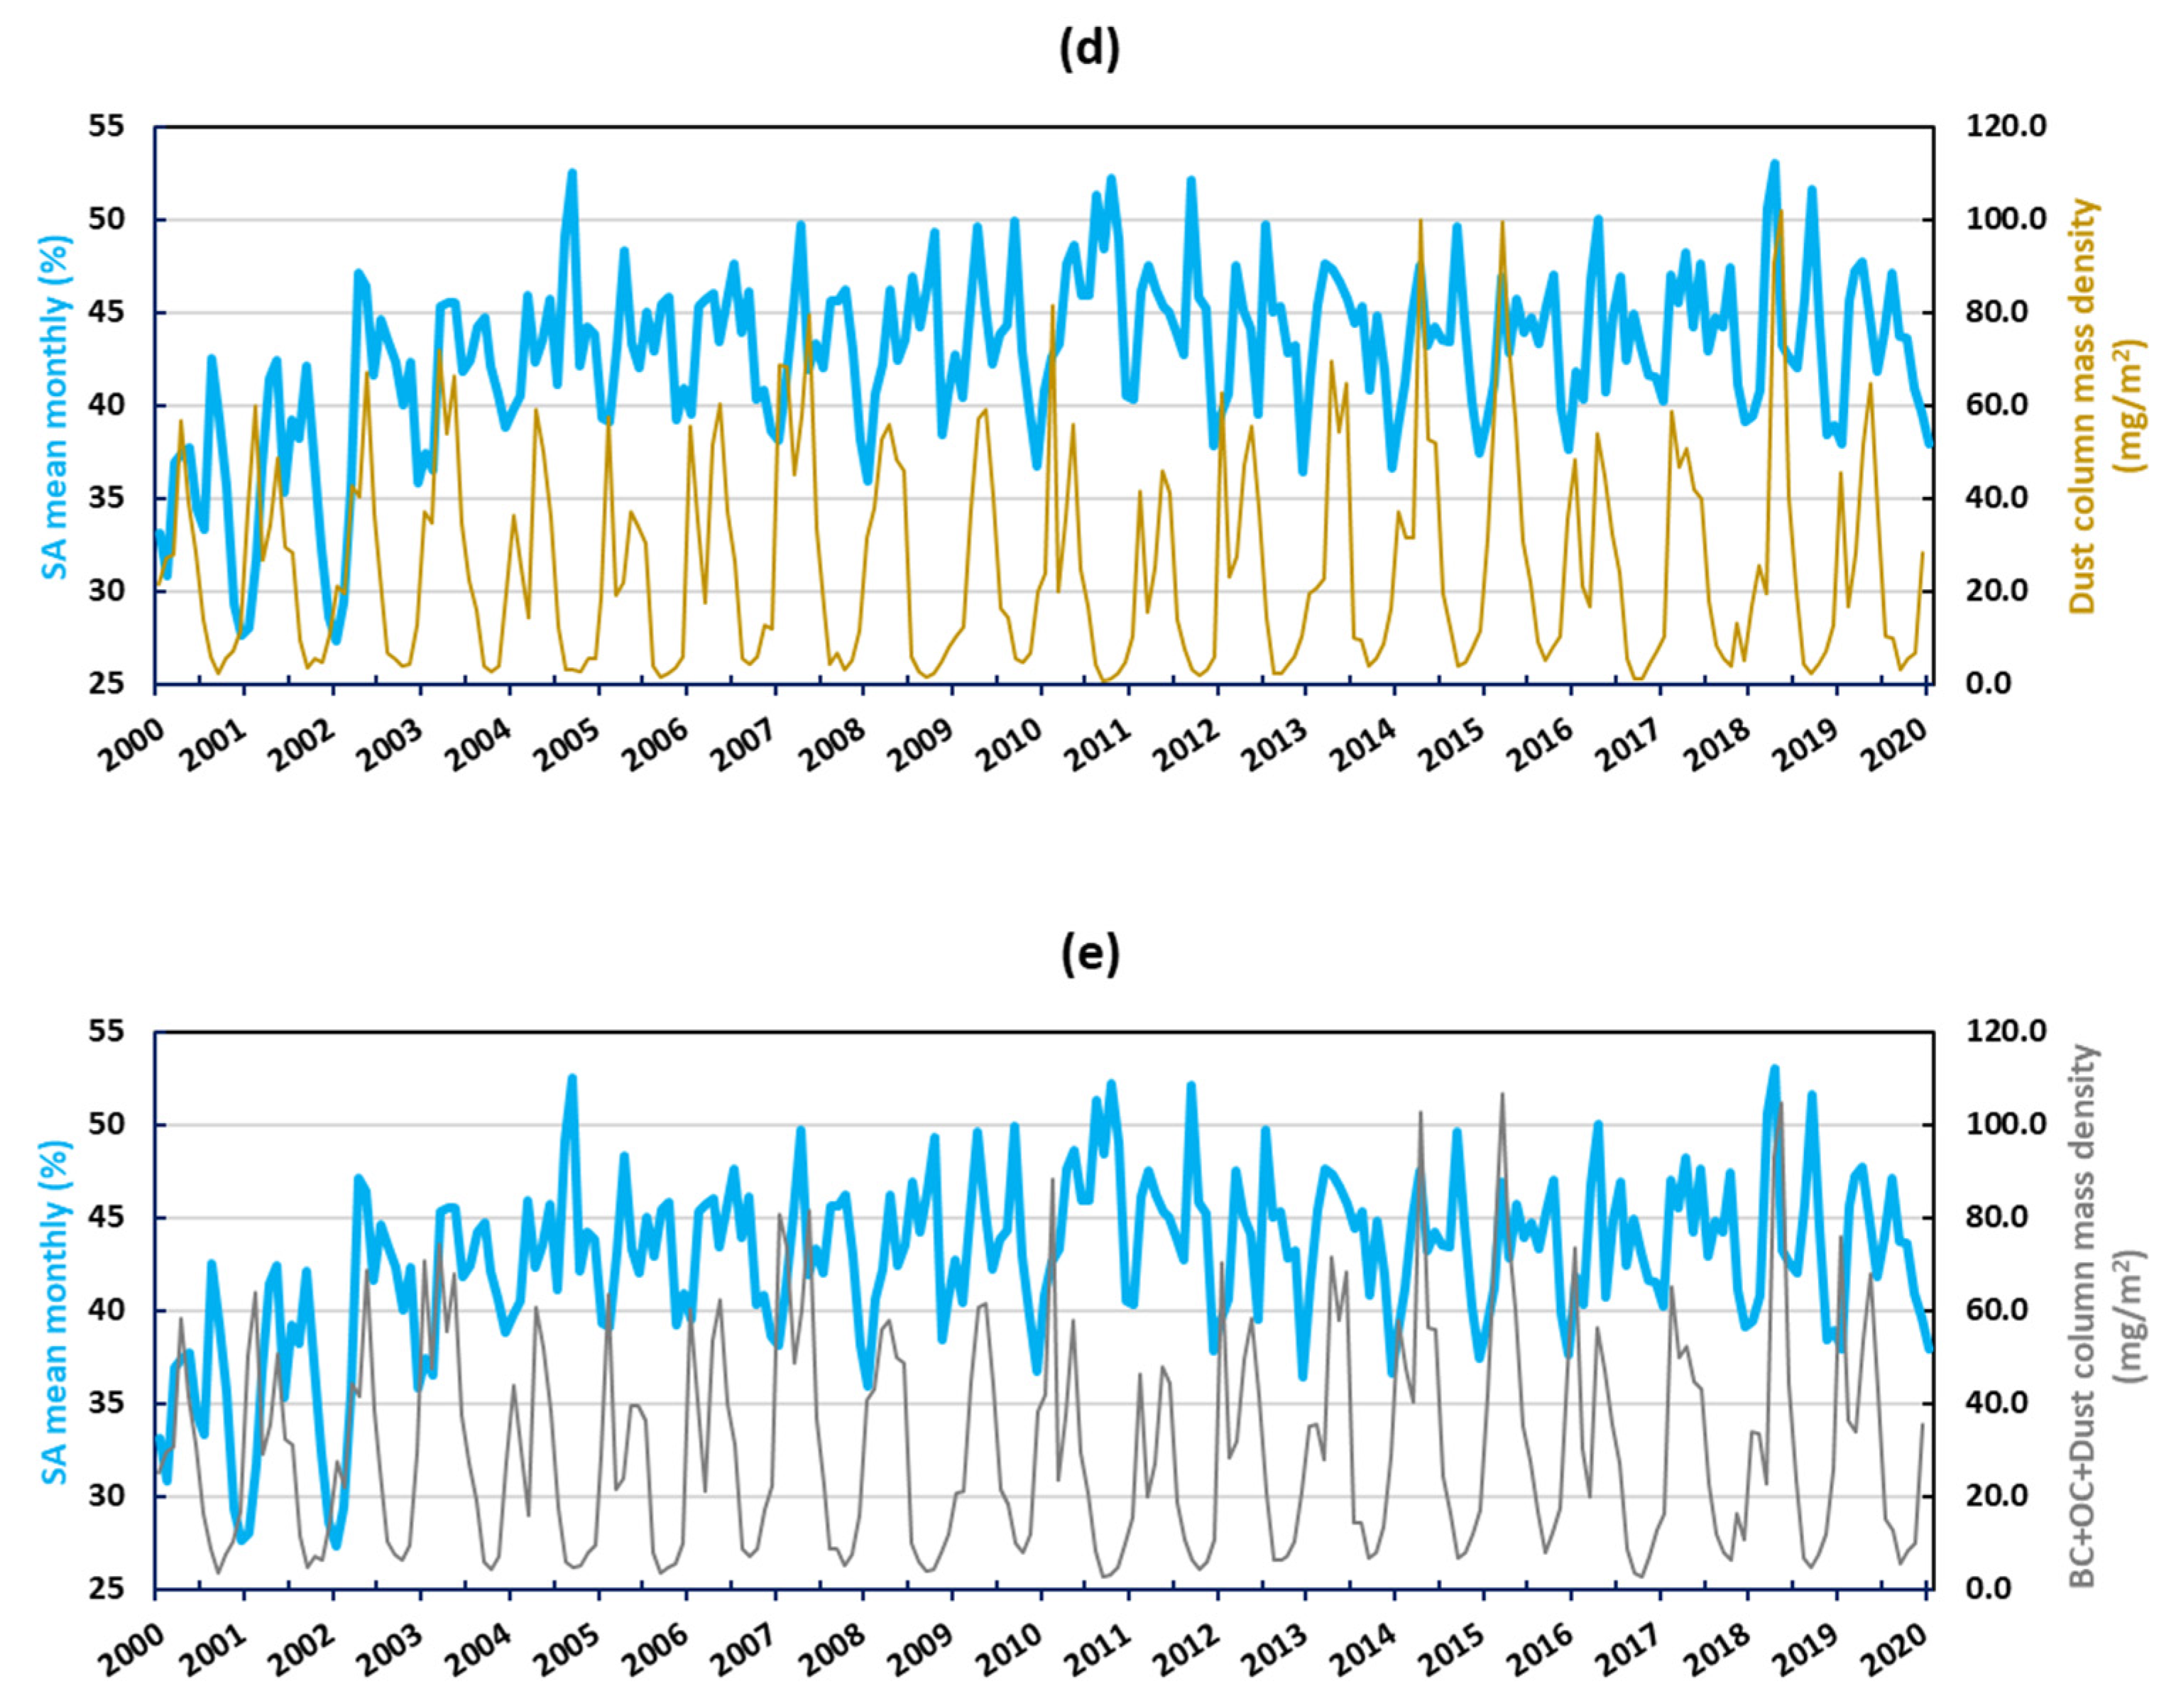
4.3. LAI Effect on Decreasing of Snow Albedo

BC, OC, and dust are the main LAI particles that snow albedo affects through the darkening of these surfaces. The consequent absorption of more solar radiation, therefore, increase the snow melting rate [26,29,31,34,37]. Recent studies carried out in India analyzed the inorganic ions, OC, BC, dust, and sea salt through concentrations of PM2.5 Surface Concentrations from MERRA-2. They found correlations of 0.96 and 0.6 between estimates and measurements for the monthly and daily averaged concentrations, respectively [84]. Thus, this shows that MERRA-2 data are useful in long-term air quality studies. Dust has been considered as a particle that scatters light in the atmosphere, but a particle that absorbs light only when it is deposited on snow or ice [6]. In fact, in many parts of the world, it has been identified that dust decreases the snow albedo [32,49,108,109,110,111]. Studies conducted in the San Juan Mountains, CO, USA, showed that dust in snow has direct and indirect radiative impacts. Direct absorption by dust contributes approximately 80% of the total radiative forcing, while thickening of the grain of snow represents approximately 20%, and, consequently, a decrease in snow albedo [112]. These studies are consistent with our results. For example, our results revealed a statistical highly significant correlation (p < 0.001) that relates the snow albedo decrease with the dust increase of up to 41% and 43% for the sub-areas located at the southwestern and southeast, respectively (Table 2). Droughts have increased and land alternations in regional sources are related to the increases in dust deposition on mountain snow cover [113], enhancing absorbed solar radiation and its snowmelt rates [18,114]. Our results suggest that soil erosion in the surroundings of the SNSM (Figure 6) and the dragging of exposed dust from its disturbed soil is blown by wind to the snowy studied areas (Figure 7), which is greater in the southern areas (as shown in Table 2) where the slope favors the atmospheric dust deposition. Other studies also point in this direction, since the reduction of snow cover duration is amplified where the mountainous areas receive dust from disturbed lands [108]. Therefore, under global warming and associated desertification by soil erosion, this process could threaten water resources fed by thawing in arid and semi-arid regions. Our results also displayed that BC and OC would not have a significant effect on the reduction of SA in the SNSM. This may be due to the fact that the main source of BC and OC are forest burns that have occurred sporadically with the duration of a few days in this region [115]. Therefore, the monthly averages of BC and OC since MERRA 2 were not sensitive to these changes.
Our findings show strong correlation between dust and the decrease in snow albedo in the SMSN during the last two decades (2000–2020). However, it presents some limitations. Daily concentrations of BC, OC, and dust were not analyzed. Especially, this did not allow us to observe the short effect that biomass burning would have in increasing LAI particles, such as BC and OC in snow albedo decrease in the SNSM. In addition, due to the limitations to access the snow and glacial areas imposed by the local indigenous communities [67], it has not been possible to collect snow and ice samples to analyze the presence of LAI particles. Future research can analyze the daily scale events of BC and OC increases and their effects on snow albedo variations in the SNSM. Furthermore, the possible effect that the arrival of the Saharan dust intrusion that are presented each year would have in snow albedo decrease of the studied area could be studied.

5. Conclusions

It is known that snow albedo changes are associated with climatic variables and negative feedback from light-absorbing atmospheric aerosols. Therefore, our research analyzed the relationship of snow cover, snowfall, temperature, and light-absorbing impurities such as black carbon, organic carbon, and dust on snow albedo in the SNSM during the last two decades (2000–2020). As expected, our studies showed that increases in NDSI snow cover and snowfall improved snow albedo in the SNSM, especially in the months of May and October of each year. However, increases of temperature and ENSO (+) frequency were statistically highly correlated with snow albedo by up to −55% and −42% (p < 0.001), respectively. Furthermore, our findings suggest that the presence of light-absorbing impurities such as dust in snowy areas would increase the reduction of snow albedo, especially in the sub-areas located in the south of the SNSM. Therefore, the negative correlation is between 34% (p < 0.01) and 49% (p < 0.001), which is caused mainly by dust from soil erosion in the nearby region. Overall, this study displayed that variations in snow cover, snowfall, temperature, and dust have had a significant correlation on the behavior of snow albedo in the SNSM. Thus, considering the importance of snowy areas through tropical mountains, this study can help decision-makers to better understand the changes under climate change scenarios.

Author Contributions

Conceptualized the study, T.R.B.-O. Performed the formal analysis, visualization and data curation, T.R.B.-O. and V.L.D.-G. Prepared the original initial draft and writing, T.R.B.-O., V.L.D.-G., and Y.C.-C. Supervised and provided critical reviews and editing, T.R.B.-O. and Y.C.-C. Funding acquisition, Y.C.-C. All authors have read and agreed to the published version of the manuscript.

Funding

The work of T.R.B.-O. was funded in part by the Consejo Nacional de Investigaciones Científicas y Técnicas (CONICET) (National Council for Scientific and Technical Investigations), the National Agency of Scientific and Technological Promotion (ANPCyT) (Agencia Nacional de Promoción Científica y Tecnológica) under project PICT 2016 1115, and Universidad Tecnológica Nacional (UTN) (National Technological University) in Argentina. T.R.B.-O. also thanks the ANID FONDEF: ID19I10359 project from Ministerio de Ciencia, Tecnología, Conocimiento e Innovación of Chile for financial assistance. V.L.D.-G. and Y.C.-C. thanks the grants and fund research (AA N° 014–2015, AA N° 031–2016, Res N° 0388–2017, Res N° 0709–2017, Res N° 0119–2018 and Res N° 0305–2018) from Universidad del Magdalena (Colombia).

Acknowledgments

We would like to thank Ing Francisco Iglesias for proofreading our paper. We also would like to thank the MODIS, TRMM, MERRA, and NOAA HYSPLIT scientific teams, and their associated personnel for the production of the data used in this research effort.

Conflicts of Interest

The authors declare no conflict of interest.

Abbreviations

The following abbreviations are used in this manuscript.
LAILight-absorbing impurities
SDEsnow darkening effect
ENSONiño–Southern Oscillation
HYSPLITHybrid Single Particle Lagrangian Integrated Trajectory Model
SNSMSierra Nevada de Santa Marta
MODISModerate Resolution Imaging Spectroradiometer
NDSINormalized Difference Snow Index
MEIbi-monthly multivariate ENSO index
LSTLand Surface Temperature
SPSnow Precipitation
GPMGlobal Precipitation Measurement
MERRA-2Modern-Era Retrospective analysis for Research and Applications, Version 2
BCBlack Carbon
OCOrganic Carbon
VISSpectral bands covering the visible
SWIRSpectral bands in short-wave infrared
GDASGlobal Data Assimilation System

References

  1. Dozier, J. Spectral signature of alpine snow cover from the landsat thematic mapper. Remote Sens. Environ. 1989, 28. [Google Scholar] [CrossRef]
  2. Bhardwaj, A.; Sam, L.; Bhardwaj, A.; Martín-Torres, F.J. LiDAR remote sensing of the cryosphere: Present applications and future prospects. Remote Sens. Environ. 2016, 177, 125–143. [Google Scholar] [CrossRef]
  3. Bhardwaj, A.; Joshi, P.K.; Snehmani; Singh, M.K.; Sam, L.; Gupta, R.D. Mapping debris-covered glaciers and identifying factors affecting the accuracy. Cold Reg. Sci. Technol. 2014, 106–107. [Google Scholar] [CrossRef]
  4. Bhardwaj, A.; Joshi, P.K.; Snehmani; Sam, L.; Singh, M.K.; Singh, S.; Kumar, R. Applicability of Landsat 8 data for characterizing glacier facies and supraglacial debris. Int. J. Appl. Earth Obs. Geoinf. 2015, 38, 51–64. [Google Scholar] [CrossRef]
  5. IPCC. Climate Change 2007: Impacts, Adaptation and Vulnerability: Contribution of Working Group II to the Fourth Assessment Report of the Intergovernmental Panel; Parry, M., Canziani, O., Palutikof, J., Van der Linden, P., Hanson, C., Eds.; Cambridge University Press: Cambridge, UK, 2007. [Google Scholar]
  6. IPCC. Fifth Assessment Report—Climate Change 2013; Cambridge University Press: Cambridge, UK, 2013. [Google Scholar]
  7. Myhre, G.D.; Shindell, F.-M.; Bréon, W.; Collins, J.; Fuglestvedt, J.; Huang, D.; Koch, J.-F.; Lamarque, D.; Lee, B.; Mendoza, T.; et al. Anthropogenic and Natural Radiative Forcing. In Climate Change 2013: The Physical Science Basis; Stocker, T.F., Qin, D., Plattner, G.-K., Tignor, M.M.B., Allen, S.K., Boschung, J., Nauels, A., Xia, Y., Bex, Y., Midgley, P.M., Eds.; Cambridge Universuty Press: Cambridge, UK, 2013; pp. 659–740. [Google Scholar]
  8. Boucher, O.; Randall, D.; Artaxo, P.; Bretherton, C.; Feingold, G.; Forster, P.; Kerminen, V.-M.; Kondo, Y.; Liao, H.; Lohmann, U.; et al. Clouds and Aerosols. In Climate Change 2013: The Physical Science Basis; Stocker, T.F., Qin, D., Plattner, G.-K., Tignor, M.M.B., Allen, S.K., Boschung, J., Nauels, A., Xia, Y., Bex, Y., Midgley, P.M., Eds.; Cambridge Universuty Press: Cambridge, UK, 2013; pp. 571–658. [Google Scholar]
  9. IPCC. Climate Change 2013: The Physical Science Basis; Stocker, T.F., Qin, D., Plattner, G.-K., Tignor, M.M.B., Allen, S.K., Boschung, J., Nauels, A., Xia, Y., Bex, Y., Midgley, P.M., Eds.; IPCC: Geneva, Switzerland; Cambridge Universuty Press: Cambridge, UK, 2013. [Google Scholar]
  10. Wu, L.; Gu, Y.; Jiang, J.H.; Su, H.; Yu, N.; Zhao, C.; Qian, Y.; Zhao, B.; Liou, K.-N.; Choi, Y.-S. Impacts of aerosols on seasonal precipitation and snowpack in California based on convection-permitting WRF-Chem simulations. Atmos. Chem. Phys. 2018, 18, 5529–5547. [Google Scholar] [CrossRef] [Green Version]
  11. Koren, V.; Schaake, J.; Mitchell, K.; Duan, Q.Y.; Chen, F.; Baker, J.M. A parameterization of snowpack and frozen ground intended for NCEP weather and climate models. J. Geophys. Res. Atmos. 1999, 104. [Google Scholar] [CrossRef]
  12. Huybrechts, P.; Oerlemans, J. Evolution of the East Antarctic Ice Sheet: A Numerical Study of Thermo-Mechanical Response Patterns with Changing Climate. Ann. Glaciol. 1988, 11. [Google Scholar] [CrossRef] [Green Version]
  13. Cuffey, K.M.; Paterson, W.S.B. The Physics of Glaciers; Academic Press: Cambridge, MA, USA, 2010. [Google Scholar]
  14. Qian, Y.; Yasunari, T.J.; Doherty, S.J.; Flanner, M.G.; Lau, W.K.M.; Ming, J.; Wang, H.; Wang, M.; Warren, S.G.; Zhang, R. Light-absorbing particles in snow and ice: Measurement and modeling of climatic and hydrological impact. Adv. Atmos. Sci. 2015, 32, 64–91. [Google Scholar] [CrossRef]
  15. Qian, Y.; Wang, H.; Zhang, R.; Flanner, M.G.; Rasch, P.J. A sensitivity study on modeling black carbon in snow and its radiative forcing over the Arctic and Northern China. Environ. Res. Lett. 2014, 9. [Google Scholar] [CrossRef] [Green Version]
  16. Flanner, M.G.; Zender, C.S.; Hess, P.G.; Mahowald, N.M.; Painter, T.H.; Ramanathan, V.; Rasch, P.J. Springtime warming and reduced snow cover from carbonaceous particles. Atmos. Chem. Phys. 2009, 9, 2481–2497. [Google Scholar] [CrossRef] [Green Version]
  17. Lee, W.-L.; Liou, K.N. Effect of absorbing aerosols on snow albedo reduction in the Sierra Nevada. Atmos. Environ. 2012, 55, 425–430. [Google Scholar] [CrossRef]
  18. Warren, S.G.; Wiscombe, W.J. A Model for the Spectral Albedo of Snow. II: Snow Containing Atmospheric Aerosols. J. Atmos. Sci. 1980, 37, 2734–2745. [Google Scholar] [CrossRef]
  19. Levy, R.C.; Remer, L.A.; Mattoo, S.; Vermote, E.F.; Kaufman, Y.J. Second-generation operational algorithm: Retrieval of aerosol properties over land from inversion of Moderate Resolution Imaging Spectroradiometer spectral reflectance. J. Geophys. Res. Atmos. 2007, 112. [Google Scholar] [CrossRef] [Green Version]
  20. Hansen, J.E.; Sato, M. Trends of measured climate forcing agents. Proc. Natl. Acad. Sci. USA 2001, 98, 14778–14783. [Google Scholar] [CrossRef] [PubMed] [Green Version]
  21. Clarke, A.D.; Noone, K.J. Soot in the Arctic snowpack: A cause for perturbations in radiative transfer. Atmos. Environ. 1985, 19, 2045–2053. [Google Scholar] [CrossRef]
  22. Warren, S.G.; Wiscombe, W.J. Dirty snow after nuclear war. Nature 1985, 313, 467–470. [Google Scholar] [CrossRef]
  23. Qian, Y.; Flanner, M.G.; Leung, L.R.; Wang, W. Sensitivity studies on the impacts of Tibetan Plateau snowpack pollution on the Asian hydrological cycle and monsoon climate. Atmos. Chem. Phys. 2011. [Google Scholar] [CrossRef] [Green Version]
  24. IPCC. Climate Change 2007—The Physical Science Basis: Working Group I Contribution to the Fourth Assessment Report of the IPCC; Cambridge University Press: Cambridge, UK, 2007. [Google Scholar]
  25. Cvetinović, D.; Stefanović, P.; Marković, Z.; Bakić, V.; Turanjanin, V.; Jovanović, M.; Vučićević, B. GHG (Greenhouse Gases) emission inventory and mitigation measures for public district heating plants in the Republic of Serbia. Energy 2013, 57, 788–795. [Google Scholar] [CrossRef]
  26. Warren, S.G. Light-Absorbing Impurities in Snow: A Personal and Historical Account. Front. Earth Sci. 2019, 6. [Google Scholar] [CrossRef]
  27. Seidel, F.C.; Rittger, K.; McKenzie Skiles, S.; Molotch, N.P.; Painter, T.H. Case study of spatial and temporal variability of snow cover, grain size, albedo and radiative forcing in the Sierra Nevada and Rocky Mountain snowpack derived from imaging spectroscopy. Cryosphere 2016. [Google Scholar] [CrossRef] [Green Version]
  28. Ji, Z.M. Modeling black carbon and its potential radiative effects over the Tibetan Plateau. Adv. Clim. Chang. Res. 2016. [Google Scholar] [CrossRef]
  29. Oaida, C.M.; Xue, Y.; Flanner, M.G.; Skiles, S.M.K.; De Sales, F.; Painter, T.H. Improving snow albedo processes in WRF/SSiB regional climate model to assess impact of dust and black carbon in snow on surface energy balance and hydrology over western U.S. J. Geophys. Res. 2015. [Google Scholar] [CrossRef] [Green Version]
  30. Skiles, S.M.K.; Painter, T. Daily evolution in dust and black carbon content, snow grain size, and snow albedo during snowmelt, Rocky Mountains, Colorado. J. Glaciol. 2017, 63. [Google Scholar] [CrossRef] [Green Version]
  31. Painter, T.H.; Bryant, A.; Skiles, S.M. Radiative forcing by light absorbing impurities in snow from MODIS surface reflectance data. Geophys. Res. Lett. 2012, 39. [Google Scholar] [CrossRef]
  32. Rowe, P.M.; Cordero, R.R.; Warren, S.G.; Stewart, E.; Doherty, S.J.; Pankow, A.; Schrempf, M.; Casassa, G.; Carrasco, J.; Pizarro, J.; et al. Black carbon and other light-absorbing impurities in snow in the Chilean Andes. Sci. Rep. 2019, 9, 1–16. [Google Scholar] [CrossRef] [Green Version]
  33. Tuzet, F.; Dumont, M.; Lafaysse, M.; Picard, G.; Arnaud, L.; Voisin, D.; Lejeune, Y.; Charrois, L.; Nabat, P.; Morin, S. A multilayer physically based snowpack model simulating direct and indirect radiative impacts of light-absorbing impurities in snow. Cryosphere 2017, 11. [Google Scholar] [CrossRef] [Green Version]
  34. Zhang, Y.; Kang, S.; Cong, Z.; Schmale, J.; Sprenger, M.; Li, C.; Yang, W.; Gao, T.; Sillanpää, M.; Li, X.; et al. Light-absorbing impurities enhance glacier albedo reduction in the southeastern Tibetan plateau. J. Geophys. Res. 2017. [Google Scholar] [CrossRef]
  35. Li, X.; Kang, S.; Zhang, G.; Qu, B.; Tripathee, L.; Paudyal, R.; Jing, Z.; Zhang, Y.; Yan, F.; Li, G.; et al. Light-absorbing impurities in a southern Tibetan Plateau glacier: Variations and potential impact on snow albedo and radiative forcing. Atmos. Res. 2018, 200, 77–87. [Google Scholar] [CrossRef]
  36. Gelman Constantin, J.; Ruiz, L.; Villarosa, G.; Outes, V.; Bajano, F.N.; He, C.; Bajano, H.; Dawidowski, L. Measurements and modeling of snow albedo at Alerce Glacier, Argentina: Effects of volcanic ash, snow grain size and cloudiness. Cryosphere Discuss. 2020, 2020, 1–32. [Google Scholar] [CrossRef]
  37. Li, X.; Kang, S.; He, X.; Qu, B.; Tripathee, L.; Jing, Z.; Paudyal, R.; Li, Y.; Zhang, Y.; Yan, F.; et al. Light-absorbing impurities accelerate glacier melt in the Central Tibetan Plateau. Sci. Total Environ. 2017. [Google Scholar] [CrossRef]
  38. Sarangi, C.; Qian, Y.; Rittger, K.; Bormann, K.J.; Liu, Y.; Wang, H.; Wan, H.; Lin, G.; Painter, T.H. Impact of light-absorbing particles on snow albedo darkening and associated radiative forcing over high-mountain Asia: High-resolution WRF-Chem modeling and new satellite observations. Atmos. Chem. Phys. 2019, 19, 7105–7128. [Google Scholar] [CrossRef] [Green Version]
  39. Malmros, J.K.; Mernild, S.H.; Wilson, R.; Tagesson, T.; Fensholt, R. Snow cover and snow albedo changes in the central Andes of Chile and Argentina from daily MODIS observations (2000–2016). Remote Sens. Environ. 2018, 209, 240–252. [Google Scholar] [CrossRef] [Green Version]
  40. Puliafito, S.E.; Bolaño-Ortiz, T.R.; Pascual, R.; Lopez-Noreña, A.; Berná, L. Snow Albedo Reduction in Central Andes by Atmospheric Aerosols: Case Study on the Tunuyán Basin (Argentina). In Proceedings of the 2020 IEEE Latin American GRSS & ISPRS Remote Sensing Conference (LAGIRS), Santiago, Chile, 22–26 March 2020; pp. 548–553. [Google Scholar] [CrossRef]
  41. Bolaño-Ortiz, T.R.; Allende, D.G.; Puliafito, S.E.; Pascual-Flores, R.M.; Ruggeri, M.F. Potential deposition of atmospheric aerosols on the snow and albedo reduction in the Mendoza river basin, Argentina. In Proceedings of the 5th iLEAPS Science Conference, Oxford, UK, 11–14 September 2017. [Google Scholar]
  42. Cereceda-Balic, F.; Vidal, V.; Moosmüller, H.; Lapuerta, M. Reduction of snow albedo from vehicle emissions at Portillo, Chile. Cold Reg. Sci. Technol. 2018, 146, 43–52. [Google Scholar] [CrossRef]
  43. Klein, A.G.; Stroeve, J. Development and validation of a snow albedo algorithm for the MODIS instrument. Ann. Glaciol. 2002. [Google Scholar] [CrossRef] [Green Version]
  44. Ruggeri, M.F.; Castesana, P.S.; Bolaño-Ortiz, T.R.; Puliafito, S.E.; Pascual Flores, R.M.; Altamirano, J.C.; Allende, D.G. Identifying Patterns and Sources of Anthropogenic Trace Metals in the Argentine Central Andes by using snow samples and an Atmospheric Dispersion Model. Environ. Sci. Process. Impacts 2020, 1491–1501. [Google Scholar] [CrossRef]
  45. Koch, D.; Menon, S.; Del Genio, A.; Ruedy, R.; Alienov, I.; Schmidt, G.A. Distinguishing aerosol impacts on climate over the past century. J. Clim. 2009. [Google Scholar] [CrossRef] [Green Version]
  46. Keegan, K.M.; Albert, M.R.; McConnell, J.R.; Baker, I. Climate change and forest fires synergistically drive widespread melt events of the Greenland Ice Sheet. Proc. Natl. Acad. Sci. USA 2014, 111. [Google Scholar] [CrossRef] [Green Version]
  47. Pepin, N.; Bradley, R.S.; Diaz, H.F.; Baraer, M.; Caceres, E.B.; Forsythe, N.; Fowler, H.; Greenwood, G.; Hashmi, M.Z.; Liu, X.D.; et al. Elevation-dependent warming in mountain regions of the world. Nat. Clim. Chang. 2015, 5, 424–430. [Google Scholar]
  48. Gertler, C.G.; Puppala, S.P.; Panday, A.; Stumm, D.; Shea, J. Black carbon and the Himalayan cryosphere: A review. Atmos. Environ. 2016, 125. [Google Scholar] [CrossRef]
  49. Di Mauro, B.; Garzonio, R.; Rossini, M.; Filippa, G.; Pogliotti, P.; Galvagno, M.; Morra Di Cella, U.; Migliavacca, M.; Baccolo, G.; Clemenza, M.; et al. Saharan dust events in the European Alps: Role in snowmelt and geochemical characterization. Cryosphere 2019, 13. [Google Scholar] [CrossRef] [Green Version]
  50. Schoolmeester, T.; Johansen, K.S.; Alfthan, B.; Baker, E.; Hesping, M.; Verbist, K. The Andean Glacier and Water Atlas—The Impact of Glacier Retreat on Water Resources; UNESCO and GRID-Arenda: Paris, France, 2018; ISBN 978-92-3-100286-1. [Google Scholar]
  51. Molina, L.T.; Andrade, M.; Baumgardner, D.; Casassa, G.; Dawidowski, L.; Garreaud, R.; Huneeus, N.; Lambert, F. Pollution and its Impacts on the South American Cryosphere. Earth’s Future 2015, 3, 345–369. [Google Scholar] [CrossRef]
  52. Kaser, G. A review of the modern fluctuations of tropical glaciers. Glob. Planet. Chang. 1999, 22. [Google Scholar] [CrossRef]
  53. Morris, J.N.; Poole, A.J.; Klein, A.G. Retreat of Tropical Glaciers in Colombia and Venezuela from 1984 to 2004 as Measured from ASTER and Landsat Images. In Proceedings of the 63rd Eastern Snow Conference, Newark, DE, USA, 7–9 June 2006. [Google Scholar]
  54. Rekowsky, I.C.; Bremer, U.F.; Veettil, B.K. Variações de área das geleiras da colômbia e da venezuela entre 1985 e 2015, com dados de sensoriamento remoto. Geosci. Geociênc. 2018, 37. [Google Scholar] [CrossRef]
  55. Ceballos, J.L.; Euscátegui, C.; Ramírez, J.; Cañon, M.; Huggel, C.; Haeberli, W.; Machguth, H. Fast shrinkage of tropical glaciers in Colombia. Ann. Glaciol. 2006, 43, 194–201. [Google Scholar] [CrossRef] [Green Version]
  56. Rabatel, A.; Ceballos, J.L.; Micheletti, N.; Jordan, E.; Braitmeier, M.; González, J.; Mölg, N.; Ménégoz, M.; Huggel, C.; Zemp, M. Toward an imminent extinction of Colombian glaciers? Geogr. Ann. Ser. A Phys. Geogr. 2018, 100, 75–95. [Google Scholar] [CrossRef]
  57. Rabatel, A.; Francou, B.; Soruco, A.; Gomez, J.; Cáceres, B.; Ceballos, J.L.; Basantes, R.; Vuille, M.; Sicart, J.-E.; Huggel, C.; et al. Current state of glaciers in the tropical Andes: A multi-century perspective on glacier evolution and climate change. Cryosphere 2013, 7, 81–102. [Google Scholar] [CrossRef] [Green Version]
  58. Poveda, G.; Pineda, K. Reassessment of Colombia’s tropical glaciers retreat rates: Are they bound to disappear during the 2010–2020 decade? Adv. Geosci. 2009, 22. [Google Scholar] [CrossRef] [Green Version]
  59. IDEAM—Instituto de Hidrología Meteorología y Estudios Ambientales Glaciares en Colombia. Available online: http://www.ideam.gov.co/web/ecosistemas/glaciares-colombia (accessed on 28 July 2020).
  60. IDEAM—Instituto de Hidrología Meteorología y Estudios Ambientales Sierra Nevada de Santa Marta. Available online: http://www.ideam.gov.co/web/ecosistemas/sierra-nevada-santa-marta (accessed on 28 July 2020).
  61. Dussaillant, I.; Berthier, E.; Brun, F.; Masiokas, M.; Hugonnet, R.; Favier, V.; Rabatel, A.; Pitte, P.; Ruiz, L. Two decades of glacier mass loss along the Andes. Nat. Geosci. 2019, 12, 802–808. [Google Scholar] [CrossRef]
  62. Granados, H.D.; Miranda, P.J.; Núñez, G.C.; Alzate, B.P.; Mothes, P.; Roa, H.M.; Cáceres Correa, B.E.; Ramos, J.C. Chapter 17—Hazards at Ice-Clad Volcanoes: Phenomena, Processes, and Examples From Mexico, Colombia, Ecuador, and Chile. In Snow and Ice-Related Hazards, Risks and Disasters; Whiteman, C.A., Shroder, J.F., Haeberli, W., Eds.; Academic Press: Boston, MA, USA, 2015; pp. 607–646. ISBN 978-0-12-394849-6. [Google Scholar]
  63. Vuille, M.; Francou, B.; Wagnon, P.; Juen, I.; Kaser, G.; Mark, B.G.; Bradley, R.S. Climate change and tropical Andean glaciers: Past, present and future. Earth Sci. Rev. 2008, 89, 79–96. [Google Scholar] [CrossRef] [Green Version]
  64. López-Moreno, J.I.; Ceballos, J.L.; Rojas-Heredia, F.; Zabalza-Martinez, J.; Vidaller, I.; Revuelto, J.; Alonso-González, E.; Morán-Tejeda, E.; García-Ruiz, J.M. Topographic control of glacier changes since the end of the Little Ice Age in the Sierra Nevada de Santa Marta mountains, Colombia. J. S. Am. Earth Sci. 2020, 104, 102803. [Google Scholar] [CrossRef]
  65. Cardona, A.; Valencia, V.; Bustamante, C.; García-Casco, A.; Ojeda, G.; Ruiz, J.; Saldarriaga, M.; Weber, M. Tectonomagmatic setting and provenance of the Santa Marta Schists, northern Colombia: Insights on the growth and approach of Cretaceous Caribbean oceanic terranes to the South American continent. J. S. Am. Earth Sci. 2010, 29, 784–804. [Google Scholar] [CrossRef]
  66. Margin, C.; Recent, F.; Data, G. Basement configuration of the northwestern South America—Caribbean margin from recent geophysical data. CT&F Cienc. Tecnol. Futuro 2007, 3, 25–49. [Google Scholar]
  67. IDEAM. Glaciares de Colombia más que Montañas con Hielo; LibroEditor: Bogotá, Colombia, 2012; ISBN 978-958-8067-57-5.
  68. PNNC Parques Nacionales Naturales de Colombia. Available online: http://www.parquesnacionales.gov.co/portal/es/ecoturismo/region-caribe/parque-nacional-natural-sierra-nevada-de-santa-marta-2/ (accessed on 29 July 2020).
  69. DANE Statistics by Demography and Population in Colombia. Available online: https://www.dane.gov.co/index.php/estadisticas-por-tema/demografia-y-poblacion (accessed on 29 July 2020).
  70. Lyapustin, A.; Wang, Y.; Xiong, X.; Meister, G.; Platnick, S.; Levy, R.; Franz, B.; Korkin, S.; Hilker, T.; Tucker, J.; et al. Scientific impact of MODIS C5 calibration degradation and C6+ improvements. Atmos. Meas. Tech. 2014, 7. [Google Scholar] [CrossRef] [Green Version]
  71. Hall, D.K.; Riggs, G.A.; Salomonson, V.V.; Di Girolamo, N.E.; Bayr, K.J. MODIS snow-cover products. Remote Sens. Environ. 2002, 83, 181–194. [Google Scholar] [CrossRef] [Green Version]
  72. Cara, L.; Masiokas, M.; Viale, M.; Villalba, R. Análisis de la Cobertura Nival de la Cuenca Superior del Río Mendoza a Partir de Imágenes Modis. Meteorológica 2016, 41, 21–36. [Google Scholar] [CrossRef]
  73. Rittger, K.; Painter, T.H.; Dozier, J. Assessment of methods for mapping snow cover from MODIS. Adv. Water Resour. 2013, 51. [Google Scholar] [CrossRef]
  74. Mernild, S.H.; Malmros, J.K.; Yde, J.C.; Wilson, R.; Knudsen, N.T.; Hanna, E.; Fausto, R.S.; van As, D. Albedo decline on Greenland’s Mittivakkat Gletscher in a warming climate. Int. J. Climatol. 2015, 35. [Google Scholar] [CrossRef]
  75. Liang, S.; Stroeve, J.; Box, J.E. Mapping daily snow/ice shortwave broadband albedo from Moderate Resolution Imaging Spectroradiometer (MODIS): The improved direct retrieval algorithm and validation with Greenland in situ measurement. J. Geophys. Res. D Atmos. 2005, 110. [Google Scholar] [CrossRef] [Green Version]
  76. Dozier, J.; Painter, T.H.; Rittger, K.; Frew, J.E. Time-space continuity of daily maps of fractional snow cover and albedo from MODIS. Adv. Water Resour. 2008, 31. [Google Scholar] [CrossRef]
  77. Klein, A.G.; Barnett, A.C. Validation of daily MODIS snow cover maps of the Upper Rio Grande River Basin for the 2000–2001 snow year. Remote Sens. Environ. 2003, 86, 162–176. [Google Scholar] [CrossRef]
  78. Williamson, S.N.; Hik, D.S.; Gamon, J.A.; Kavanaugh, J.L.; Koh, S. Evaluating cloud contamination in clear-sky MODIS Terra daytime land surface temperatures using ground-based meteorology station observations. J. Clim. 2013, 26. [Google Scholar] [CrossRef]
  79. Wan, Z. New refinements and validation of the collection-6 MODIS land-surface temperature/emissivity product. Remote Sens. Environ. 2014, 140. [Google Scholar] [CrossRef]
  80. Nwaerema, P.; Vincent, O.N.; Amadou, C.; Morrison, A.I. Spatial Assessment of Land Surface Temperature and Emissivity in the Tropical Littoral City of Port Harcourt, Nigeria. Int. J. Environ. Clim. Chang. 2019. [Google Scholar] [CrossRef]
  81. Huffman, G.J.; Bolvin, D.T.; Nelkin, E.J.; Wolff, D.B.; Adler, R.F.; Gu, G.; Hong, Y.; Bowman, K.P.; Stocker, E.F. The TRMM Multisatellite Precipitation Analysis (TMPA): Quasi-Global, Multiyear, Combined-Sensor Precipitation Estimates at Fine Scales. J. Hydrometeorol. 2007. [Google Scholar] [CrossRef]
  82. Huffman, G.; Bolvin, D. TRMM and Other Data Precipitation Data Set Documentation; NASA: Greenbelt, MD, USA, 2007. [Google Scholar] [CrossRef]
  83. Joyce, R.J.; Xie, P. Kalman Filter–Based CMORPH. J. Hydrometeorol. 2011, 12, 1547–1563. [Google Scholar] [CrossRef]
  84. Navinya, C.D.; Vinoj, V.; Pandey, S.K. Evaluation of PM2.5 Surface Concentrations Simulated by NASA’s MERRA Version 2 Aerosol Reanalysis over India and its Relation to the Air Quality Index. Aerosol Air Qual. Res. 2020, 20, 1329–1339. [Google Scholar] [CrossRef] [Green Version]
  85. Randles, C.A.; da Silva, A.M.; Buchard, V.; Colarco, P.R.; Darmenov, A.; Govindaraju, R.; Smirnov, A.; Holben, B.; Ferrare, R.; Hair, J.; et al. The MERRA-2 Aerosol Reanalysis, 1980 Onward. Part I: System Description and Data Assimilation Evaluation. J. Clim. 2017, 30, 6823–6850. [Google Scholar] [CrossRef]
  86. Global Modeling and Assimilation Office (GMAO). Goddard Earth Sciences Data and Information Services Center (GES DISC). Available online: https://doi.org/10.5067/FH9A0MLJPC7N (accessed on 30 September 2020).
  87. NOAA. NOAA—Physical Sciences Laboratory. Available online: https://psl.noaa.gov/enso/mei/ (accessed on 28 July 2020).
  88. Prieto, M.D.R. ENSO signals in South America: Rains and floods in the Paraná River region during colonial times. Clim. Chang. 2007, 83. [Google Scholar] [CrossRef]
  89. Quinn, W.H.; Neal, V.T. The historical record of El Niño events. In Climate Since A.D. 1500: Revised Edition; Routledge: London, UK, 2003. [Google Scholar]
  90. Wolter, K.; Timlin, M.S. El Niño/Southern Oscillation behaviour since 1871 as diagnosed in an extended multivariate ENSO index (MEI.ext). Int. J. Climatol. 2011, 31. [Google Scholar] [CrossRef]
  91. Riggs, G.; Hall, D. MODIS Snow Products Collection 6 User Guide; National Snow and Ice Data Center: Boulder, CO, USA, 2015; p. 66. [Google Scholar]
  92. GMAO—Global Modeling and Assimilation Office. Goddard Earth Sciences Data and Information Services Center (GES DISC). Available online: http://doi.org/10.5067/KLICLTZ8EM9D (accessed on 14 August 2020).
  93. IDEAM. Erosion de los Suelos en Colombia Linea Base Periodo 2010–2011. Available online: http://www.ideam.gov.co/galeria-de-mapas/-/document_library_display/4VnjNLZDi78B/view/512114 (accessed on 28 July 2020).
  94. Rolph, G.; Stein, A.; Stunder, B. Real-time Environmental Applications and Display sYstem: READY. Environ. Model. Softw. 2017, 95, 210–228. [Google Scholar] [CrossRef]
  95. Stein, A.F.; Draxler, R.R.; Rolph, G.D.; Stunder, B.J.B.; Cohen, M.D.; Ngan, F. NOAA’s HYSPLIT Atmospheric Transport and Dispersion Modeling System. Bull. Am. Meteorol. Soc. 2015, 96, 2059–2077. [Google Scholar] [CrossRef]
  96. IDEAM; U.D.C.A. Protocolo para la Identificación y Evaluación de la Degradación de Suelos por Erosión; IDEAM: Bogotá, Colombia, 2015; ISBN 978-958-8067-80-3.
  97. Flanner, M.G.; Zender, C.S. Linking snowpack microphysics and albedo evolution. J. Geophys. Res. 2006, 111, D12208. [Google Scholar] [CrossRef] [Green Version]
  98. Chen, A.; Li, W.; Li, W.; Liu, X. An observational study of snow aging and the seasonal variation of snow albedo by using data from Col de Porte, France. Chin. Sci. Bull. 2014, 59, 4881–4889. [Google Scholar] [CrossRef]
  99. Brown, R.D.; Robinson, D.A. Snow and Snow Cover BT—Encyclopedia of World Climatology; Oliver, J.E., Ed.; Springer: Dordrecht, The Netherlands, 2005; pp. 658–663. ISBN 978-1-4020-3266-0. [Google Scholar]
  100. Tooming, H.; Kadaja, J. Snow cover and surface albedo in Estonia. Meteorol. Z. 2000, 9. [Google Scholar] [CrossRef]
  101. Bolaño-Ortiz, T.R.; Pascual-Flores, R.M.; López-Noreña, A.I.; Ruggeri, M.F.; Lakkis, S.G.; Fernández, R.P.; Puliafito, S.E. Assessment of absorbing aerosols on austral spring snow albedo reduction by several basins in the Central Andes of Chile from daily satellite observations (2000–2016) and a case study with the WRF-Chem model. SN Appl. Sci. 2019, 1, 1352. [Google Scholar] [CrossRef] [Green Version]
  102. Bolaño-Ortiz, T.R.; Ruggeri, M.F.; Pascual-Flores, R.M.; Allende, D.G.; Lakkis, S.G.; Puliafito, S.E. Relationship between anthropic pollution in the Santiago Metropolitan Region and the decrease of snow albedo on the Maipo river basin, Chile. In Proceedings of the 2018 Joint 14th iCACGP Quadrennial Symposium/15th IGAC Science Conference, Takamatsu, Japan, 25–29 September 2018. [Google Scholar]
  103. Poveda, G.; Waylen, P.R.; Pulwarty, R.S. Annual and inter-annual variability of the present climate in northern South America and southern Mesoamerica. Palaeogeogr. Palaeoclimatol. Palaeoecol. 2006, 234. [Google Scholar] [CrossRef]
  104. Haylock, M.R.; Peterson, T.C.; Alves, L.M.; Ambrizzi, T.; Anunciação, Y.M.T.; Baez, J.; Barros, V.R.; Berlato, M.A.; Bidegain, M.; Coronel, G.; et al. Trends in total and extreme South American rainfall in 1960-2000 and links with sea surface temperature. J. Clim. 2006, 19. [Google Scholar] [CrossRef]
  105. Vuille, M.; Bradley, R.S.; Werner, M.; Keimig, F. 20th century climate change in the tropical Andes: Observations and model results. Clim. Chang. 2003, 59, 75–99. [Google Scholar] [CrossRef]
  106. Morán-Tejeda, E.; Ceballos, J.L.; Peña, K.; Lorenzo-Lacruz, J.; López-Moreno, J.I. Recent evolution and associated hydrological dynamics of a vanishing tropical Andean glacier: Glaciar de Conejeras, Colombia. Hydrol. Earth Syst. Sci. 2018, 22, 5445–5461. [Google Scholar] [CrossRef] [Green Version]
  107. Vuille, M.; Bradley, R.S.; Keimig, F. Interannual climate variability in the Central Andes and its relation to tropical Pacific and Atlantic forcing. J. Geophys. Res. Atmos. 2000, 105. [Google Scholar] [CrossRef] [Green Version]
  108. Painter, T.H.; Barrett, A.P.; Landry, C.C.; Neff, J.C.; Cassidy, M.P.; Lawrence, C.R.; McBride, K.E.; Farmer, G.L. Impact of disturbed desert soils on duration of mountain snow cover. Geophys. Res. Lett. 2007, 34. [Google Scholar] [CrossRef] [Green Version]
  109. Bergstrom, A.; Gooseff, M.N.; Myers, M.; Doran, P.T.; Cross, J.M. The seasonal evolution of albedo across glaciers and the surrounding landscape of Taylor Valley, Antarctica. Cryosphere 2020, 14, 769–788. [Google Scholar] [CrossRef] [Green Version]
  110. Kutuzov, S.; Shahgedanova, M.; Mikhalenko, V.; Ginot, P.; Lavrentiev, I.; Kemp, S. High-resolution provenance of desert dust deposited on Mt. Elbrus, Caucasus in 2009–2012 using snow pit and firn core records. Cryosphere 2013, 7. [Google Scholar] [CrossRef] [Green Version]
  111. Meinander, O.; Dagsson-Waldhauserova, P.; Arnalds, O. Icelandic volcanic dust can have a significant influence on the cryosphere in Greenland and elsewhere. Polar Res. 2016, 35. [Google Scholar] [CrossRef] [Green Version]
  112. Skiles, S.M.K.; Painter, T.H. Toward Understanding Direct Absorption and Grain Size Feedbacks by Dust Radiative Forcing in Snow With Coupled Snow Physical and Radiative Transfer Modeling. Water Resour. Res. 2019, 55. [Google Scholar] [CrossRef]
  113. Thompson, L.G. A high-resolution millennial record of the south Asian monsoon from Himalayan ice cores. Science 2000, 289. [Google Scholar] [CrossRef] [PubMed] [Green Version]
  114. Conway, H.; Gades, A.; Raymond, C.F. Albedo of dirty snow during conditions of melt. Water Resour. Res. 1996, 32, 1713–1718. [Google Scholar] [CrossRef]
  115. IDEAM Sistema de Información Ambiental para Colombia—SIAC. Available online: http://www.siac.gov.co/incendios (accessed on 7 October 2020).
Figure 1. Location of the Sierra Nevada de Santa Marta (b) in Colombia and South American continent (a). Bounded region encloses the area located above 4000 m.a.s.l. Numbers within the study area represent subdivisions: 1. Northern area, 2. southwest area, and 3. southeast area. (For interpretation of the references to color in this figure legend, the reader is referred to the web version of this article.).
Geosciences 10 00437 g001
Figure 2. Daily mean of snow albedo (a), NDSI (b), snow precipitation (c), and temperature (d) for the studied area in the SNSM from March 2000 to February 2020. Bars indicate first and second quartiles, while the points are extreme values outside of the interquartile range. (For interpretation of the references to color in this figure legend, the reader is referred to the web version of this article.).
Geosciences 10 00437 g002
Figure 3. Panel (a) show the monthly variation of SA and SP. While panel (b) displays the and intra-annual variations of SA mean monthly and SP mean monthly for the period 2000 to 2020 in the SNSM. (For interpretation of the references to color in this figure legend, the reader is referred to the web version of this article.).
Geosciences 10 00437 g003
Figure 4. Monthly variation of SA mean with: (a) the bi-monthly multivariate ENSO index (MEI), (b) BC column mass density, (c) OC column mass density, (d) dust carbon column mass density, and (e) the combination of the three types of LAI particles analyzed (BC + OC + Dust), as column mass density from the MERRA-2 model [92]. (For interpretation of the references to color in this figure legend, the reader is referred to the web version of this article.).
Geosciences 10 00437 g004aGeosciences 10 00437 g004b
Figure 5. Monthly mean snow albedo (light blue line) and its monthly variation (dark blue line) in: (a) whole area, (b) northern area, (c) southwestern area, and (d) southeast area. (For interpretation of the references to color in this figure legend, the reader is referred to the web version of this article.).
Geosciences 10 00437 g005
Figure 6. Degree of soil erosion in the surroundings of the SNSM (2010–2011) [93]. Each degree has been established according to the level of degradation of the A horizon soil layer. The A horizon is known as the top layer of the mineral soil horizons, often referred to as topsoil. This layer is important because it contains dark decomposed organic matter (humus). Then, this figure represents the degree of soil erosion by total loss of the A horizon (very high), loss greater than 75% of the A horizon (high), loss between 25% and 75% of the A horizon (moderate), and loss of less than 25% of the A horizon (low) [96]. (For interpretation of the references to color in this figure legend, the reader is referred to the web version of this article).
Geosciences 10 00437 g006
Figure 7. Backward trajectories (ensemble) simulated by the NOAA HYSPLIT ending at 00:00UTC on 22 September 2013, 4 October 2014, 27 November 2015, and 12 December 2018, respectively, in the area studied in the SNSM. (For interpretation of the references to color in this figure legend, the reader is referred to the web version of this article.).
Geosciences 10 00437 g007
Table 1. Data set used in this research. Reference column indicates the sources of literature used to consider that each product is adequate and corresponds to validations or use in previous research.
ParametersProductVersionResolutionSourceReference
SpatialTemporalSatelliteReanalysis
Snow albedo (SA)MOD10A1, MYD10A1V60.5 kmDailyTerra and Aqua [71,73,74,75,76,77]
Normalized difference snow index (NDSI)MOD10A1, MYD10A1V60.5 kmDailyTerra and Aqua [71,73,74,75,76,77]
Land Surface Temperature (LST)MOD11A1, MYD11A1V61 kmDailyTerra and Aqua [78,79,80]
Precipitation3IMERGDFV60.1 degDailyGPM [81,82,83]
Black carbon column mass densityM2T1NXAERV5.12.40.5 × 0.625 degMonthlyGPMMERRA-2[84,85,86]
Organic carbon column mass densityM2T1NXAERV5.12.40.5 × 0.625 degMonthlyGPMMERRA-2[84,85,86]
Dust column mass densityM2TMNXAERV5.12.40.5 × 0.625 degMonthlyGPMMERRA-2[84,85,86]
ENSO indexMEIV2-Bi-monthly JRA-55 global[87,88,89,90]
Table 2. Empirical results of the Pearson correlation coefficient (r) between snow albedo and the variables analyzed. Where *, ** and *** denote significant correlations at p < 0.05, p < 0.01, and p < 0.001, respectively.
AreaPeriodNDSILSTSPENSO (+)ENSO (−)BCOCDustBc + Oc + Dust
Whole areaJF0.069−0.0080.419 ***0.0050.1020.1950.1540.0670.112
MA0.009−0.392 **0.760 ***0.0480.0090.0590.0240.0190.027
MJ0.1320.1650.536 ***0.1050.0990.393 **0.330 **−0.309 *−0.284 *
JA0.2540.0420.382 **−0.2380.1030.294 *0.2340.0020.019
SO0.508 ***−0.0990.519 ***−0.300 *−0.0490.038−0.03−0.363 **−0.348 **
ND0.472 ***−0.293 *0.701 ***−0.377 **0.0030.2590.17−0.367 **−0.233
Northern areaJF0.242−0.1460.360 **−0.132−0.0030.160.118−0.0170.039
MA0.176−0.550 ***0.734 ***0.045−0.091−0.083−0.126−0.019−0.063
MJ0.2040.2030.564 ***0.0870.0170.360 **0.290 *−0.276−0.254
JA0.062−0.0460.396 **−0.279 *0.0910.269 *0.2040.0230.038
SO0.407 ***0.0000.482 ***−0.368 **−0.080.1660.087−0.272 *−0.244
ND0.576 ***−0.398 **0.754 ***−0.408 ***−0.030.1690.093−0.407 ***−0.292 *
Southwestern areaJF0.288 *−0.2220.430 ***−0.189−0.0260.1240.0760.0250.05
MA0.143−0.468 ***0.762 ***−0.065−0.086−0.047−0.089−0.009−0.04
MJ0.0160.1530.641 ***0.060.0250.462 ***0.384 **−0.374 **−0.345 **
JA0.145−0.050.369 **−0.2390.0910.270 *0.214−0.046−0.032
SO0.529 ***−0.0510.435 ***−0.359 **0.0160.0740.008−0.249−0.235
ND0.492 ***−0.362 **0.763 ***−0.424 ***−0.020.2250.153−0.412 ***−0.275 *
Southeast areaJF0.243−0.090.343 **−0.0920.0660.300 *0.2590.1470.21
MA−0.021−0.334 **0.630 ***−0.059−0.0260.0720.028−0.081−0.065
MJ0.1990.1510.601 ***0.101−0.010.318 **0.259−0.487 ***−0.467 ***
JA0.125−0.0080.416 ***−0.265 *0.0020.2460.187−0.0040.009
SO0.334 **−0.0370.397 **−0.195−0.0860.1310.041−0.343 **−0.318 **
ND0.449 ***−0.353 **0.768 ***−0.280 *−0.0710.1970.13−0.432 ***−0.300 *
Publisher’s Note: MDPI stays neutral with regard to jurisdictional claims in published maps and institutional affiliations.

