Article

Ground Response and Historical Buildings in Avellino (Campania, Southern Italy): Clues from a Retrospective View Concerning the 1980 Irpinia-Basilicata Earthquake

by
Lucia Nardone
1,*,
Fabrizio Terenzio Gizzi
2 and
Rosalba Maresca
3
1
National Institute of Geophysics and Volcanology, Osservatorio Vesuviano, 80124 Naples, Italy
2
Institute of Heritage Science, (Italian) National Research Council (ISPC-CNR), 85100 Potenza, Italy
3
Department of Sciences and Technologies, University of Sannio, 82100 Benevento, Italy
*
Author to whom correspondence should be addressed.
Geosciences 2020, 10(12), 503; https://doi.org/10.3390/geosciences10120503
Submission received: 30 October 2020 / Revised: 11 December 2020 / Accepted: 14 December 2020 / Published: 18 December 2020

Abstract

:
Cultural heritage represents our legacy with the past and our identity. However, to assure heritage can be passed on to future generations, it is required to put into the field knowledge as well as preventive and safeguard actions, especially for heritage located in seismic hazard-prone areas. With this in mind, the article deals with the analysis of ground response in the Avellino town (Campania, Southern Italy) and its correlation with the effects caused by the 23rd November 1980 Irpinia earthquake on the historical buildings. The aim is to get some clues about the earthquake damage cause-effect relationship. To estimate the ground motion response for Avellino, where strong-motion recordings are not available, we made use of the seismic hazard disaggregation. Then, we made extensive use of borehole data to build the lithological model so being able to assess the seismic ground response. Overall, results indicate that the complex subsoil layers influence the ground motion, particularly in the lowest period (0.1–0.5 s). The comparison with the observed damage of the selected historical buildings and the maximum acceleration expected indicates that the damage distribution cannot be explained by the surface geology effects alone.

1. Introduction

Avellino is a town of historical interest, which is located in a structural depression of the Campanian Apennines, in the Irpinia region (Southern Italy) (Figure 1). This is an area with a high seismic hazard where the peak ground acceleration (PGA) with a 10% probability of being exceeded in 50 years has been estimated in the range 0.20–0.27 g (http://esse1.mi.ingv.it/d2.html). The hazard reflects the seismic history of the locality, which was affected by several strong earthquakes [1] (Figure 2). The 23rd November 1980 Irpinia-Basilicata earthquake (Me = 6.7; Mw = 6.9 [2]) was the last significant event that strongly hit Avellino (Is = VIII of the Mercalli-Cancani-Sieberg Macroseismic Scale, (MCS) [3]). The earthquake, which caused about 3000 casualties, hit a wide area of the Campania and Basilicata regions that recorded serious damage, especially the provinces of Avellino, Potenza, and Salerno.
The town of Avellino was founded in Roman times (Abellinum), in the same site where Atripalda town is located today. In the Middle Ages, Avellino developed around the Cathedral, built in the XII century, later restored and transformed several times due to earthquake consequences. Near the end of century XVIII, the new districts extended mainly towards the west. Numerous religious and civil architectures remain in Avellino downtown at present, testifying with their restoration history and scars the seismic hazard of the territory as well as the vulnerability of the heritage.
To get some clues about the cause-effect relationship, in this work we investigated the ground response and the damage levels in some historical buildings of Avellino, taking advantage of a detailed knowledge of the surface geology of the Avellino urban area. Previous works highlighted resonance effects in a wide period range (0.08–0.62 s) due to the complexity of the surface geology [4], and also soil/building resonance effects [5].
Starting from the geological model based on previous investigations, we performed a 2D ground response analysis for the sites where the heritage lies, using an equivalent linear finite element approach. However, considering that strong-motion recordings in Avellino are not available, the definition of the seismic input in the assessment of the ground response was performed making use of a probabilistic approach, using the seismic hazard disaggregation. This method is aimed at defining seismic events by classes of magnitude and distance from the site, which provides the largest contribution to ground motion exceedance for defined hazard levels. Finally, we correlated retrospectively the estimated seismic response to the damage produced by the 1980 earthquake for the historical buildings.

2. Previous Studies

Earthquake damage distribution depends on multiple aspects: energy of the earthquake and its focal mechanism, attenuation in the crust, site effects, and vulnerability of buildings. At the municipality scale, the impact of an earthquake on the territory is essentially due to local geological effects and the vulnerability of buildings. This aspect relates to the seismic risk, which is of a higher level for historic cities with architectural and religious heritage as several studies performed also on more recent earthquakes highlighted [6,7,8,9,10,11]. The main problem associated with the use of macroseismic data lies in the difficulty of separating the different contributions. To overcome this difficulty an integrated approach, which combines macroseismic, geological, and geophysical data, is advantageous, mostly for seismic hazard assessment. The vulnerability, which is involved in seismic risk by affecting the damage distribution in the urban environment, concerns the condition of the buildings before the earthquake, which may not be easy to come by. An example of the multi-disciplinary approach is offered by [11] who studied the effects caused by the 1930 Irpinia earthquake and other two historical ones in a small historical town of the Basilicata region. These authors correlated the uneven damage to the soil conditions, combining geological and geophysical surveys with the analysis of archive sources and vulnerability data. Guidoboni et al. [12] depicted the damage scenario for the city of Palermo (Sicily, Southern Italy) for three damaging historical earthquakes. They correlated the damage distribution as inferred by historical sources with the near-surface geology, operating with a geological database in the GIS framework. They found some correlation between damage level and sediment thickness.
Many authors have correlated macroseismic data with Horizontal to Vertical Spectral Ratio (HVSR) seismic noise measurements. This has been seen as an effective tool for verifying the contribution of the local geology on earthquake damage. Noise HVSR measurements provide the resonant frequencies that are a function of the surface geology [13,14,15]. Free-field noise HVSR measurements are very useful in the absence of earthquake recordings, but they do not allow correlating the amount of damage with seismic site amplification. Maresca et al. [5] found that the measured noise HVSR amplifications were not effective in correlating with the damage produced by the 1980 Irpinia earthquake in Avellino. Additionally, they found that amplitude peaks were mostly associated with high-velocity contrast zones. To study the effects of earthquakes in the urban environment some authors carried out noise measurements in buildings coupled with noise free-field measurements (review paper by [5,16,17,18]). Soil/building resonance effects produce amplification of ground motion, resulting in more damage in case of strong earthquakes.
In regions of moderate seismicity, it is important to be able to anticipate the effects of a large event by simulating the ground motion it may generate [19]. Several studies make use of geological and geophysical prospecting data for modeling of the local seismic response, even for microzoning planning [20,21,22,23]. Nunziata and Costanzo [24] computed the ground motion at the historical center of Napoli for two historical earthquakes, based on a detailed physical model of subsoil. These authors used a hybrid technique based on the mode summation and finite difference methods, fitting synthetics with a recording of a moderate earthquake, for a preventive definition of the expected shaking. If strong motion data are available, the modeled seismic response can be effectively validated by data and then compared to the damage produced [25,26]. Reference [27] correlated earthquake damage to the computed site amplification, focusing the attention on two historic centers of the Abruzzi region, which were damaged by the 2016–2017 Central Italy seismic sequence. These authors correlated amplification phenomena, which they evaluated through detailed seismic microzonation studies [28,29], with damage.
Earthquake damage in Italy often concerns villages built on top of a relief. More easily, studies on topographical effects have focused on seismic propagation in a homogeneous medium [30,31]. In more realistic cases the methodological approach for modeling the local seismic response takes into account both the stratigraphic and the topographical effect [32,33,34,35].
One of the aspects connected to the seismic response modeling is that of having one or more reference earthquakes for using as input motion in the computing. However, strong motion recordings may be unavailable. An alternative approach involves Probabilistic Seismic Hazard Analysis (PSHA). The seismic hazard model for Italy (MPS04) was drawn up by the Istituto Nazionale di Geofisica e Vulcanologia (http://esse1.mi.ingv.it) [36,37], and its main use concerns the definition of the design spectra of the Italian Building Code [38,39]. The MPS04 model provides PGA and spectral accelerations computed for 10 periods (from 0.1 to 2 s), for 9 probabilities of exceedance in 50 years (from 2% to 81%, corresponding to return periods from 2475 to 44 years), considering rocky soil conditions and flat topography. It was estimated on a grid of points, located every 0.05 degrees. Through disaggregation of seismic hazard, we gain the magnitudes and distances, which contribute the most to the hazard at a specific site [40,41,42]. The main advantage of this approach is to guarantee the definition of a group of earthquakes scenario; in fact, the selection of a unique design earthquake does not allow taking into account all the features of ground motion expected at that site [43]. In this study, to estimate the ground response in the historical center of Avellino, where strong-motion recordings are not available, we operated seismic hazard disaggregation. So, we drew on the seismic hazard database, and on the strong motion ITACA database [44] produced for the Italian territory in the framework of the agreements between the Italian Department of Civil Protection (Dipartimento della Protezione Civile, DPC) and the Istituto Nazionale di Geofisica e Vulcanologia (INGV).

3. Cultural Heritage and 1980 Earthquake Damage

The current location of Avellino does not correspond to the place where the ancient one stood. The ancient Abellinum was in fact destroyed following the wars between the Byzantines and the Longobard and the consequent Longobard conquest of large continental portions of Italy after they invaded the peninsula (568 AD). The new inhabited center, which was built at a distance of about 4 kilometers from the old one, quickly assumed considerable importance linked to its strategic position in the geopolitical framework of the time.
From an urbanistic point of view, the town rapidly extended around the Cathedral and even today the ancient and limited medieval layout of the town, of the mainly modern matrix, is recognizable in the area between the ruins of the medieval Castle and the Cathedral.
The building of the Cathedral took place starting from 1132 on the remains of the Longobard one. The façade is in neoclassical style and the interior is a Latin cross with three naves. However, the building has undergone many restorations as a result of the damage caused by the manifold earthquakes that hit the site historically. Among these, we remember the Irpinia earthquake of 29th November 1732 (Me = 6.6, Is = IX MCS [1]) as a result of which the Cathedral partially collapsed [1] subsequently restored and reopened for cult in 1736 [45]. Before the earthquake of 1980, the 23 July 1930 Irpinia earthquake (Me = 6.7, Is = VII–VIII MCS [1]) caused significant damage to the building to make it unsafe. With the earthquake of 1980, the Cathedral was made totally unfit for use: the tympanum of the façade and part of the dome collapsed, serious injuries were opened in the walls and a chapel on the left collapsed [1].
Among the other religious buildings that suffered significant damage as a consequence of the 1980 earthquake, we remember the Church of Sant’Antonio Abate, Santa Maria di Costantinopoli and Santa Maria del Rifugio. The Church of Sant’Antonio Abate is located in a district that was severely damaged by the earthquake of 1980. Located in the ancient center of the town, the church was built in the sixteenth century and underwent subsequent and significant alterations. The interior has a single nave, with decorative and stylistic elements of a later age. During the 1980 earthquake, there was very significant damage to all the structures of the church, with partial collapses and cutting lesions on all the walls, especially in the corner walls [46]. The Church of Santa Maria di Costantinopoli was built in the 16th century and has a plan in the shape of a Latin cross. The building was restored several times following various earthquakes such as that of 1688, 1732, and 1930. As a result of the 1980 earthquake there was very significant damage, with the roof collapsing on the right side of the apse area and collapses that had affected the higher parts of the building, the masonry had undergone various injuries both in the longitudinal and transverse walls of the transept, towards the east, while on the west side and in the apse there were considerable lesions due to the rotation to the east of the post wall south. The square-plan bell tower had completely collapsed [46,47]. The Church of Santa Maria del Rifugio was built in the seventeenth century and has a single nave with a triumphal arch. The 1980 earthquake caused serious damage with a crack pattern that caused significant water infiltrations, with damage to the works of art. The Church of Santa Maria del Carmine, which was designed as a private chapel, stood in the historic center until the earthquake of 23 November 1980. It had a single nave plan with two small side chapels, with a valuable altar, the most valuable artistic element of the Church [46,47].
Regarding non-religious buildings, the effects were different. The Balestrieri palace, dating back to the nineteenth century, is developed on four floors and defines, together with other buildings and the Torre dell’Orologio (Clock Tower), the early medieval urban core. Important damage occurred to the palace, while very serious damage occurred to the Clock Tower, with the collapse of the terminal part bearing the clock (see the picture in Figure 1) and internal injuries to the two orders below the collapsed part with widespread detachment of ashlars constituting the covering of the tower and different portions of the masonry in unsafe summits. The palace Festa, dating back to the seventeenth century, is on two floors above the ground floor, is located in the upper part of the historic center of Avellino and the main façade faces the palace Greco founded between the end of the sixteenth and the beginning of the seventeenth century, in the near the Cathedral [46]. Both suffered significant damage.

4. Damage Levels and Classification

To classify the damage suffered by the architectonic heritage after the 1980 earthquake, we made use of the inclusion/exclusion criteria indicated in Table 1. The classification takes advantage of the European Macroseismic Scale (EMS-98, [48]), simplifying and grouping the damage levels that it indicates. The SLD damage level reflects the Grade 1 fixed in the Scale, the other two damage levels were established grouping Grade 2 and Grade 3 (MHD) as well as merging Grade 4 and Grade 5 (VHDC). The first level is the slight damage, where no structural damage occurs; the second, intermediate level of damage, includes structural damage from slight to moderate, the heaviest level is the third in which are included buildings that suffered heavy and very heavy structural damage, including partial and total collapse.
According to these pre-fixed levels, Table 2 reports the synthesis of the damage level for each building.

5. Ground Motion Modelling

5.1. Disaggregation of Seismic Hazard and Input Motion Selection

The study of the seismic response requires accelerometric recordings to design the seismic input motion representative of the seismic hazard at the site. In the study area, strong-motion recordings are lacking. Indeed, the AVL accelerometric station, belonging to the Italian strong motion network (ISMD), operates in Avellino since 2015 (http://terremoti.ingv.it/instruments/station/AVL), but no strong earthquakes occurred in the region since that time. For this reason, we made use of a probabilistic approach, as suggested for microzoning and engineering planning.
Our goal was to select suitable records, which reflect: (i) the seismogenic features of the sources; (ii) the ground motion intensity measures; (iii) and the soil conditions appropriate to the site. We referred to the seismic hazard database of the national territory (http://esse1.mi.ingv.it). This database provides the ground shaking on a hard rock on 16,852 sites (grid nodes) spaced with 0.05 degrees step, for nine return periods (RP). Following the New Italian Building Code (NIBC), [38,39], the ground shaking is expressed in terms of maximum horizontal acceleration (ag), and its spectral parameters (maximum value of the amplification factor of the horizontal acceleration spectrum [F0]; period corresponding to the beginning of the constant velocity section in the horizontal acceleration spectrum [TC]).
Table 3 shows the values of these parameters for the historical center of Avellino, with geographic coordinates 40.915325N and 14.795909E, included between nodes 32,764, 32,765, 32,986, and 32,987 of the grid, for a return period of 475 years.
Through disaggregation of seismic hazards, we separated contributions from different seismogenic sources. The disaggregation process allows us to define the contribution of seismogenic sources located at distance R from the historical center of Avellino, able to generate earthquakes of magnitude M, thus identifying earthquakes that dominate the hazard scenario. Disaggregation results are expressed in the M-R-ε space, where ε expresses the degree of scattering of empirical parameters, and it is equal to the number of (logarithmic) standard deviations by which the (logarithmic) ground motion deviates from the median value predicted by the attenuation equation used in the analysis [49,50]. Based on the disaggregation of the peak horizontal acceleration value (ag) for rock condition with a probability of exceeding 10% in 50 years, we derived the percentage contribution to hazard, as a function of mean magnitude M, mean site-source distance R, and ε (Figure 3), (http://esse1.mi.ingv.it/), [51,52].
The M-R disaggregation grid (Figure 3) highlights that the maximum contribution to seismic hazard in the study area is due to earthquakes with a magnitude between 4.5 and 7.0, located within a 30 km distance. Events with greater magnitude are expected progressively at greater distances, with lower contribution to hazard.
The choice of seismic records must be made in terms of magnitude and distance bins, site classification, and supporting a good match with the target acceleration response spectrum. This last is defined based on the site features (level of seismic hazard, soil, and topographic conditions, buildings design). In this study, we used the tool REXELite [53] to select the set of time histories compatible with the target acceleration response spectrum. This tool generated the target response spectrum, according to Eurocode 8 (EC8; [54]), and to NIBC. It was built taking into account the site (A,B,C,D, or E) and topographic (T1,T2,T3,T4) codifications, based on the building features (Building Nominal Life (vn), Building functional type (cu), and Damage Limit State). To build the target response spectrum, we chose the Damage Limit State SLV (life-saving limit state) for a structure located in the historical center of Avellino, on soil type A, flat topography (T1), with a Nominal Life of 50 years, which corresponds to the design for a 50-year return period according to the code (Figure 4).
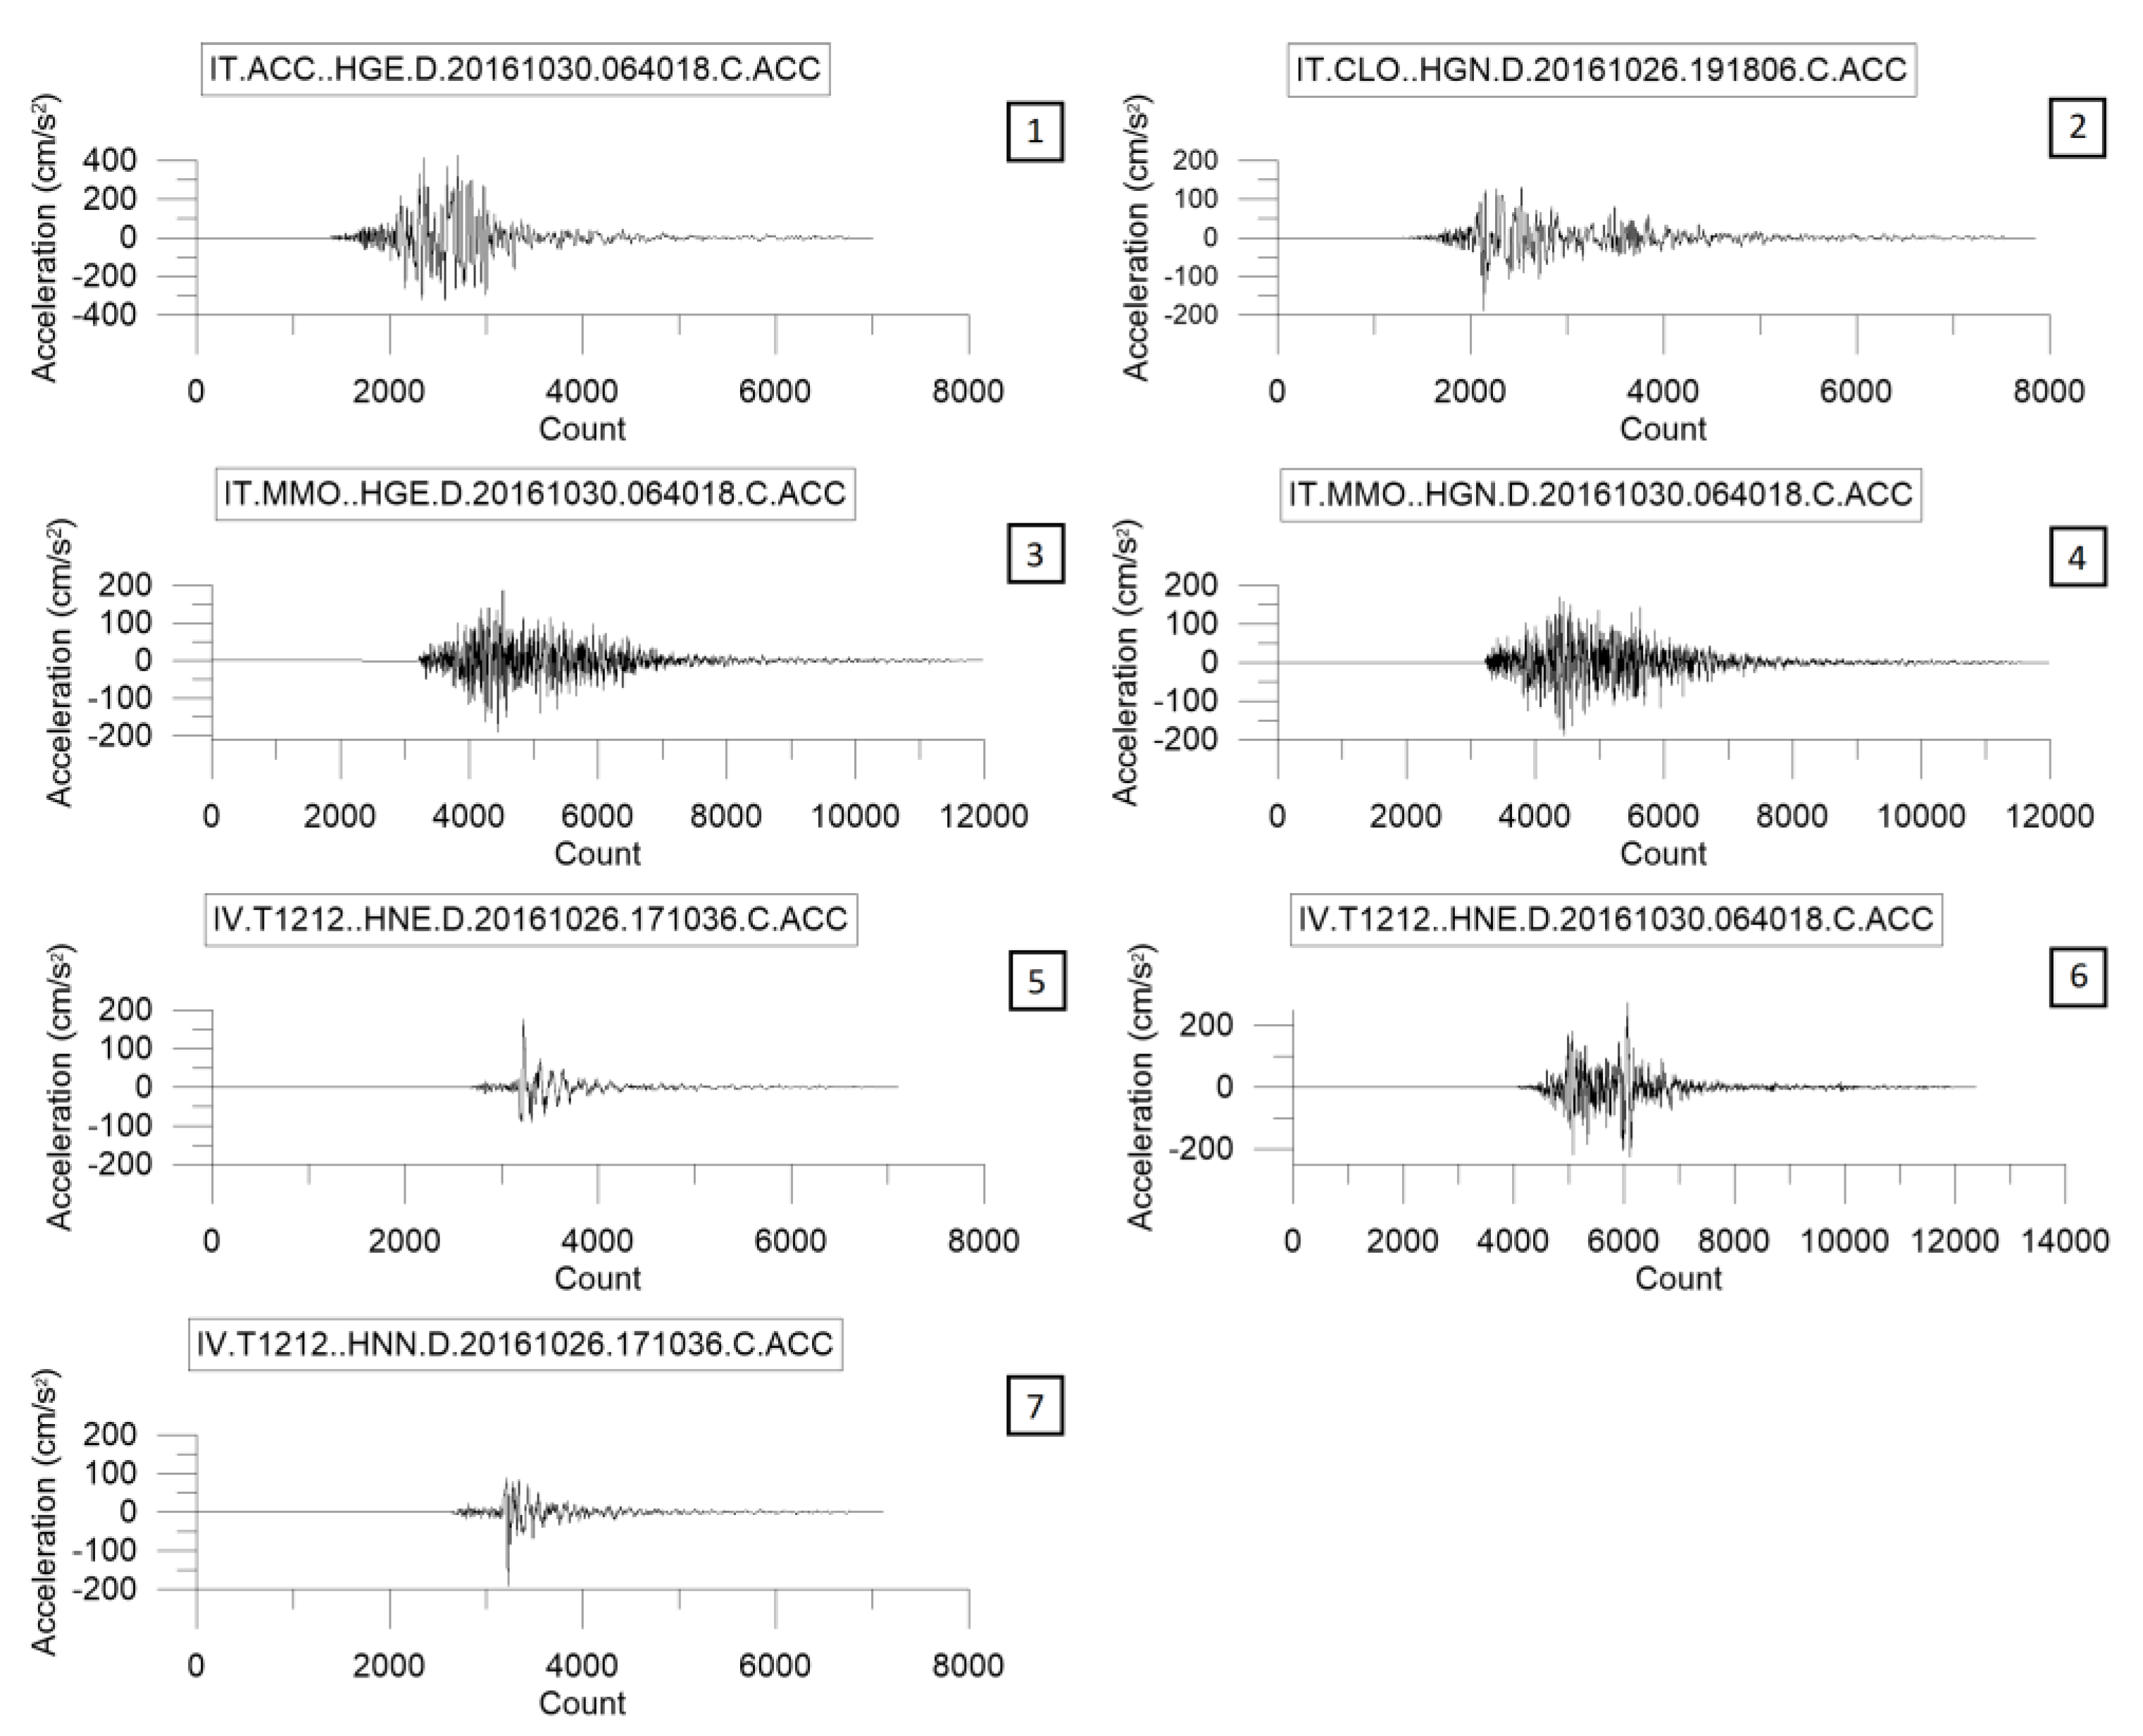
Time-histories were extracted from the Italian Strong-Motion Database (ISMD), [44,55], whose average was compatible with the target spectrum. Records were selected through seismic hazard disaggregation, by expressing the mean annual rate of exceedance as a function of magnitude and source-to-site distance (Figure 3). Moreover, only normal fault type events were selected, consistently with predominant focal mechanisms in the study area, as reported by the Seismogenic Zonation ZS9 [37,56]. Disaggregation has provided a scenario event for the 475-year return period with magnitude M = 5.8 and distance R = 14 km. A set of seven accelerograms that satisfied the selection criteria was identified (Figure 4 and Figure 5), assigning as tolerance for the average spectra 10% lower and 30% upper in the period range 0.1–1.1 s. The list of seismic events related to these recordings is shown in Table 4. All the selected seismograms belong to the 1996 Amatrice-Visso-Norcia seismic sequence. Accelerograms produced by different seismogenic zones that meet the required features were not available in the database.

5.2. Geological Model

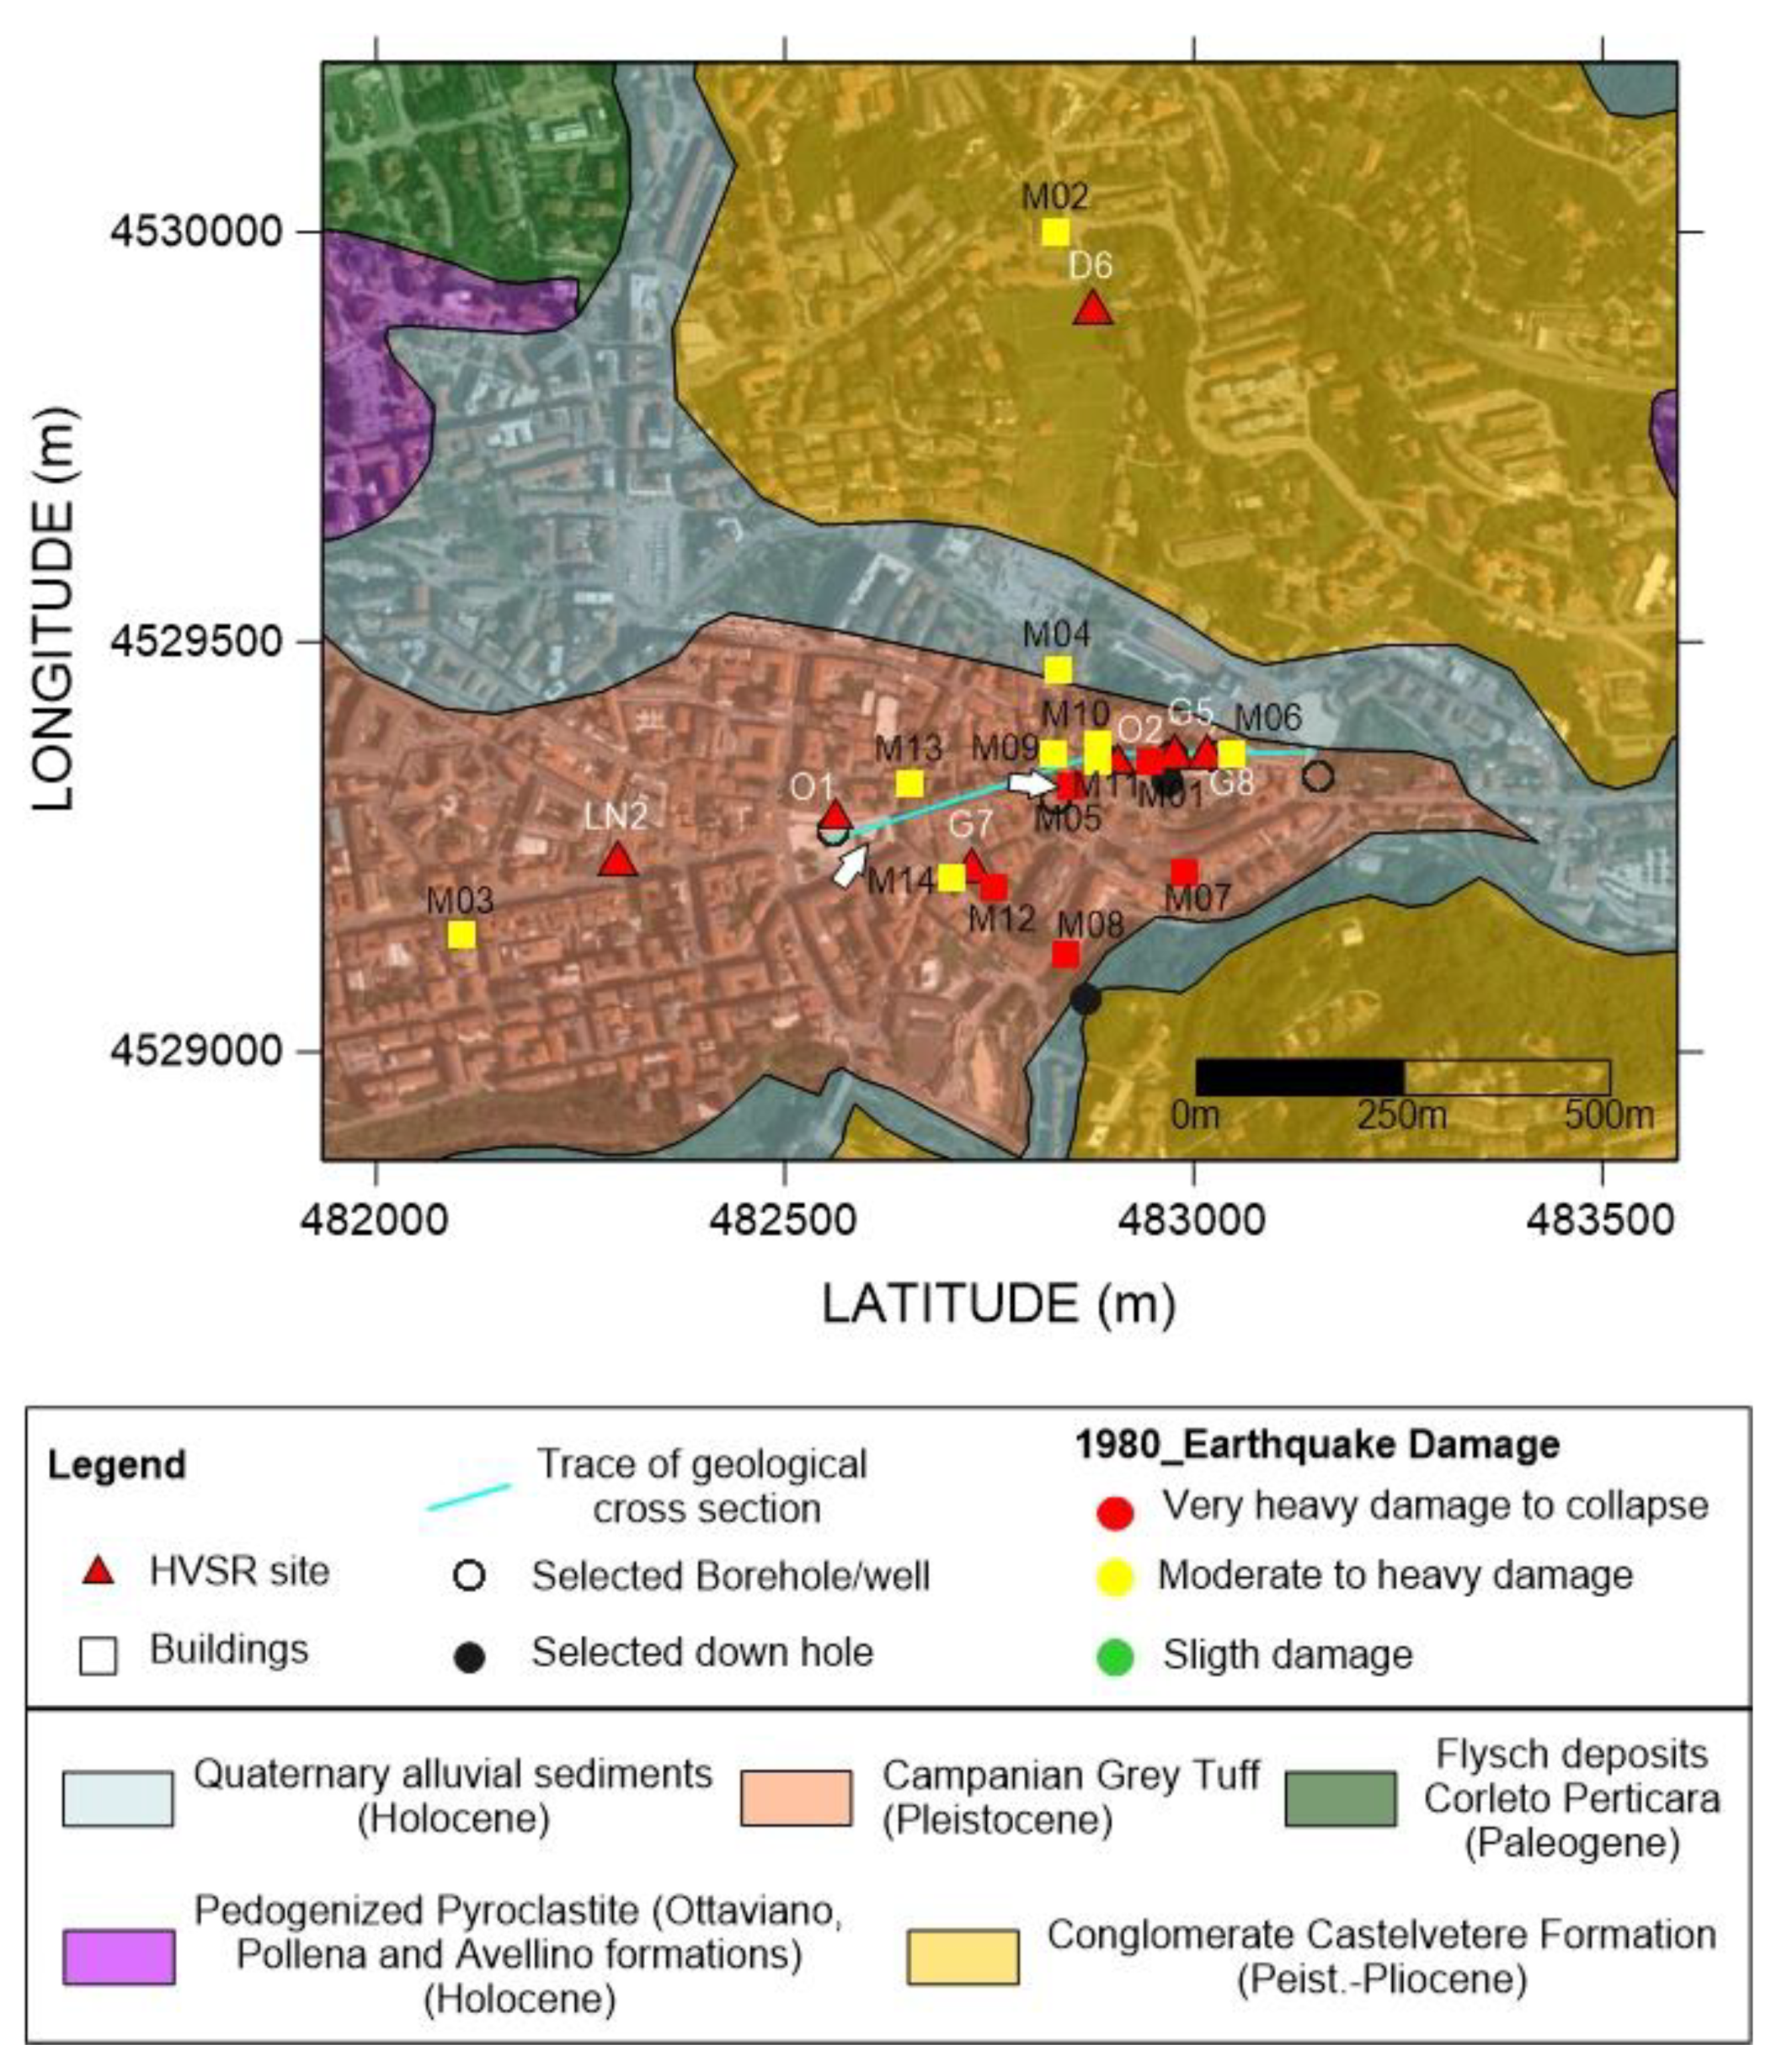
The historical center of Avellino is located on a complex geology raised area (Figure 6 and Figure 7). To have a detailed picture of a complex geomorphological high, we made an accurate selection of the data available for the historical center, especially the drilled boreholes. We used valuable information acquired both from the PUC (Piano Urbanistico Comunale) and from the geotechnical investigation, available on the web, carried out on sites where constructions were done.
We revised the geological cross-section reported in [4], using the stratigraphic wells located in the historical center, thus providing the new lithostratigraphic cross-section (Figure 7). The trace of the section was chosen to highlight the differences in both lithological and morphological settings, following the boreholes and seismic surveys. Moreover, most of the architectonic heritage listed in Table 2 stands along this section.
The lithostratigraphic cross-section intercepts the stratigraphic wells signed as S1_N, 143, 136, 137, 138, 159, and the downhole D11. The seismic bedrock in the study area is represented by the Miocenic clay and sand-gravel (A), which outcrops to the north and east of the studied area. Tuffs belonging to the Campanian Ignimbrite formation (39,000 years) follow in the succession. These tuffs consist of lapideous, weakly cemented, or fractured (Tcf), and incoherent lithofacies (Ta). A layer of silty sand (SsPl in Figure 7 Early Pleistocene) overlaying the clayey Miocene basement, is intercepted in the area between S1_N and 143. Pyroclastic deposits (P) cover all the previous lithological units.
All the wells intercept the top of the seismic bedrock, except S1_N well, which is located in Piazza Libertá, where the depth of the seismic bedrock is higher than 30 m. The lithostratigraphic cross-section points out that the subsoil of the historical center is particularly complex, mostly for the presence of different lithofacies of the same tuff formation, and for the irregular geometries of discontinuity surfaces.

5.3. Ground Response Analysis

We carried out a 2D numerical modeling of the subsoil along the section shown in Figure 7, using the LSR2D software provided by Stacec s.r.l. (http://stacec.it/Prodotto/92/lsr-2d). The algorithm implements the Finite Element Method and performs total stress analyses in the time domain. By applying a standard linear-equivalent approach it computes the horizontal response spectrum at the surface. The analysis domain is subdivided into triangular elements, or cells, which belong to five kinds of lithotypes (as reported in the legend of Figure 7). For each lithotype, the software requires the following parameters:
-
volume weight, shear modulus, damping at low strain, Poisson’s ratio;
-
normalized shear modulus (G/G0) and damping ratio (D) curves versus shear strain (γ);
-
constant α for the calculation of the characteristic value of the shear deformation starting from the maximum value of γ (α) (typically equal to 0.65).
As output, the code provides:
-
maximum accelerations in all nodes of the mesh;
-
maximum tangential stresses and strains in each element;
-
time history of the acceleration in the selected nodes (vertical and horizontal components).
In this way, we got effective modeling of a complex subsoil model. The S-wave velocity models were reconstructed from the DH11 and DH8 downholes as well as from the HVSR inversion procedures reported in [4]. In light of this, we can assign the ranges of velocity for all the lithotypes. The volume weights were averaged using the geotechnical data collected from PUC.
The dynamic soil properties (Table 5), namely the G/G0 and D/D0 curves, were derived from the literature or suggested by recent microzonation measures obtained in other Campanian areas where the same lithotypes are present. In detail, for the volcanic lithotypes (P, Tcf, and Ta) we used the modulus and the damping curves obtained from microzonation studies at Ischia Island. For the lithotype SsPl, which behaves like clay sands, we applied the curves proposed by [57]. Rocky lithotype, characterized by high values of stiffness, was considered as linear elastic lithotype with 5% damping (D).
The seismic input motion (Table 3) is applied simultaneously to all the nodes at the base boundary of the analysis domain and the equation system is solved in the time domain using the constant average acceleration (CAA) method. The results of the 2D numerical simulations were expressed in terms of the Amplification Factor (AF), calculated as the ratio between the integral of the output pseudo-acceleration spectrum and the integral of the corresponding spectrum of the input signal, over three different period intervals (0.1–0.5 s, 0.4–0.8 s, and 0.7–1.1 s)
A F = T 1 T 2 P S A o u t ( T ) d T T 1 T 2 P S A i n ( T ) d T ,
where T1 and T2 are the minimum and maximum period in the interval. Using Equation (1), for all the output points and each period interval, the logarithmic mean of the amplification factor values relating to the seven input accelerograms was calculated, as reported in the following equation:
m ln = 1 7 i = 1 7 ln ( F A i ) F A r i f = e m ln
We inserted 14 control points along the topographic surface (red points in Figure 8), choosing these as the points with the most relevant stratigraphic variations, or corresponding to the position of the buildings. The side boundary nodes were constrained along the Z direction and damped along the X direction (red box in Figure 8), to avoid the presence of reflected waves over the edges.
The output of the program, after 10 iterations, returned the acceleration model shown in Figure 9. The distribution of the acceleration values (along the X direction) shows that the maximum occurs where the stratigraphic variations along the vertical are more significant. The low acceleration and amplification factor values at the edges of the section are the effect of damping conditions imposed at boundaries.
The higher acceleration values obtained in the area between Piazza Libertà and the historical center are due to the presence of loose and incoherent deposits (Loose Tuff (Ta), Pyroclastic deposits (P)) at the top of the sequence. This effect also influences the HVSR curves of O01 and G7 sites (Figure 7), where the higher amplitude has been related to a high impedance contrast [5]. The scheme is different in the historical center, where the Tuff is compact or fractured, with Vs equal to 635 m/s; here the higher acceleration values are probably linked to coupled stratigraphic and topographic effects. This is particularly evident in the area between M06 (Palazzo de Conciliis) and the well 159, where the amplification is related to edge effects.
The highest values of the amplification factor, along the geological cross-section, are in the low period range 0.1–0.5 s (red curve in Figure 9). This means that the ground motion is significantly amplified in the ranges of the period of engineering interest. The HVSR curves of O01 and G7 sites, that highlight amplifications as high as 8 in the range 0.3–0.5 s (Figure 7), experimentally confirm these results.
Along the section, the amplification decreases by almost 60 percent for the intermediate (0.4–0.8 s, the green curve in Figure 9) and high (0.7–1.1 s, the blue curve in Figure 9) periods. The results obtained are substantially compatible with HVSR observations: the HVSR curves show almost flat spectral ratios for periods higher than 1 s, whereas amplification peaks appear in the period range 0.1–0.3 s.

6. Discussion and Conclusions

The historic center of Avellino is characterized by a complex morpho-lithological structure. It is located on a topographic relief, formed by the raising of the Miocene basement, on which the tuffaceous Campanian Ignimbrite formation was emplaced. We chose a west-east trending section for a twofold reason: (i) to highlight the variability of both morphological and geological features, (ii) to correlate the lithological pattern of the subsoil to the sites hosting the most important architectonical heritage of Avellino.
We calculated the 2D ground response in a linear-equivalent regime using realistic and detailed modeling along the representative section. We used a probabilistic approach to define the input motion and used the software REXELite to automatically select real ground acceleration records from the Italian Strong-Motion Database, compatible with a target acceleration response spectrum.
The modeled ground acceleration shows the highest values in the period range of engineering interest (0.1–0.4 s) and is controlled by the seismic impedance contrast in the subsoil within the first tens of meters, as well as by the topography. This result is in agreement with the experimental data, consisting of HVSR ambient noise measurements, previously acquired. At higher periods, the accelerations decrease by almost 60 percent.
The town of Avellino experienced a different level of damage to heritage during the 23 November 1980 earthquake. In the historical center, the damage was from the MHD to the VHDC level (see Table 2). Our study was focused on identifying clues about possible relationships between the ground motion amplification and the damage level observed. In a previous work [5], some of the authors of this article performed noise HVSR measurements in a wider area of the town, both free-field and inside civil buildings. We verified the existence of soil/building resonance effects in the 0.22–0.83 s period band, that have influenced the distribution of the damage produced by this earthquake.
The historical buildings taken into consideration here are variable in typology, shape, and structure, and, at present, we do not have their estimates of the vibration modes in the dynamic regime. By comparing the level of damage suffered by these monuments with the ground response computed in the historical center of Avellino, we suggest that the variability in the damage distribution couldn’t be solely explained with effects due to surface geology. Even topographical effects, particularly evident at the edge of the ignimbritic high (M06 location, in the sections shown in Figure 7 and Figure 9), did not have a decisive impact, as the MHD damage level of Palazzo de Conciiliis demonstrated. Nearby monuments, Balestrieri Palace (M09) and the Clock Tower (M05) have suffered different damage levels. The tower, the tallest of the selected buildings likely to be placed in the highest examined period band (0.4–0.8 s), suffered extensive damage, contrary to what the modeling foresees. The Cathedral (M01) the Greco Palace (M11) and the Festa Place (M10), which are placed where the same local geological features are present, show the different extent of the damage. This diversity could be due to the different dynamic responses of the structures and hence to their degree of vulnerability.
From all the results we can infer that the state of conservation of the buildings has played a key role in the occurrence of damage to the historical heritage in response to the 1980 Irpinia-Basilicata earthquake. It is worth noting that [58] also have already proved that the vulnerability of buildings due to their poor quality and poor maintenance caused the most damage in response to this strong earthquake. To assess whether soil/building resonance effects could have contributed to the damage experienced by the historical buildings, most of them of irregular shape and structure, dynamic regime measures would be required, which are currently not available. Therefore, this research is to be considered a preliminary study that could provide useful clues for the preservation of the artistic and architectural heritage of the town of Avellino. Further analyses will aim to investigate the dynamic behavior of the historical buildings as well as their vulnerability, thus making it possible to unequivocally discern among the different factors that threaten the heritage in the event of an earthquake occurrence.
Finally, the research of factors that correlate damage distribution to surface geology plays a crucial role in the appropriate design of seismic risk mitigation interventions aimed at the conservation of our architectural heritage.

Author Contributions

Conceptualization, R.M.; methodology, L.N. and F.T.G.; software, L.N.; validation, L.N., F.T.G., and R.M.; formal analysis, L.N., F.T.G., and R.M.; investigation, F.T.G.; writing—original draft preparation, R.M.; writing—review and editing, L.N., F.T.G., and R.M. All authors have read and agreed to the published version of the manuscript.

Funding

This research received no external funding.

Acknowledgments

We wish to thanks three anonymous reviewers for their useful comments, which contributed to improving the final version of the manuscript.

Conflicts of Interest

The authors declare no conflict of interest.

References

  1. Guidoboni, E.; Ferrari, G.; Mariotti, D.; Comastri, A.; Tarabusi, G.; Sgattoni, G.; Valensise, G. CFTI5Med, Catalogo dei Forti Terremoti in Italia (461 a.C.-1997) e Nell’area Mediterranea (760 a.C.-1500); Istituto Nazionale di Geofisica e Vulcanologia (INGV): Rome, Italy, 2018. [Google Scholar] [CrossRef]
  2. Bernard, P.; Zollo, A. The Irpinia (Italy) 1980 Earthquake: Detailed Analysis of a Complex Normal Faulting. J. Geophys. Res. 1989, 94, 1631–1647. [Google Scholar] [CrossRef]
  3. Postpischl, D.; Branno, A.; Esposito, E.; Ferrari, G.; Marturano, A.; Porfido, S.; Rinaldis, V.; Stucchi, M. The Irpinia earthquake of November 23, 1980. In Atlas of Isoseismal Maps of Italian Earthquakes, CNR-PFG; CNR: Irpinia, Italy, 1985; pp. 152–157. [Google Scholar]
  4. Maresca, R.; Nardone, L.; Pasquale, G.; Pinto, F.; Bianco, F. Effects of surface geology on seismic ground motion deduced from ambient-noise measurements in the town of Avellino, Irpinia region (Italy). Pure Appl. Geophys. 2012, 169, 1173–1188. [Google Scholar] [CrossRef] [Green Version]
  5. Maresca, R.; Nardone, L.; Gizzi, F.T.; Potenza, M.R. Ambient noise HVSR measurements in the Avellino historical centre and surrounding area (southern Italy). Correlation with surface geology and damage caused by the 1980 Irpinia-Basilicata earthquake. Measurement 2018, 130, 211–222. [Google Scholar] [CrossRef]
  6. Gaudiosi, G.; Alessio, G.; Nappi, R.; Noviello, V.; Spiga, E.; Porfido, S. Evaluation of Damages to the Architectural Heritage of Naples as a Result of the Strongest Earthquakes of the Southern Apennines. Appl. Sci. 2020, 10, 6880. [Google Scholar] [CrossRef]
  7. Lagomarsino, S.; Podestà, S. Damage and vulnerability assessment of churches after the Molise earthquake (2002). Earthq. Spectr. 2004, 20, S271–S283. [Google Scholar] [CrossRef]
  8. Lagomarsino, S. Damage assessment of churches after L’Aquila earthquake (2009). Bull. Earthq. Eng. 2012, 10, 73–92. [Google Scholar] [CrossRef]
  9. Sorrentino, L.; Liberatore, L.; Decanini, L.D. The performance of churches in the 2012 Emilia earthquakes. Bull. Earthq. Eng. 2014, 12, 2299–2331. [Google Scholar] [CrossRef]
  10. Hofer, L.; Zampieri, P.; Zanini, M.A.; Faleschini, F.; Pellegrino, C. Seismic damage survey and empirical fragility curves for churches after the August 24, 2016 Central Italy earthquake. Soil Dyn. Earthq. Eng. 2018, 111, 98–109. [Google Scholar]
  11. Gallipoli, M.R.; Gizzi, F.T.; Rizzo, E.; Masini, N.; Potenza, M.R.; Albarello, D.; Lapenna, V. Site features responsible for uneven seismic effects in historical centre of Melfi (Basilicata, Southern Italy). Disaster Adv. 2012, 5, 125–137. [Google Scholar]
  12. Guidoboni, E.; Mariotti, D.; Giammarinaro, M.S.; Rovelli, A. Identification of amplified damage zones in Palermo, Sicily (Italy), during the earthquakes of the last three centuries. Bull. Seismol. Soc. Am. 2003, 93, 1649–1669. [Google Scholar] [CrossRef]
  13. Gosar, A. Microtremor HVSR study for assessing site effects in the Bovec basin (NW Slovenia) related to 1998 Mw5. 6 and 2004 Mw5. 2 earthquakes. Eng. Geol. 2007, 91, 178–193. [Google Scholar] [CrossRef]
  14. Del Monaco, F.; Tallini, M.; De Rose, C.; Durante, F. HVNSR survey in historical downtown L’Aquila (central Italy): Site resonance properties vs. subsoil model. Eng. Geol. 2013, 158, 34–47. [Google Scholar] [CrossRef]
  15. Leyton, F.; Ruiz, S.; Sepúlveda, S.A.; Contreras, J.P.; Rebolledo, S.; Astroza, M. Microtremors’ HVSR and its correlation with surface geology and damage observed after the 2010 Maule earthquake (Mw 8.8) at Talca and Curicó, Central Chile. Eng. Geol. 2013, 161, 26–33. [Google Scholar] [CrossRef]
  16. Mucciarelli, M. Ambient noise measurements on soil and buildings. Bull. Earthq. Eng. 2010, 8, 481–482. [Google Scholar] [CrossRef]
  17. Castellaro, S.; Padrón, L.A.; & Mulargia, F. The different response of apparently identical structures: A far-field lesson from the Mirandola 20th May 2012 earthquake. Bull. Earthq. Eng. 2014, 12, 2481–2493. [Google Scholar] [CrossRef]
  18. Moisidi, M. Site-building resonance response in a complex geological setting: Ground motions recorded in the centre of Paleohora Basin and at a rock fractured outcrop site close to the basin edge (SW Crete, Greece). Phys. Chem. Earth Parts A/B/C 2017, 98, 73–89. [Google Scholar] [CrossRef]
  19. Honoré, L.; Courboulex, F.; Souriau, A. Ground motion simulations of a major historical earthquake (1660) in the French Pyrenees using recent moderate size earthquakes. Geophys. J. Int. 2011, 187, 1001–1018. [Google Scholar] [CrossRef] [Green Version]
  20. Albarello, D.; Cesi, C.; Eulilli, V.; Guerrini, F.; Lunedei, E.; Paolucci, E.; Pileggi, D.; Puzzilli, L.M. The contribution of the ambient vibration prospecting in seismic microzoning: An example from the area damaged by the April 6, 2009 L’Aquila (Italy) earthquake. Boll. Geof. Teor. Appl. 2011, 52, 513–538. [Google Scholar]
  21. Khanbabazadeh, H.; Hasal, M.E.; Iyisan, R. 2D seismic response of the Duzce Basin, Turkey. Soil Dyn. Earthq. Eng. 2019, 125, 105754. [Google Scholar] [CrossRef]
  22. Mouzakiotis, E.; Karastathis, V.; Voulgaris, N.; Papadimitriou, P. Site Amplification Assessment in the East Corinth Gulf Using 3D Finite-Difference Modeling and Local Geophysical Data. Pure Appl. Geophys. 2020, 1–19. [Google Scholar] [CrossRef]
  23. Senatore, M.R.; Boscaino, M.; Pinto, F. The Quaternary geology of the Benevento urban area (Southern Italy) for seismic microzonation purposes. Ital. J. Geosci. 2019, 138, 66–87. [Google Scholar] [CrossRef]
  24. Nunziata, C.; Costanzo, M.R. Ground Shaking Scenario at the Historical Center of Napoli (Southern Italy) for the 1456 and 1688 Earthquakes. Pure Appl. Geophys 2020, 1–16. [Google Scholar] [CrossRef]
  25. Macerola, L.; Tallini, M.; Di Giulio, G.; Nocentini, M.; Milana, G. The 1-D and 2-D Seismic Modeling of Deep Quaternary Basin (Downtown L’Aquila, Central Italy). Earthq. Spectra 2019, 35, 1689–1710. [Google Scholar] [CrossRef]
  26. Giallini, S.; Pizzi, A.; Pagliaroli, A.; Moscatelli, M.; Vignaroli, G.; Sirianni, P.; Mancini, M.; Laurenzano, G. Evaluation of complex site effects through experimental methods and numerical modelling: The case history of Arquata del Tronto, central Italy. Eng. Geol. 2020, 2020, 105646. [Google Scholar] [CrossRef]
  27. Brando, G.; Pagliaroli, A.; Cocco, G.; Di Buccio, F. Site effects and damage scenarios: The case study of two historic centers following the 2016 Central Italy earthquake. Eng. Geol. 2020, 2020, 105647. [Google Scholar] [CrossRef]
  28. Pergalani, F.; Pagliaroli, A.; Bourdeau, C.; Compagnoni, M.; Lenti, L.; Lualdi, M.; Madiai, C.; Martino, S.; Razzano, R.; Varone, C.; et al. Seismic microzoning map: Approaches, results and applications after the 2016–2017 Central Italy seismic sequence. Bull. Earthq. Eng. 2019, 18. [Google Scholar] [CrossRef] [Green Version]
  29. Pagliaroli, A.; Gaudiosi, I.; Razzano, R.; Giallini, S.; De Siva, F.; Chiaradonna, A.; Ciancimino, A.; Foti, S. Site response analyses for seismic microzonation: Case-histories, results and applications in Central Italy. In Proceedings of the 7th lnternational Conference on Earthquake Geotechnical Engineering (VII ICEGE), Roma, Italy, 17–20 June 2019. [Google Scholar]
  30. Hudson, J.A.; Boore, D.M. Comments on ‘Scattered Surface Waves from a Surface Obstacle’. Geophys. J. R. Astr. Soc. 1980, 60, 123–127. [Google Scholar] [CrossRef] [Green Version]
  31. Lee, S.J.; Chan, Y.C.; Komatitsch, D.; Huang, B.S.; Tromp, J. Effects of realistic surface topography on seismic ground motion in the Yangminshan region of Taiwan based upon the spectral-element method and LiDAR DTM. Bull. Seismol. Soc. Am. 2009, 99, 681–693. [Google Scholar] [CrossRef]
  32. Geli, L.; Bard, P.Y.; Jullien, B. The effect of topography on earthquake ground motion: A review and new results. Bull. Seismol. Soc. Am. 1988, 78, 42–63. [Google Scholar]
  33. Cavallaro, A.; Ferraro, A.; Grasso, S.; Maugeri, M. Topographic effects on the Monte Po hill in Catania (Italy). Soil Dyn. Earthq. Eng. 2012, 43, 97–113. [Google Scholar] [CrossRef]
  34. Sohrabi-Bidar, A.; Kamalian, M. Effects of three-dimensionality on seismic response of Gaussian-shaped hills for simple incident pulses. Soil Dyn. Earthq. Eng. 2013, 52, 1–12. [Google Scholar] [CrossRef]
  35. Grelle, G.; Gargini, E.; Facciorusso, J.; Maresca, R.; Madiai, C. Seismic site effects in the Red Zone of Amatrice hill detected via the mutual sustainment of experimental and computational approaches. Bull. Earthq. Eng. 2020, 18, 1–30. [Google Scholar]
  36. Meletti, C.; Montaldo, V. Stime Di Pericolosità Sismica Per Diverse Probabilità Di Superamento In 50 Anni: Valori Di Ag. Progetto INGV-DPC S1, Deliverable D2; Istituto Nazionale di Geofisica e Vulcanologia (INGV): Rome, Italy, 2007. (In Italian) [Google Scholar]
  37. Meletti, C.; Galadini, F.; Valensise, G.; Stucchi, M.; Basili, R.; Barba, S.; Vannucci, G.; Boschi, E. A seismic source zone model for the seismic hazard assessment of the Italian territory. Tectonophysics 2008, 450, 85–108. [Google Scholar] [CrossRef]
  38. C.S.LL.PP (Consiglio Superiore del Lavori Pubblici). Norme tecniche per le costruzioni. Gazzetta Ufficiale della Repubblica Italiana, 4 February 2008. (In Italian) [Google Scholar]
  39. C.S.LL.PP (Consiglio Superiore del Lavori Pubblici). Aggiornamento delle Norme tecniche per le costruzioni. Gazzetta Ufficiale della Repubblica Italiana, 20 February 2018. (In Italian) [Google Scholar]
  40. Harmsen, S.; Frankel, A. Geographic deaggregation of seismic hazard in the United States. Bull. Seismol. Soc. Am. 2001, 91, 13–26. [Google Scholar] [CrossRef]
  41. Akinci, A.; Galadini, F.; Pantosti, D.; Petersen, M.; Malagnini, L.; Perkins, D. Effect of time dependence on probabilistic seismic-hazard maps and deaggregation for the Central Apennines, Italy. Bull. Seismol. Soc. Am. 2009, 99, 585–610. [Google Scholar] [CrossRef] [Green Version]
  42. Wang, J.P.; Huang, D.; Cheng, C.T.; Shao, K.S.; Wu, Y.C.; Chang, C.W. Seismic hazard analyses for Taipei city including deaggregation, design spectra, and time history with excel applications. Comput. Geosci. 2013, 52, 146–154. [Google Scholar] [CrossRef]
  43. Jarahi, H. Probabilistic seismic hazard deaggregation for Karaj City (Iran). Am. J. Eng. Appl. Sci. 2016, 9, 520–529. [Google Scholar] [CrossRef] [Green Version]
  44. Pacor, F.; Paolucci, R.; Luzi, L.; Sabetta, F.; Spinelli, A.; Gorini, A.; Nicoletti, M.; Marcucci, S.; Filippi, L.; Dolce, M. Overview of the Italian strong motion database ITACA 1.0. Bull. Earthq. Eng. 2011, 9, 1723–1739. [Google Scholar] [CrossRef] [Green Version]
  45. Gambino, N. Cronistoria dei Restauri Nelle Iscrizioni Commemorative; Gambino, N., Ed.; La Cattedrale di Avellino: Cava dei Tirreni, Italy, 1985; pp. 85–86. (In Italian) [Google Scholar]
  46. Proietti, G. Ministero Per I Beni Culturali E Ambientali—Soprintendenza Generale Agli Interventi Post-Sismici In Campania E Basilicata, Dopo La Polvere. Rilevazione Degli Interventi Di Recupero Post-Sismico Del Patrimonio Archeologico, Architettonico Ed Artistico Delle Regioni Campania E Basilicata Danneggiato Dal Terremoto Del 23 Novembre 1980 e del 14 Febbraio 1981 (Anni 1985–1989); Tomo II, Avellino, Istituto Poligrafico e Zecca dello Stato: Roma, Italy, 1994. (In Italian) [Google Scholar]
  47. Frattani, P. Sisma 1980. Effetti Sul Patrimonio Artistico Della Campania E Basilicata. Campania. Supplemento Del Bollettino d’Arte; Istituto Poligrafico e Zecca dello Stato: Rome, Italy, 1982. (In Italian) [Google Scholar]
  48. Grünthal, G. European Macroseismic Scale 1998 (EMS-98). Cahiers du Centre Européen de Géodynamique et de Séismologie 15; Centre Européen de Géodynamique et de Séismologie: Luxembourg, 1998; p. 99. [Google Scholar]
  49. Bazzurro, P.; Allin Cornell, C. Deaggregation of seismic hazard. Bull. Seismol. Soc. Am. 1999, 89, 501–520. [Google Scholar]
  50. Bommer, J.J.; Acevedo, A.B. The use of real earthquake accelerograms as input to dynamic analysis. J. Earthq. Eng. 2004, 8, 43–91. [Google Scholar] [CrossRef]
  51. Spallarossa, D.; Barani, S. Disaggregazione della pericolosità sismica in termini di M-R-ε. Progetto DPC-INGV S1, Deliverable D14. 2007. Available online: http://esse1.mi.ingv.it/d14.html (accessed on 10 September 2020).
  52. Barani, S.; Spallarossa, D.; Bazzurro, P. Disaggregation of Probabilistic Ground-Motion Hazard in Italy. Bull. Seismol. Soc. Am. 2009, 99, 2638–2661. [Google Scholar] [CrossRef]
  53. Iervolino, I.; Galasso, C.; Paolucci, R.; Pacor, F. Engineering ground motion record selection in the ITalian ACcelerometric Archive. Bull. Earthq. Eng. 2011, 9, 1761–1778. [Google Scholar] [CrossRef]
  54. C.E.N. Eurocode 8: Design Provisions for Earthquake Resistance of Structures, Part 1.1: General Rules, Seismic Actions and Rules for Buildings; European Committee for Standardization: Brussels, Belgium, 2003. [Google Scholar]
  55. Luzi, L.; Hailemikael, S.; Bindi, D.; Pacor, F.; Mele, F.; Sabetta, F. ITACA (ITalian ACcelerometric Archive): A web portal for the dissemination of Italian strong-motion data. Seismol. Res. Lett. 2008, 79, 716–722. [Google Scholar] [CrossRef]
  56. Stucchi, M.; Akinci, A.; Faccioli, E.; Gasperini, P.; Malagnini, L.; Meletti, C.; Montaldo, V.; Valensise, G. Redazione della Mappa di Pericolosità Sismica prevista dall’Ordinanza PC del 20 marzo 2003, n. 3274, All. 1 Rapporto Conclusivo; Istituto Nazionale di Geofisica e Vulcanologia (INGV): Rome, Italy, 2004. [Google Scholar]
  57. Seed, H.B.; Sun, J.H. Implication of Site Effects in the Mexico City Earthquake of September 19, 1985 for Earthquake-Resistant Design Criteria in the San Francisco Bay Area of California; Report No. UCB/ EERC-89/03; Earthquake Engineering Research Center: Berkeley, CA, USA, 1989. [Google Scholar]
  58. Candela, M.; Viggiani, C. The effects of the Irpinia earthquake in the ancient centre of Avellino, Italy. In Proceedings of the International Symposium of IAEG, Athens, Greece, 19–23 September 1988; Volume 3: Earthquakes, Vibrations and Other Hazards in Relation to the Study and the Protection of Monuments and Historical Sites Athens, Greece. Marinos, P.G., Koukis, G.C., Eds.; 1988. [Google Scholar]
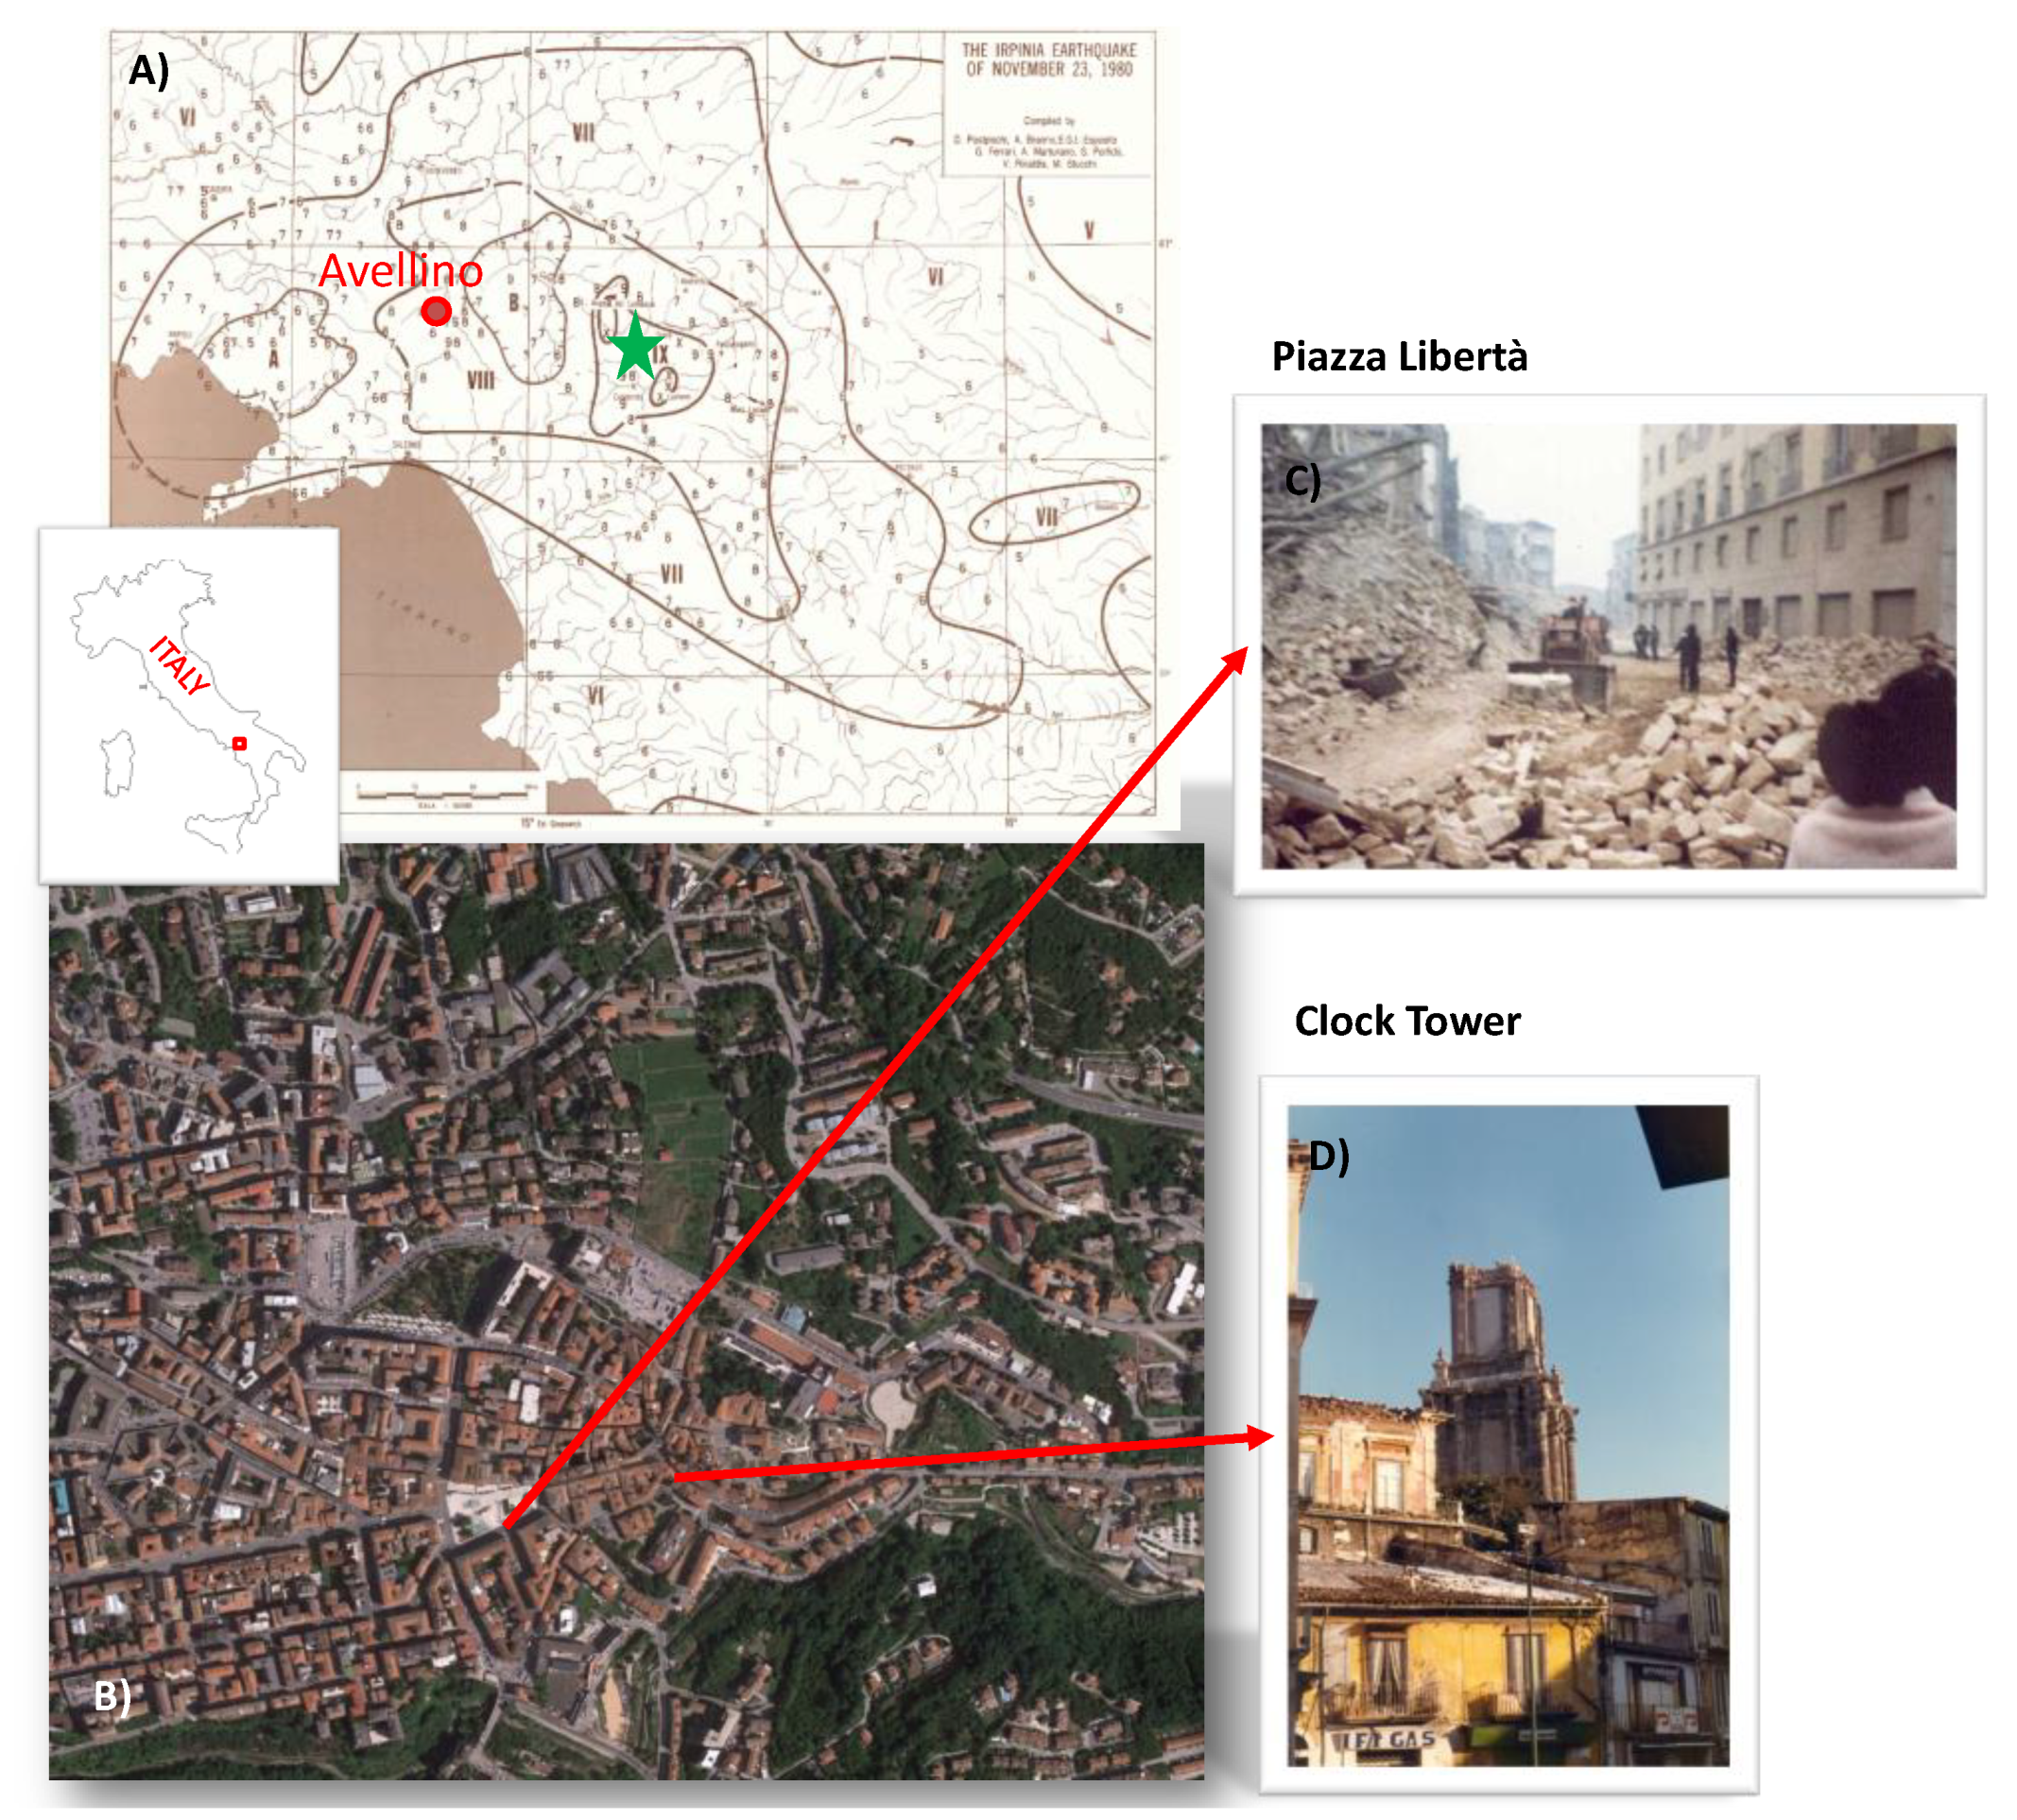
Figure 1. (A) Isoseismal lines of the 23rd November 1980 Irpinia-Basilicata earthquake (modified after [3]). The green star identifies the epicenter of the earthquake. (B) Geographical localization of the historical center of Avellino. Examples of the damage of the earthquake are shown in the two pictures: (C) Piazza Libertà (Data Source: sisma80.it/avellino.html accessed on 30 November 2020) and (D) Torre dell’Orologio (Data Source: www.avellinesi.it, accessed on 30 November2020).
Geosciences 10 00503 g001
Figure 2. Seismic history of Avellino. The locality was hit by about ten earthquakes with site intensity greater than or equal to VII MCS (Data Source: [1], intensities in MCS scale). The dates of the earthquakes with Is ≥ VIII are reported in red (5 December 1456, 5 June 1688, 29 November 1732, 26 July 1805, 23 November 1980).
Geosciences 10 00503 g002
Figure 3. Percentage of contribution to seismic hazard of the 32,765 node which is the nearest to the historical center of Avellino (from http://esse1-gis.mi.ingv.it), as a function of magnitude (M) and distance (R). Mean values: M = 5.8; R = 14.0; ε = 1.13.
Geosciences 10 00503 g003
Figure 4. Horizontal reference spectrum (green line) within upper (30%, red line) and lower (10%, blue line) tolerance limits, and not-scaled acceleration spectra, compatible with the reference response spectrum. The thick grey line is the average of the seven selected acceleration spectra.
Geosciences 10 00503 g004
Figure 5. Not scaled accelerometric time series selected with REXELite tool, as representative of earthquakes scenario for the historical center of Avellino. Numbers in the small boxes indicate the event-numbers listed in the Table 4.
Geosciences 10 00503 g005
Figure 6. Geological map of the historical center of Avellino (modified from [5]). The white arrows indicate the position of the Piazza Libertà and the Torre dell’Orologio (Clock Tower, M05). Coordinates are in UTM (meters).
Geosciences 10 00503 g006
Figure 7. Lithostratigraphic cross-section along the trace indicated in Figure 6. The noise Horizontal to Vertical Spectral Ratio (HVSR) measurement sites with the HVSR curves are also reported. The orange vertical lines indicate the depth of each well.
Geosciences 10 00503 g007
Figure 8. Subsoil model adopted for the 2D ground response analysis. The red box highlights the damped conditions imposed at the lateral boundaries. Mechanical and dynamic lithotypes parameters are reported in Table 5.
Geosciences 10 00503 g008
Figure 9. Top: 2D amplification factors obtained with Equation (1) in three different period ranges. Bottom: contour map of the maximum acceleration (peak ground acceleration—PGA) over imposed to the geological section.
Geosciences 10 00503 g009
Table 1. Damage level classification: outline of the main inclusion/exclusion criteria used for the architectonic heritage of Avellino.
Slight Damage (SLD)Moderate to Heavy Damage (MHD)Very Heavy Damage to Collapse (VHDC)
No structural damage
Slight non-structural damage
Capillary cracks
Slight to moderate structural damage
Cracks with breadth and frequency in walls increasing from moderate to heavy level
Isolate collapse of non-structural elements
Heavy and very heavy structural damage
Partial and total collapse
Table 2. The historical monuments of Avellino damaged by the 1980 earthquake with the main information and the level of damage assessed based on bibliographic sources (SLD, Slight Damage; MHD, Moderate to Heavy Damage; VHDC, Very Heavy Damage to Collapse).
Site CodeLocal NameHeritage TypologyLatitude (N)Longitude (E)Century of First BuildingDamage Level
M01DuomoCathedral40.91529514.797219XIIVHDC
M02Chiesa e Convento di S. Maria delle GrazieChurch and Convent40.92092714.795772XVIMHD
M03Chiesa del S.S. RosarioChurch40.91327914.787485XXMHD
M04Chiesa di S. Francesco SaverioChurch40.91630114.795762XVIIIMHD
M05Torre dell’OrologioClock Tower40.91503414.79597XVIIVHDC
M06Palazzo de ConciliisPalace40.91539214.798211XVIIIMHD
M07Chiesa di S. Maria di CostantinopoliChurch40.91412814.797541XVIVHDC
M08Chiesa di S. Antonio AbateChurch40.91322114.795846XVIVHDC
M09Palazzo BalestrieriPalace40.91534514.795645XIXMHD
M10Palazzo FestaPalace40.91549714.796319XVIIMHD
M11Palazzo GrecoPalace40.91530114.796331XVI–XVIIMHD
M12Chiesa di Santa Maria del CarmineChurch40.91399714.794816XV, no longer existingVHDC
M13Chiesa del Gesù SacramentatoChurch40.91507514.793691XVIIIMHD
M14Chiesa di Santa Maria del RifugioChurch40.91412714.7942XVIIMHD
Table 3. Ground shaking parameters for the historical center of Avellino for a return period of 475 years.
ag [g]F0Tc [s]
0.1972.3710.368
Table 4. List of seismic events, which produced the accelerometric waveforms chosen for this study.
NEpicentral AreaOrigin-Time (mm/dd/yyyy; hh:mm)LatitudeLongitudeDepth (km)MwStation CodeEpicentral Distance (km)
1Norcia (PG)10/30/16 6:4042.832213.11079.26.5ACC.HGE18.6
2Visso (MC)10/26/16 19:1842.908713.12887.55.9CLO.HGN10.8
3Norcia (PG)10/30/16 6:4042.832213.11079.26.5MMO.HGE19.2
4Norcia (PG)10/30/16 6:4042.832213.11079.26.5MMO.HGN19.2
5Castelsantangelo sul Nera (MC)10/26/16 17:1042.874713.12438.15.4T1212.HNE15.2
6Norcia (PG)10/30/16 6:4042.832213.11079.26.5T1212.HNE10.5
7Castelsantangelo sul Nera (MC)10/26/16 17:1042.874713.12438.15.4T1212.HNN15.2
Table 5. Mechanical and dynamic lithotype parameters assigned to each lithological unit used for the computational analysis. The curves marked by an asterisk are from the Level 3 Seismic Microzonation of Casamicciola Terme, Lacco Ameno, and Forio (Ischia Island, Naples) (http://www.commissarioricostruzioneischia.it).
LithotypeS wave Velocity (m/s)Density (kg/m3)Poisson RatioG/G0 and D/D0 Curves
P18015000.4Piroclastic_CMS_Ischia*
Tcf63520000.35Tuff_CMS_Ischia*
Ta47515000.4Tuff_CMS_Ischia*
SsPl30018000.35[57]
A82519000.35Average Rock
Publisher’s Note: MDPI stays neutral with regard to jurisdictional claims in published maps and institutional affiliations.