Abstract
The estimation of soil wet bulk density (ρn) and dry bulk density (ρb) using the novel digital electromechanical system (DES) has provided information about important parameters for the assessment of soil quality and health with a direct application for agronomists. The evaluation of the DES performance is particularly appropriate for different tillage methods, mulching systems, and fertilizers used to increase soil fertility and productivity, but currently, there is a lack of information, particularly in the arid areas in underdeveloped countries. Therefore, the main aim of this study was the application of a novel digital electromechanical system (DES) to evaluate bulk density, wet (ρn) and dry (ρb), under different soil treatments according to the variations in thermal efficiencies (ηth), microwave penetration depths (MDP), and specific energy consumption (Qcon) in an experimental area close to Baghdad (Iraq). The experimental design consisted of 72 plots, each 4 m2. The agronomic practices included two different tillage systems (disc plough followed by a spring disk and mouldboard plough followed by a spring disk) and twelve treatments involving mulching plastic sheeting combined with fertilizers, to determine their effect on the measured soil ρn and ρb and the DES performance in different soils. The results indicated that soil ρn and ρb varied significantly with both the tillage systems and the mulching systems. As expected, the soil ρn and ρb, MDP, and Qcon increased with an increase in the soil depth. Moreover, the tillage, soil mulching, and soil depth value significantly affected ηth and Qcon. A strong relationship was identified between the soil tillage and MDP for different soil treatments, leading to the changes in soil ρb and the soil dielectric constant (ε’).
1. Introduction
Computers and mechatronic techniques (CMT) used in production agriculture bring substantial benefit to both researchers and enterprises operating in developing countries [1,2]. Agro-environmental studies have paid considerable attention to the use of CMT for measuring and controlling soil properties and processes [3,4,5]. There has been increasing interest in research on the application of CMT for soil bulk density measurements because of their direct effects on soil quality and health, which are related to soil functions and ecosystem services such as biodiversity conservation, productivity, and hydraulic conductivity [6], which have direct consequences for agronomical research.
The measurement of bulk density (ρ) in agronomical research is of considerable importance, as it greatly expands soil compaction [7,8]. Soil dry bulk density (ρb) is defined as the ratio between soil dry mass and its total volume, whereas wet bulk density (ρn) is defined as the mass of wet soil divided by its volume [6], which is determined by the following two groups of methods: Direct methods such as core, clod, and excavation sampling [9] and indirect methods such as radiation and regression approaches using pedotransfer functions [10]. However, despite several studies using these methods to measure soil ρb, in a recent review, Al-Shammary et al. [6] noted that soil ρb measurement methods continue to be difficult to use, being time-consuming and leading to mistakes, particularly when the sampling is carried out at different soil depths, as well as different moisture conditions and rock fragment contents. Another major limitation is the difficulty of controlling the quality of soil ρb measurements and the loss or gain of moisture by the samples [11,12].
Recently, an innovative system has been developed to minimize errors during the remote measurement of soil bulk density at different soil depths in cultivated fields, i.e., the digital electromechanical system (DES) [13,14]. The DES for measurements is summarized in Al Shammary et al. (2019) [14]. In brief, it involves several stages as follows: Inserting the DES into the soil to collect the soil samples; weighing and drying the collected soil samples with different drying times; estimating the soil ρb by data processing with an electric control unit; and finally, sending the results to a PC. The main advantages of the DES technology are that it saves time and increases the precision of in situ measurements. Furthermore, it estimates the volumetric moisture content and porosity. However, at the moment, this device has some limitations which need further improved such as the maximum soil depth for analysis is 30 cm and the extreme difficulties of using it in soils with high gravel content or steep slopes.
In arid and semiarid areas of underdeveloped countries, where agricultural productivity is low because of the extreme climate conditions and the lack of financial support, solarization techniques have become indispensable in sustainably improving productivity [15,16]. Solarization techniques are promising methods to improve the physical properties of soil, such as soil temperature, ρb, and moisture content (µ) which are directly related to soil quality and soil health [17,18]. However, human factors such as soil management practices can considerably affect the efficiency of soil solarization technology, such as mulching, tillage, or fertilizers [19,20,21,22,23].
Different tillage practices directly affect soil ρb and µ, depending on the type of equipment used [24,25], tillage time [26], or the direction of the tractor and machinery passes [27,28]. Several advantages of tillage practices are related to the suppression of weeds and the aeration of the soil profile [29]; furthermore, they can increase the generation of rills, soil compaction, and soil and nutrient losses [30,31,32].
Some researchers have confirmed that soil mulching can lead to an increase in the soil organic matter content [33], which improves soil physical quality (soil ρb and µ) because mulching reduces soil compaction through a decrease in soil moisture evaporation [34,35,36] because the humus formation, as well as the resultant water holding capacity, is increased [25,35]. Wu et al. [37] and Wang et al. [38] stated that mulching applications are significantly influenced by an increase in the soil temperature through a thermal transfer between the ambient surroundings and the soil. For example, the soil temperature is considerably influenced by the color and number of layers of mulch [39,40]. Moreover, as other authors have recently demonstrated, the application of catch crops, straw mulches, or plastics reduces the soil erosion rate by several orders of magnitude [41,42].
Finally, the combination of fertilizer with solarization techniques has been confirmed to be beneficial because of its effectiveness by improving soil fertility [43,44]. Although these practices are often discussed today by the supporters of ecological farm management [45,46], the addition of fertilizer leads to an increase in the organic and nutrient contents of the soil, which indirectly and positively influences soil ρb and water holding capacity through more active root growth [43,47]; however, a clear risk of water and soil pollution is present [48].
Thermal efficiency (ηth), microwave penetration depth (MDP), and energy consumption (Qcon) are significant indicators used to describe the electromechanical performance in the soil under different management practices [13]. However, no previous study has described the influence on other soil properties such as ηth, MDP, and Qcon and their direct influence on the soil bulk density changes under different soil treatments such as mulching, tillage, or fertilizers. The soil property, ηth, is defined as the percentage of the energy used for drying soil samples to the incident microwave source energy, which depends on the mass of soil moisture evaporated, product temperature, incident microwave power, time [49], and soil texture [13]. Thus, the estimation of ηth is an important component of the electromechanical performance measurement in agriculture experiments and plays a key role in its Qcon which is defined as the power supplied from the microwave drying unit for the evaporation of soil moisture.
Therefore, the main aim of this research was to evaluate the use of a novel digital electromechanical system DES developed by Al-Shammary et al. [13] in a cultivated field with a representative arid climate in central Iraq, where solarization technology is commonly used to increase food production. We estimated the thermal efficiency (ηth), microwave penetration depth (MDP), and energy consumption (Qcon) for the DES technology under different soil management systems (mulching, tillage, and fertilizers) at different soil depths during the driest season of the year in an experimental plot close to the city of Baghdad.
2. Materials and Methods
2.1. Experimental Area Description
This research took place in an experimental farm at Zafaraniah (south of Baghdad), Iraq (44°27’52.6"E, 33°13’59.8"N, 34 m a.s.l.) from 10 July to 21 August 2018. The experimental site is representative of the intensively farmed soils in south Baghdad which have an average temperature of approximately 34.6 °C in summer and 9.9 °C in winter [50]. Furthermore, annual precipitation is approximately 160 mm [51]. Before the experiments, some soil properties were measured and are presented in Table 1. Soil ρb and µ were measured under controlled conditions (no treatment) at three different soil depths with five replicates [14]. The particle size distribution was prepared according to the hydrometer procedure used by [52]. Soil texture was silty clay (14% sand, 41.6% silt, and 44.4% clay). The loss-on-ignition method was used at 400 °C for 16 h to estimate the soil organic matter (SOM) [52], showing values close to 8.0 g kg−1 at the surface and less than 5 g kg−1 at a soil depth of 20 cm.

Table 1.
Characteristics of the soil of the studied field.
2.2. Procedures and Agronomic Practices Assessed
First, we decided to perform a split-plot design with a systematic plot arrangement for the experiment (Table 2). The DES performance was tested for the following two different tillage systems: (i) disc plough followed by a spring disk and( ii) mouldboard plough followed by a spring disk. Both systems were tested using the same Explorer 85 DT tractor. Each tillage system was divided by 12 treatments using soil mulching and fertilizers, as shown in Table 2. Furthermore, 0.40 kg m−2 of cattle waste as the organic fertilizer and 0.06 kg m−2 of diammonium phosphate (DAP) as a source of phosphorus were applied.
Table 2.
Interactions between experimental factors testing the digital electromechanical system (DES) performance, tillage systems, mulching treatments, and soil depths.
Soil samples were collected and dried at 60 °C to estimate some physical and chemical characteristics such as: organic matter (49.4%), pH (7.07), and EC (5 2.4 dSm−1). In all, each treatment was characterized by three replicates for a total of 72 plots, with an area of 2 × 2 m. Finally, the last factor considered for this study was the soil depth, considering 0 to 10, 10 to 20, and 20 to 30 cm. The field was prepared according to the procedure used in [17,53], wherein the following procedure for the use of soil solarization was outlined (Figure 1): (i) starting the preparation of the experimental area; (ii) selecting the soil management systems that will be used; (iii) designing and dividing the experimental area, and then adding the fertilizers; (iv) irrigating until reaching the water holding capacity; (v) covering the soil; and (vi) removing the mulch to estimate the soil parameters.
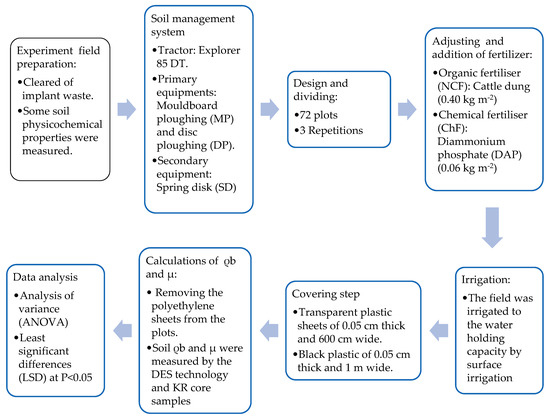
Figure 1.
Experimental workflow chart [17,53].
2.3. Description of the DES, Soil ρb, and µ Measurements
After removing the mulch from the experimental area, we measured the soil ρb and µ in each plot by using the DES technology. The design of the novel DES technology is illustrated in Figure 2A,B and Figure 3.
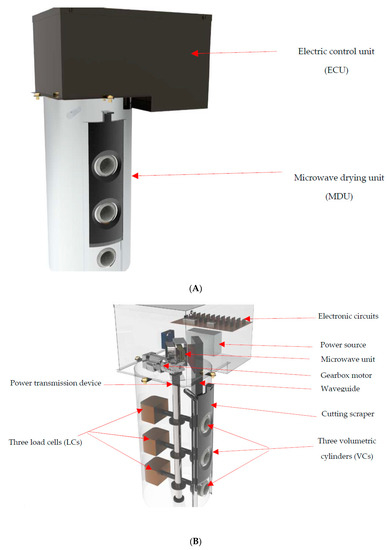
Figure 2.
(A) Two main subunits of the digital electromechanical system (DES); (B) Description of the DES.
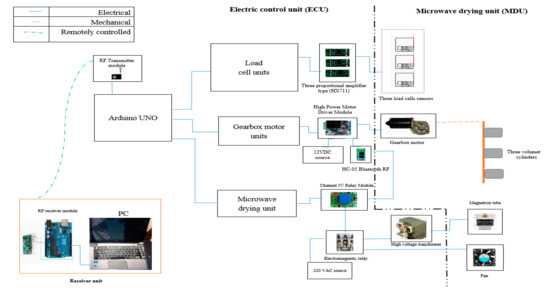
Figure 3.
Block diagram displays the components of the digital electromechanical system (DES).
2.3.1. Electric Control Unit (ECU)
2.3.2. Microwave Drying Unit (MDU)
The microwave drying unit (MDU) consisted of a slotted waveguide, three volumetric cylinders (VCs), three load cells (LCs), a power transmission device, and a cutting scraper, as shown Figure 2B [14].
2.4. Working Mechanism of the DES Technology to Measure Soil ρb and µ
Figure 4 illustrates the working mechanism of the DES. The DES is vertically inserted into the soil via the penetration cylinder which removes a cylindrical tube of the soil. Then, the DES works by collecting the soil samples and weighing them. Soil samples are collected from the different soil layers by three volumetric cylinders controlled by an Arduino UNO board with HC-05 Bluetooth, a motor, and transmission tools [13]. The cutting scraper tries to eliminate the possible excess of soil and plants from outside the VCs in a vertical direction. Then, the soil samples are weighed using the Arduino board, three proportional amplifiers (HX711), three load cell sensors YZC-131, and a 433-MHz RF transmitter/receiver module. The MDU is responsible for drying and weighing the soil samples. All the data are received in a connected PC by a receiver module and the Arduino board. Finally, the NetBeans software (Java) was used to estimate soil ρb and µ.
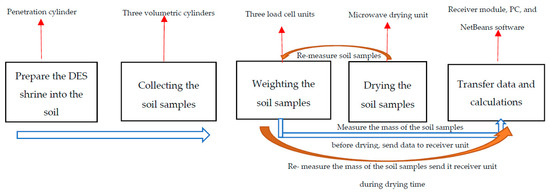
Figure 4.
Schematic diagram of the working mechanism of the DES.
2.5. Mathematical Calculations
Thermal efficiency (ηth), microwave penetration depth (MDP), and energy consumption (Qcon) were calculated using the DES and analyzed in this study. Firstly, ηth was calculated as follows [49]:
cp: Specific heat of water (J.g °C−1)
mw: Mass of soil moisture evaporated (g)
ΔT: Product temperature in (°C)
λw: Latent heat of vaporisation of water (J.g−1)
Pmac: Incident microwave power (W)
φ: Conversion coefficient of the magnetron
t: Microwave time (s)
Then, MDP was estimated as follows [54]:
Dp: Microwave penetration depth (m)
λo: Free space wavelength (m) can be calculated using (λ0 = c/ƒ)
c: Velocity of light (m.s−1)
ƒ: Frequency (GHz)
ε′: Soil dielectric constant (without unit) can be calculated using ε′ = (1 + 0.44 pb)2
pb: Soil bulk density (Mg.m−3) [55]
ε″: Soil loss factor
Finally, Qcon was calculated as follows [13]:
Etotal: Total energy supplied from microwave drying unit (kJ)
µ: Mass of soil moisture evaporated (kg).
2.6. Data Analysis
To assess the results obtained using the DES technology under different treatments, the repeated-measures analysis of variance (ANOVA) was carried out. SAS 9.4v [56] was used to compare the averages of soil ρn, ρb, ηth, MDP, Qcon, and soil ε’ of a total of 72 agronomic practices for the three different soil depths by running a global ANOVA F-test and a Fisher’s least significant difference (LSD) considering a significance level of 0.05.
3. Results and Discussions
3.1. Microwave Penetration Depth (MDP)
The microwave penetration depth (MDP) of soil uses a frequency of 2450 MHz, with different soil treatments for both soil tillage systems, as shown in Table 3. In general, the MDP in a soil sample accounts for the varying performance and efficiency of microwave technologies [57]. The microwave drying unit (MDU) for the DES is more suitable for dry soil samples because of the larger MDP values [58,59]. It was necessary for the electromagnetic radiation to be efficiently transferred through the soil samples to dry them. The samples kept the radiation, and transformed it into thermal energy, possibly due to the effect of the soil ε’ and the electromagnetic field applied. Water absorbs electromagnetic radiation more effectively than soil. Therefore, wetter soil heats the entire soil more effectively and increases the rate of drying [60]. At the same time, the values of thermal energy were noted to be dependent on the agronomic practices and soil depth, which demonstrated a significant impact on the MDP values. The MDP values for all the considered soil treatments ranged from 1.83 to 2.32 m. Again, in the majority of soil treatments, the MDP value increased in the DP + SD system as compared with in the MP + SD system, with the DP + SD system showing 2.04 m and the MP + SD system showing 2.02 m, with the soil ε’ increasing in the DP + SD system because of the increases in the soil ρb (Table 3). We confirmed the effect of the tillage, mulching, and fertilizers at three different soil depths on the soil ε’. The DP + SD system showed the highest average soil ε’ reaching 2.49; meanwhile, the MP + SD system obtained the lowest value of 2.44. This could be attributed to the increased smoothing of soil clods in the case of the DP + SD system as compared to the MP + SD system. This fact resulted in the generation of fewer voids between soil aggregates, increasing the soil ρb, particularly after irrigation [24,61]. This finding is in agreement with [55] that reported that the soil ρb affects the soil ε’ in different tillage systems.
Table 3.
Mean of the microwave penetration depths (MDP) at various soil depths for the different soil treatments.
The soil mulching system significantly affected the MDP value. The highest values were found using the BC, reaching 2.09 m, and the lowest values were found with TDO at 1.98 m. We hypothesized that this is due to the MDP being affected by the soil ρb and µ. This could also be caused by the BC treatments which allowed for a reduction in the evaporation of water and resulted in an increase in the soil ρb [62]. The MDP value was also affected by the soil depth (Table 4). The soil depth of 20 to 30 cm yielded the highest MDP value (2.26 m), and the lowest value of 1.89 m was obtained at a soil depth of 0 to 10 cm. This could be attributed to the increase in soil ρb at a depth of 20 to 30 cm as compared to that at a depth of 10 to 20 and 0 to 10 cm. There was also a significant difference between the interaction factors and the MDP value. The interaction between tillage and mulching systems indicated a significant difference in the MDP value; the MDP value was the highest in the case of the DP + SD system with BC (2.10 m) and the lowest (1.95 m) in the case of the MP + SD system with TSC. A positive correlation was found between the tillage system and the soil depth for the MDP value. The highest MDP value was obtained for the DP + SD system at a soil depth of 20 to 30 cm and the lowest MDP value was obtained for the MP + SD system at a soil depth of 0 to 10 cm. The ANOVA results for the effects of the tillage systems, mulching systems, and soil depths on soil ε’ and MDP are provided in Table 5; we observed that the most significant factor that influenced both soil ε’ and MDP was the soil depth, followed by the interaction between the tillage system and the soil depth.
Table 4.
Mean of soil dielectric constants (ε’) at various soil depths for the different soil treatments.
Table 5.
Descriptive statistics of parameters studied under influences of experimental factors.
3.2. The Thermal Efficiency of the DES (ηth)
The thermal efficiency of the DES (ηth) is a better indicator of the DES for measuring soil ρb, as it largely compensates the energy implicated for increasing the soil moisture content to the incident power by the heat source in the microwave unit [13]. The effects of the tillage system, mulching system, and soil depth on the ηth are presented in Table 6. A clear difference in the ηth was found between the tillage systems by using the DES. The MP + SD system recorded the higher average values of ηth (17.9%). Meanwhile, the DP + SD system recorded the lowest ηth value (15.8%). These results reflected the proportional decrease in the evaporated soil moisture and the drying time in the case of the MP + SD treatment, resulting in an increase in the ηth as compared with the DP + SD system [63]. The ηth value for the DES with different soil treatments (mulch + fertilizer) was statistically significant. The DES results showed that among the soil treatments, the ηth reached higher values in TDO and TSO (20.7 and 20.2%, respectively) than other soil treatments, as soil with BC and WC showed the lowest ηth value (14% and 13.1%, respectively), which could be attributed to the increase in the soil moisture content with TDO and TSO or to the addition of organic fertilizers that allowed the mulch to increase the water holding capacity [47,64], which indirectly affected the evaporated soil moisture.
Table 6.
Mean of the thermal efficiency (ηth) of the DES at various soil depths for the different soil treatments.
Surprisingly, a linear relationship was observed between ηth and the soil depths. The highest ηth value (17.8%) at the soil depth of 0 to 10 cm was recorded, possibly because of the increase in the evaporated soil moisture as compared with the values of 16.9% and 15.8% at the soil depths of 10 to 20 and 20 to 30 cm, respectively. These results disagree with the findings reported in [13], which showed that the ηth value increased with an increase in the soil depth because of the influence of µ under different soil textures; here, the increase in the ηth value was followed by an increase in the soil depth and the moisture content. These findings indicated that a significant positive correlation existed between the interaction factors and the ηth by using the DES. The highest ηth value for the MP + SD system with TSC was 23.6%, and the lowest ηth value was obtained with the interaction of the DP + SD system with TSW at 12.4%. Furthermore, Table 5 shows the ANOVA results and the effect of each experimental factor on the ηth value and the”F” values for ηth. The results showed that the tillage system was one of the main factors impacting ηth because of the effects of soil µ.
3.3. Specific Energy Consumption for DES (Qcon)
The estimation of the Qcon using the DES is a very important indicator for soil bulk density measurements because it allows the assessment and comparison of different energies supplied during the microwave drying process, as well as the amount of soil moisture evaporated [65]. The Qcon dependence on tillage, mulching, and soil depth is shown in Table 7. We observed that the Qcon was significantly affected (P < 0.05) by the tillage, mulching, and soil depth and their interactions. The DP + SD system obtained the highest Qcon value, reaching 23.64 kJ kg−1. Meanwhile, the MP + SD system had the lowest Qcon value with 21.31 kJ kg–1. This fact could be related to the increase in the mass of the evaporated water. The treatment carried out with the DP + SD system obtained the highest evaporation because of increased soil moisture content as compared with the MP + SD system. Therefore, the relationship between the Qcon and tillage system was demonstrated to be dependent on the evaporation of soil moisture. The mulching system (mulch + fertilizer) was significant for Qcon. The maximum average Qcon values were 28.13, 26.42, 26.10, 24.19, 23.90, 22.38, 21.17, and 20.82 kJ kg−1 for the WC, BC, TSW, TDW, BW, WW, TSC, and TDC treatments, respectively, and the minimum averages were 17.51 and 17.91 kJ kg−1 for the TSO and TDO treatments, respectively. This could be attributed to the increased evaporation of soil moisture during the microwave drying process. Therefore, Qcon and the evaporation of soil moisture were inversely proportional. No significant difference was found between the soil depth and Qcon. However, the highest Qcon value was 23.29 kJkg−1 at 20 to 30 cm and the lowest value was 21.69 kJ kg−1 at 0 to 10 cm. At the soil depth of 0 to 10 cm, the highest evaporation occurred as compared with the soil depths of 10 to 20 and 20 to 30 cm, because of the initial dryer soil conditions. Table 7 also shows the significant difference between the interaction factors in Qcon. We observed that the highest value was obtained using DP + SD and TSW 29.54 kJ kg−1, and the lowest Qcon value was obtained using MP + SD and TSC with 15.57 kJ kg-1. A summary of the statistics on the factors influencing Qcon is presented in Table 5.
Table 7.
Mean of the specific energy consumption (Qcon; kJ kg-1) of the DES at different soil depths for the different soil treatments.
3.4. Soil Bulk Density Measurement
The wet (ρn) and dry (ρb) bulk densities for each soil treatment were determined using the DES. Figure 5 shows two groups with different tillage systems (disc ploughing followed by a spring disk (DP + SD) and mouldboard ploughing followed by a spring disk (MP + SD) under different soil treatments. The findings revealed that the tillage systems with different soil treatments had significant differences (P ≤ 0.05) in ρn (Figure 5a), and the highest average ρn value was obtained for the DP + SD tillage system with transparent (single sheet) and chemical fertilizers (TSC) at the soil depth of 20 to 30 cm. In contrast, the lowest average ρn value was obtained in the case of the MP + SD system with BO treatments at the soil depth of 10 to 20 cm, which could be attributed to the increased moisture content, as well as water-holding capacity in the DP + SD tillage system with the TSC soil treatment as compared with the MP + SD system with the BO soil treatment. Additionally, the majority of soil ρn values showed an increase depending on the soil depths. Moreover, the DES results showed a significant difference (p < 0.05) in soil ρb for the different tillage systems with different soil treatments (Figure 5b). In this case, soil ρb was lower in the case of the TSC soil treatment for the soil depth of 0 to 10 cm in the MP + SD tillage system than in the case of any other soil treatment studied. In contrast, the soil ρb was higher using BC for the soil depth of 20 to 30 cm in the DP + SD tillage systems. This could be explained by the less aggressive soil disturbance and crumbling by the MP + SD treatment than that by the DP + SD treatments. The ANOVA results for the influence of each experimental factor on soil ρn and ρb are presented in Table 5. The findings showed that soil ρn varied significantly (p ≤ 0.05) with tillage, mulching, and soil depth. Soil ρb recorded no significant change with the mulching systems. Soil ρn and ρb recorded significant (p ≤ 0.05) effects with the interaction between the experimental factors.
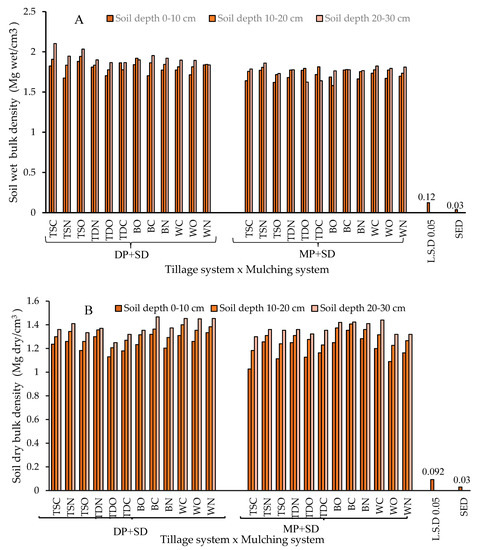
Figure 5.
Interaction between the tillage system and mulching system, with three soil depths in soil wet (A) and dry bulk density (B), using the digital electromechanical system (DES). MP + SD, mouldboard ploughing and spring disk harrowing; DP + SD, disc ploughing (DP) and SD harrowing; TSC, transparent plastic (single sheet) and chemical fertilizer; TSW+, transparent plastic (single sheet) without fertilizer; TSO, transparent plastic (single sheet) and organic fertilizer; TDW, transparent plastic (double sheet) without fertilizer; TDO, transparent plastic (double sheet) and organic fertilizer; TDC, transparent plastic (double sheet) and chemical fertilizer; BO, black plastic and organic fertilizer; BW, black plastic without fertilizer; BC, black plastic and chemical fertilizer; WC, without mulch and chemical fertilizer; WO, without mulch and organic fertilizer; and WW, without mulch and fertilizer.
4. Conclusions and Recommendations
The DES system was tested in a soil solarization technology experiment using different tillage, soil mulching, and fertilizer types at three different soil depths. The effects of treatment on the wet bulk density (ρn) and the dry bulk density (ρb), which were measured using the DES, were explored. Furthermore, the soil dielectric constant (ε’), microwave penetration depth (MDP), thermal efficiency (ηth), and specific energy consumption (Qcon) using the DES were determined. The DES results demonstrated that the tillage, mulching, and soil depth had significant effects on soil ρb and ρn, as well as soil ε’, MDP, ηth, and Qcon. This refers to the applicability of the DES technology to the soil bulk density measurement for soil solarization practices. Furthermore, the use of mouldboard ploughing followed by a spring disk and transparent plastic (single sheet) in solarization practices could help to improve soil properties, increasing the available moisture content and soil aggregation, and decreasing the soil bulk density, evaporated soil moisture, and drying time.
In future research, it would be necessary to investigate the practical challenges associated with the use of the DES for measuring soil bulk density as follow:
- Develop a new design for the DES to measure soil bulk density at depths greater than 30 cm and not compacting the soil too much during the measurement, which would allow its use for geological research or deeper soils;
- Study and measure the systematic error of the bulk density measuring during preparation into the soil using a penetration cylinder and inserting the DES sensor into the soil downwards;
- Determine if it is comparable to a system based on using a microwave for drying the soil (heat from inside) and with a system based on using an oven (heat from outside);
- Design new implementations and solutions to measure soil bulk density while encountering stones or roots during the sampling.
More broadly, research is also needed to determine the economic costs of the DES as compared with traditional measurements of soil bulk density using different agronomic techniques.
The results of this study represent the data of a specific area, which is silty clay, and it is necessary to ascertain the extent to which the results apply to other areas and the use of different soil solarization practices. Nevertheless, the work stresses the need for new approaches in the field of soil survey based on the application of modern surveying and geophysical methods for soil and rocks, and this is undoubtedly the future. However, we should not forget the basic approach to other agronomical applications, which always provides a detailed description of the soils that are sampled for our researches.
Author Contributions
A.A.G.A. designed formal analysis, investigation, and writing—original draft preparation and performed the experiments; A.Z.K. supervision, designed, formal analysis, review and editing; A.K. supervision, writing—review and editing; S.Y.K. supervision, review and editing; M.N. supervision, review and editing; W.P.G. supervision, review and editing; J.R.-C. review and editing; M.A.-M. drawing. All authors have read and agreed to the published version of the manuscript.
Funding
This research received no external funding.
Acknowledgments
We would like to express sincere thanks to the Government and Ministry of Higher Education and Scientific Research, Iraq for providing funding for this study (as a scholarship for PhD student Ahmed Abed Gatea Al-Shammary).
Conflicts of Interest
The authors declare no conflict of interest.
References
- Pfeiffer, S.A.; Guevara, J.; Cheein, F.A.; Sanz, R. Mechatronic terrestrial LiDAR for canopy porosity and crown surface estimation. Comput. Electron. Agric. 2018, 146, 104–113. [Google Scholar] [CrossRef]
- Mahadhir, K.A.; Tan, S.C.; Low, C.Y.; Dumitrescu, R.; Amin, A.T.M.; Jaffar, A. Terrain Classification for Track-driven Agricultural Robots. Procedia Technol. 2014, 15, 775–782. [Google Scholar] [CrossRef]
- Cay, A.; Kocabiyik, H.; May, S. Development of an electro-mechanic control system for seed-metering unit of single seed corn planters Part II: Field performance. Comput. Electron. Agric. 2018, 145, 11–17. [Google Scholar] [CrossRef]
- Umani, K.C.; Fakayode, O.A.; Ituen, E.U.U.; Okokon, F.B. Development and testing of an automated contact plate unit for a cassava grater. Comput. Electron. Agric. 2019, 157, 530–540. [Google Scholar] [CrossRef]
- Alameen, A.A.; Al-Gaadi, K.A.; Tola, E. Development and performance evaluation of a control system for variable rate granular fertilizer application. Comput. Electron. Agric. 2019, 160, 31–39. [Google Scholar] [CrossRef]
- Al-Shammary, A.A.G.; Kouzani, A.Z.; Kaynak, A.; Khoo, S.Y.; Norton, M.; Gates, W. Soil Bulk Density Estimation Methods: A Review. Pedosphere 2018, 28, 581–596. [Google Scholar] [CrossRef]
- Han, Y.; Zhang, J.; Mattson, K.G.; Zhang, W.; Weber, T.A. Sample Sizes to Control Error Estimates in Determining Soil Bulk Density in California Forest Soils. Soil Sci. Soc. Am. J. 2016, 80, 756–764. [Google Scholar] [CrossRef]
- Walter, K.; Don, A.; Tiemeyer, B.; Freibauer, A. Determining Soil Bulk Density for Carbon Stock Calculations: A Systematic Method Comparison. Soil Sci. Soc. Am. J. 2016, 80, 579–591. [Google Scholar] [CrossRef]
- Martín, M.Á.; Reyes, M.; Taguas, F.J. Estimating soil bulk density with information metrics of soil texture. Geoderma 2017, 287, 66–70. [Google Scholar] [CrossRef]
- Shiri, J.; Keshavarzi, A.; Kisi, O.; Karimi, S.; Iturraran-Viveros, U. Modeling soil bulk density through a complete data scanning procedure: Heuristic alternatives. J. Hydrol. 2017, 549, 592–602. [Google Scholar] [CrossRef]
- Nasri, B.; Fouché, O.; Torri, D. Coupling published pedotransfer functions for the estimation of bulk density and saturated hydraulic conductivity in stony soils. Catena 2015, 131, 99–108. [Google Scholar] [CrossRef]
- Xing, X.; Li, Y.; Ma, X.J.E.G. Water retention curve correction using changes in bulk density during data collection. Eng. Geol. 2018, 233, 231–237. [Google Scholar] [CrossRef]
- Al-Shammary, A.A.G.; Kouzani, A.Z.; Saeed, T.R.; Lahmod, N.R.; Mouazen, A.M. Evaluation of a novel electromechanical system for measuring soil bulk density. Biosyst. Eng. 2019, 179, 140–154. [Google Scholar] [CrossRef]
- Al-Shammary, A.A.G.; Kouzani, A.; Saeed, T.R.; Rodrigo-Comino, J. A new digital electromechanical system for measurement of soil bulk density. Comput. Electron. Agric. 2019, 156, 227–242. [Google Scholar] [CrossRef]
- Kanaan, H.; Frenk, S.; Raviv, M.; Medina, S.; Minz, D. Long and short term effects of solarization on soil microbiome and agricultural production. Appl. Soil Ecol. 2018, 124, 54–61. [Google Scholar] [CrossRef]
- Cerdà, A.; González-Pelayo, Ó.; Giménez-Morera, A.; Jordán, A.; Pereira, P.; Novara, A.; Brevik, E.C.; Prosdocimi, M.; Mahmoodabadi, M.; Keesstra, S. Use of barley straw residues to avoid high erosion and runoff rates on persimmon plantations in Eastern Spain under low frequency–high magnitude simulated rainfall events. Soil Res. 2016, 54, 154–165. [Google Scholar] [CrossRef]
- Abu-Irmaileh, B. Soil solarization controls broomrapes (Orobanche spp.) in host vegetable crops in the Jordan Valley. Weed Technol. 1991, 5, 575–581. [Google Scholar] [CrossRef]
- Gamliel, A.; Katan, J. Disinfestation. In Encyclopedia of Soils in the Environment; Hillel, D., Ed.; Elsevier: Oxford, UK, 2005; pp. 394–400. [Google Scholar] [CrossRef]
- Anghinoni, G.; Tormena, C.A.; Lal, R.; Moreira, W.H.; Júnior, E.B.; Ferreira, C.J.B. Within cropping season changes in soil physical properties under no-till in Southern Brazil. Soil Tillage Res. 2017, 166, 108–112. [Google Scholar] [CrossRef]
- Moreira, W.H.; Tormena, C.A.; Karlen, D.L.; da Silva, Á.P.; Keller, T.; Betioli, E. Seasonal changes in soil physical properties under long-term no-tillage. Soil Tillage Res. 2016, 160, 53–64. [Google Scholar] [CrossRef]
- Boluwade, A.; Madramootoo, C.A. Independent principal component analysis for simulation of soil water content and bulk density in a Canadian Watershed. Int. Soil Water Conserv. Res. 2016, 4, 151–158. [Google Scholar] [CrossRef][Green Version]
- Braunack, M.; Johnston, D.; Price, J.; Gauthier, E. Soil temperature and soil water potential under thin oxodegradable plastic film impact on cotton crop establishment and yield. Field Crop. Res. 2015, 184, 91–103. [Google Scholar] [CrossRef]
- Jiang, X.J.; Liu, W.; Wang, E.; Zhou, T.; Xin, P. Residual plastic mulch fragments effects on soil physical properties and water flow behavior in the Minqin Oasis, northwestern China. Soil Tillage Res. 2017, 166, 100–107. [Google Scholar] [CrossRef]
- Jabro, J.D.; Iversen, W.M.; Stevens, W.B.; Evans, R.G.; Mikha, M.M.; Allen, B.L. Physical and hydraulic properties of a sandy loam soil under zero, shallow and deep tillage practices. Soil Tillage Res. 2016, 159, 67–72. [Google Scholar] [CrossRef]
- Al-Shammary, A.A.G.; Al-Sadoon, J.N.A. Influence of tillage depth, soil mulching systems and fertilizers on some thermal properties of silty clay soil. Eur. J. Agric. For. Res. 2014, 2, 1–16. [Google Scholar]
- Regina, K.; Alakukku, L. Greenhouse gas fluxes in varying soils types under conventional and no-tillage practices. Soil Tillage Res. 2010, 109, 144–152. [Google Scholar] [CrossRef]
- Rodrigo-Comino, J.; Silva, A.M.D.; Moradi, E.; Terol, E.; Cerdà, A. Improved Stock Unearthing Method (ISUM) as a tool to determine the value of alternative topographic factors in estimating inter-row soil mobilisation in citrus orchards. Span. J. Soil Sci. 2020, 10. [Google Scholar]
- Ferrero, A.; Usowicz, B.; Lipiec, J.J.S.; Research, T. Effects of tractor traffic on spatial variability of soil strength and water content in grass covered and cultivated sloping vineyard. Soil Tillage Res. 2005, 84, 127–138. [Google Scholar] [CrossRef]
- Burgos Hernández, T.D.; Slater, B.K.; Tirado Corbalá, R.; Shaffer, J.M. Assessment of long-term tillage practices on physical properties of two Ohio soils. Soil Tillage Res. 2019, 186, 270–279. [Google Scholar] [CrossRef]
- Ashraf, M.; Pearson, C.; Westfall, D.; Sharp, R. Effect of conservation tillage on crop yields, soil erosion, and soil properties under furrow irrigation in western Colorado. Am. J. Altern. Agric. 1999, 14, 85–92. [Google Scholar] [CrossRef]
- Barbosa, F.; Bertol, I.; Luciano, R.; Gonzalez, A.J.S.; Research, T. Phosphorus losses in water and sediments in runoff of the water erosion in oat and vetch crops seed in contour and downhill. Soil Tillage Res. 2009, 106, 22–28. [Google Scholar] [CrossRef]
- Rodrigo-Comino, J.; Davis, J.; Keesstra, S.D.; Cerdà, A. Updated measurements in vineyards improves accuracy of soil erosion rates. Agron. J. 2018, 110, 411–417. [Google Scholar] [CrossRef]
- Foltz, R. A comparison of three erosion control mulches on decommissioned forest road corridors in the northern Rocky Mountains, United States. J. Soil Water Conserv. 2012, 67, 536–544. [Google Scholar] [CrossRef]
- Subrahmaniyan, K.; Kalaiselvan, P.; Balasubramanian, T.; Zhou, W. Crop productivity and soil properties as affected by polyethylene film mulch and land configurations in groundnut (Arachis hypogaea L.) (Einfluss von Polyethylenfilm-Mulch und Feldbeschaffenheit auf Ertrag und Bodeneigenschaften im Erdnussanbau [Arachis hypogaea L.]). Arch. Agron. Soil Sci. 2006, 52, 79–103. [Google Scholar]
- Adekiya, A.O.; Agbede, T.M.; Aboyeji, C.M.; Dunsin, O. Response of okra (Abelmoschus esculentus (L.) Moench) and soil properties to different mulch materials in different cropping seasons. Sci. Hortic. 2017, 217, 209–216. [Google Scholar] [CrossRef]
- Dong, Q.; Dang, T.; Guo, S.; Hao, M. Effects of mulching measures on soil moisture and N leaching potential in a spring maize planting system in the southern Loess Plateau. Agric. Water Manag. 2019, 213, 803–808. [Google Scholar] [CrossRef]
- Wu, Y.; Huang, F.; Zhang, C.; Jia, Z. Effects of different mulching patterns on soil moisture, temperature, and maize yield in a semi-arid region of the Loess Plateau, China. Arid Land Res. Manag. 2016, 30, 490–504. [Google Scholar] [CrossRef]
- Wang, X.; Fan, J.; Xing, Y.; Xu, G.; Wang, H.; Deng, J.; Wang, Y.; Zhang, F.; Li, P.; Li, Z. Chapter Three—The Effects of Mulch and Nitrogen Fertilizer on the Soil Environment of Crop Plants. In Advances in Agronomy; Sparks, D.L., Ed.; Elsevier: Amsterdam, The Netherlands, 2019; Volume 153, pp. 121–173. [Google Scholar]
- Öz, H. A new approach to soil solarization: Addition of biochar to the effect of soil temperature and quality and yield parameters of lettuce (Lactuca Sativa, L. Duna). Sci. Hortic. 2018, 228, 153–161. [Google Scholar] [CrossRef]
- Castello, I.; D’Emilio, A.; Raviv, M.; Vitale, A. Soil solarization as a sustainable solution to control tomato Pseudomonads infections in greenhouses. Agron. Sustain. Dev. 2017, 37, 59. [Google Scholar] [CrossRef]
- Cerdà, A.; Rodrigo-Comino, J.; Giménez-Morera, A.; Novara, A.; Pulido, M.; Kapović-Solomun, M.; Keesstra, S.D. Policies can help to apply successful strategies to control soil and water losses. The case of chipped pruned branches (CPB) in Mediterranean citrus plantations. Land Use Policy 2018, 75, 734–745. [Google Scholar]
- Rodrigo-Comino, J.; Giménez-Morera, A.; Panagos, P.; Pourghasemi, H.R.; Pulido, M.; Cerdà, A. The potential of straw mulch as a nature-based solution in olive groves treated with glyphosate. A biophysical and socio-economic assessment. Land Degrad. Dev. 2019. [Google Scholar] [CrossRef]
- Chaudhari, P.R.; Ahire, D.V.; Ahire, V.D.; Chkravarty, M.; Maity, S. Soil bulk density as related to soil texture, organic matter content and available total nutrients of Coimbatore soil. Int. J. Sci. Res. Publ. 2013, 3, 1–8. [Google Scholar]
- Zhou, L.; Feng, H.; Zhao, Y.; Qi, Z.; Zhang, T.; He, J.; Dyck, M. Drip irrigation lateral spacing and mulching affects the wetting pattern, shoot-root regulation, and yield of maize in a sand-layered soil. Agric. Water Manag. 2017, 184, 114–123. [Google Scholar] [CrossRef]
- Argyropoulos, C.; Tsiafouli, M.A.; Sgardelis, S.P.; Pantis, J.D. Organic farming without organic products. Land Use Policy 2013, 32, 324–328. [Google Scholar] [CrossRef]
- Benbrook, C.; McCullum-Gómez, C. Organic vs Conventional Farming. J. Am. Diet. Assoc. 2009, 109, 809. [Google Scholar] [CrossRef]
- Basso, A.S.; Miguez, F.E.; Laird, D.A.; Horton, R.; Westgate, M. Assessing potential of biochar for increasing water-holding capacity of sandy soils. Gcb Bioenergy 2013, 5, 132–143. [Google Scholar] [CrossRef]
- Barataud, F.; Aubry, C.; Wezel, A.; Mundler, P. Management of drinking water catchment areas in cooperation with agriculture and the specific role of organic farming. Experiences from Germany and France. Land Use Policy 2014, 36, 585–594. [Google Scholar] [CrossRef]
- Gao, F. Comparison of Microwave Drying and Conventional Drying of Coal. 2010. Available online: https://qspace.library.queensu.ca/handle/1974/6258 (accessed on 24 March 2020).
- Almahmood, H. Study of Some Physical and Chemical Characterizations of water from Southern Iraqi Marshlands after Rehabiliation/2003. Marsh Bull 2010, 1, 82–91. [Google Scholar]
- Peel, M.C.; Finlayson, B.L.; McMahon, T.A. Updated world map of the Köppen-Geiger climate classification. Hydrol. Earth Syst. Sci. Discuss. 2007, 4, 439–473. [Google Scholar] [CrossRef]
- Kroetsch, D.; Wang, C. Particle size distribution. Soil Sampl. Methods Anal. 2008, 2, 713–725. [Google Scholar]
- Katan, J.; DeVay, J.E. (Eds.) Soil Solarization; CRC Press: Boca Raton, FL, USA, 1991. [Google Scholar]
- Rozenberg, S.; Yahalom, A. A THz Slot Antenna Optimization Using Analytical Techniques. arXiv 2017, arXiv:1704.06564. [Google Scholar]
- Jackson, T.J. Effects of soil properties on microwave dielectric constants. Transp. Res. Board 1987, 126–131. [Google Scholar]
- Institute, S. Base SAS 9.4 Procedures Guide: Statistical Procedures; SAS Institute: Cary, NC, USA, 2017. [Google Scholar]
- Robinson, J.P.; Kingman, S.W.; Lester, E.H.; Yi, C. Microwave remediation of hydrocarbon-contaminated soils—Scale-up using batch reactors. Sep. Purif. Technol. 2012, 96, 12–19. [Google Scholar] [CrossRef]
- Cao, H.; Fan, D.; Jiao, X.; Huang, J.; Zhao, J.; Yan, B.; Zhou, W.; Zhang, W.; Ye, W.; Zhang, H. Importance of thickness in electromagnetic properties and gel characteristics of surimi during microwave heating. J. Food Eng. 2019, 248, 80–88. [Google Scholar] [CrossRef]
- Salema, A.A.; Yeow, Y.K.; Ishaque, K.; Ani, F.N.; Afzal, M.T.; Hassan, A. Dielectric properties and microwave heating of oil palm biomass and biochar. Ind. Crop Prod. 2013, 50, 366–374. [Google Scholar] [CrossRef]
- Krouzek, J.; Durdak, V.; Hendrych, J.; Masin, P.; Sobek, J.; Spacek, P. Pilot scale applications of microwave heating for soil remediation. Chem. Eng.-Process.-Process. Intensif. 2018, 130, 53–60. [Google Scholar] [CrossRef]
- Maharjan, G.R.; Prescher, A.-K.; Nendel, C.; Ewert, F.; Mboh, C.M.; Gaiser, T.; Seidel, S.J. Approaches to model the impact of tillage implements on soil physical and nutrient properties in different agro-ecosystem models. Soil Tillage Res. 2018, 180, 210–221. [Google Scholar] [CrossRef]
- Mahdavi, S.M.; Neyshabouri, M.R.; Fujimaki, H.; Heris, A.M. Coupled heat and moisture transfer and evaporation in mulched soils. CATENA 2017, 151, 34–48. [Google Scholar] [CrossRef]
- Mousa, N.; Farid, M. Microwave vacuum drying of banana slices. Dry. Technol. 2002, 20, 2055–2066. [Google Scholar] [CrossRef]
- Haynes, R.J.; Naidu, R. Influence of lime, fertilizer and manure applications on soil organic matter content and soil physical conditions: A review. Nutr. Cycl. Agroecosyst. 1998, 51, 123–137. [Google Scholar] [CrossRef]
- Jafari, H.; Kalantari, D.; Azadbakht, M. Energy consumption and qualitative evaluation of a continuous band microwave dryer for rice paddy drying. Energy 2018, 142, 647–654. [Google Scholar] [CrossRef]


© 2020 by the authors. Licensee MDPI, Basel, Switzerland. This article is an open access article distributed under the terms and conditions of the Creative Commons Attribution (CC BY) license (http://creativecommons.org/licenses/by/4.0/).