Investigation of Natural Beachrock and Physical–Mechanical Comparison with Artificial Beachrock Induced by MICP as a Protective Measure against Beach Erosion at Yogyakarta, Indonesia

 ,
,  ,
,
Abstract
:1. Introduction
2. Krakal–Sadranan Beachrock Characteristics
3. Materials and Methods
3.1. Drone Photogrammetric Data Processing
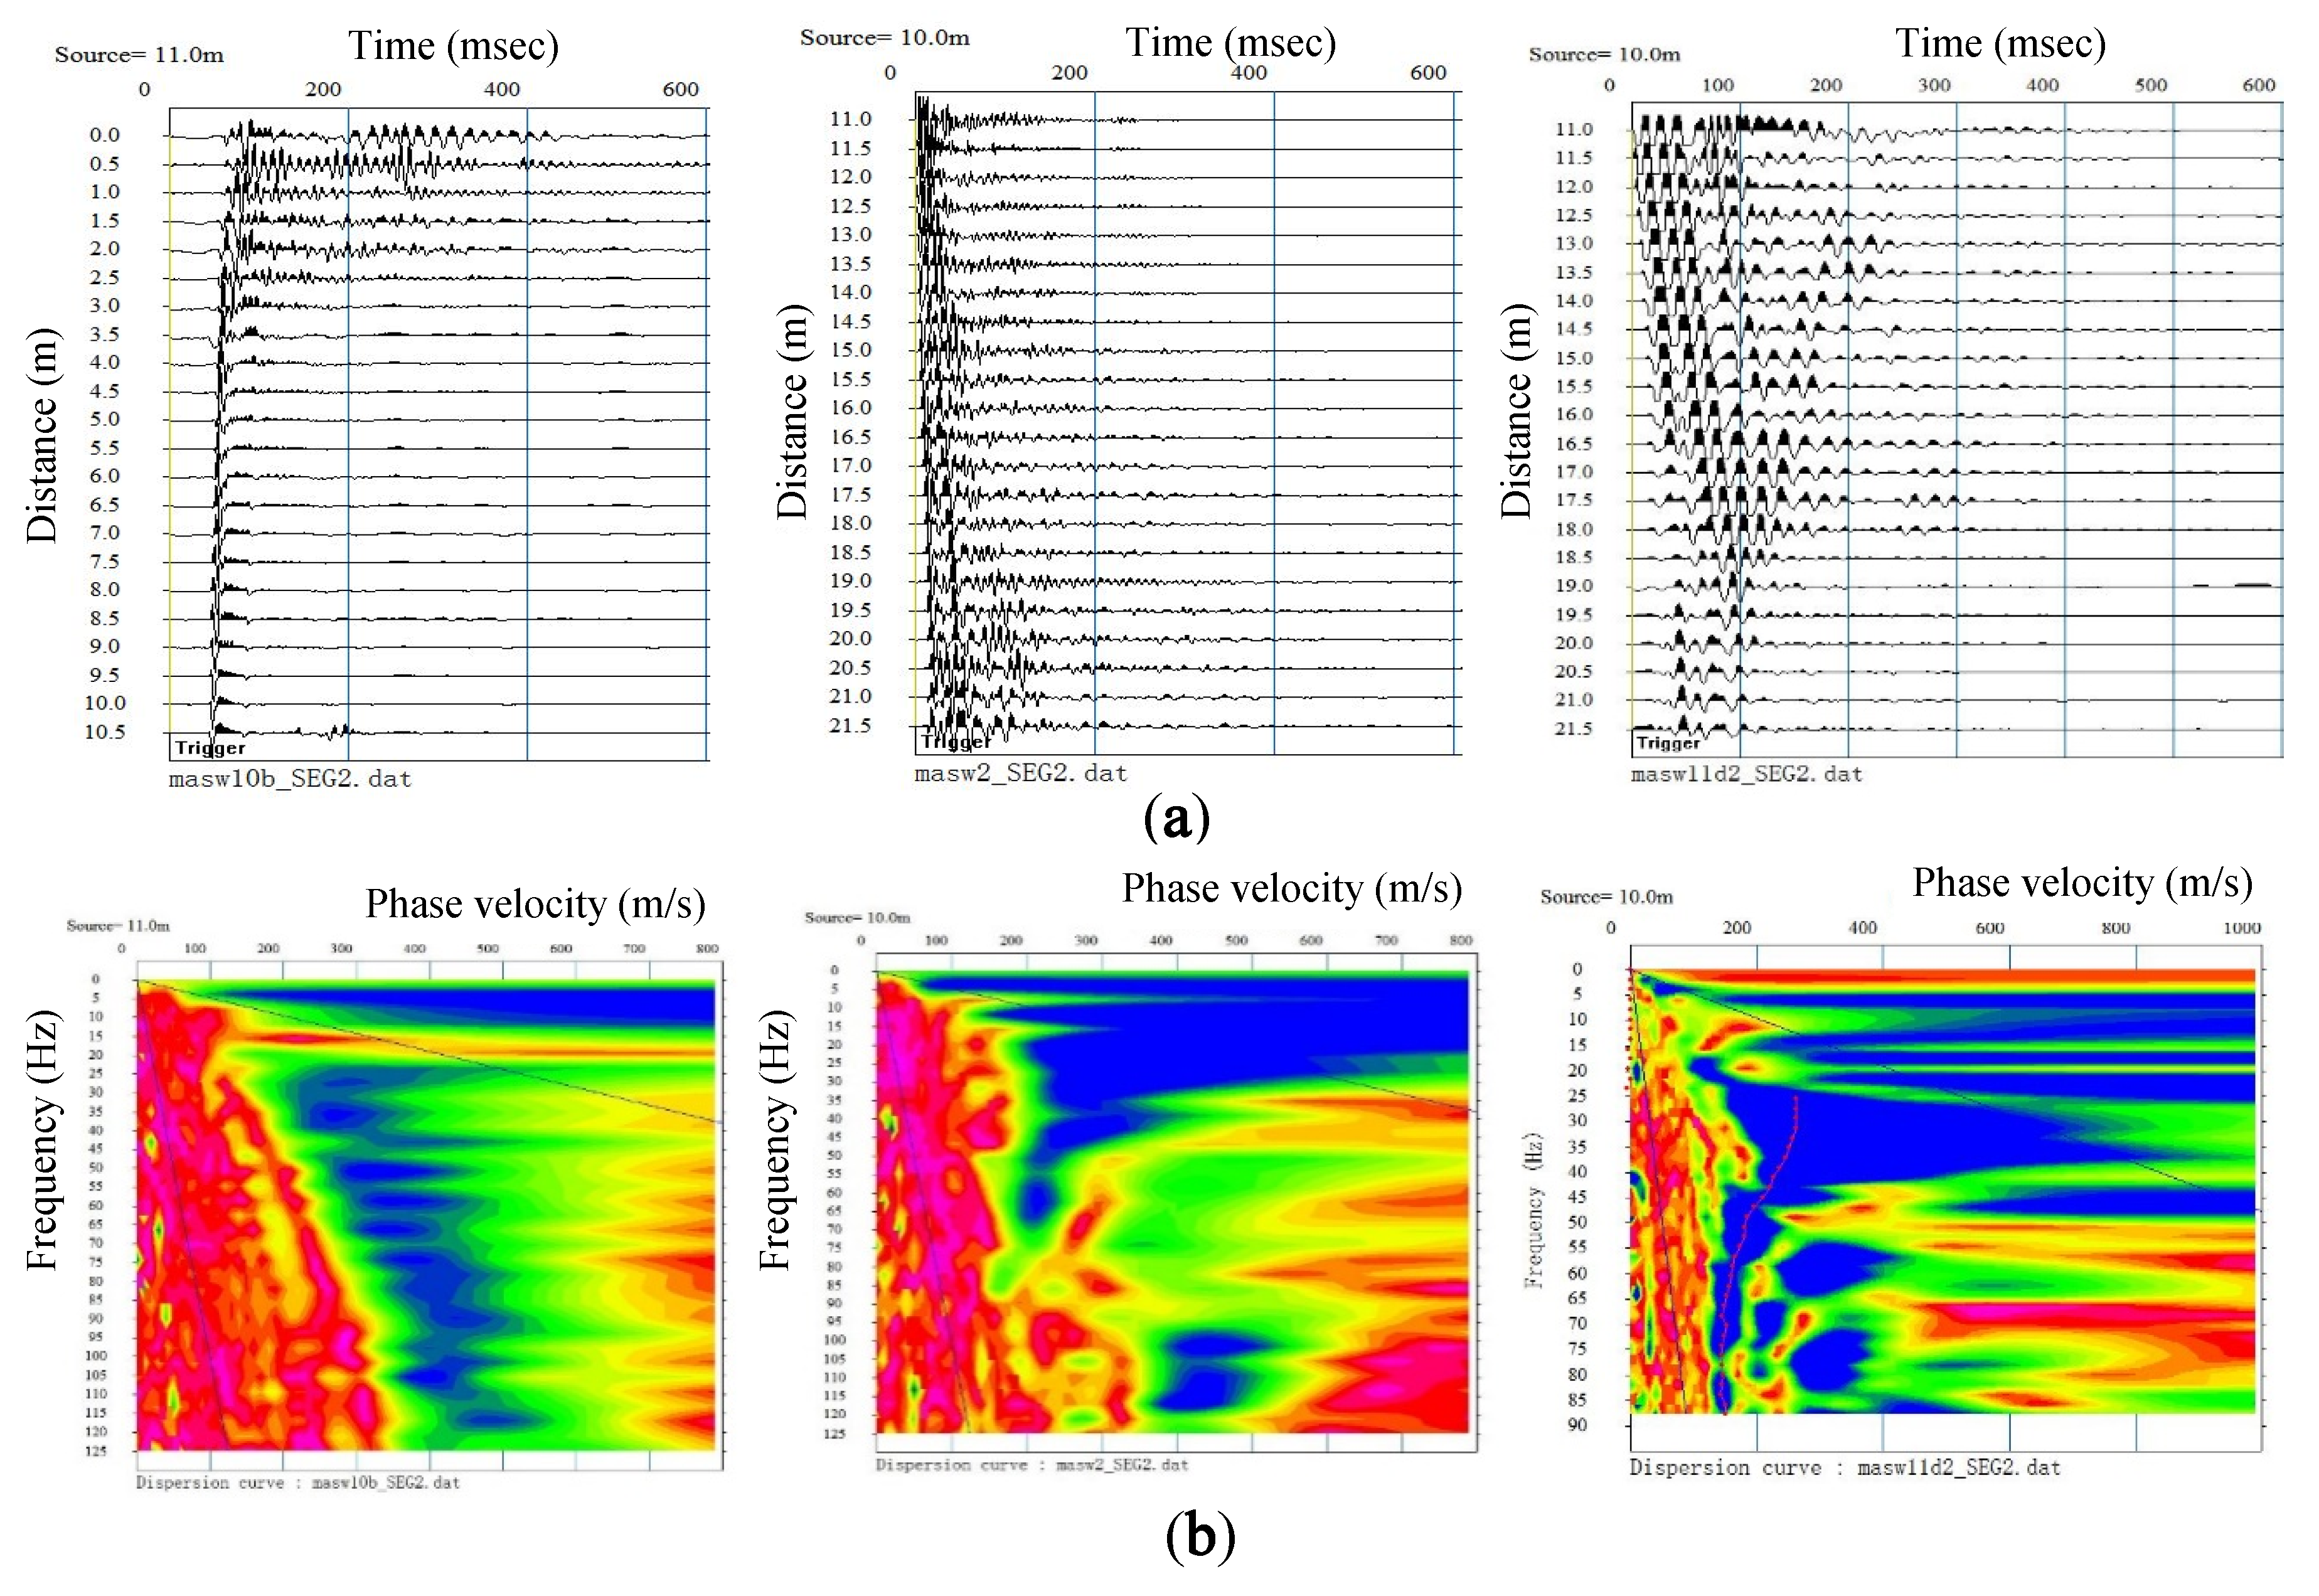
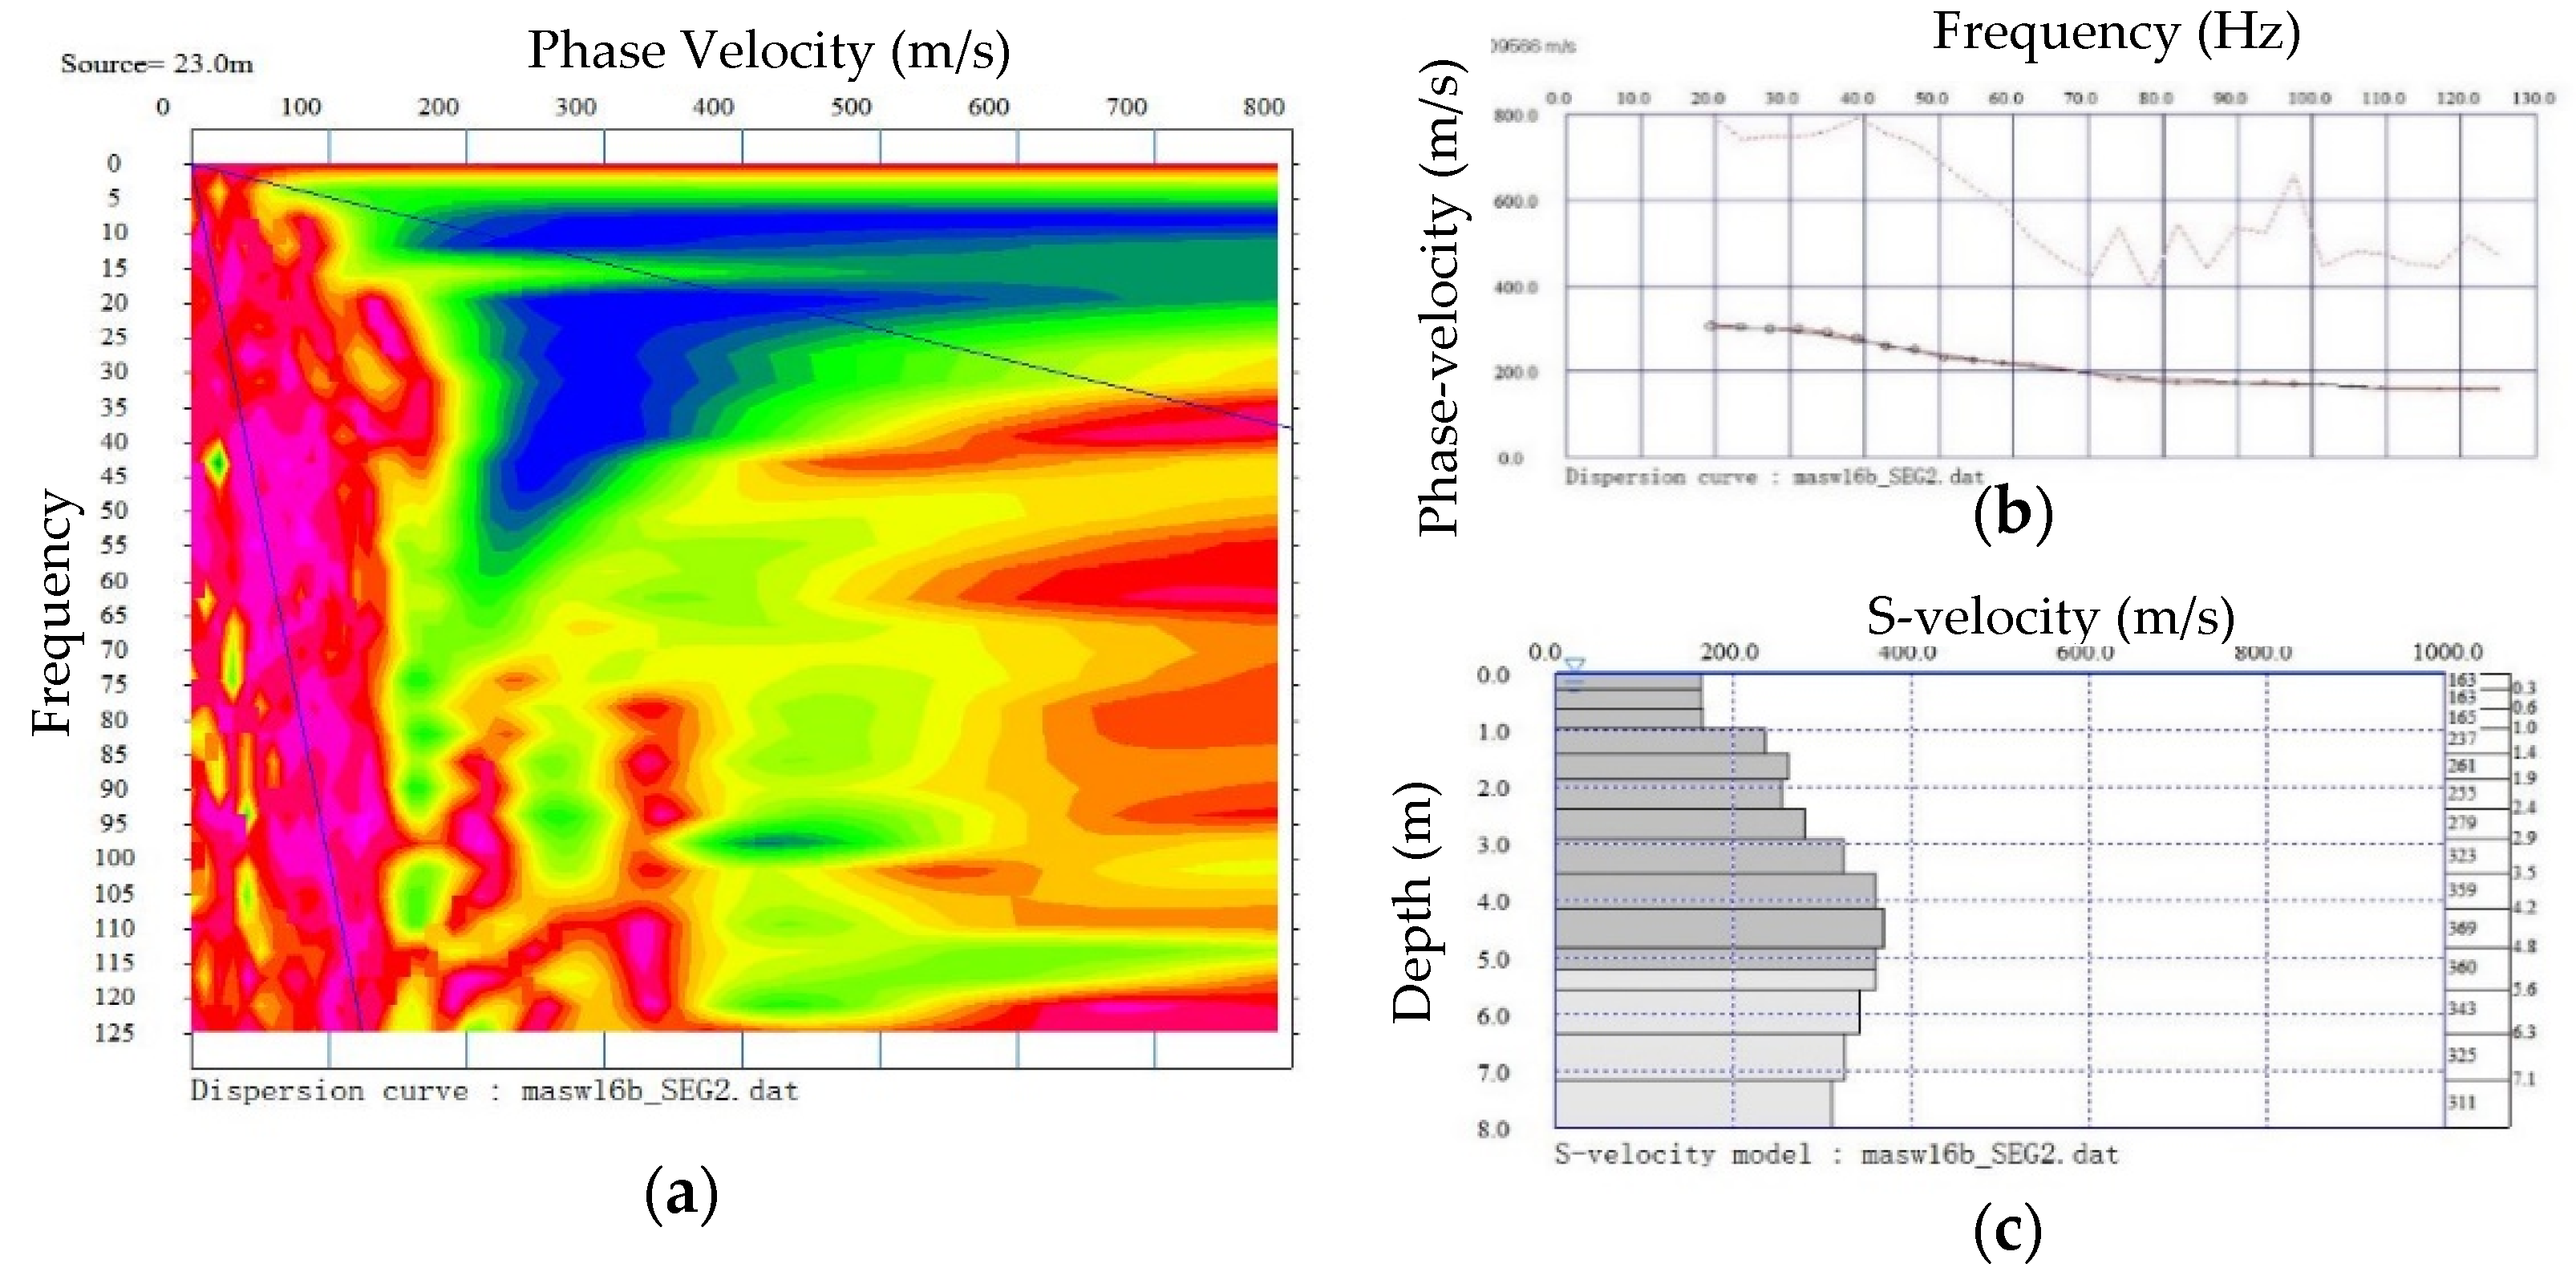
3.2. Multi Analysis of the Seismic Surface (MASW)
3.3. Physical Properties of Beachrock
3.4. Artificial Rock Development Based on Microbial Induced Carbonate Precipitation (MICP) Method
4. Results and Discussions
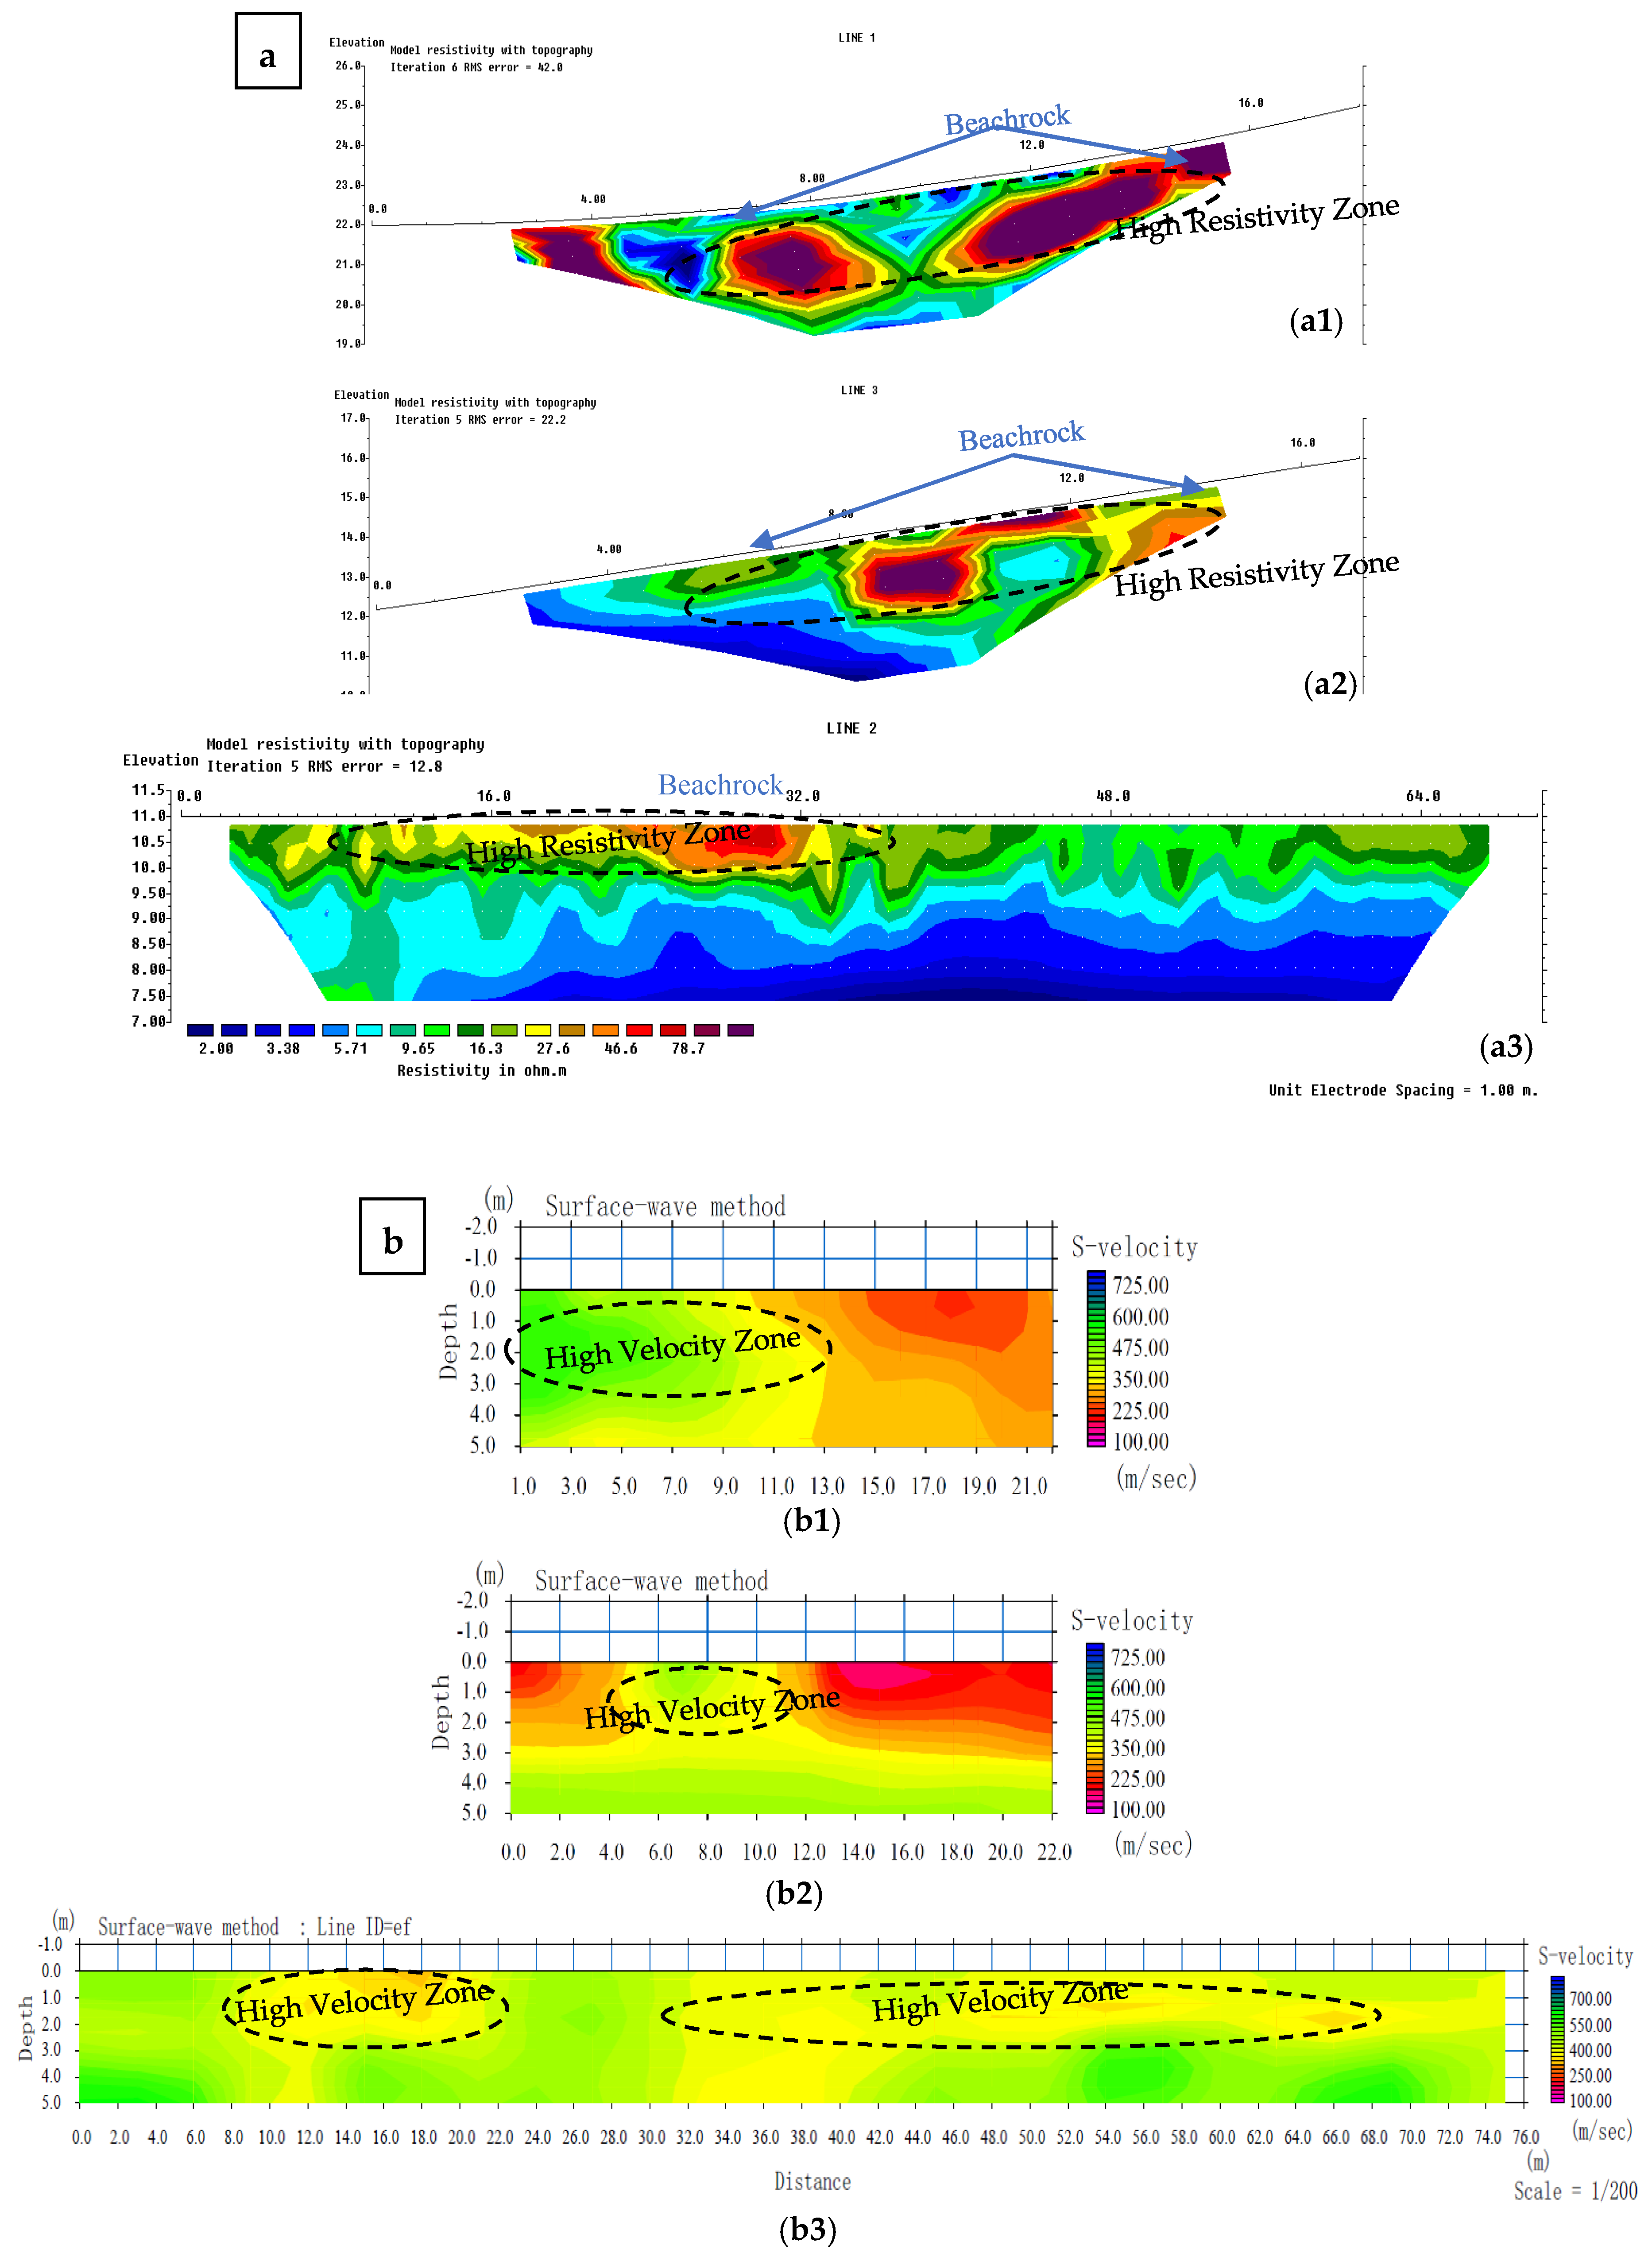
4.1. Geophysics Measurement
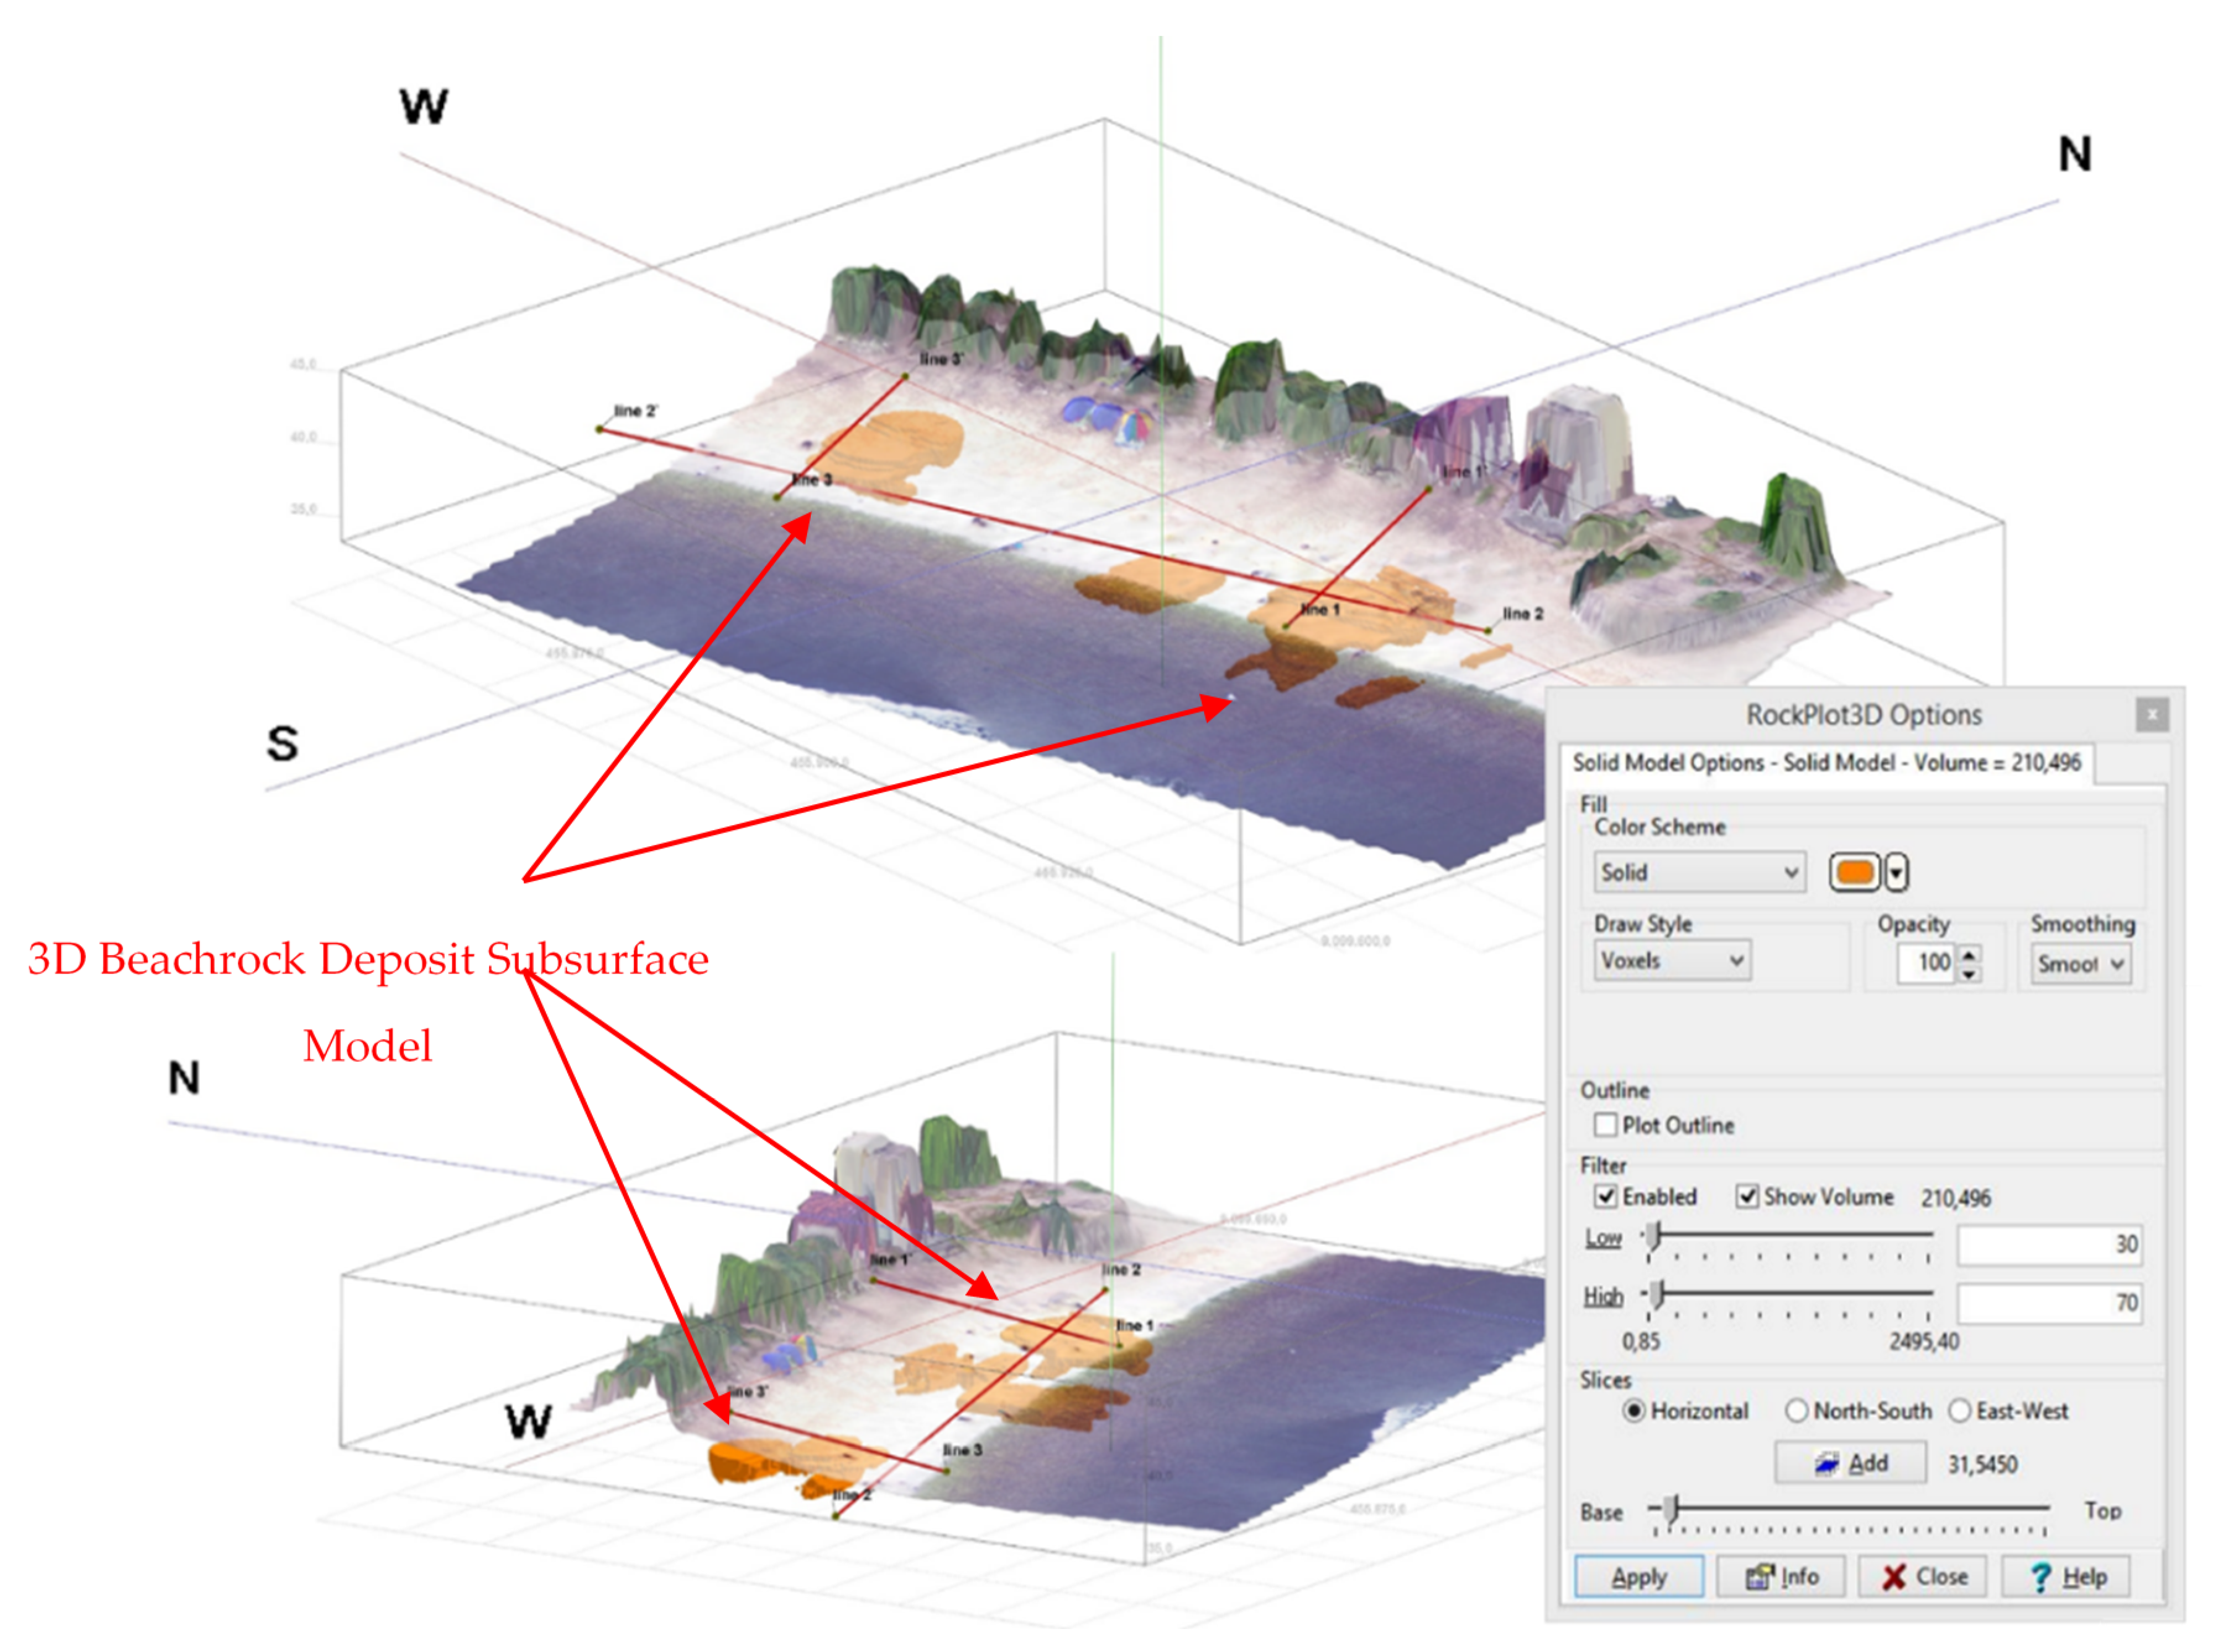
4.2. Three Dimensional of Subsurface Model
4.3. MICP of Artificial Rock Properties
5. Conclusions
- Beachrock found in this area were precipitated beneath beach sand, which is a wave erosional product, and then solidified beneath that formation, floating between limestone bedrock and beach sands formation, based on a greater value from resistivity and S-wave velocity in the formation layers.
- Resistivity, thickness, and S-wave velocity of the beachrock increases as it gets closer to the coastline. The maximum thickness of the beachrock at this point is about 1 m based on calculations; the α-section covers 210.496 m3, while the β-section covers 76,936 m3 of beachrock deposit.
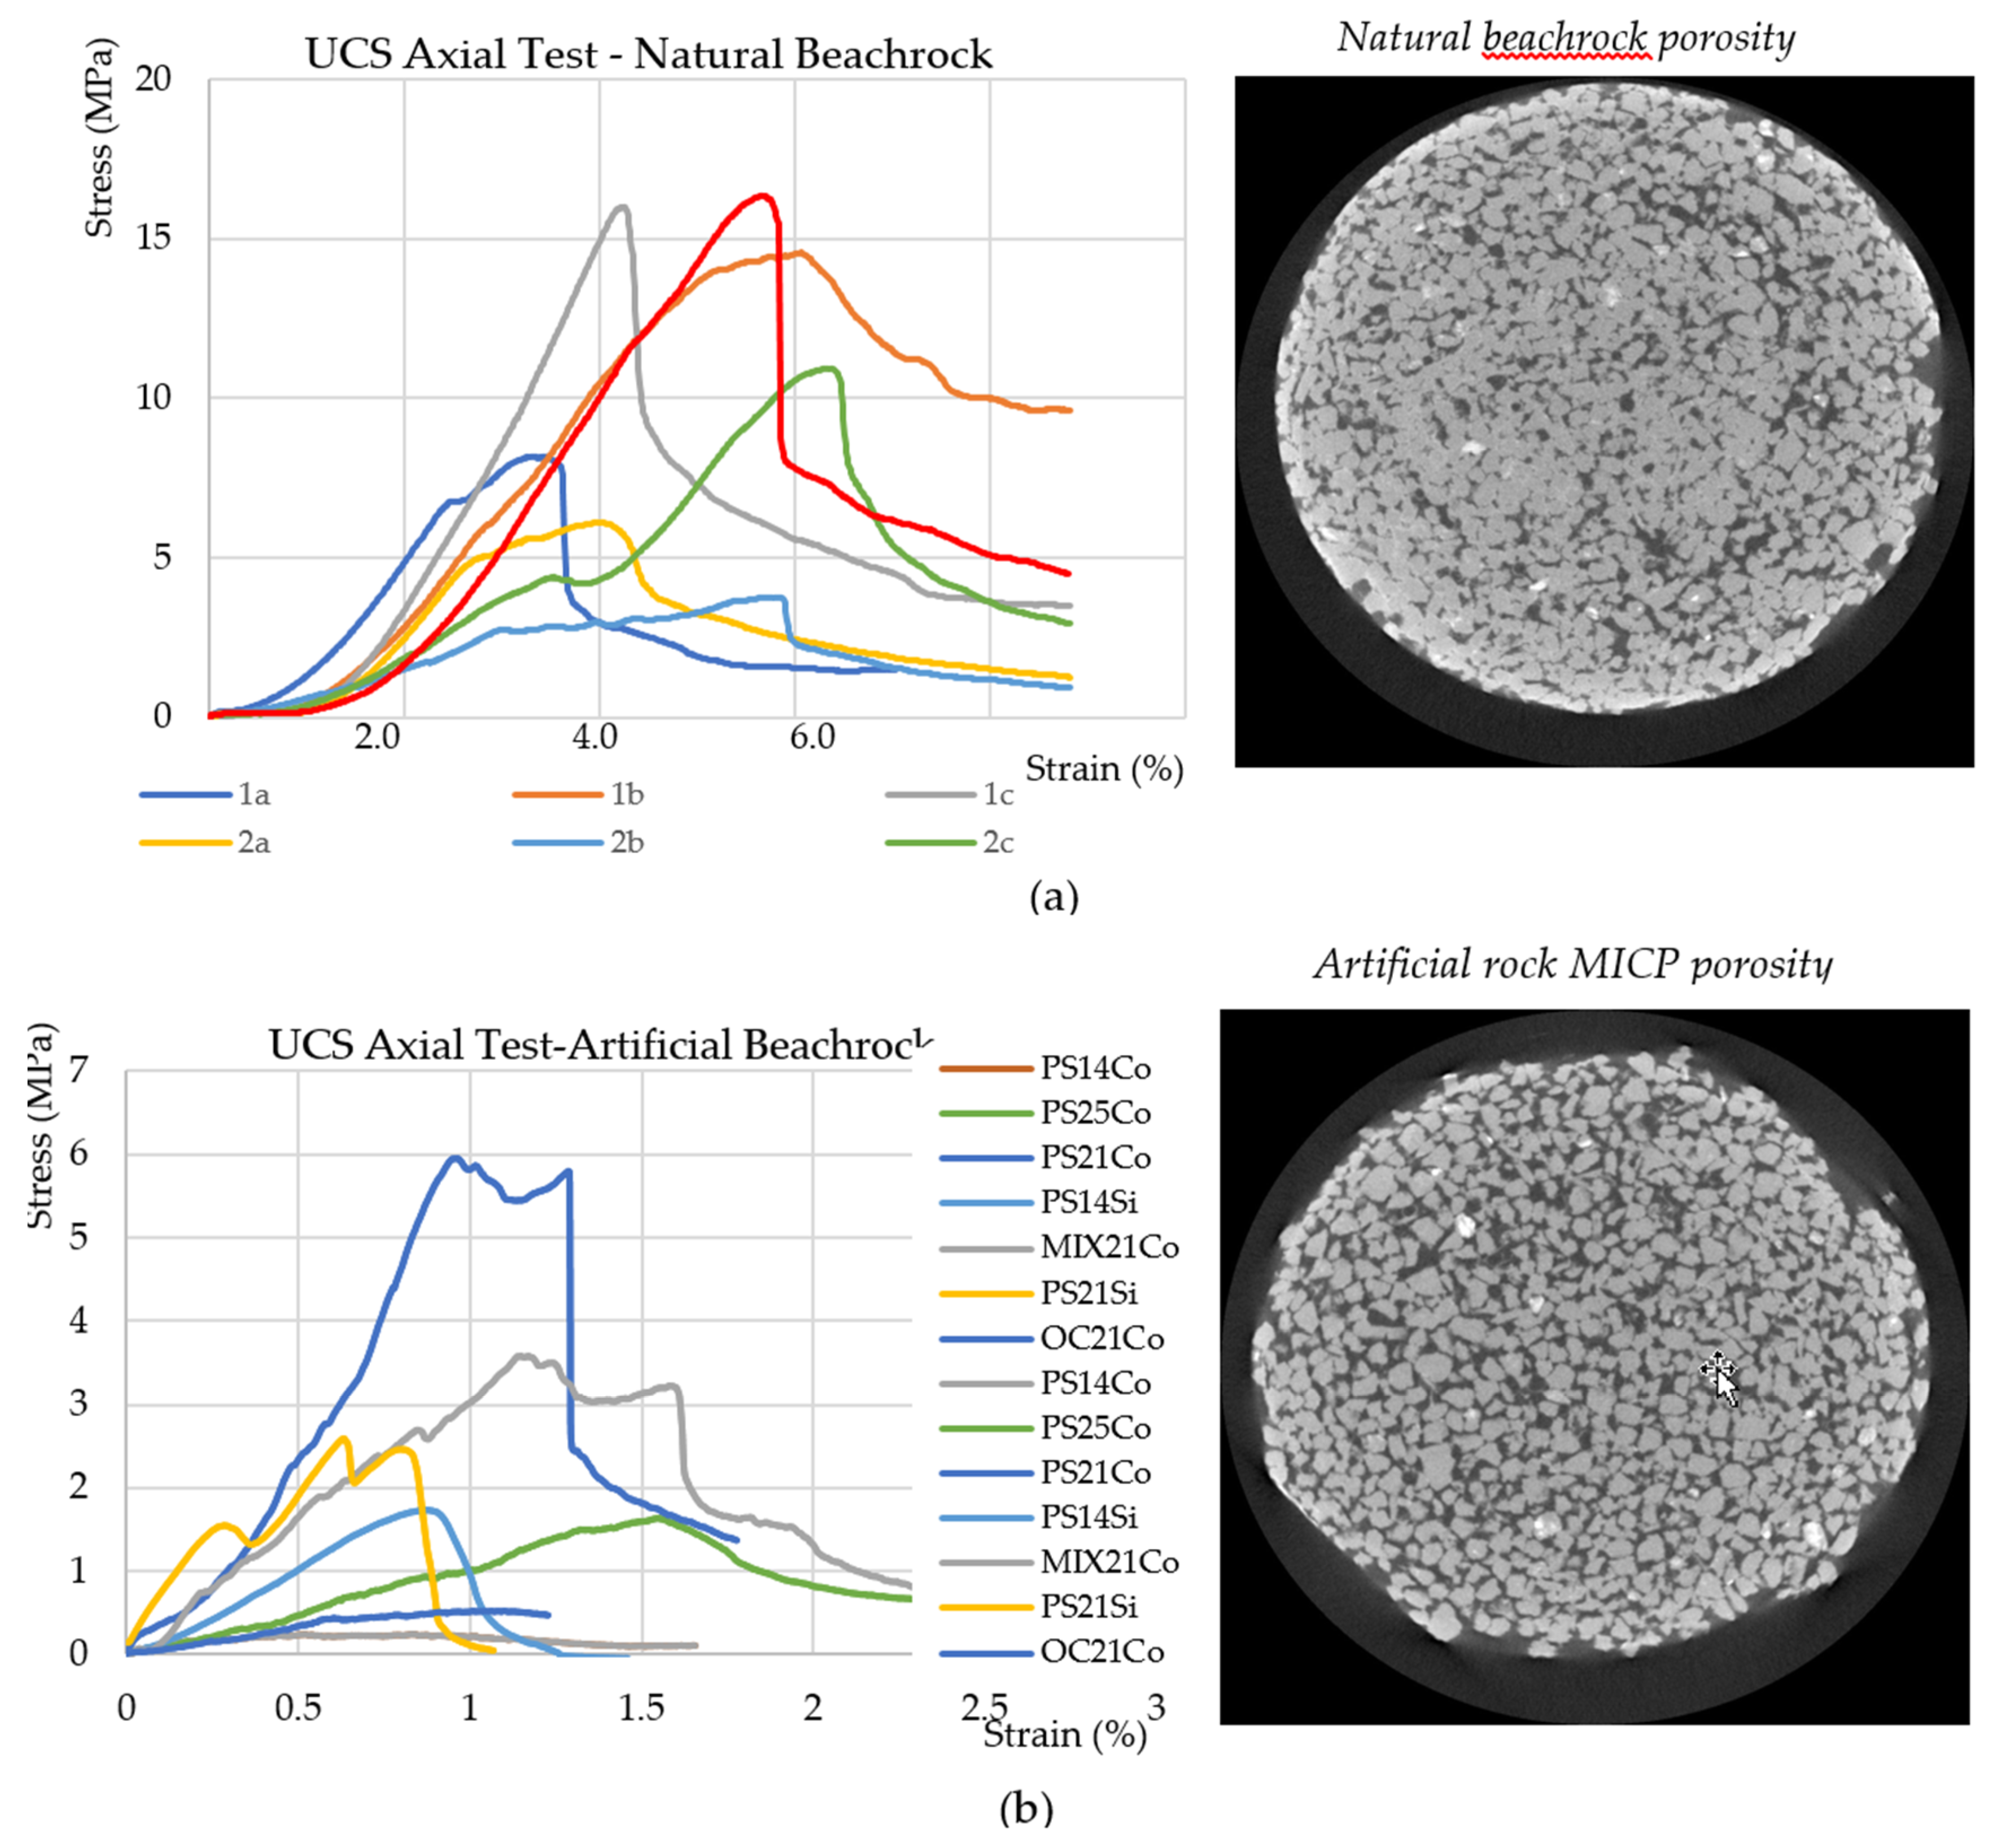
- Natural beachrock and artificial beachrocks bore similar results following the MICP process examining properties, such as chemical compounds, meniscus carbonate bridges, and rock properties. However, the strength and porosity of artificial bedrocks were significantly different from those of natural beachrocks, which intensified the carbonate precipitation processes.
- Therefore, the sufficient immersion and evaporation of seawater is an important condition for the solidification of sand to form beachrock.
Supplementary Materials
Author Contributions
Funding
Acknowledgments
Conflicts of Interest
References
- Zhang, K.; Douglas, B.C.; Leatherman, S.P. Global warming and coastal erosion. Clim. Chang. 2004, 64, 41. [Google Scholar] [CrossRef]
- Bruun, P. Sea-level rise as a cause of shore erosion. J. Waterw. Harb. Div. 1962, 88, 117–130. [Google Scholar]
- Rey, D.; Rubio, B.; Bernabeu, A.M.; Vilas, F. Formation, exposure, and evolution of a high-latitude beachrock in the intertidal zone of the Corrubedo complex (Ria de Arousa, Galicia, NW Spain). Sediment. Geol. 2004, 169, 93–105. [Google Scholar] [CrossRef]
- David, P.; Panagiotis, T.; Konstantinos, A. Electrical resistivity tomography mapping of beachrocks: Application to the island of Thassos (N. Greece). Environ. Earth Sci. 2009, 59, 233. [Google Scholar] [CrossRef]
- Kubo, R.; Kawasaki, S.; Suzuki, K.; Yamaguchi, S.; Hata, T. Beachrock mapping by geophysical exploration: Application to Yagaji Island in Okinawa, Japan. In Rock Mechanics for Resources, Energy and Environment; Taylor and Francis Group: London, UK, 2013; p. 299. [Google Scholar]
- Ranasinghe, R.; Callaghan, D.; Stive, M.J. Estimating coastal recession due to sea level rise: Beyond the Bruun rule. Clim. Chang. 2012, 110, 561–574. [Google Scholar] [CrossRef] [Green Version]
- Trenhaile, A.S. Modeling the development of wave-cut shore platforms. Mar. Geol. 2000, 166, 163–178. [Google Scholar] [CrossRef]
- Daryono, L.; Titisari, A.D.; Warmada, I.; Kawasaki, S. Identification Differences Cementation Beachrock Formation Based On Petrography Analysis between Sadranan, Yogyakarta, Indonesia–Sumuide, Okinawa, Japan; Bulletin of Engingeering Geology and the Environment; Springer: Basel, Switzerland, 2018. [Google Scholar]
- Daryono, L.R.; Nakashima, K.; Kawasaki, S.; Titisari, A.D.; Barianto, D.H. Sediment Characteristics of Beachrock: A Baseline Investigation Based on Microbial Induced Carbonate Precipitation at Krakal-Sadranan Beach, Yogyakarta, Indonesia. Appl. Sci. 2020, 10, 520. [Google Scholar] [CrossRef] [Green Version]
- Russell, R.J.; McIntire, W.G. Beach cusps. Geol. Soc. Am. Bull. 1965, 76, 307–320. [Google Scholar] [CrossRef]
- Vousdoukas, M.I.; Velegrakis, A.F.; Plomaritis, T.A. Beachrock occurrence, characteristics, formation mechanisms and impacts. Earth-Sci. Rev. 2007, 85, 23–46. [Google Scholar] [CrossRef]
- McLean, R. Beach Rockin the Encyclopedia of Modern Coral Reefs: Structure, Form and Process; Springer: Amsterdam, The Netherland, 2011; 1236p. [Google Scholar]
- Avcioğlu, M.; Yiğitbaş, E.; Erginal, A.E. Beachrock formation on the coast of Gökçeada Island and its relation to the active tectonics of the region, northern Aegean Sea, Turkey. Quaternary Int. 2016, 401, 141–152. [Google Scholar] [CrossRef]
- Steers, J.A. The Queensland coast and the Great Barrier reefs. Geogr. J. 1929, 74, 232–257. [Google Scholar] [CrossRef]
- Hasegawa, H. Presence of Batrachonema synaptospicula Yuen, 1965 (Nematoda: Nicollinidae) in Okinawa, Japan. J. Parasitol. 1987, 73, 1048–1050. [Google Scholar] [CrossRef]
- Ogasawara, H.; Yoshidomi, K.; Jiju, K. Beachrock in Sosogi coast, Wajima, Noto peninsula, Japan. In Proceedings of the JSEG Tyugoku-Shikoku Meeting, Tottori, Japan, 19–20 November 2004; pp. 31–34. [Google Scholar]
- Danjo, T.; Kawasaki, S. Characteristics of beachrocks: A review. Geotech. Geol. Eng. 2014, 32, 215–246. [Google Scholar] [CrossRef]
- Suzuki, K.; Kawasaki, S.; Kubo, R.; Yamaguchi, S.; Hata, T. Geological structure of beachrock using electrical resistivity and surface wave surveys—Application to the coastal area of Yagaji Island in Nago-shi, Okinawa, Japan. Geophys. Explor. 2013, 66, 277–285. [Google Scholar]
- Brown, D.G.; Arbogast, A.F. Digital photogrammetric change analysis as applied to active coastal dunes in Michigan. Journal of Photogrammetric Engineering and Remote Sensing 1999, 65, 467–474. [Google Scholar]
- Varela-González, M.; González-Jorge, H.; Riveiro, B.; Arias, P. Performance testing of LiDAR exploitation software. Comput. Geosci. 2013, 54, 122–129. [Google Scholar] [CrossRef]
- Telford, W.M.; Telford, W.M.; Geldart, L.P.; Sheriff, R.E.; Sheriff, R.E. Applied Geophysics; Cambridge University Press: Cambridge, UK, 1990; Volume 1. [Google Scholar]
- Burger, H.R. Exploration Geophysics of the Shallow Subsurface; Prentice Hall: Upper Saddle River, NJ, USA, 1996; 489p. [Google Scholar]
- Park, C.B.; Miller, R.D.; Xia, J.; Hunter, J.A.; Harris, J.B. Higher mode observation by the MASW method. In SEG Technical Program Expanded Abstracts; Society of Exploration Geophysicists: Oklahoma, OK, USA, 1999; pp. 524–527. [Google Scholar]
- Park, C.B.; Miller, R.D. MASW to map shear-wave velocity of soil. In Kansas Geological Survey Open File Report; Library of Congress: Washington, DC, USA, 2004; Volume 30, p. 2004. [Google Scholar]
- Park, C.B.; Miller, R.D. Roadside passive multichannel analysis of surface waves (MASW). J. Environ. Eng. Geophys. 2008, 13, 1–11. [Google Scholar] [CrossRef] [Green Version]
- Srbulov, M. Geotechnical Earthquake Engineering: Simplified Analyses with Case Studies and Examples; Springer Science & Business Media: Berlin, Germany, 2008; Volume 9. [Google Scholar]
- Hartantyo, E.; Brotopuspito, K.S.; Sismanto; Waluyo. Predicting the liquefaction phenomena from shear velocity profiling: Empirical approach to 6.3 Mw, May 2006 Yogyakarta earthquake. In AIP Conference Proceedings; AIP Publishing: Melville , NY, USA, 2015; Volume 1658, p. 030017. [Google Scholar]
- Montoya, B.M.; DeJong, J.T. Stress-strain behavior of sands cemented by microbially induced calcite precipitation. J. Geotech. Geoenvironmental Eng. 2015, 141, 04015019. [Google Scholar] [CrossRef]
- Feng, K.; Montoya, B.M. Quantifying level of microbial-induced cementation for cyclically loaded sand. J. Geotech. Geoenvironmental Eng. 2017, 143, 06017005. [Google Scholar] [CrossRef]
- Whiffin, V.S. Microbial CaCO3 Precipitation for the Production of Biocement. Ph.D. Thesis, Murdoch University, Perth, Australia, 2004. [Google Scholar]
- Daryono, L.R. Comparison of Natural Beachrock and Anthropogenic Beachrock, Case Study: Okinawa-Jima, Japan. Master’s Thesis, Universitas Gadjah Mada, Yogyakarta, Indonesia, 2017. [Google Scholar]
- Cheng, L.; Cord-Ruwisch, R. Upscaling effects of soil improvement by microbially induced calcite precipitation by surface percolation. Geomicrobiol. J. 2014, 31, 396–406. [Google Scholar] [CrossRef] [Green Version]
- Weil, M.H.; DeJong, J.T.; Martinez, B.C.; Mortensen, B.M.; Waller, J.T. Seismic and resistivity measurements for real-time monitoring of microbially induced calcite precipitation in sand. Astm Geotech. Test J. 2012, 35, 1–12. [Google Scholar]
- Phillips, A.J.; Eldring, J.J.; Hiebert, R.; Lauchnor, E.; Mitchell, A.C.; Cunningham, A.; Spangler, L.; Gerlach, R. Design of a meso-scale high pressure vessel for the laboratory examination of biogeochemical subsurface processes. J. Pet. Sci. Eng. 2015, 126, 55–62. [Google Scholar] [CrossRef] [Green Version]
- Mortensen, B.M.; Haber, M.J.; DeJong, J.T.; Caslake, L.F.; Nelson, D.C. Effects of environmental factors on microbial induced calcium carbonate precipitation. J. Appl. Microbiol. 2011, 111, 338–349. [Google Scholar] [CrossRef] [PubMed]

| Sample | Japan Beachrock | Indonesia Beachrock | ||||||||
|---|---|---|---|---|---|---|---|---|---|---|
| OK-A | OK-B | OK-C | OK-D | 1-A | 1-B | 1-C | 2-A | 2-B | 2-C | |
| Saturated density (g/cm3) | 2.06 | 1.97 | 2.49 | 2.27 | 1.84 | 1.92 | 1.84 | 1.80 | 1.69 | 1.81 |
| Porosity (%) | 11.1 | 25.4 | 3.7 | 27 | 10 | 12 | 11 | 14 | 14 | 13 |
| One axis compressive strength (MPa) | 11.14 | 19.91 | 31.11 | - | 7.87 | 14.47 | 15.89 | 6.07 | 3.717 | 10.77 |
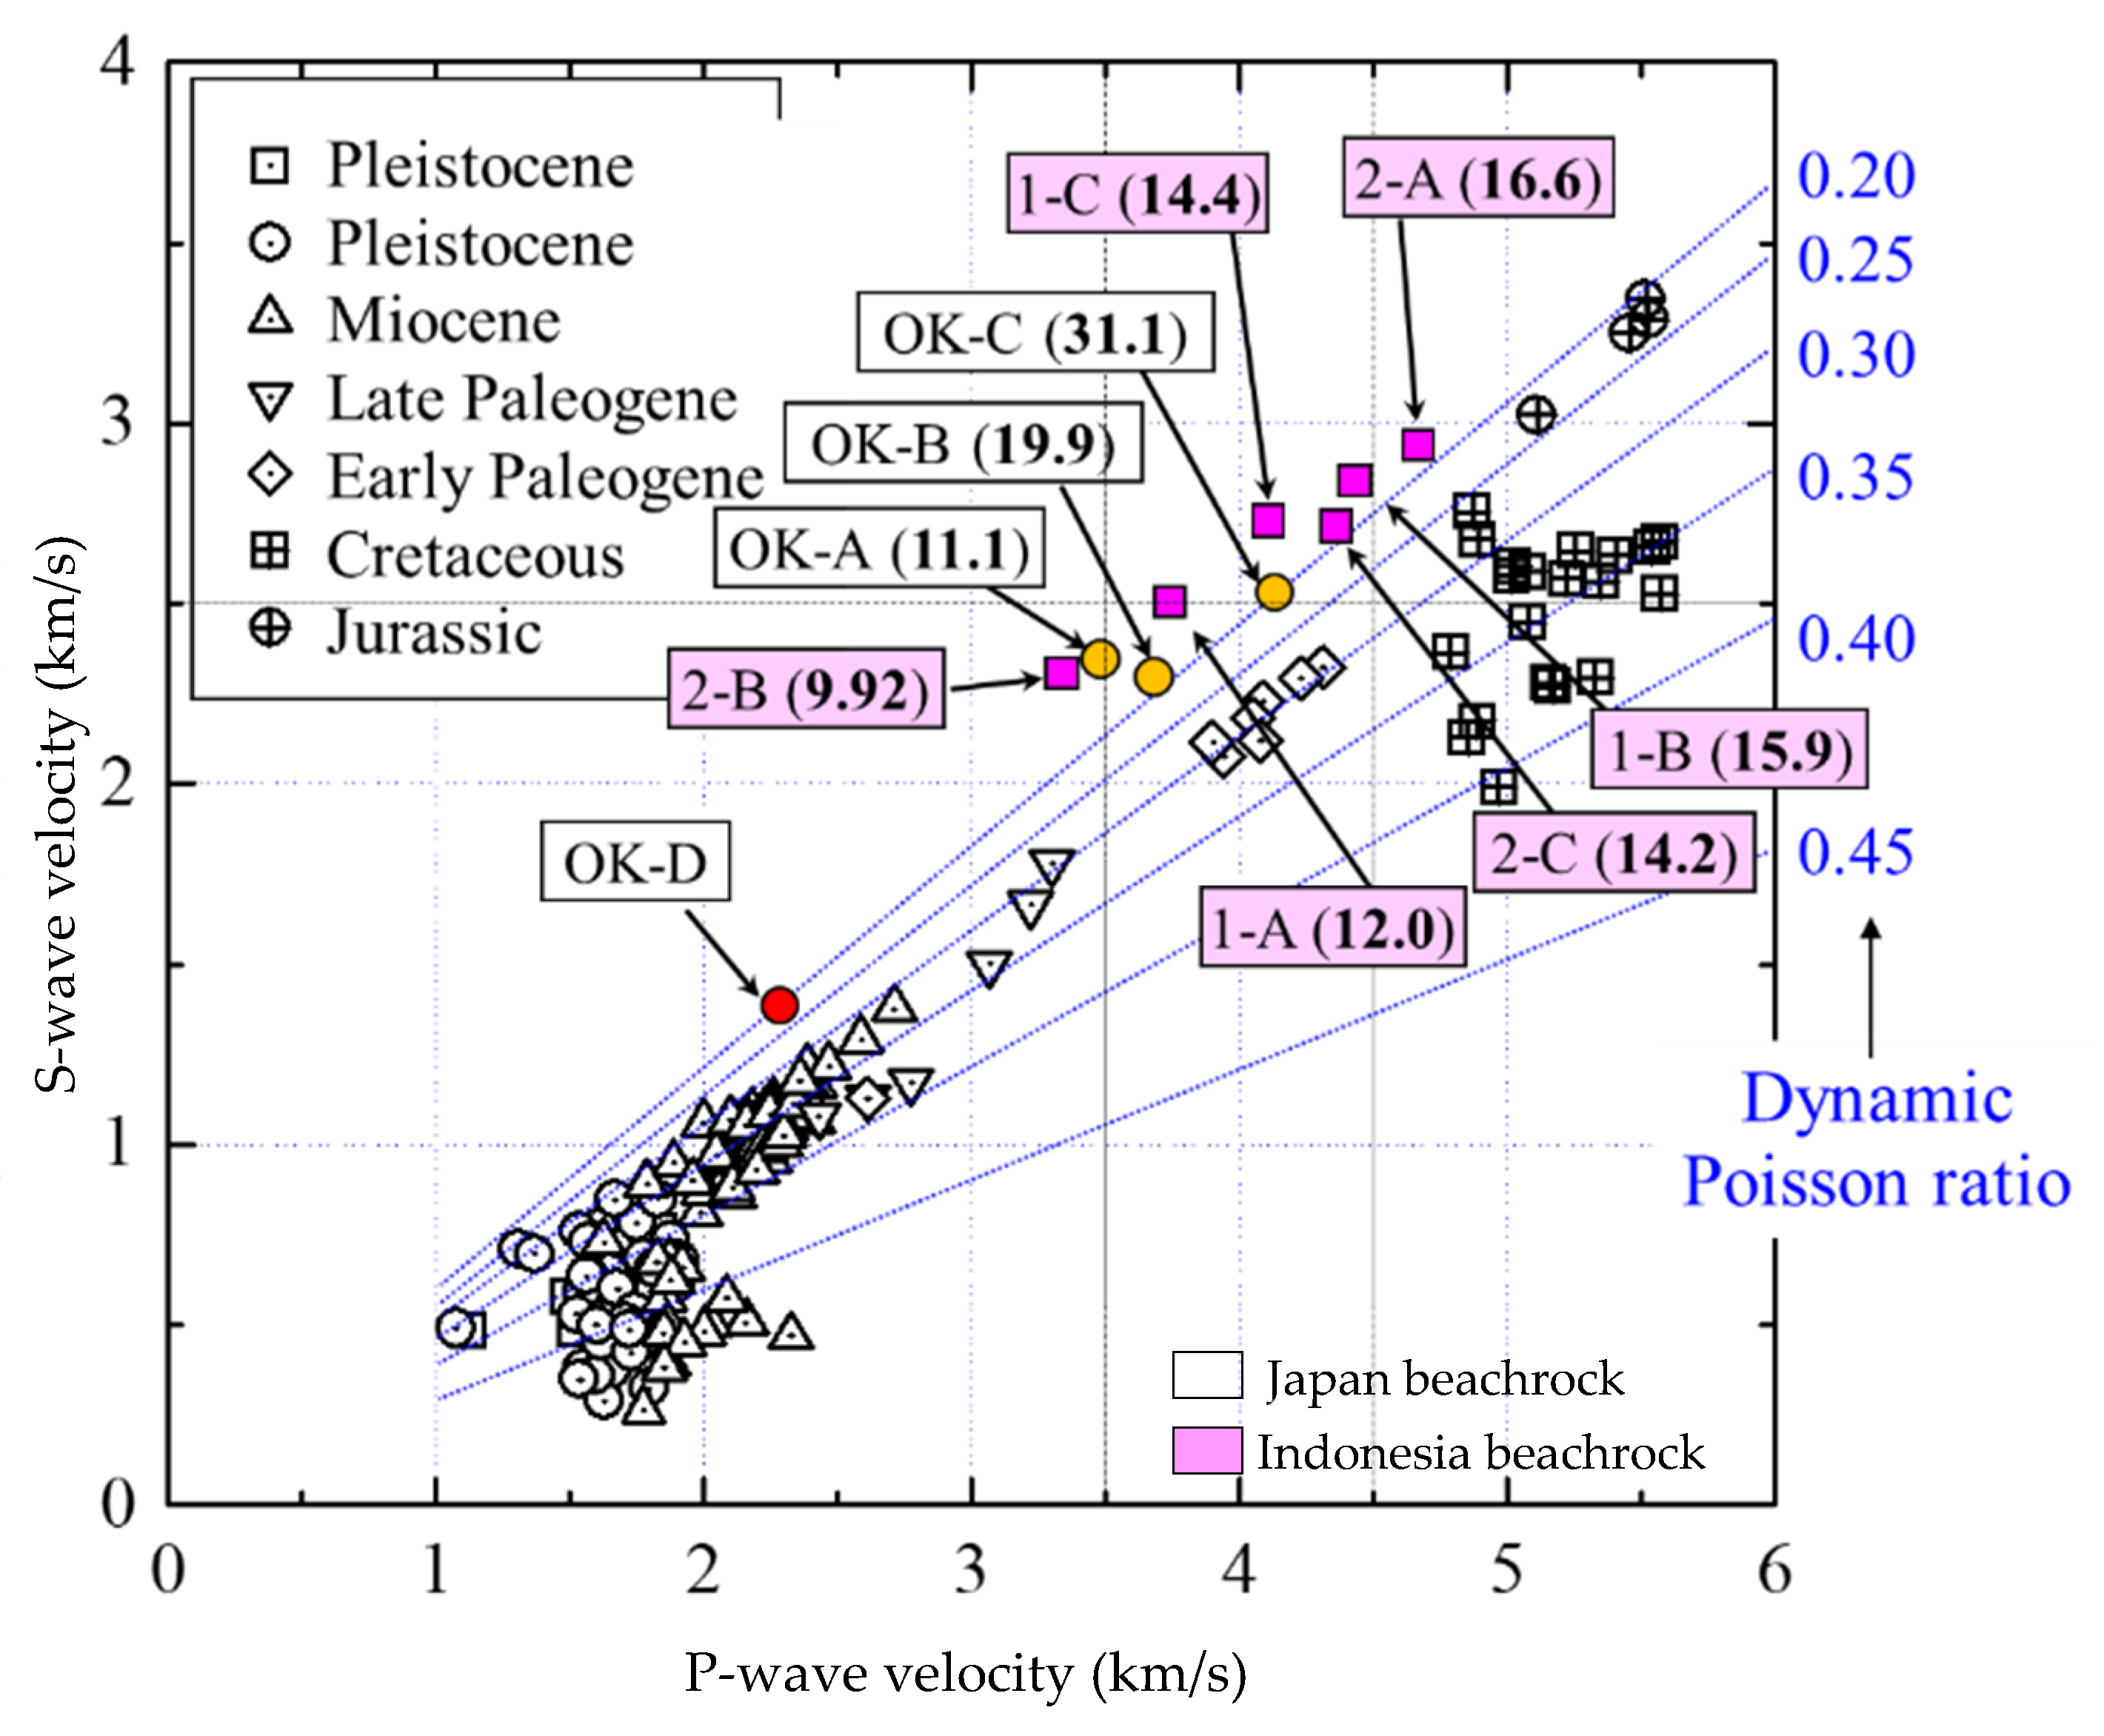
| P-wave velocity (km/s) | 3.50 | 3.69 | 4.07 | 2.29 | 3.76 | 4.41 | 4.06 | 4.66 | 3.85 | 4.35 |
| S-wave velocity (km/s) | 2.34 | 2.31 | 2.51 | 1.33 | 2.49 | 2.79 | 2.79 | 2.92 | 2.33 | 2.70 |
| Dynamic Poisson ratio | 0.096 | 0.178 | 0.193 | 0.245 | 0.11 | 0.16 | 0.09 | 0.18 | 0.21 | 0.19 |
| Geological age (vBP) | 1370 | 1250 | 2300 | - | - | - | - | - | - | - |
| Reagent | Content (g/L) |
|---|---|
| Nutrient broth | 3.0 |
| NH4Cl | 10.0 |
| NaHCO3 | 2.12 |
| Urea, Co(NH2)2 | 18.02 |
| CaCl2 | 33.3 |
| Sample | Sand Type | Saturated Density (g/cm3) | Porosity (%) | Expectation Strength (MPa) | P-Wave Velocity (km/s) | S-Wave Velocity (km/s) | Dynamic Poisson Ratio |
|---|---|---|---|---|---|---|---|
| VB-14 Unsaturated | Quartz Silica Sands | 1.60 | 37% | 1.01 | 1.12 | 0.77 | 0.05 |
| PS-14 Unsaturated | 1.63 | 34% | 2.33 | 1.20 | 0.84 | 0.01 | |
| MIX-14 | 1.56 | 30% | 1.48 | 0.97 | 0.68 | 0.02 | |
| OC-21 | 1.56 | 38% | 0.54 | 0.82 | 0.57 | 0.05 | |
| PS-14 | 1.53 | 30% | 1.57 | 0.73 | 0.51 | 0.04 | |
| MIX-21 | 1.65 | 29% | 3.19 | 1.00 | 0.69 | 0.06 | |
| PS-21 | 1.81 | 24% | 3.73 | 1.78 | 1.24 | 0.02 | |
| PS-14 Unsaturated | Coarse Limestone Sand | 1.42 | 32% | 2.40 | 1.31 | 0.88 | 0.09 |
| PS-21 Unsaturated | 1.74 | 28% | 5.79 | 1.82 | 1.27 | 0.03 | |
| MIX-21 | 1.66 | 33% | 3.20 | 1.94 | 1.33 | 0.05 | |
| OC-21 | 1.58 | 43% | 1.78 | 1.07 | 0.72 | 0.07 | |
| PS-25 | 1.63 | 26% | 1.39 | 1.68 | 1.13 | 0.09 | |
| PS-14 | 1.46 | 31% | 1.58 | 1.04 | 0.73 | 0.01 | |
| PS-21 | 1.60 | 29% | 2.46 | 1.48 | 1.01 | 0.07 |
© 2020 by the authors. Licensee MDPI, Basel, Switzerland. This article is an open access article distributed under the terms and conditions of the Creative Commons Attribution (CC BY) license (http://creativecommons.org/licenses/by/4.0/).
Share and Cite
Daryono, L.R.; Nakashima, K.; Kawasaki, S.; Suzuki, K.; Suyanto, I.; Rahmadi, A. Investigation of Natural Beachrock and Physical–Mechanical Comparison with Artificial Beachrock Induced by MICP as a Protective Measure against Beach Erosion at Yogyakarta, Indonesia. Geosciences 2020, 10, 143. https://doi.org/10.3390/geosciences10040143
Daryono LR, Nakashima K, Kawasaki S, Suzuki K, Suyanto I, Rahmadi A. Investigation of Natural Beachrock and Physical–Mechanical Comparison with Artificial Beachrock Induced by MICP as a Protective Measure against Beach Erosion at Yogyakarta, Indonesia. Geosciences. 2020; 10(4):143. https://doi.org/10.3390/geosciences10040143
Chicago/Turabian StyleDaryono, Lutfian R., Kazunori Nakashima, Satoru Kawasaki, Koichi Suzuki, Imam Suyanto, and Arief Rahmadi. 2020. "Investigation of Natural Beachrock and Physical–Mechanical Comparison with Artificial Beachrock Induced by MICP as a Protective Measure against Beach Erosion at Yogyakarta, Indonesia" Geosciences 10, no. 4: 143. https://doi.org/10.3390/geosciences10040143
APA StyleDaryono, L. R., Nakashima, K., Kawasaki, S., Suzuki, K., Suyanto, I., & Rahmadi, A. (2020). Investigation of Natural Beachrock and Physical–Mechanical Comparison with Artificial Beachrock Induced by MICP as a Protective Measure against Beach Erosion at Yogyakarta, Indonesia. Geosciences, 10(4), 143. https://doi.org/10.3390/geosciences10040143